

One of the many releases at OpenAI's Dev Day was the introduction of GPT-4 Vision or GPT-4V. As the documentation highlights:
Historically, language model systems have been limited by taking in a single input modality, text.
GPT-4V is a multimodal model that can take in both images and text and answer questions about them.
While there are many use cases of vision, in this article we'll focus on using it for data analysis, specifically analyzing and interpreting charts and graphs.
For this tool, we'll build a simple fronted using Streamlit that allows users to input either URLs of images of upload one or more images for analysis.
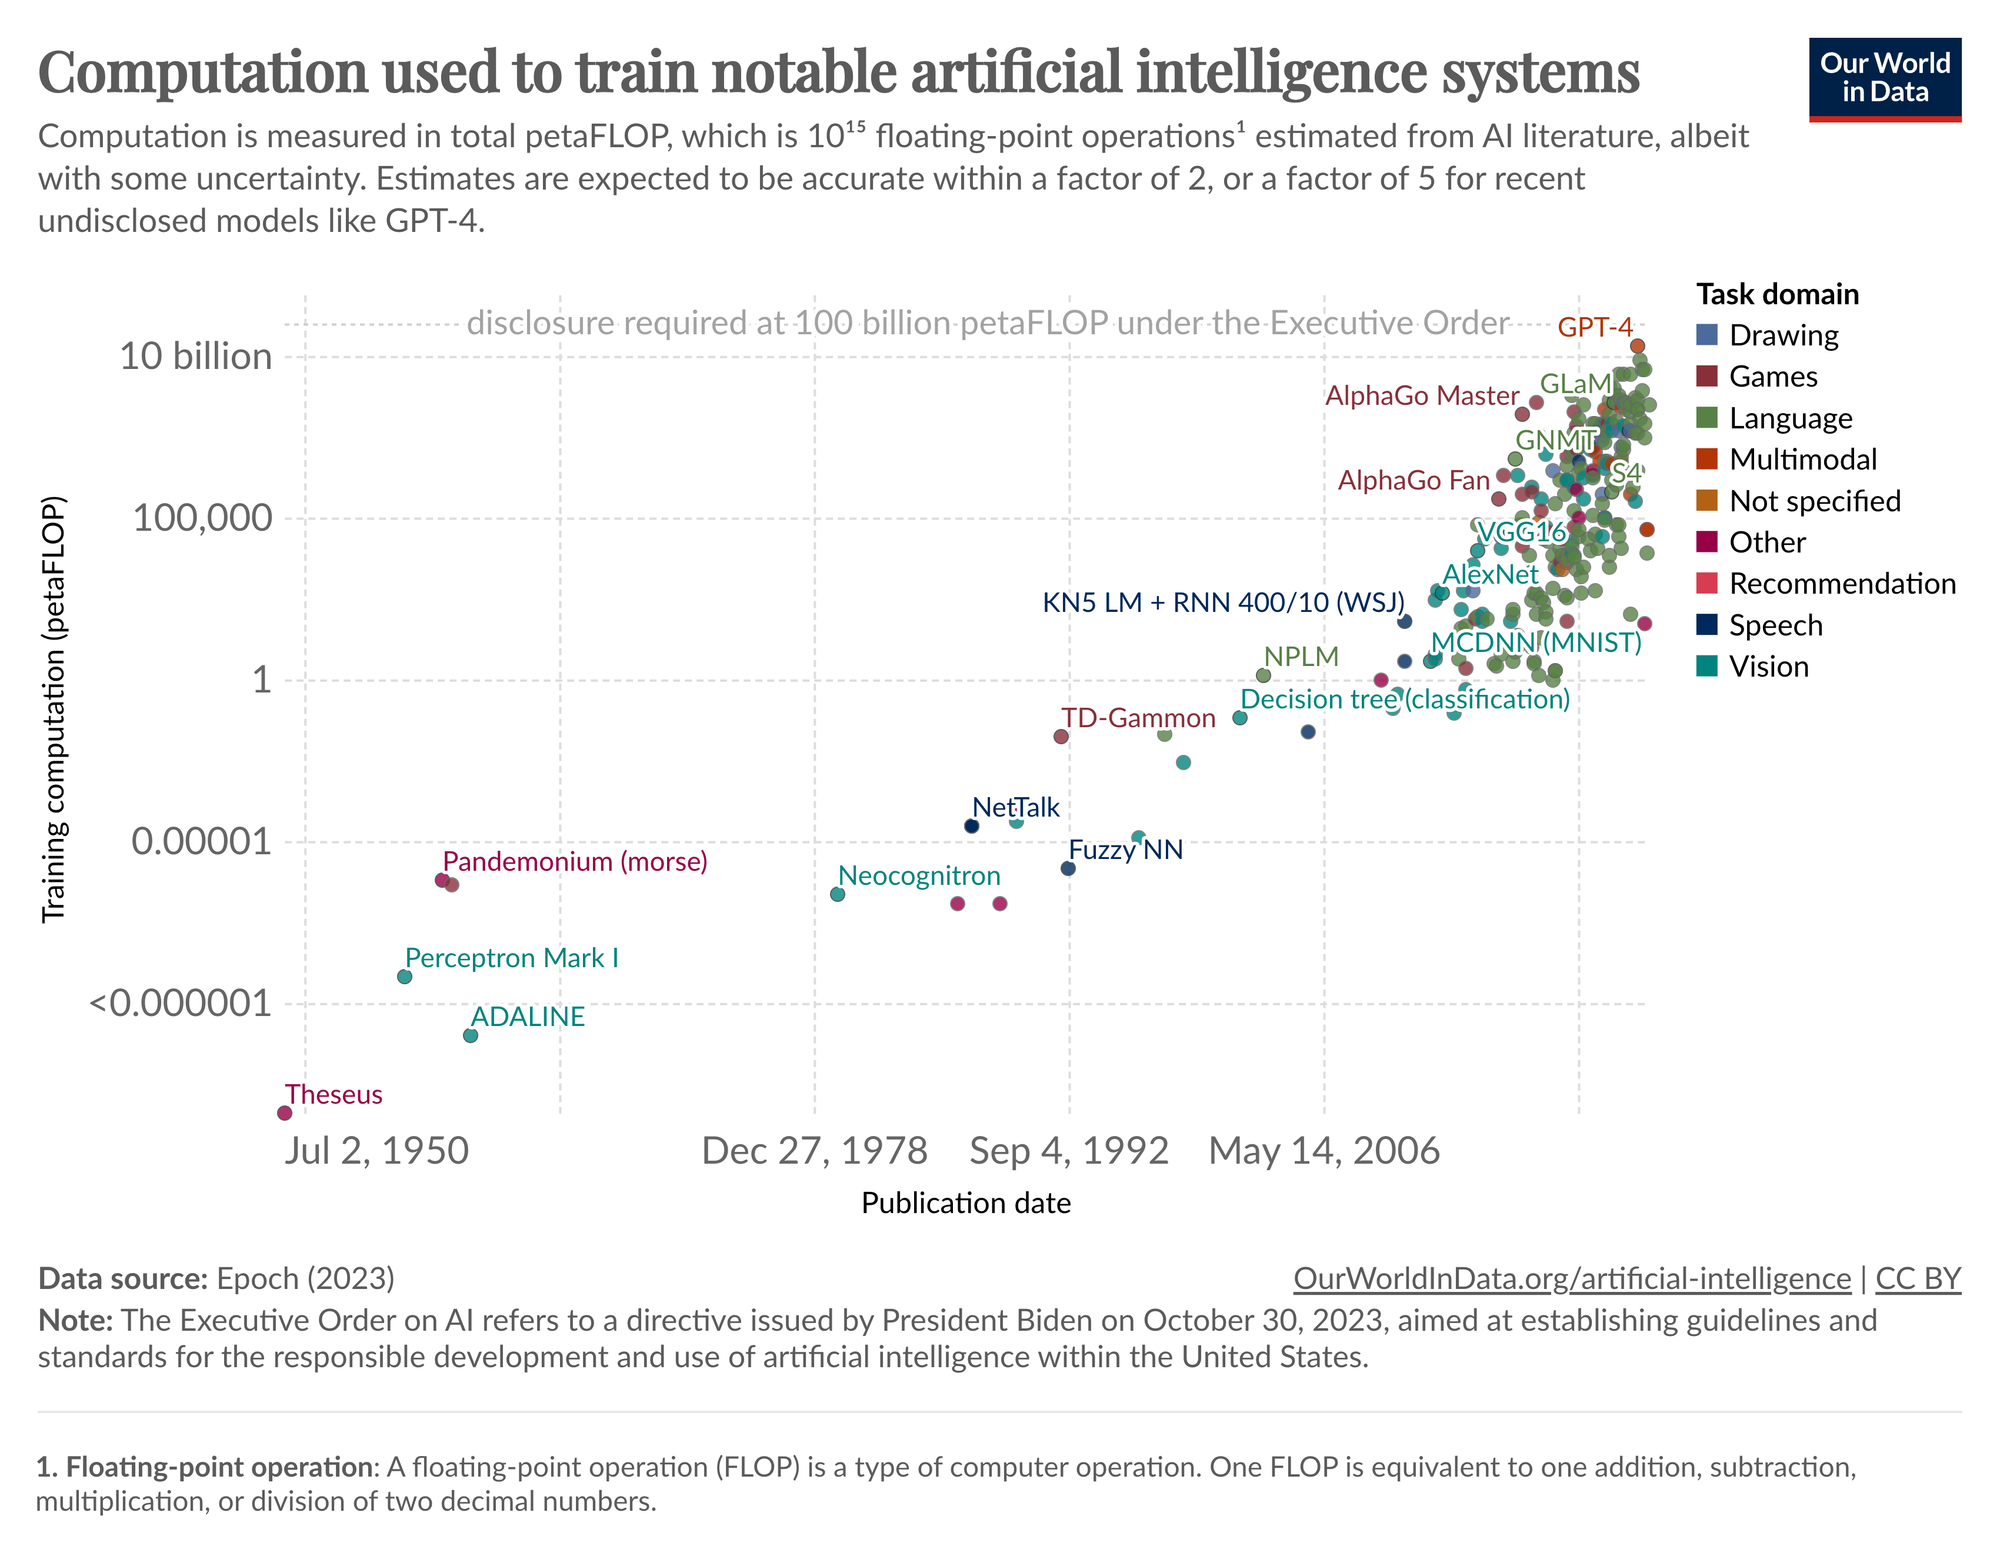
For example, let's go and upload this chart from Our World in Data on Computation used to train notable artificial intelligence systems and ask it to explain it for us.
...which gives us the following interpretation:
Various AI systems are plotted as points across this graph, and they are color-coded based on the task domain they address, such as language, games, vision, etc. Some notable systems like "GPT-4" and "AlphaGo" are placed at the higher end of the computation scale, while earlier systems like "Perceptron Mark I" and "Pandemonium" are at the lower end.
A dashed line near the top of the graph indicates that disclosure of AI computation is mandatory at or above 100 billion petaFLOPs under the Executive Order on AI. This refers to a directive issued by the President of the United States for establishing guidelines and standards for the responsible development and use of AI technology, which includes reporting on the computational resources used for training these AI models.
Not bad.
Setting Up the Environment
Now that we know what we're building, let's create a new Python Repl at Replit to host our Streamlit app.
- We start by importing
streamlit,openai,base64, andos. Streamlit is used for the UI, OpenAI for accessing GPT-4 Vision, base64 for image handling, and os for environment variables. - Next, you'll need to add your
OPENAI_API_KEYto Secrets and setup the OpenAI client as follows:
import streamlit as st
from openai import OpenAI
import base64
import os

OPENAI_API_KEY = os.environ['OPENAI_API_KEY']
client = OpenAI(api_key=OPENAI_API_KEY)
Encoding Images to Base64
Next, when users upload images directly, we need to convert these images into a format that GPT-4 can understand, so let's write a function to encode our images with Base64, which is a common method for encoding binary data as text.
def encode_image(uploaded_file):
  return base64.b64encode(uploaded_file.getvalue()).decode('utf-8')
Analyzing Images with GPT-4 Vision
Next, let's create a function to analyze images using GPT-4 vision:
- The
analyze_imagefunction processes a list of images and a user's question, sending them to OpenAI's GPT-4 Vision model for analysis. - It handles both URL-based and base64-encoded images, constructing the appropriate request format for the API.
- The function then sends this request and returns the model's response as output.
def analyze_image(image_data_list, question, is_url=False):
  messages = [{"role": "user", "content": [{"type": "text", "text": question}]}]

  for image_data in image_data_list:
    if is_url:
      messages[0]["content"].append({"type": "image_url", "image_url": {"url": image_data}})
    else:
      messages[0]["content"].append({"type": "image_url", "image_url": {"url": f"data:image/jpeg;base64,{image_data}"}})

  response = client.chat.completions.create(model="gpt-4-vision-preview", messages=messages)
  return response.choices[0].message.content
Streamlit App Configuration
Now that we've got our functions to handle image inputs and send them to GPT-4V, let's setup our simple Streamlit app:
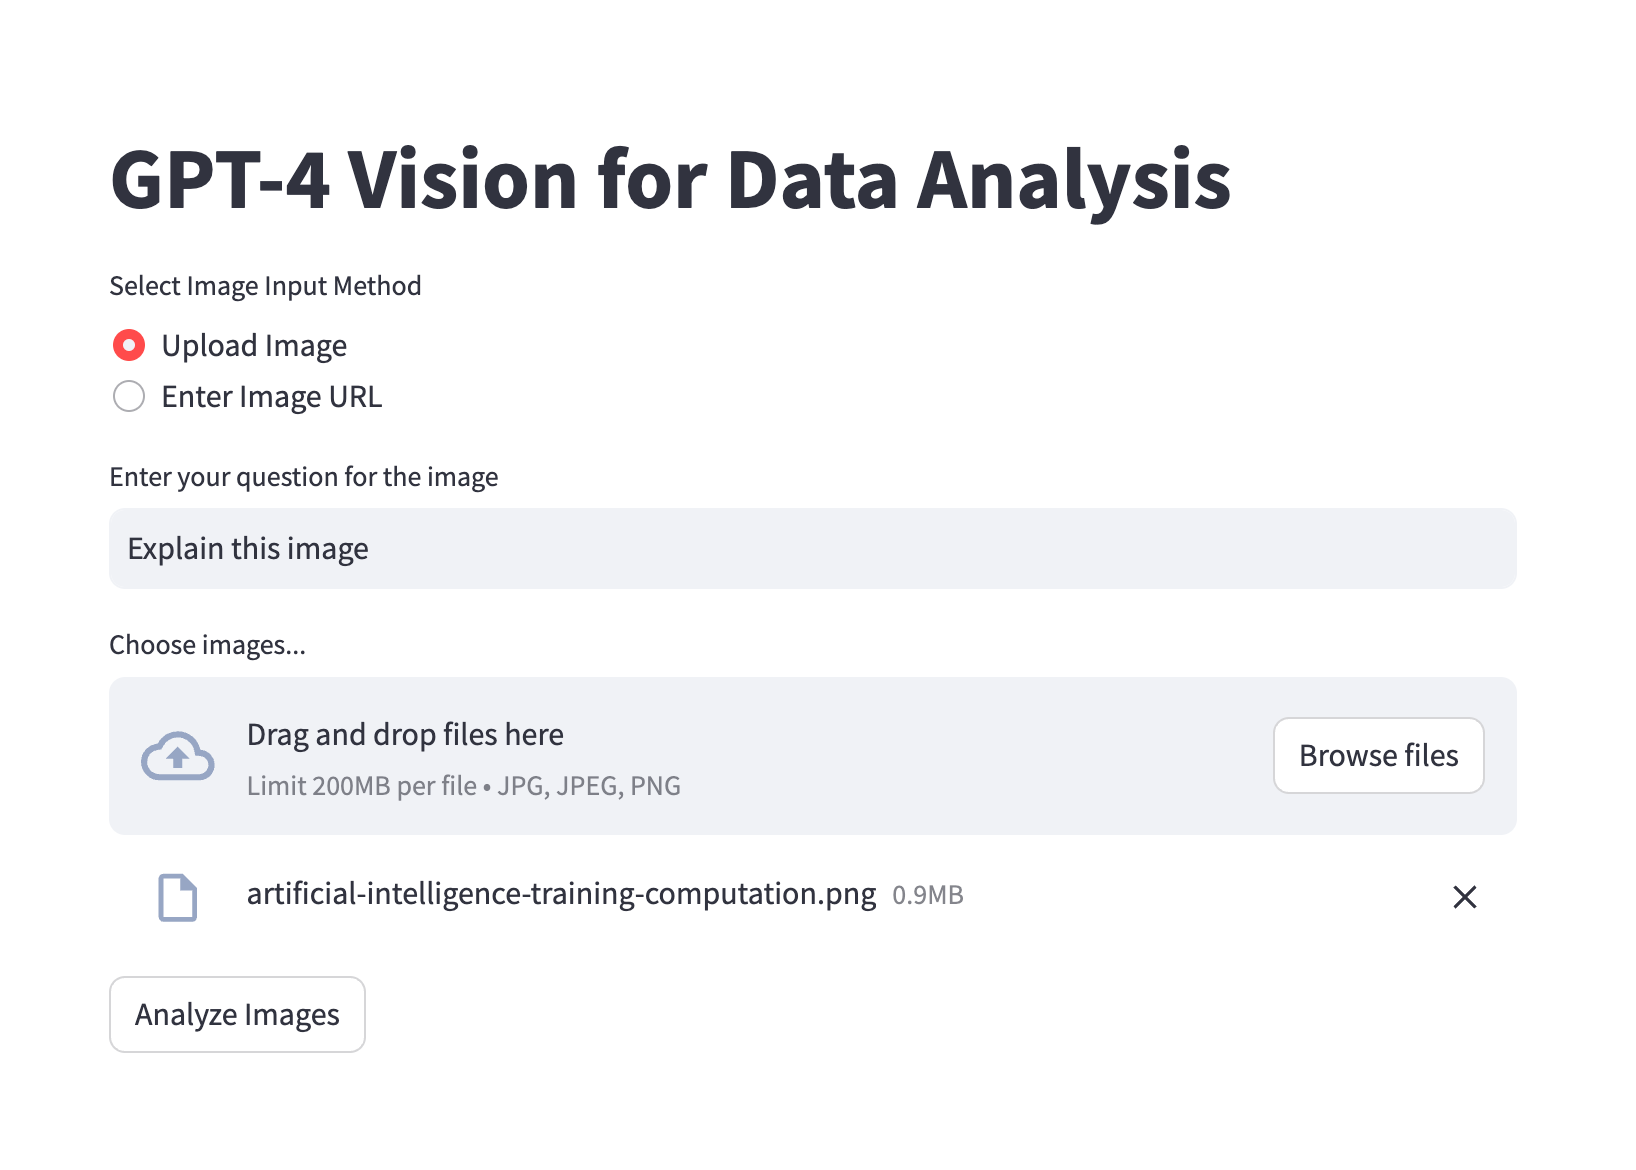
st.set_page_config: Sets the page title andst.titledisplays the title "GPT-4 Vision for Data Analysis" at the top of the app.
st.set_page_config(page_title="GPT-4 Vision for Data Analysis", page_icon="🔍")
st.title('GPT-4 Vision for Data Analysis')
User Input Handling
Next, let's create a section for users to choose their input method, i.e. either via upload or image URLs. We then want to allow users to specify a question, or just use a default "explain this image" prompt:
st.radio: Creates a radio button for the user to choose the image input method.st.text_input: Provides a text input field for users to enter their question for the image.
# User Inputs
image_input_method = st.radio("Select Image Input Method",
                              ('Upload Image', 'Enter Image URL'))
user_question = st.text_input("Enter your question for the image",
                              value="Explain this image")
Image Input Processing
Next, the following section handles user-uploaded images or URLs for analysis, encodes them if necessary, and displays the analysis results in the Streamlit app.
- Initializes an empty list
image_data_listto store image data. - If 'Upload Image' is selected:
st.file_uploader: Allows users to upload images in JPG, JPEG, or PNG format. Multiple files can be selected.- For each uploaded file, the file is encoded to base64 format and added to
image_data_list. st.button: When clicked, triggers the analysis of uploaded images.- The insights from
analyze_imageare displayed usingst.write.
image_data_list = []

if image_input_method == 'Upload Image':
  uploaded_files = st.file_uploader("Choose images...", type=["jpg", "jpeg", "png"], accept_multiple_files=True)
  if uploaded_files:
    for uploaded_file in uploaded_files:
      image_data_list.append(encode_image(uploaded_file))
    if st.button('Analyze image(s)'):
      insights = analyze_image(image_data_list, user_question)
      st.write(insights)
elif image_input_method == 'Enter Image URL':
  image_urls = st.text_area("Enter the URLs of the images, one per line")
  if image_urls and st.button('Analyze image URL(s)'):
    url_list = image_urls.split('\n')
    insights = analyze_image(url_list, user_question, is_url=True)
    st.write(insights)
That's all we need. Let's test it out with one more image from Our World in Data: Annual global corporate investment in artificial intelligence, by type.
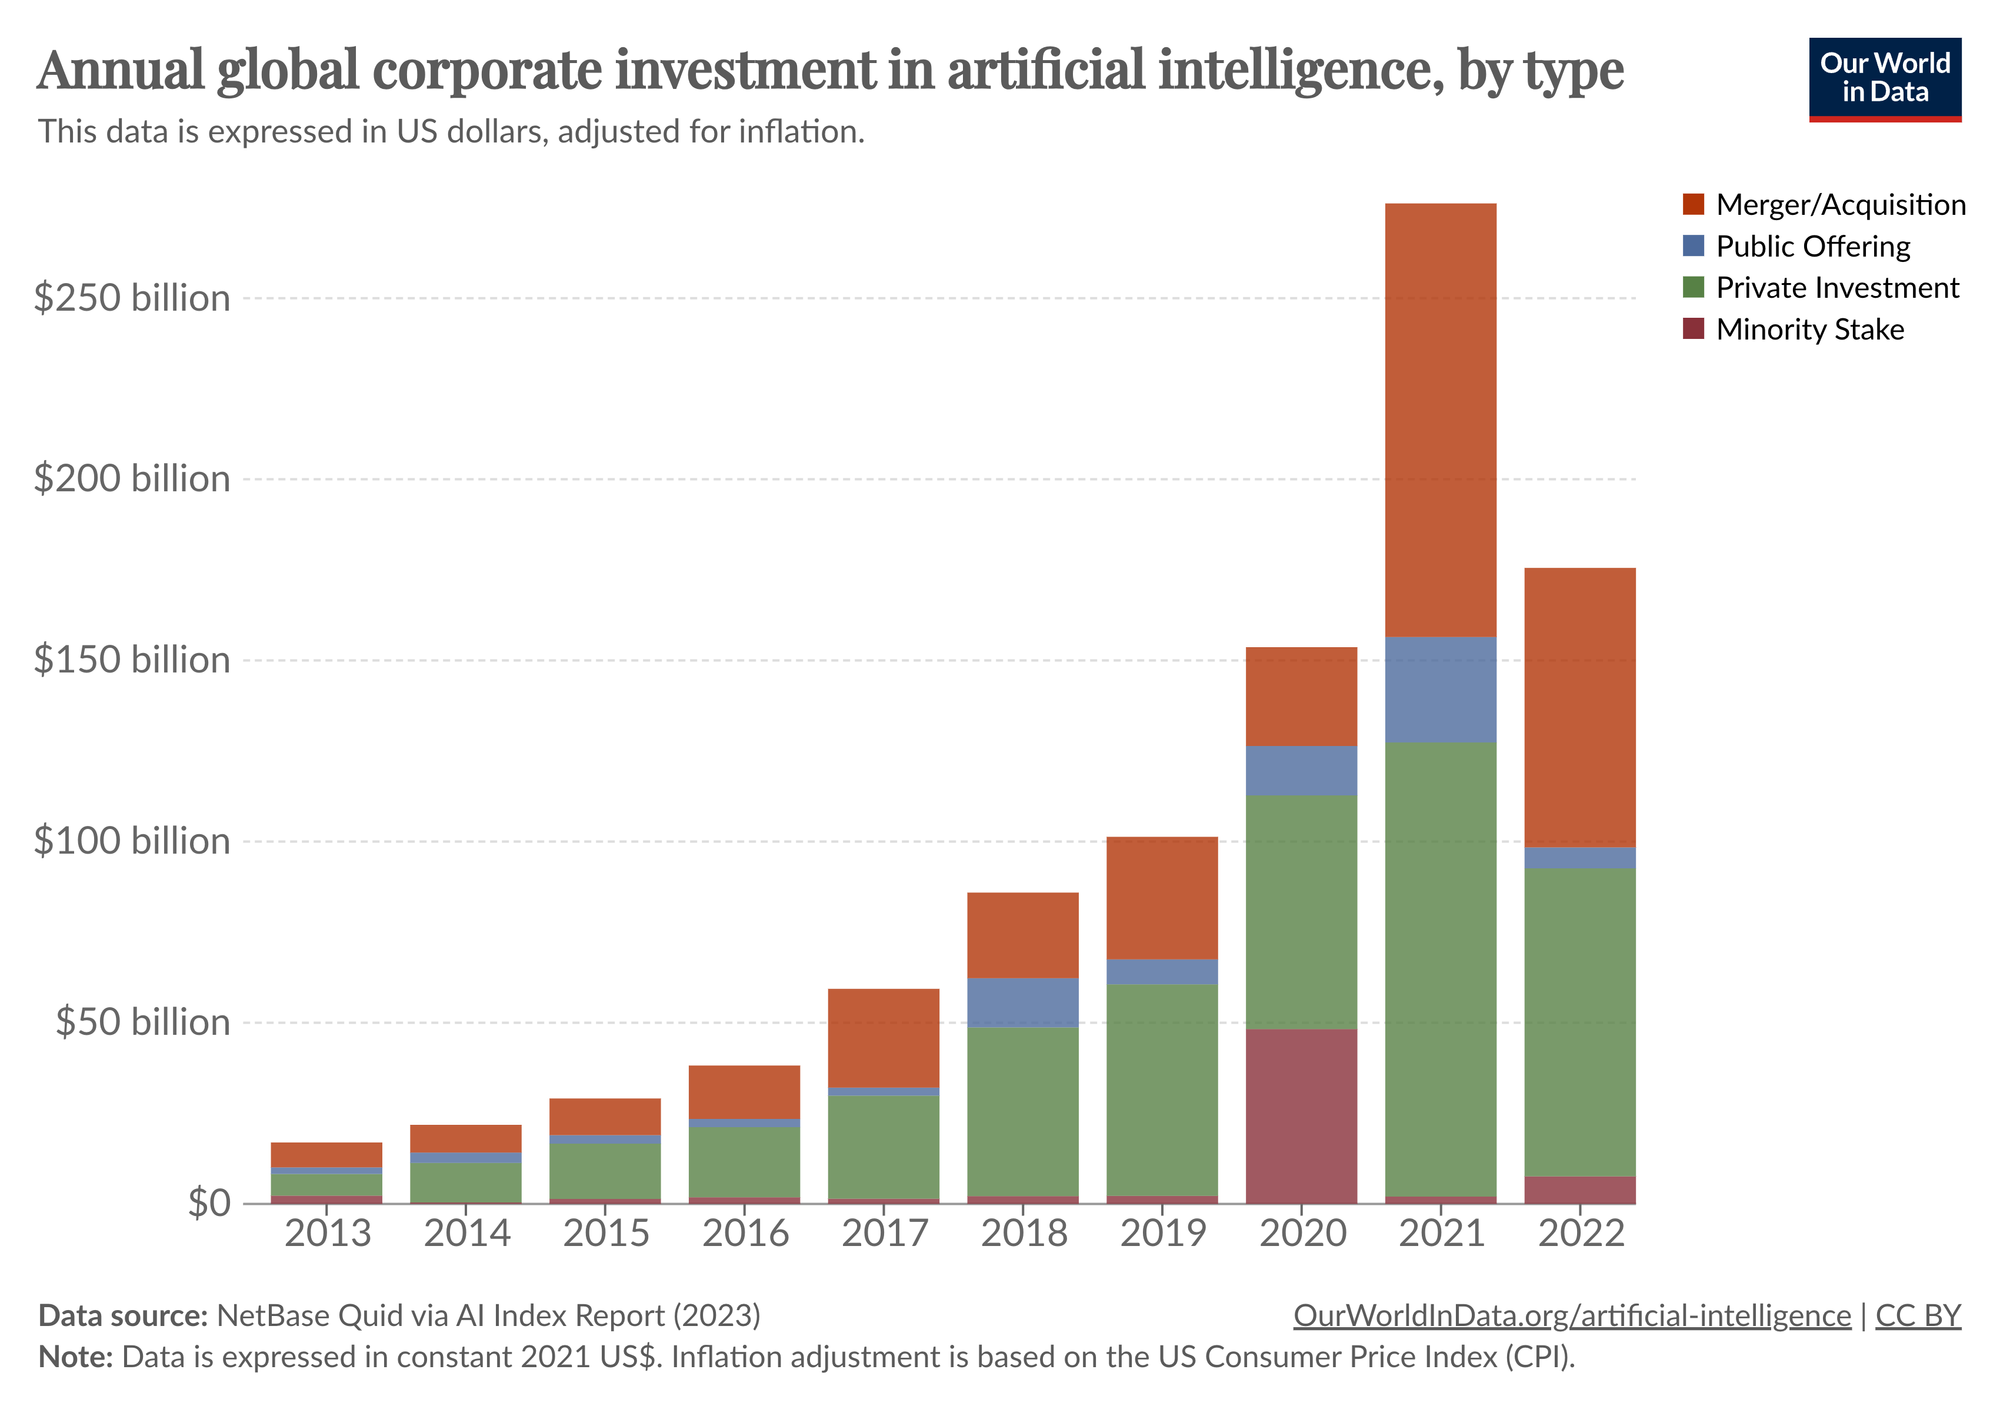
The chart is broken down into four types of investments:
1. Merger/Acquisition: represented by red on the top of some columns, this indicates the amount of money invested in AI through mergers and acquisitions.
2. Public Offering: shown in blue, this includes investments made through public offerings, possibly referring to investments made during IPOs or subsequent public investments into AI companies.
3. Private Investment: shown in green, this represents private funding rounds such as venture capital, private equity, or other types of private placement.
4.Minority Stake: represented in orange, this signifies investments made by purchasing a minority stake in AI companies.
The vertical axis indicates the amount of investment in billions of dollars, while the horizontal axis represents the year. There's a clear trend of increasing investment in AI over the years, with a significant jump from 2020 to 2021 and a slight decrease from 2021 to 2022. In 2022, the investments are spread across all four types, with private investment appearing to comprise the largest share.
Nice.
Summary: GPT-4 Vision for Data Analysis
As we saw with this example, OpenAI's GPT-4 vision provides a powerful new tool for quickly retrieving insights from data visualizations. Given the fact that we can analyze multiple images at once, I can imagine this model will be very useful for businesses in the coming years.
For example, a few use cases that come to mind include:
- Market Trend Analysis: For identifying and acting on emerging market patterns.
- Financial Reporting Interpretation: Allowing investors to quickly understand company performance and risks.
- Consumer Behavior Insights: Assisting in tailoring marketing strategies and product development.
The list goes on, but you get the idea.
If you'd like to access the code for this tutorial, you can sign up to MLQ Academy below.
This content is only available to subscribers
Subscribe now and have access to all our stories, enjoy exclusive content and stay up to date with constant updates.
Sign up nowAlready have an account? Sign in


