Aris Water Solutions Key Executives
This section highlights Aris Water Solutions's key executives, including their titles and compensation details.
Find Contacts at Aris Water Solutions
(Showing 0 of )
Aris Water Solutions Earnings
This section highlights Aris Water Solutions's earnings, including key dates, EPS, earnings reports, and earnings call transcripts.
Next Earnings Date
Last Earnings Results
Earnings Call Transcripts
| Transcript | Quarter | Year | Date | Estimated EPS | Actual EPS |
|---|---|---|---|---|---|
| Read Transcript | Q4 | 2024 | 2025-02-27 | N/A | N/A |
| Read Transcript | Q3 | 2024 | 2024-11-05 | N/A | N/A |
| Read Transcript | Q2 | 2024 | 2024-08-07 | N/A | N/A |
| Read Transcript | Q1 | 2024 | 2024-05-08 | N/A | N/A |
| Read Transcript | Q4 | 2023 | 2024-02-29 | N/A | N/A |
| Read Transcript | Q3 | 2023 | 2023-11-04 | N/A | N/A |
| Read Transcript | Q2 | 2023 | 2023-08-05 | N/A | N/A |
| Read Transcript | Q1 | 2023 | 2023-05-12 | N/A | N/A |

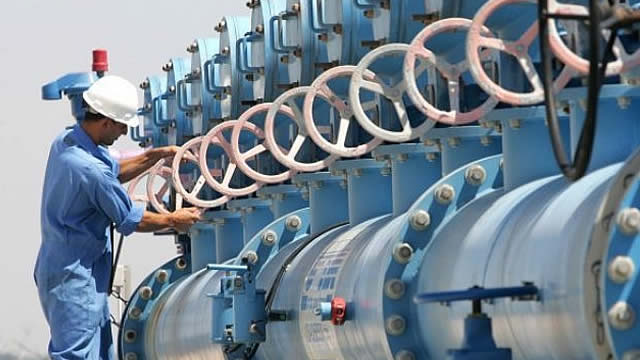
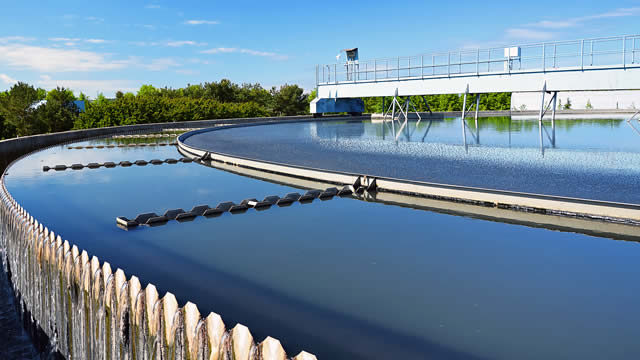
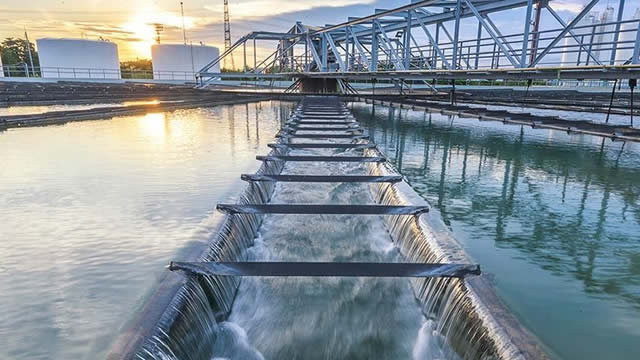
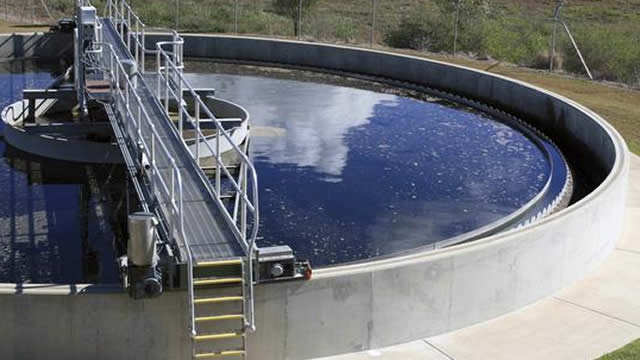
Aris Water Solutions, Inc., an environmental infrastructure and solutions company, provides water handling and recycling solutions. The company's produced water handling business gathers, transports, unless recycled, and handles produced water generated from oil and natural gas production. Its water solutions business develops and operates recycling facilities to treat, store, and recycle produced water. The company was founded in 2015 and is headquartered in Houston, Texas.
$25.25
Stock Price
$1.52B
Market Cap
276
Employees
Houston, TX
Location
Financial Statements
Access annual & quarterly financial statements for Aris Water Solutions, including income statements, balance sheets, and cash flow statements..
Annual Income Statement
| Breakdown | December 31, 2024 | December 31, 2023 | December 31, 2022 | December 31, 2021 | December 31, 2020 |
|---|---|---|---|---|---|
| Revenue | $435.44M | $392.12M | $321.00M | $229.25M | $171.47M |
| Cost of Revenue | $257.56M | $254.60M | $207.00M | $151.68M | $139.46M |
| Gross Profit | $177.89M | $137.51M | $114.00M | $77.57M | $32.01M |
| Gross Profit Ratio | 40.85% | 35.07% | 35.51% | 33.84% | 18.67% |
| Research and Development Expenses | $3.03M | $3.12M | $691.00K | $- | $- |
| General and Administrative Expenses | $65.31M | $50.45M | $45.22M | $27.27M | $22.05M |
| Selling and Marketing Expenses | $- | $- | $- | $- | $- |
| Selling General and Administrative Expenses | $65.31M | $50.45M | $45.22M | $27.27M | $22.05M |
| Other Expenses | $2.79M | $73.00K | $2.21M | $2.66M | $- |
| Operating Expenses | $71.14M | $53.65M | $48.12M | $29.92M | $22.05M |
| Cost and Expenses | $328.69M | $308.25M | $255.13M | $181.60M | $161.51M |
| Interest Income | $- | $- | $- | $- | $- |
| Interest Expense | $36.23M | $32.85M | $29.18M | $25.47M | $7.67M |
| Depreciation and Amortization | $79.16M | $76.63M | $67.52M | $60.77M | $44.03M |
| EBITDA | $185.91M | $160.39M | $135.50M | $79.53M | $54.46M |
| EBITDA Ratio | 42.69% | 40.90% | 42.21% | 34.69% | 31.76% |
| Operating Income | $106.75M | $83.87M | $65.87M | $47.27M | $7.70M |
| Operating Income Ratio | 24.52% | 21.39% | 20.52% | 20.62% | 4.49% |
| Total Other Income Expenses Net | $-36.23M | $-32.96M | $-29.18M | $-25.85M | $-7.67M |
| Income Before Tax | $70.52M | $50.91M | $5.32M | $-6.71M | $30.00K |
| Income Before Tax Ratio | 16.19% | 12.98% | 1.66% | -2.93% | 0.02% |
| Income Tax Expense | $10.34M | $7.49M | $524.00K | $298.00K | $23.00K |
| Net Income | $26.86M | $18.89M | $4.80M | $-7.01M | $7.00K |
| Net Income Ratio | 6.17% | 4.82% | 1.49% | -3.06% | 0.00% |
| EPS | $0.81 | $0.59 | $0.20 | $-0.32 | $0.00 |
| EPS Diluted | $0.81 | $0.59 | $0.20 | $-0.32 | $0.00 |
| Weighted Average Shares Outstanding | 30.58M | 30.04M | 24.07M | 21.85M | 20.30M |
| Weighted Average Shares Outstanding Diluted | 30.88M | 30.04M | 24.15M | 21.85M | 20.30M |
| SEC Filing | Source | Source | Source | Source | Source |
| Breakdown | December 31, 2024 | September 30, 2024 | June 30, 2024 | March 31, 2024 | December 31, 2023 | September 30, 2023 | June 30, 2023 | March 31, 2023 | December 31, 2022 | September 30, 2022 | June 30, 2022 | March 31, 2022 | December 31, 2021 | September 30, 2021 | June 30, 2021 | March 31, 2021 | December 31, 2020 | September 30, 2020 | June 30, 2020 | March 31, 2020 |
|---|---|---|---|---|---|---|---|---|---|---|---|---|---|---|---|---|---|---|---|---|
| Revenue | $118.61M | $112.31M | $101.12M | $103.41M | $104.12M | $99.79M | $96.63M | $91.57M | $82.87M | $90.78M | $76.39M | $70.97M | $66.98M | $59.50M | $56.58M | $46.19M | $44.92M | $42.46M | $37.65M | $46.45M |
| Cost of Revenue | $72.06M | $66.53M | $59.90M | $59.07M | $64.49M | $64.13M | $63.53M | $62.45M | $55.94M | $60.83M | $46.98M | $43.25M | $39.43M | $38.88M | $37.67M | $35.71M | $36.29M | $33.96M | $30.45M | $29.27M |
| Gross Profit | $46.55M | $45.78M | $41.22M | $44.34M | $39.64M | $35.66M | $33.10M | $29.12M | $26.93M | $29.95M | $29.40M | $27.72M | $27.55M | $20.62M | $18.92M | $10.48M | $8.63M | $8.50M | $7.19M | $17.18M |
| Gross Profit Ratio | 39.25% | 40.77% | 40.76% | 42.88% | 38.06% | 35.73% | 34.25% | 31.80% | 32.49% | 32.99% | 38.49% | 39.06% | 41.13% | 34.66% | 33.43% | 22.69% | 19.22% | 20.02% | 19.11% | 36.98% |
| Research and Development Expenses | $433.00K | $408.00K | $1.13M | $1.06M | $1.25M | $809.00K | $650.00K | $408.00K | $- | $430.00K | $81.00K | $19.00K | $- | $- | $- | $- | $- | $- | $- | $- |
| General and Administrative Expenses | $17.36M | $17.41M | $16.04M | $14.50M | $12.45M | $13.53M | $12.68M | $11.80M | $11.36M | $11.48M | $11.65M | $10.73M | $12.03M | $5.23M | $5.33M | $4.70M | $8.63M | $4.77M | $5.88M | $4.12M |
| Selling and Marketing Expenses | $- | $- | $-1 | $517.00K | $- | $- | $- | $- | $- | $- | $- | $- | $- | $- | $- | $- | $- | $- | $- | $- |
| Selling General and Administrative Expenses | $17.36M | $17.41M | $16.04M | $14.50M | $12.45M | $13.53M | $12.68M | $11.80M | $11.36M | $11.48M | $11.65M | $10.73M | $12.03M | $5.23M | $5.33M | $4.70M | $8.63M | $4.77M | $5.88M | $4.12M |
| Other Expenses | $2.09M | $-350.00K | $116.00K | $102.00K | $-769.00K | $18.00K | $362.00K | $217.00K | $2.22M | $9.46M | $5.93M | $16.66M | $1.17M | $940.00K | $-380.00K | $- | $-4.85M | $555.00K | $- | $- |
| Operating Expenses | $19.89M | $17.45M | $17.05M | $15.46M | $14.47M | $12.21M | $13.14M | $12.42M | $13.58M | $11.48M | $11.65M | $10.73M | $12.09M | $5.23M | $5.33M | $4.70M | $8.63M | $4.77M | $5.88M | $15.99M |
| Cost and Expenses | $91.94M | $83.98M | $76.95M | $74.53M | $78.96M | $76.35M | $76.67M | $74.88M | $69.52M | $72.31M | $58.63M | $53.98M | $51.52M | $44.10M | $43.00M | $40.41M | $44.92M | $38.73M | $36.33M | $45.26M |
| Interest Income | $- | $- | $- | $- | $- | $- | $- | $- | $-610.00K | $- | $- | $- | $- | $- | $- | $- | $570.00K | $- | $- | $1.59M |
| Interest Expense | $9.60M | $9.38M | $8.05M | $8.44M | $8.51M | $7.96M | $7.97M | $7.66M | $6.71M | $6.15M | $6.71M | $7.79M | $7.62M | $7.27M | $7.32M | $2.65M | $2.88M | $2.10M | $1.68M | $- |
| Depreciation and Amortization | $19.70M | $19.97M | $19.71M | $19.42M | $19.50M | $19.45M | $19.09M | $18.61M | $18.22M | $16.94M | $16.20M | $16.58M | $15.22M | $15.38M | $15.21M | $14.96M | $12.50M | $11.75M | $10.29M | $9.49M |
| EBITDA | $45.60M | $48.29M | $43.63M | $48.30M | $44.37M | $41.67M | $39.05M | $35.30M | $30.95M | $25.95M | $28.03M | $16.91M | $30.29M | $2.43M | $27.10M | $20.74M | $16.23M | $14.92M | $12.45M | $12.42M |
| EBITDA Ratio | 38.44% | 42.99% | 43.14% | 46.71% | 42.61% | 41.76% | 40.41% | 38.55% | 37.35% | 28.58% | 36.69% | 23.82% | 45.22% | 4.09% | 47.90% | 44.90% | 36.13% | 35.14% | 33.08% | 26.75% |
| Operating Income | $26.66M | $28.31M | $24.17M | $28.88M | $25.17M | $22.23M | $19.96M | $16.70M | $13.35M | $17.86M | $17.14M | $16.99M | $14.36M | $-12.95M | $12.27M | $5.47M | $2.60M | $3.17M | $746.00K | $2.94M |
| Operating Income Ratio | 22.48% | 25.21% | 23.90% | 27.92% | 24.17% | 22.28% | 20.66% | 18.23% | 16.10% | 19.67% | 22.44% | 23.94% | 21.43% | -21.76% | 21.68% | 11.83% | 5.79% | 7.47% | 1.98% | 6.32% |
| Total Other Income Expenses Net | $-9.60M | $-9.38M | $-8.81M | $-8.44M | $-9.37M | $-7.96M | $-7.97M | $-7.66M | $-7.32M | $-6.76M | $-7.32M | $-7.79M | $-7.62M | $-7.88M | $-7.70M | $-2.65M | $-2.31M | $-2.10M | $-1.68M | $-1.59M |
| Income Before Tax | $17.06M | $18.93M | $15.11M | $19.42M | $15.61M | $14.27M | $11.99M | $9.04M | $6.02M | $2.24M | $4.51M | $-7.46M | $6.74M | $-20.83M | $4.56M | $2.81M | $290.00K | $1.07M | $-929.00K | $-402.00K |
| Income Before Tax Ratio | 14.39% | 16.85% | 14.94% | 18.78% | 14.99% | 14.30% | 12.41% | 9.87% | 7.27% | 2.47% | 5.91% | -10.51% | 10.06% | -35.00% | 8.06% | 6.09% | 0.65% | 2.52% | -2.47% | -0.87% |
| Income Tax Expense | $3.26M | $2.50M | $1.99M | $2.59M | $2.58M | $2.03M | $1.56M | $1.33M | $605.00K | $287.00K | $472.00K | $-840.00K | $379.00K | $-83.00K | $2.00K | $2.65M | $8.00K | $9.00K | $2.00K | $4.00K |
| Net Income | $5.78M | $7.49M | $5.96M | $7.62M | $5.40M | $5.41M | $4.70M | $7.71M | $1.83M | $1.96M | $4.04M | $-6.62M | $4.15M | $-20.74M | $4.58M | $2.82M | $282.00K | $1.06M | $-931.00K | $-406.00K |
| Net Income Ratio | 4.87% | 6.67% | 5.90% | 7.37% | 5.19% | 5.42% | 4.86% | 8.42% | 2.21% | 2.15% | 5.29% | -9.32% | 6.19% | -34.86% | 8.09% | 6.11% | 0.63% | 2.50% | -2.47% | -0.87% |
| EPS | $0.25 | $0.23 | $0.18 | $0.23 | $0.17 | $0.17 | $0.15 | $0.26 | $0.06 | $0.08 | $0.18 | $-0.30 | $0.05 | $-1.07 | $0.26 | $0.16 | $0.02 | $0.06 | $-0.05 | $0.00 |
| EPS Diluted | $0.25 | $0.22 | $0.18 | $0.23 | $0.17 | $0.17 | $0.15 | $0.26 | $0.06 | $0.08 | $0.18 | $-0.30 | $0.05 | $-1.07 | $0.26 | $0.16 | $0.02 | $0.06 | $-0.05 | $0.00 |
| Weighted Average Shares Outstanding | 30.77M | 30.63M | 30.55M | 30.35M | 30.13M | 30.05M | 30.04M | 29.94M | 27.95M | 24.50M | 21.98M | 21.85M | 20.89M | 19.42M | 17.65M | 17.65M | 17.65M | 17.65M | 17.65M | - |
| Weighted Average Shares Outstanding Diluted | 31.65M | 30.92M | 30.59M | 30.35M | 30.13M | 30.05M | 30.04M | 29.94M | 28.05M | 24.55M | 22.10M | 21.85M | 20.89M | 19.42M | 17.65M | 17.65M | 17.65M | 17.65M | 17.65M | - |
| SEC Filing | Source | Source | Source | Source | Source | Source | Source | Source | Source | Source | Source | Source | Source | Source | Source | Source | Source | Source | Source | Source |
Annual Balance Sheet
| Breakdown | December 31, 2024 | December 31, 2023 | December 31, 2022 | December 31, 2021 | December 31, 2020 |
|---|---|---|---|---|---|
| Cash and Cash Equivalents | $28.67M | $5.06M | $1.12M | $60.05M | $24.93M |
| Short Term Investments | $- | $- | $61.00K | $90.00K | $72.00K |
| Cash and Short Term Investments | $28.67M | $5.06M | $1.12M | $60.05M | $24.93M |
| Net Receivables | $76.84M | $95.12M | $132.07M | $66.29M | $33.10M |
| Inventory | $- | $- | $1 | $-20.19M | $2 |
| Other Current Assets | $22.43M | $8.36M | $5.74M | $6.04M | $4.32M |
| Total Current Assets | $127.95M | $108.55M | $138.99M | $132.39M | $66.07M |
| Property Plant Equipment Net | $1.04B | $936.44M | $828.24M | $633.01M | $618.19M |
| Goodwill | $34.59M | $34.59M | $34.59M | $34.59M | $34.59M |
| Intangible Assets | $195.22M | $232.28M | $269.85M | $304.93M | $337.54M |
| Goodwill and Intangible Assets | $229.81M | $266.86M | $304.43M | $339.51M | $372.12M |
| Long Term Investments | $- | $- | $- | $- | $- |
| Tax Assets | $13.45M | $22.63M | $30.42M | $19.93M | $- |
| Other Non-Current Assets | $5.28M | $6.00M | $1.28M | $1.85M | $1.43M |
| Total Non-Current Assets | $1.29B | $1.23B | $1.16B | $994.30M | $991.74M |
| Other Assets | $- | $- | $- | $- | $- |
| Total Assets | $1.42B | $1.34B | $1.30B | $1.13B | $1.06B |
| Account Payables | $20.18M | $25.93M | $22.98M | $7.08M | $16.07M |
| Short Term Debt | $2.14M | $7.14M | $1.18M | $- | $- |
| Tax Payables | $14.06M | $- | $- | $- | $- |
| Deferred Revenue | $- | $- | $- | $1.34M | $- |
| Other Current Liabilities | $68.81M | $63.63M | $67.26M | $41.96M | $29.72M |
| Total Current Liabilities | $105.19M | $96.70M | $91.41M | $49.05M | $45.79M |
| Long Term Debt | $457.45M | $436.51M | $436.64M | $392.05M | $297.00M |
| Deferred Revenue Non-Current | $- | $- | $-52.39M | $1.34M | $1.30M |
| Deferred Tax Liabilities Non-Current | $- | $- | $52.39M | $75.56M | $5.29M |
| Other Non-Current Liabilities | $122.19M | $119.38M | $118.22M | $83.06M | $1.43M |
| Total Non-Current Liabilities | $579.64M | $555.89M | $554.87M | $475.11M | $303.72M |
| Other Liabilities | $- | $- | $- | $- | $- |
| Total Liabilities | $684.83M | $652.59M | $646.28M | $524.15M | $349.51M |
| Preferred Stock | $- | $- | $0 | $1 | $74.38M |
| Common Stock | $588.00K | $581.00K | $576.00K | $535.00K | $633.91M |
| Retained Earnings | $13.68M | $-87.00K | $-7.72M | $-457.00K | $- |
| Accumulated Other Comprehensive Income Loss | $- | $-0 | $-0 | $0 | $- |
| Other Total Stockholders Equity | $334.35M | $323.41M | $316.65M | $212.79M | $- |
| Total Stockholders Equity | $348.62M | $323.90M | $309.51M | $212.87M | $708.29M |
| Total Equity | $735.28M | $687.89M | $657.09M | $602.54M | $708.29M |
| Total Liabilities and Stockholders Equity | $1.42B | $1.34B | $1.30B | $1.13B | $1.06B |
| Minority Interest | $386.67M | $363.99M | $347.58M | $389.67M | $- |
| Total Liabilities and Total Equity | $1.42B | $1.34B | $1.30B | $1.13B | $1.06B |
| Total Investments | $- | $- | $61.00K | $90.00K | $72.00K |
| Total Debt | $459.59M | $443.65M | $428.92M | $392.05M | $297.00M |
| Net Debt | $430.92M | $438.58M | $427.80M | $332.00M | $272.07M |
Balance Sheet Charts
| Breakdown | December 31, 2024 | September 30, 2024 | June 30, 2024 | March 31, 2024 | December 31, 2023 | September 30, 2023 | June 30, 2023 | March 31, 2023 | December 31, 2022 | September 30, 2022 | June 30, 2022 | March 31, 2022 | December 31, 2021 | September 30, 2021 | June 30, 2021 | March 31, 2021 | December 31, 2020 | March 31, 2020 | April 30, 2017 | January 31, 2017 |
|---|---|---|---|---|---|---|---|---|---|---|---|---|---|---|---|---|---|---|---|---|
| Cash and Cash Equivalents | $28.67M | $32.76M | $11.53M | $20.65M | $5.06M | $24.18M | $4.02M | $25.51M | $1.12M | $25.18M | $35.13M | $67.78M | $60.05M | $36.39M | $31.12M | $21.18M | $24.93M | $-7.20M | $5.55M | $4.55M |
| Short Term Investments | $- | $- | $- | $- | $- | $33.00K | $43.00K | $44.00K | $- | $41.00K | $83.00K | $91.00K | $90.00K | $48.00K | $- | $- | $72.00K | $14.40M | $- | $- |
| Cash and Short Term Investments | $28.67M | $32.76M | $11.53M | $20.65M | $5.06M | $24.18M | $4.02M | $25.51M | $1.12M | $25.18M | $35.13M | $67.78M | $60.05M | $36.39M | $31.12M | $21.18M | $24.93M | $7.20M | $5.55M | $4.55M |
| Net Receivables | $76.84M | $116.34M | $106.87M | $92.18M | $95.12M | $99.19M | $103.04M | $105.74M | $132.07M | $108.33M | $88.10M | $73.11M | $66.29M | $57.81M | $44.27M | $33.02M | $33.10M | $- | $2.94M | $2.66M |
| Inventory | $- | $- | $1 | $- | $- | $-23.30M | $-27.72M | $-32.01M | $- | $1 | $- | $- | $-20.19M | $1 | $1 | $1 | $2 | $- | $199.00K | $145.00K |
| Other Current Assets | $22.43M | $4.46M | $2.07M | $3.82M | $5.49M | $2.21M | $22.00M | $4.50M | $5.80M | $1.79M | $12.18M | $12.64M | $6.04M | $1.30M | $2.15M | $6.21M | $4.32M | $- | $4.09M | $3.52M |
| Total Current Assets | $127.95M | $153.56M | $123.79M | $119.18M | $108.55M | $125.62M | $129.05M | $135.79M | $138.99M | $135.34M | $135.41M | $153.53M | $132.39M | $95.55M | $80.82M | $60.41M | $66.07M | $7.20M | $12.79M | $10.88M |
| Property Plant Equipment Net | $1.04B | $990.08M | $990.99M | $964.35M | $936.44M | $926.12M | $889.44M | $867.12M | $828.24M | $807.62M | $675.60M | $635.12M | $633.01M | $631.47M | $649.98M | $635.15M | $618.19M | $- | $2.26M | $2.37M |
| Goodwill | $34.59M | $34.59M | $34.59M | $34.59M | $34.59M | $34.59M | $34.59M | $34.59M | $34.59M | $34.59M | $34.59M | $34.59M | $34.59M | $34.59M | $34.59M | $34.59M | $34.59M | $- | $28.04M | $28.03M |
| Intangible Assets | $195.22M | $204.49M | $213.75M | $223.01M | $232.28M | $241.55M | $250.94M | $260.39M | $269.85M | $277.38M | $286.56M | $295.75M | $304.93M | $313.08M | $321.23M | $329.38M | $337.54M | $- | $9.70M | $10.22M |
| Goodwill and Intangible Assets | $229.81M | $239.07M | $248.34M | $257.60M | $266.86M | $276.13M | $285.53M | $294.98M | $304.43M | $311.96M | $321.15M | $330.33M | $339.51M | $347.67M | $355.82M | $363.97M | $372.12M | $- | $37.74M | $38.26M |
| Long Term Investments | $- | $- | $- | $- | $- | $- | $- | $- | $- | $- | $- | $- | $- | $- | $- | $- | $- | $- | $- | $- |
| Tax Assets | $13.45M | $15.97M | $18.51M | $20.73M | $87.91M | $25.78M | $27.67M | $29.21M | $30.42M | $24.38M | $22.41M | $22.44M | $19.93M | $- | $- | $- | $- | $- | $664.00K | $968.00K |
| Other Non-Current Assets | $5.28M | $5.99M | $5.45M | $5.74M | $6.00M | $853.00K | $998.00K | $1.14M | $1.28M | $1.42M | $1.57M | $1.71M | $1.85M | $2.85M | $2.14M | $3.20M | $1.43M | $-7.20M | $6.71M | $6.91M |
| Total Non-Current Assets | $1.29B | $1.25B | $1.26B | $1.25B | $1.30B | $1.23B | $1.20B | $1.19B | $1.16B | $1.15B | $1.02B | $989.60M | $994.30M | $981.99M | $1.01B | $1.00B | $991.74M | $-7.20M | $47.37M | $48.50M |
| Other Assets | $- | $- | $- | $- | $- | $- | $- | $- | $- | $- | $- | $- | $- | $- | $- | $- | $- | $- | $- | $- |
| Total Assets | $1.42B | $1.40B | $1.39B | $1.37B | $1.41B | $1.35B | $1.33B | $1.33B | $1.30B | $1.28B | $1.16B | $1.14B | $1.13B | $1.08B | $1.09B | $1.06B | $1.06B | $- | $60.16M | $59.38M |
| Account Payables | $20.18M | $13.51M | $42.11M | $37.81M | $25.93M | $30.97M | $36.72M | $27.73M | $22.98M | $35.82M | $19.28M | $19.28M | $7.08M | $10.07M | $10.41M | $14.13M | $16.07M | $- | $832.00K | $1.15M |
| Short Term Debt | $2.14M | $1.84M | $3.62M | $5.45M | $7.14M | $1.50M | $1.19M | $1.20M | $1.18M | $1.02M | $1.04M | $1.09M | $- | $- | $- | $- | $- | $- | $2.94M | $2.92M |
| Tax Payables | $14.06M | $7.67M | $2.95M | $- | $- | $- | $- | $- | $- | $- | $- | $- | $- | $- | $- | $- | $- | $- | $326.00K | $336.00K |
| Deferred Revenue | $- | $- | $- | $- | $1.12M | $-1.50M | $68.12M | $- | $- | $- | $- | $- | $1.34M | $1.34M | $- | $- | $- | $- | $6.38M | $5.33M |
| Other Current Liabilities | $68.81M | $66.27M | $46.23M | $65.83M | $63.63M | $80.86M | $74.96M | $76.59M | $67.26M | $86.48M | $56.60M | $46.82M | $41.96M | $47.94M | $38.95M | $33.65M | $29.72M | $- | $3.64M | $4.21M |
| Total Current Liabilities | $105.19M | $89.28M | $94.91M | $109.09M | $96.70M | $113.34M | $112.86M | $105.53M | $91.41M | $123.32M | $76.93M | $67.19M | $49.05M | $58.01M | $49.37M | $47.78M | $45.79M | $- | $14.12M | $13.94M |
| Long Term Debt | $457.45M | $467.15M | $458.97M | $436.84M | $436.51M | $443.87M | $431.97M | $442.88M | $436.64M | $399.65M | $398.62M | $397.92M | $392.05M | $391.58M | $391.12M | $297.00M | $297.00M | $- | $12.59M | $13.32M |
| Deferred Revenue Non-Current | $- | $- | $- | $- | $14.72M | $- | $- | $- | $- | $- | $- | $- | $1.34M | $1.34M | $- | $- | $1.30M | $- | $- | $- |
| Deferred Tax Liabilities Non-Current | $- | $- | $- | $- | $65.27M | $- | $- | $- | $- | $- | $- | $- | $75.56M | $- | $- | $- | $5.29M | $- | $3.26M | $2.83M |
| Other Non-Current Liabilities | $122.19M | $121.46M | $121.01M | $120.27M | $119.38M | $118.51M | $118.50M | $118.61M | $118.22M | $90.92M | $85.59M | $84.62M | $83.06M | $7.37M | $6.96M | $6.84M | $1.43M | $- | $-1.86M | $-1.23M |
| Total Non-Current Liabilities | $579.64M | $588.62M | $579.98M | $557.11M | $621.16M | $562.38M | $550.47M | $561.49M | $554.87M | $490.58M | $484.21M | $482.54M | $475.11M | $398.95M | $398.08M | $303.84M | $303.72M | $- | $13.99M | $14.92M |
| Other Liabilities | $- | $- | $- | $- | $- | $- | $- | $- | $- | $- | $- | $- | $- | $- | $- | $- | $- | $- | $- | $- |
| Total Liabilities | $684.83M | $677.89M | $674.88M | $666.19M | $717.86M | $675.72M | $663.33M | $667.02M | $646.28M | $613.90M | $561.14M | $549.74M | $524.15M | $456.96M | $447.44M | $351.62M | $349.51M | $- | $28.11M | $28.86M |
| Preferred Stock | $- | $- | $1 | $- | $- | $1 | $1 | $1 | $- | $- | $1 | $- | $- | $- | $- | $74.37M | $74.38M | $- | $- | $- |
| Common Stock | $588.00K | $586.00K | $585.00K | $585.00K | $581.00K | $578.00K | $578.00K | $578.00K | $576.00K | $569.00K | $535.00K | $535.00K | $535.00K | $620.57M | $641.32M | $636.74M | $633.91M | $- | $17.00K | $17.00K |
| Retained Earnings | $13.68M | $11.33M | $7.24M | $4.65M | $-87.00K | $-2.68M | $-5.29M | $-7.17M | $-7.72M | $-7.09M | $-5.42M | $-4.74M | $-457.00K | $- | $- | $- | $- | $- | $-84.03M | $-85.45M |
| Accumulated Other Comprehensive Income Loss | $- | $- | $0 | $-0 | $-0 | $0 | $0 | $0 | $- | $0 | $0 | $-0 | $0 | $- | $- | $- | $- | $545.51M | $-4.00K | $- |
| Other Total Stockholders Equity | $334.35M | $330.79M | $328.45M | $326.54M | $323.41M | $321.40M | $320.31M | $318.68M | $316.65M | $282.78M | $217.70M | $215.67M | $212.79M | $- | $- | $- | $- | $- | $116.06M | $115.96M |
| Total Stockholders Equity | $348.62M | $342.70M | $336.27M | $331.77M | $323.90M | $319.29M | $315.60M | $312.08M | $309.51M | $276.26M | $212.82M | $211.46M | $212.87M | $620.57M | $641.32M | $711.11M | $708.29M | $545.51M | $32.05M | $30.52M |
| Total Equity | $735.28M | $726.76M | $712.18M | $701.40M | $687.89M | $678.79M | $669.37M | $661.22M | $657.09M | $666.82M | $594.99M | $593.38M | $602.54M | $620.57M | $641.32M | $711.11M | $708.29M | $545.51M | $32.05M | $30.52M |
| Total Liabilities and Stockholders Equity | $1.42B | $1.40B | $1.39B | $1.37B | $1.41B | $1.35B | $1.33B | $1.33B | $1.30B | $1.28B | $1.16B | $1.14B | $1.13B | $1.08B | $1.09B | $1.06B | $1.06B | $545.51M | $60.16M | $59.38M |
| Minority Interest | $386.67M | $384.06M | $375.91M | $369.63M | $363.99M | $359.50M | $353.77M | $349.14M | $347.58M | $390.56M | $382.17M | $381.92M | $389.67M | $- | $- | $- | $- | $- | $- | $- |
| Total Liabilities and Total Equity | $1.42B | $1.40B | $1.39B | $1.37B | $1.41B | $1.35B | $1.33B | $1.33B | $1.30B | $1.28B | $1.16B | $1.14B | $1.13B | $1.08B | $1.09B | $1.06B | $1.06B | $545.51M | $60.16M | $59.38M |
| Total Investments | $- | $- | $- | $- | $- | $33.00K | $43.00K | $44.00K | $- | $41.00K | $83.00K | $91.00K | $90.00K | $48.00K | $- | $- | $72.00K | $14.40M | $- | $- |
| Total Debt | $459.59M | $468.99M | $462.59M | $442.29M | $443.65M | $429.32M | $423.86M | $435.39M | $437.82M | $403.44M | $399.66M | $399.01M | $392.05M | $391.58M | $391.12M | $297.00M | $297.00M | $- | $15.53M | $16.24M |
| Net Debt | $430.92M | $436.23M | $451.06M | $421.63M | $438.58M | $405.14M | $419.84M | $409.88M | $436.69M | $378.26M | $364.53M | $331.23M | $332.00M | $355.19M | $359.99M | $275.81M | $272.07M | $7.20M | $9.97M | $11.69M |
Annual Cash Flow
| Breakdown | December 31, 2024 | December 31, 2023 | December 31, 2022 | December 31, 2021 | December 31, 2020 |
|---|---|---|---|---|---|
| Net Income | $60.18M | $18.89M | $4.80M | $-7.01M | $7.00K |
| Depreciation and Amortization | $79.16M | $76.63M | $67.52M | $60.77M | $44.03M |
| Deferred Income Tax | $8.69M | $7.30M | $466.00K | $379.00K | $- |
| Stock Based Compensation | $18.19M | $11.57M | $12.03M | $1.59M | $- |
| Change in Working Capital | $6.27M | $43.67M | $-49.29M | $-30.21M | $20.25M |
| Accounts Receivables | $5.89M | $34.17M | $-64.65M | $-30.11M | $15.81M |
| Inventory | $- | $- | $- | $8.31M | $2.94M |
| Accounts Payables | $-6.51M | $1.81M | $1.90M | $-8.27M | $193.00K |
| Other Working Capital | $6.89M | $7.69M | $13.45M | $-139.00K | $1.30M |
| Other Non Cash Items | $6.39M | $25.81M | $34.68M | $33.30M | $3.49M |
| Net Cash Provided by Operating Activities | $178.88M | $183.87M | $70.21M | $58.81M | $67.77M |
| Investments in Property Plant and Equipment | $- | $-169.74M | $-146.53M | $-74.66M | $-139.59M |
| Acquisitions Net | $- | $- | $14.70M | $- | $- |
| Purchases of Investments | $- | $- | $- | $- | $- |
| Sales Maturities of Investments | $- | $- | $- | $- | $- |
| Other Investing Activities | $-145.57M | $20.15M | $-5.10M | $-74.66M | $- |
| Net Cash Used for Investing Activities | $-145.57M | $-149.58M | $-136.93M | $-74.66M | $-139.59M |
| Debt Repayment | $17.45M | $-9.00M | $35.00M | $103.00M | $77.00M |
| Common Stock Issued | $- | $- | $- | $249.35M | $- |
| Common Stock Repurchased | $-3.58M | $-1.36M | $-2.76M | $-74.49M | $- |
| Dividends Paid | $-24.56M | $-21.43M | $-24.46M | $-213.19M | $- |
| Other Financing Activities | $1.00M | $1.44M | $- | $86.94M | $12.67M |
| Net Cash Used Provided by Financing Activities | $-9.70M | $-30.35M | $7.78M | $50.98M | $89.67M |
| Effect of Forex Changes on Cash | $- | $- | $- | $- | $- |
| Net Change in Cash | $23.61M | $3.94M | $-58.93M | $35.12M | $17.85M |
| Cash at End of Period | $28.67M | $5.06M | $1.12M | $60.05M | $24.93M |
| Cash at Beginning of Period | $5.06M | $1.12M | $60.05M | $24.93M | $7.08M |
| Operating Cash Flow | $178.88M | $183.87M | $70.21M | $58.81M | $67.77M |
| Capital Expenditure | $-99.98M | $-169.74M | $-146.53M | $-74.66M | $-139.59M |
| Free Cash Flow | $78.89M | $14.14M | $-76.31M | $-15.85M | $-71.82M |
Cash Flow Charts
| Breakdown | December 31, 2024 | September 30, 2024 | June 30, 2024 | March 31, 2024 | December 31, 2023 | September 30, 2023 | June 30, 2023 | March 31, 2023 | December 31, 2022 | September 30, 2022 | June 30, 2022 | March 31, 2022 | December 31, 2021 | September 30, 2021 | June 30, 2021 | March 31, 2021 | December 31, 2020 | September 30, 2020 | June 30, 2020 | March 31, 2020 |
|---|---|---|---|---|---|---|---|---|---|---|---|---|---|---|---|---|---|---|---|---|
| Net Income | $13.80M | $16.43M | $5.96M | $7.62M | $5.40M | $12.24M | $10.43M | $7.71M | $5.42M | $1.96M | $4.04M | $-6.62M | $6.36M | $-20.74M | $4.56M | $2.81M | $282.00K | $1.06M | $-931.00K | $-406.00K |
| Depreciation and Amortization | $20.06M | $19.97M | $19.71M | $19.42M | $19.50M | $20.04M | $19.09M | $18.61M | $18.22M | $16.84M | $15.89M | $16.58M | $15.22M | $15.38M | $15.21M | $14.96M | $12.50M | $11.75M | $10.29M | $9.49M |
| Deferred Income Tax | $2.96M | $1.96M | $1.64M | $2.13M | $2.53M | $1.94M | $1.54M | $1.30M | $562.00K | $288.00K | $456.00K | $-840.00K | $379.00K | $- | $- | $- | $- | $- | $- | $- |
| Stock Based Compensation | $4.70M | $5.28M | $4.69M | $3.52M | $2.62M | $3.36M | $3.12M | $2.47M | $2.90M | $3.60M | $3.20M | $2.34M | $1.59M | $- | $- | $- | $- | $- | $- | $- |
| Change in Working Capital | $23.57M | $8.94M | $-26.11M | $-141.00K | $-8.15M | $20.80M | $1.70M | $28.92M | $-35.68M | $7.57M | $-19.19M | $-1.99M | $-23.63M | $3.00M | $-7.91M | $-1.67M | $3.19M | $-3.85M | $10.76M | $11.00M |
| Accounts Receivables | $28.32M | $1.32M | $-14.71M | $2.35M | $2.17M | $11.96M | $6.66M | $26.74M | $-24.08M | $-16.85M | $-15.03M | $-7.39M | $-8.83M | $-10.10M | $-11.26M | $82.00K | $3.95M | $-2.52M | $10.38M | $4.00M |
| Inventory | $- | $- | $- | $- | $1 | $- | $- | $- | $- | $- | $- | $- | $-9.72M | $11.56M | $5.14M | $1.33M | $512.00K | $-4.96M | $- | $- |
| Accounts Payables | $1.91M | $-10.02M | $-1.58M | $3.18M | $3.81M | $846.00K | $-2.30M | $1.30M | $-1.33M | $5.43M | $-3.23M | $1.03M | $-4.99M | $1.53M | $-1.89M | $-2.93M | $-1.60M | $3.30M | $- | $- |
| Other Working Capital | $-6.66M | $17.64M | $-9.82M | $-5.67M | $-14.13M | $8.00M | $-2.67M | $877.00K | $-10.27M | $18.99M | $-941.00K | $4.37M | $-93.00K | $4.00K | $99.00K | $-149.00K | $325.00K | $325.00K | $384.00K | $7.00M |
| Other Non Cash Items | $2.56M | $500.00K | $68.83M | $48.09M | $9.46M | $-2.32M | $927.00K | $675.00K | $1.61M | $9.67M | $6.48M | $16.92M | $1.72M | $28.86M | $2.25M | $469.00K | $1.25M | $674.00K | $-3.79M | $4.49M |
| Net Cash Provided by Operating Activities | $67.65M | $53.08M | $14.34M | $43.81M | $31.35M | $56.06M | $36.79M | $59.67M | $-6.97M | $39.93M | $10.87M | $26.39M | $1.63M | $26.50M | $14.12M | $16.57M | $17.22M | $9.64M | $16.34M | $24.57M |
| Investments in Property Plant and Equipment | $- | $-30.32M | $-37.30M | $-19.58M | $-37.86M | $-53.89M | $-42.67M | $-35.31M | $-49.53M | $-48.67M | $-38.51M | $-9.81M | $-11.94M | $-20.38M | $-22.03M | $-20.33M | $-17.75M | $-29.25M | $-41.69M | $-50.89M |
| Acquisitions Net | $- | $- | $93.00K | $1.00K | $35.00K | $20.12M | $- | $- | $- | $7.44M | $- | $- | $- | $- | $- | $- | $- | $- | $- | $- |
| Purchases of Investments | $- | $- | $- | $- | $- | $- | $- | $- | $- | $- | $- | $- | $- | $- | $- | $- | $- | $- | $- | $- |
| Sales Maturities of Investments | $- | $- | $- | $- | $- | $- | $- | $- | $- | $- | $- | $- | $- | $- | $- | $- | $- | $- | $- | $- |
| Other Investing Activities | $-58.53M | $66.00K | $93.00K | $1.00K | $35.00K | $-1.75M | $1.75M | $-35.31M | $5.51M | $-3.35M | $- | $-9.81M | $11.94M | $- | $- | $- | $- | $- | $- | $- |
| Net Cash Used for Investing Activities | $-58.53M | $-30.26M | $-37.20M | $-19.58M | $-37.83M | $-35.52M | $-40.92M | $-35.31M | $-44.02M | $-44.59M | $-38.51M | $-9.81M | $-11.94M | $-20.38M | $-22.03M | $-20.33M | $-17.75M | $-29.25M | $-41.69M | $-50.89M |
| Debt Repayment | $-11.31M | $6.76M | $22.00M | $- | $- | $5.00M | $-12.00M | $6.00M | $35.00M | $- | $- | $- | $- | $- | $- | $- | $4.00M | $13.00M | $20.00M | $40.00M |
| Common Stock Issued | $- | $- | $- | $- | $- | $- | $- | $- | $- | $- | $- | $- | $249.35M | $- | $- | $- | $- | $- | $- | $- |
| Common Stock Repurchased | $-2.17M | $-92.00K | $-16.00K | $-1.31M | $-738.00K | $-26.00K | $- | $-599.00K | $-2.76M | $- | $- | $- | $-135.00K | $-855.00K | $-74.36M | $- | $- | $- | $- | $- |
| Dividends Paid | $-6.37M | $-6.38M | $-6.37M | $-5.45M | $-5.35M | $-5.34M | $-5.37M | $-5.37M | $-5.31M | $-5.30M | $-5.00M | $-8.86M | $-213.19M | $- | $- | $- | $- | $- | $- | $- |
| Other Financing Activities | $6.63M | $-1.88M | $-1.88M | $-1.88M | $-6.56M | $- | $- | $- | $-2.76M | $- | $- | $- | $247.16M | $-855.00K | $17.85M | $5.00K | $13.16M | $-63.00K | $-428.00K | $- |
| Net Cash Used Provided by Financing Activities | $-13.21M | $-1.59M | $13.74M | $-8.64M | $-12.64M | $-366.00K | $-17.37M | $28.00K | $26.94M | $-5.30M | $-5.00M | $-8.86M | $33.98M | $-855.00K | $17.85M | $5.00K | $17.16M | $12.94M | $19.57M | $40.00M |
| Effect of Forex Changes on Cash | $- | $- | $- | $- | $- | $- | $- | $- | $- | $- | $- | $- | $- | $- | $- | $- | $- | $- | $- | $7.08M |
| Net Change in Cash | $-4.09M | $21.23M | $-9.13M | $15.59M | $-19.12M | $20.17M | $-21.49M | $24.39M | $-24.06M | $-9.96M | $-32.64M | $7.72M | $23.67M | $5.27M | $9.94M | $-3.75M | $16.62M | $-6.68M | $-5.78M | $20.77M |
| Cash at End of Period | $28.67M | $32.76M | $11.53M | $20.65M | $5.06M | $24.18M | $4.02M | $25.51M | $1.12M | $25.18M | $35.13M | $67.78M | $60.05M | $36.39M | $31.12M | $21.18M | $24.93M | $8.31M | $14.98M | $20.77M |
| Cash at Beginning of Period | $32.76M | $11.53M | $20.65M | $5.06M | $24.18M | $4.02M | $25.51M | $1.12M | $25.18M | $35.13M | $67.78M | $60.05M | $36.39M | $31.12M | $21.18M | $24.93M | $8.31M | $14.98M | $20.77M | $- |
| Operating Cash Flow | $67.65M | $53.08M | $14.34M | $43.81M | $31.35M | $56.06M | $36.79M | $59.67M | $-6.97M | $39.93M | $10.87M | $26.39M | $1.63M | $26.50M | $14.12M | $16.57M | $17.22M | $9.64M | $16.34M | $24.57M |
| Capital Expenditure | $- | $-30.32M | $-37.30M | $-19.58M | $-37.86M | $-53.89M | $-42.67M | $-35.31M | $-49.53M | $-48.67M | $-38.51M | $-9.81M | $-11.94M | $-20.38M | $-22.03M | $-20.33M | $-17.75M | $-29.25M | $-41.69M | $-50.89M |
| Free Cash Flow | $67.65M | $22.76M | $-22.96M | $24.23M | $-6.51M | $2.17M | $-5.87M | $24.36M | $-56.51M | $-8.74M | $-27.64M | $16.58M | $-10.31M | $6.12M | $-7.91M | $-3.75M | $-533.00K | $-19.61M | $-25.36M | $-26.32M |
Aris Water Solutions Dividends
Explore Aris Water Solutions's dividend history, including dividend yield, payout ratio, and historical payments.
Dividend Yield
3.35%
Dividend Payout Ratio
91.44%
Dividend Paid & Capex Coverage Ratio
1.44x
Aris Water Solutions Dividend History
| Dividend | Adjusted Dividend | Date | Record Date | Payment Date | Declaration Date |
|---|---|---|---|---|---|
| $0.14 | $0.14 | March 13, 2025 | March 13, 2025 | March 27, 2025 | February 26, 2025 |
| $0.105 | $0.105 | December 05, 2024 | December 05, 2024 | December 19, 2024 | November 04, 2024 |
| $0.105 | $0.105 | September 05, 2024 | September 05, 2024 | September 19, 2024 | August 06, 2024 |
| $0.105 | $0.105 | June 06, 2024 | June 06, 2024 | June 20, 2024 | April 30, 2024 |
| $0.09 | $0.09 | March 06, 2024 | March 07, 2024 | March 21, 2024 | February 23, 2024 |
| $0.09 | $0.09 | December 06, 2023 | December 07, 2023 | December 21, 2023 | November 01, 2023 |
| $0.09 | $0.09 | September 13, 2023 | September 14, 2023 | September 28, 2023 | August 02, 2023 |
| $0.09 | $0.09 | June 15, 2023 | June 16, 2023 | June 29, 2023 | May 08, 2023 |
| $0.09 | $0.09 | March 16, 2023 | March 17, 2023 | March 29, 2023 | March 03, 2023 |
| $0.09 | $0.09 | November 16, 2022 | November 17, 2022 | November 30, 2022 | November 04, 2022 |
| $0.09 | $0.09 | August 16, 2022 | August 17, 2022 | August 30, 2022 | August 03, 2022 |
| $0.09 | $0.09 | May 18, 2022 | May 19, 2022 | May 31, 2022 | May 06, 2022 |
| $0.09 | $0.09 | March 16, 2022 | March 17, 2022 | March 29, 2022 | February 25, 2022 |
| $0.07 | $0.07 | January 05, 2022 | January 06, 2022 | January 27, 2022 | December 06, 2021 |
Aris Water Solutions News
Read the latest news about Aris Water Solutions, including recent articles, headlines, and updates.
Aris Water Solutions, Inc. Schedules First Quarter 2025 Results Conference Call
HOUSTON--(BUSINESS WIRE)--Aris Water Solutions, Inc. (NYSE: ARIS) (“Aris”, “Aris Water” or the “Company”) announced today that it will host a conference call to discuss its first quarter 2025 results on Wednesday, May 7, 2025, at 8:00 a.m. Central Time (9:00 a.m. Eastern Time). Aris will issue its first quarter 2025 earnings release after market close on May 6, 2025. Participants should call (877) 407-5792 and refer to Aris Water Solutions, Inc. when dialing in. Participants are encouraged to l.

ARIS MINING REPORTS Q1 2025 GOLD PRODUCTION ACHIEVING 8% YEAR-OVER-YEAR GROWTH
VANCOUVER, BC , April 8, 2025 /PRNewswire/ - Aris Mining Corporation (Aris Mining or the Company) (TSX: ARIS) (NYSE-A: ARMN) reports gold production of 54,763 ounces (oz) for the first quarter of 2025 (Q1 2025), with 47,549 oz from Segovia and 7,214 oz from the Marmato Upper Mine. Q1 2025 Gold Production Highlights: Positive trends across both the Segovia and Marmato operations, with a total gold production of 54,763 oz in Q1 2025, up 8% compared to 50,767 oz in Q1 2024.

Aris Water's Strategic Expansion: New Targets And Future Prospects
Aris Water Solutions has seen an 86% rise since my strong buy rating in July 2024, surpassing my initial price target. The company excels in produced water handling and recycling, with long-term contracts with major oil companies like ConocoPhillips and Chevron. Recent acquisitions and technological advancements, including the McNeil Ranch purchase and industrial water assets, are set to boost revenue and cut costs.
ARIS MINING REPORTS RECORD Q4 2024 FINANCIAL RESULTS WITH STRONG EBITDA GROWTH AND ANNOUNCES 25% CAPACITY EXPANSION AT MARMATO
VANCOUVER, BC , March 12, 2025 /PRNewswire/ - Aris Mining Corporation (Aris Mining or the Company) (TSX: ARIS) (NYSE-A: ARMN) announces its financial and operating results for the three months and full year ended December 31, 2024 (Q4 2024 and 2024, respectively). All amounts are expressed in U.S. dollars unless otherwise indicated.

Aris Water Announces Pricing of $500 Million Upsized Offering of 7.250% Senior Notes due 2030
HOUSTON--(BUSINESS WIRE)--Aris Water Solutions, Inc. (NYSE: ARIS) (“Aris”) today announced that Aris Water Holdings, LLC (the “Issuer”), a subsidiary of Aris, has priced its offering (the “Offering”) of $500 million aggregate principal amount of 7.250% Senior Notes due 2030 (the “Notes”). The Notes will mature on April 1, 2030 and will be issued at par. The Offering is expected to close on March 25, 2025, subject to customary closing conditions. The Offering was upsized to $500 million in aggre.

ARIS MINING ANNOUNCES COLOMBIAN MINISTRY OF ENVIRONMENT RESOLUTION RELATED TO THE SANTURBÁN REGION
VANCOUVER, BC , March 5, 2025 /PRNewswire/ - Aris Mining Corporation (Aris Mining or the Company) (TSX: ARIS) (NYSE-A: ARMN) announces that the Colombian Ministry of Environment has completed the public consultation process initiated in November 2024 in respect of the resolution establishing a Temporary Reserve Area (TRA) in the Santurbán region of the Santander Department, where the Soto Norte Project is located. Effective March 4th, this resolution allows the Ministry of Environment to evaluate water resources in the area and temporarily suspend the issuance of environmental licenses for two years.

Aris Water Solutions, Inc. (ARIS) Q4 2024 Earnings Call Transcript
Aris Water Solutions, Inc. (NYSE:ARIS ) Q4 2024 Earnings Conference Call February 27, 2025 9:00 AM ET Company Participants David Tuerff - Senior Vice President-Finance & Investor Relations Bill Zartler - Founder & Executive Chairman Amanda Brock - President & Chief Executive Officer Stephan Tompsett - Chief Financial Officer Conference Call Participants John Mackay - Goldman Sachs Noah Katz - JPMorgan Praneeth Satish - Wells Fargo Jeffrey Campbell - Seaport Research Partners Derrick Whitfield - Texas Capital Don Crist - Johnson Rice Operator Greetings and welcome to Aris Water Solutions Fourth Quarter 2024 Earnings Conference Call. At this time all participants are in a listen-only mode.

Here's What Key Metrics Tell Us About Aris Water Solutions (ARIS) Q4 Earnings
Although the revenue and EPS for Aris Water Solutions (ARIS) give a sense of how its business performed in the quarter ended December 2024, it might be worth considering how some key metrics compare with Wall Street estimates and the year-ago numbers.
Aris Water Solutions, Inc. Reports Fourth Quarter and Full Year 2024 Results and Provides 2025 Outlook; Raises Quarterly Dividend by 33% and Announces Acquisition of the McNeill Ranch
HOUSTON--(BUSINESS WIRE)--Aris Water Solutions, Inc. (NYSE: ARIS) (“Aris,” “Aris Water” or the “Company”) today announced financial and operating results for the fourth quarter and full year ended December 31, 2024. FOURTH QUARTER AND FULL YEAR 2024 HIGHLIGHTS Grew produced water volumes 7% year-over-year Set a new quarterly record for recycled water volumes, growing 16% for the year and 18% sequentially in the fourth quarter of 2024 Achieved fourth quarter and full year 2024 net income of $13.

Curious about Aris Water Solutions (ARIS) Q4 Performance? Explore Wall Street Estimates for Key Metrics
Besides Wall Street's top -and-bottom-line estimates for Aris Water Solutions (ARIS), review projections for some of its key metrics to gain a deeper understanding of how the company might have fared during the quarter ended December 2024.
ARIS MINING ANNOUNCES FULL-YEAR 2024 EARNINGS RELEASE DATE
VANCOUVER, BC , Feb. 20, 2025 /PRNewswire/ - Aris Mining Corporation (Aris Mining or the Company) (TSX: ARIS) (NYSE-A: ARMN) will publish its full-year 2024 financial results after market close on Wednesday, March 12, 2025 and host a conference call on Thursday, March 13, 2025, at 9:00 am ET/6:00 am PT to discuss the results. Participants may gain expedited access to the conference call by registering at Diamond Pass Registration.

Aris Water Solutions, Inc. Schedules Fourth Quarter and Full Year 2024 Results Conference Call
HOUSTON--(BUSINESS WIRE)--Aris Water Solutions, Inc. (NYSE: ARIS) (“Aris”, “Aris Water” or the “Company”) announced today that it will host a conference call to discuss its fourth quarter and full year 2024 results on Thursday, February 27, 2025, at 8:00 a.m. Central Time (9:00 a.m. Eastern Time). Aris will issue its fourth quarter and full year 2024 earnings release after market close on February 26, 2025. Participants should call (877) 407-5792 and refer to Aris Water Solutions, Inc. when dia.

Aris Water Solutions: Still Lots Of Potential
Aris Water Solutions, a small-cap company in water management for oil and gas, has seen significant growth and offers investors an interesting exposure to the growth of the Permian Basin. The company benefits from long-term fee-based contracts, a full-cycle water management model, and potential expansion into mineral extraction, presenting a strong growth opportunity beyond the current service area. Despite impressive revenue and operating income growth, the company's capital-intensive nature and leveraged balance sheet require careful consideration.
Oil Be Back! My Top Energy Picks For 2025 And Beyond
The shale boom is fading, but I see massive potential in energy's next phase. I'm focusing on strategic picks positioned for long-term growth. My favorite energy investments are built to thrive in shifting markets. They balance innovation, strong cash flow, and reliable dividends. Looking ahead to 2025 and beyond, I'm excited about these picks. They represent the future of energy and align perfectly with my investment strategy.

Aris Water Solutions: Strong Margin Discipline Driving Continuous Growth
Aris Water Solutions is rated a Buy due to expected margin expansion in FY 2025 and beyond. Aris benefits from strong customer relationships, especially with key players like Chevron and ConocoPhillips, enhancing its competitive advantage in the Permian Basin. The company's focus on cost reduction and a favorable business mix, including higher-margin recycled water sales, supports sustained profitability.
ARIS MINING ANNOUNCES Q3 2024 EARNINGS RELEASE DATE
VANCOUVER, BC , Nov. 6, 2024 /PRNewswire/ - Aris Mining Corporation (Aris Mining or the Company) (TSX: ARIS) (NYSE-A: ARMN) will publish its Q3 2024 financial results after market close on Tuesday, November 12, 2024 and host a conference call on Wednesday, November 13, 2024, at 9:00 am ET/6:00 am PT to discuss the results. The call will be webcast and can be accessed at Webcast | Q3 2024 Results Conference Call (choruscall.com).

Aris Water Solutions, Inc. (ARIS) Q3 2024 Earnings Call Transcript
Aris Water Solutions, Inc. (NYSE:ARIS ) Q3 2024 Earnings Conference Call November 5, 2024 9:00 AM ET Company Participants David Tuerff – Senior Vice President-Finance and Investor Relations Bill Zartler – Founder and Executive Chairman Amanda Brock – President and Chief Executive Officer Stephan Tompsett – Chief Financial Officer Conference Call Participants John Mackay – Goldman Sachs Jeffrey Campbell – Seaport Research Partners Wade Suki – Capital One Praneeth Satish – Wells Fargo Noah Katz – JPMorgan Charles Bryant – Citi Sean Mitchell – Daniel Energy Partners Operator Ladies and gentlemen, good morning and welcome to the Aris Water Solutions Third Quarter 2024 Earnings Conference Call. At this time all participants are in a listen-only mode.

Aris Water Solutions (ARIS) Q3 Earnings: How Key Metrics Compare to Wall Street Estimates
While the top- and bottom-line numbers for Aris Water Solutions (ARIS) give a sense of how the business performed in the quarter ended September 2024, it could be worth looking at how some of its key metrics compare to Wall Street estimates and year-ago values.
ARIS MINING ANNOUNCES CLOSING OF US$450 MILLION SENIOR NOTES OFFERING TO FUND REDEMPTION OF OUTSTANDING 6.875% SENIOR NOTES
VANCOUVER, BC , Oct. 31, 2024 /PRNewswire/ - Aris Mining Corporation (Aris Mining or the Company) (TSX: ARIS) (NYSE-A: ARMN) today announces that it has completed its offering of US$450 million aggregate principal amount of 8.000% Senior Notes due 2029 (the "Notes"). Aris Mining intends to use the net proceeds from the offering of the Notes to fund the redemption of its outstanding 6.875% Senior Notes due in 2026 on November 20, 2024 and for working capital and general corporate purposes.

ARIS MINING ANNOUNCES PRICING OF US$450 MILLION SENIOR NOTES OFFERING TO FUND REDEMPTION OF OUTSTANDING 6.875% SENIOR NOTES
VANCOUVER, BC , Oct. 24, 2024 /PRNewswire/ - Aris Mining Corporation (Aris Mining or the Company) (TSX: ARIS) (NYSE-A: ARMN) today announces the pricing of its offering of US$450 million aggregate principal amount of 8.000% Senior Notes due 2029 (the "Notes"). The offering is expected to close on or about October 31, 2024.

ARIS MINING ANNOUNCES LAUNCH OF US$400 MILLION SENIOR NOTES OFFERING TO FUND REDEMPTION OF OUTSTANDING 6.875% SENIOR NOTES
VANCOUVER, BC , Oct. 21, 2024 /PRNewswire/ - Aris Mining Corporation (Aris Mining or the Company) (TSX: ARIS) (NYSE-A: ARMN) announced today that it has commenced an offering of US$400 million aggregate principal amount of Senior Notes due 2029 (the "Notes"). Aris Mining intends to use the net proceeds from the offering of the Notes to fund the redemption of its outstanding 6.875% Senior Notes due 2026 (the "2026 Notes") and for working capital and general corporate purposes.

Aris Water Solutions, Inc. Schedules Third Quarter 2024 Results Conference Call
HOUSTON--(BUSINESS WIRE)--Aris Water Solutions, Inc. (NYSE: ARIS) (“Aris”, “Aris Water” or the “Company”) announced today that it will host a conference call to discuss its third quarter 2024 results on Tuesday, November 5, 2024, at 8:00 a.m. Central Time (9:00 a.m. Eastern Time). Aris will issue its third quarter 2024 earnings release after market close on November 4, 2024. Participants should call (877) 407-5792 and refer to Aris Water Solutions, Inc. when dialing in. Participants are encoura.

Aris Water Solutions: One Of The Few Oases In The Desert Of The Oil Industry
Aris Water Solutions has outperformed the S&P 500 and XOP, driven by strong earnings, cost-saving measures, and effective capital allocation. The firm is effectively executing its strategy, which should translate into stronger profitability and cash generation. Middle East tensions and the U.S. presidential election could impact the oil industry, benefiting ARIS's services and demand.
Similar Companies
Related Metrics
Explore detailed financial metrics and analysis for ARIS.
