Artemis Resources Key Executives
This section highlights Artemis Resources's key executives, including their titles and compensation details.
Find Contacts at Artemis Resources
(Showing 0 of )
Artemis Resources Earnings
This section highlights Artemis Resources's earnings, including key dates, EPS, earnings reports, and earnings call transcripts.
Next Earnings Date
Last Earnings Results
Earnings Call Transcripts
| Transcript | Quarter | Year | Date | Estimated EPS | Actual EPS |
|---|
Financial Statements
Access annual & quarterly financial statements for Artemis Resources, including income statements, balance sheets, and cash flow statements..
Annual Income Statement
| Breakdown | June 30, 2024 | June 30, 2023 | June 30, 2022 | June 30, 2021 | June 30, 2020 |
|---|---|---|---|---|---|
| Revenue | $240.38K | $80.17K | $33.39K | $133.81K | $185.22K |
| Cost of Revenue | $- | $201.77K | $97.99K | $115.74K | $520.12K |
| Gross Profit | $240.38K | $-121.60K | $-64.60K | $18.07K | $-334.90K |
| Gross Profit Ratio | 100.00% | -151.68% | -193.47% | 13.51% | -180.82% |
| Research and Development Expenses | $- | $- | $- | $- | $- |
| General and Administrative Expenses | $1.06M | $1.11M | $1.14M | $3.34M | $3.73M |
| Selling and Marketing Expenses | $130.03K | $69.11K | $103.30K | $232.11K | $270.25K |
| Selling General and Administrative Expenses | $1.34M | $2.72M | $3.80M | $4.08M | $4.63M |
| Other Expenses | $- | $80.06K | $32.17K | $834.29K | $3.48M |
| Operating Expenses | $1.34M | $2.64M | $3.77M | $4.08M | $4.63M |
| Cost and Expenses | $1.34M | $2.85M | $3.86M | $4.19M | $5.15M |
| Interest Income | $- | $107 | $1.22K | $7.40K | $3.29K |
| Interest Expense | $- | $13.54K | $- | $28.46K | $705.47K |
| Depreciation and Amortization | $73.70K | $201.77K | $97.99K | $115.74K | $180.00K |
| EBITDA | $-1.24M | $-16.71M | $-3.77M | $-4.08M | $-11.39M |
| EBITDA Ratio | -516.77% | -20841.26% | -11278.62% | -3047.45% | -6148.39% |
| Operating Income | $-1.10M | $-2.85M | $-3.86M | $-4.19M | $-4.97M |
| Operating Income Ratio | -459.17% | -3550.61% | -11572.10% | -3133.95% | -2681.92% |
| Total Other Income Expenses Net | $-15.49M | $-14.08M | $-3.67M | $-6.91M | $-7.31M |
| Income Before Tax | $-16.59M | $-16.92M | $-7.53M | $-10.48M | $-12.27M |
| Income Before Tax Ratio | -6902.37% | -21109.83% | -22550.38% | -7834.41% | -6626.47% |
| Income Tax Expense | $- | $1 | $2 | $-2 | $-5 |
| Net Income | $-16.59M | $-16.92M | $-7.53M | $-10.48M | $-12.27M |
| Net Income Ratio | -6902.37% | -21109.83% | -22550.38% | -7834.41% | -6626.47% |
| EPS | $-0.01 | $-0.01 | $-0.01 | $-0.01 | $-0.01 |
| EPS Diluted | $-0.01 | $-0.01 | $-0.01 | $-0.01 | $-0.01 |
| Weighted Average Shares Outstanding | 1.65B | 1.44B | 1.31B | 1.13B | 907.19M |
| Weighted Average Shares Outstanding Diluted | 1.65B | 1.44B | 1.31B | 1.13B | 907.19M |
| SEC Filing | Source | Source | Source | Source | Source |
| Breakdown | June 30, 2024 | December 31, 2023 | June 30, 2023 | December 31, 2022 | June 30, 2022 | December 31, 2021 | June 30, 2021 | December 31, 2020 | June 30, 2020 | December 31, 2019 | June 30, 2019 | December 31, 2018 | June 30, 2018 | December 31, 2017 | June 30, 2017 | December 31, 2016 | June 30, 2016 | December 31, 2015 | June 30, 2015 | December 31, 2014 |
|---|---|---|---|---|---|---|---|---|---|---|---|---|---|---|---|---|---|---|---|---|
| Revenue | $204.70K | $35.68K | $66.33K | $13.84K | $12.45K | $20.94K | $127.70K | $9.95K | $185.22K | $- | $7.00K | $15.35K | $3.72M | $15.21M | $552.76K | $76.10K | $164.44K | $38.17K | $18.70K | $81.59K |
| Cost of Revenue | $- | $72.71K | $142.53K | $59.24K | $30.91K | $67.07K | $69.53K | $3.83K | $311.69K | $88.84K | $470.09K | $- | $54.27K | $54.54K | $161.86K | $- | $- | $- | $- | $- |
| Gross Profit | $204.70K | $-37.03K | $-76.20K | $-45.40K | $-18.47K | $-46.13K | $58.17K | $6.12K | $-126.48K | $-88.84K | $-463.09K | $15.35K | $3.66M | $15.16M | $390.90K | $76.10K | $164.44K | $38.17K | $18.70K | $81.59K |
| Gross Profit Ratio | 100.00% | -103.78% | -114.88% | -328.06% | -148.39% | -220.27% | 45.55% | 61.50% | -68.29% | - | -6615.57% | 100.00% | 98.54% | 99.64% | 70.72% | 100.00% | 100.00% | 100.00% | 100.00% | 100.00% |
| Research and Development Expenses | $- | $- | $- | $12.97M | $- | $- | $- | $- | $- | $- | $- | $- | $- | $- | $- | $- | $- | $- | $- | $- |
| General and Administrative Expenses | $614.16K | $448.36K | $1.20M | $745.85K | $881.03K | $505.86K | $2.15M | $1.19M | $2.75M | $987.63K | $2.34M | $758.97K | $1.08M | $2.23M | $496.20K | $142.23K | $207.75K | $552.14K | $890.26K | $675.30K |
| Selling and Marketing Expenses | $83.80K | $46.23K | $21.78K | $47.32K | $55.41K | $47.88K | $84.19K | $147.92K | $68.95K | $201.30K | $203.86K | $154.36K | $64.06K | $28.37K | $111.86K | $19.22K | $43.43K | $19.41K | $54.06K | $68.47K |
| Selling General and Administrative Expenses | $281.20K | $1.06M | $1.30M | $1.42M | $2.31M | $1.49M | $1.21M | $2.87M | $2.64M | $2.11M | $3.11M | $3.43M | $1.70M | $2.89M | $2.03M | $161.45K | $251.18K | $571.55K | $944.32K | $743.77K |
| Other Expenses | $- | $35.68K | $66.22K | $13.84K | $11.23K | $20.94K | $- | $- | $- | $- | $- | $- | $- | $- | $- | $- | $- | $- | $- | $- |
| Operating Expenses | $281.20K | $1.06M | $1.23M | $1.41M | $2.30M | $1.47M | $1.21M | $2.87M | $2.64M | $2.11M | $3.11M | $4.52M | $801.50K | $5.41M | $2.05M | $360.16K | $3.46M | $3.19M | $1.61M | $2.40M |
| Cost and Expenses | $281.20K | $1.06M | $1.38M | $1.47M | $2.33M | $1.54M | $1.28M | $2.91M | $2.95M | $2.20M | $3.58M | $4.52M | $855.78K | $5.46M | $2.22M | $360.16K | $3.46M | $3.19M | $1.61M | $2.40M |
| Interest Income | $- | $2.26K | $107 | $4.10K | $530 | $686 | $6.54K | $863 | $157 | $3.13K | $704.58K | $1.52M | $268.16K | $374.72K | $231.68K | $- | $745 | $33.50K | $24.26K | $20.85K |
| Interest Expense | $- | $3.04K | $9.44K | $4.10K | $- | $- | $539 | $27.92K | $4.55K | $700.91K | $- | $- | $- | $- | $- | $- | $- | $- | $- | $- |
| Depreciation and Amortization | $-19.37K | $93.06K | $142.53K | $59.24K | $30.91K | $67.07K | $69.53K | $46.22K | $91.17K | $88.84K | $56.89K | $322.52K | $202.22K | $3.00K | $-2.88M | $2.88M | $3.21M | $2.55M | $698.84K | $1.53M |
| EBITDA | $-173.32K | $-1.07M | $426.40K | $-17.13M | $-5.27M | $-2.16M | $-6.14M | $-4.20M | $-4.12M | $-7.26M | $-3.26M | $-3.76M | $1.19M | $12.18M | $-4.47M | $2.75M | $-69.59K | $-550.52K | $-857.87K | $-729.92K |
| EBITDA Ratio | -84.67% | -2995.72% | 642.85% | -123805.19% | -42317.23% | -10335.45% | -4810.72% | -42193.69% | -2224.62% | - | -46596.07% | -24484.28% | 32.11% | 80.08% | -808.34% | 3611.25% | -42.32% | -1442.29% | -4586.81% | -894.58% |
| Operating Income | $-76.50K | $-1.03M | $-1.38M | $-1.47M | $-2.33M | $-1.54M | $-1.28M | $-2.90M | $-2.77M | $-2.20M | $-3.58M | $-4.08M | $991.22K | $12.18M | $-1.59M | $-132.41K | $-3.28M | $-3.10M | $-1.56M | $-2.26M |
| Operating Income Ratio | -37.37% | -2879.03% | -2075.61% | -10619.65% | -18703.60% | -7334.00% | -1004.16% | -29174.86% | -1493.14% | - | -51084.71% | -26585.92% | 26.67% | 80.06% | -287.60% | -174.01% | -1993.73% | -8128.41% | -8323.32% | -2769.71% |
| Total Other Income Expenses Net | $-14.68M | $-804.45K | $1.65M | $-3.01M | $-2.97M | $-695.66K | $-5.27M | $-1.37M | $-1.46M | $-5.85M | $-36.32K | $-1.95M | $738.11K | $-2.90M | $-257.66K | $-198.71K | $-3.21M | $-79.51K | $-54.84K | $-76.81K |
| Income Before Tax | $-14.76M | $-1.83M | $274.43K | $-17.20M | $-5.30M | $-2.23M | $-6.21M | $-4.27M | $-4.22M | $-8.05M | $-3.32M | $-6.03M | $2.70M | $9.37M | $-1.89M | $-284.06K | $-3.30M | $-3.18M | $-1.61M | $-2.34M |
| Income Before Tax Ratio | -7210.66% | -5133.66% | 413.75% | -124262.84% | -42565.66% | -10655.70% | -4865.59% | -42939.17% | -2279.61% | - | -47450.03% | -39269.11% | 72.68% | 61.61% | -342.72% | -373.29% | -2004.01% | -8336.72% | -8616.55% | -2863.84% |
| Income Tax Expense | $- | $-134.70K | $4 | $-3 | $-4 | $-4 | $3 | $5 | $3 | $2 | $2 | $- | $- | $- | $- | $- | $- | $- | $39.93K | $39.93K |
| Net Income | $-14.76M | $-1.83M | $274.43K | $-17.20M | $-5.30M | $-2.23M | $-6.21M | $-4.27M | $-4.22M | $-8.05M | $-3.32M | $-6.03M | $2.70M | $9.37M | $-1.89M | $-284.06K | $-3.30M | $-3.18M | $-1.65M | $-2.30M |
| Net Income Ratio | -7210.66% | -5133.66% | 413.75% | -124262.84% | -42565.66% | -10655.70% | -4865.59% | -42939.17% | -2279.61% | - | -47450.03% | -39269.11% | 72.68% | 61.61% | -342.72% | -373.29% | -2004.01% | -8336.72% | -8830.03% | -2814.91% |
| EPS | $-0.01 | $0.00 | $0.00 | $-0.01 | $0.00 | $0.00 | $-0.01 | $0.00 | $0.00 | $-0.01 | $-0.01 | $-0.01 | $0.00 | $0.02 | $-0.01 | $0.00 | $-0.02 | $-0.05 | $-0.03 | $-0.04 |
| EPS Diluted | $-0.01 | $0.00 | $0.00 | $-0.01 | $0.00 | $0.00 | $-0.01 | $0.00 | $0.00 | $-0.01 | $-0.01 | $-0.01 | $0.00 | $0.02 | $-0.01 | $0.00 | $-0.02 | $-0.05 | $-0.03 | $-0.04 |
| Weighted Average Shares Outstanding | 1.66B | 1.64B | 1.57B | 1.39B | 1.33B | 1.25B | 1.14B | 1.11B | 1.03B | 804.29M | 661.99M | 639.80M | 686.38M | 512.19M | 271.99M | 177.54M | 181.44M | 66.27M | 57.67M | 57.39M |
| Weighted Average Shares Outstanding Diluted | 1.66B | 1.64B | 1.57B | 1.39B | 1.33B | 1.25B | 1.14B | 1.11B | 1.03B | 804.29M | 661.99M | 639.79M | 681.97M | 512.69M | 271.96M | 186.77M | 186.19M | 66.26M | 57.67M | 57.39M |
| SEC Filing | Source | Source | Source | Source | Source | Source | Source | Source | Source | Source | Source | Source | Source | Source | Source | Source | Source | Source | Source | Source |
Annual Balance Sheet
| Breakdown | June 30, 2024 | June 30, 2023 | June 30, 2022 | June 30, 2021 | June 30, 2020 |
|---|---|---|---|---|---|
| Cash and Cash Equivalents | $572.63K | $1.70M | $6.11M | $9.08M | $412.14K |
| Short Term Investments | $1.08M | $3.75M | $6.28M | $533.54K | $6.59M |
| Cash and Short Term Investments | $1.65M | $5.45M | $12.39M | $9.62M | $7.00M |
| Net Receivables | $88.47K | $54.08K | $104.68K | $168.64K | $6.36K |
| Inventory | $- | $- | $- | $- | $- |
| Other Current Assets | $88.22K | $69.02K | $178.03K | $1.74M | $444.00K |
| Total Current Assets | $1.83M | $5.57M | $12.67M | $11.53M | $7.45M |
| Property Plant Equipment Net | $37.34M | $15.16M | $27.67M | $23.56M | $23.57M |
| Goodwill | $- | $- | $- | $- | $- |
| Intangible Assets | $- | $3.52K | $3.52K | $33.73K | $71.68K |
| Goodwill and Intangible Assets | $- | $3.52K | $3.52K | $33.73K | $71.68K |
| Long Term Investments | $- | $- | $- | $- | $- |
| Tax Assets | $- | $- | $- | $- | $- |
| Other Non-Current Assets | $- | $32.05M | $27.32M | $26.60M | $25.77M |
| Total Non-Current Assets | $37.34M | $47.21M | $55.00M | $50.20M | $49.41M |
| Other Assets | $- | $- | $- | $- | $- |
| Total Assets | $39.17M | $52.79M | $67.67M | $61.73M | $56.86M |
| Account Payables | $1.11M | $1.53M | $2.93M | $2.64M | $1.83M |
| Short Term Debt | $47.79K | $103.38K | $44.14K | $- | $157.50K |
| Tax Payables | $- | $- | $- | $- | $- |
| Deferred Revenue | $- | $- | $- | $-157.50K | $- |
| Other Current Liabilities | $256.39K | $14.73K | $39.47K | $2.17K | $10.13K |
| Total Current Liabilities | $1.41M | $1.65M | $3.02M | $2.65M | $2.00M |
| Long Term Debt | $- | $49.58K | $109.31K | $- | $- |
| Deferred Revenue Non-Current | $- | $- | $- | $- | $- |
| Deferred Tax Liabilities Non-Current | $- | $- | $- | $- | $- |
| Other Non-Current Liabilities | $5.92M | $5.72M | $5.22M | $1.41M | $1.41M |
| Total Non-Current Liabilities | $5.92M | $5.77M | $5.33M | $1.41M | $1.41M |
| Other Liabilities | $- | $- | $- | $1 | $1 |
| Total Liabilities | $7.33M | $7.42M | $8.35M | $4.06M | $3.41M |
| Preferred Stock | $- | $- | $- | $- | $- |
| Common Stock | $120.24M | $117.40M | $114.93M | $105.89M | $92.29M |
| Retained Earnings | $-88.91M | $-72.42M | $-58.33M | $-51.56M | $-42.11M |
| Accumulated Other Comprehensive Income Loss | $499.11K | $389.36K | $2.73M | $3.35M | $3.26M |
| Other Total Stockholders Equity | $- | $- | $- | $- | $- |
| Total Stockholders Equity | $31.83M | $45.37M | $59.32M | $57.67M | $53.45M |
| Total Equity | $31.83M | $45.37M | $59.32M | $57.67M | $53.45M |
| Total Liabilities and Stockholders Equity | $39.17M | $52.79M | $67.67M | $61.73M | $56.86M |
| Minority Interest | $- | $- | $- | $- | $- |
| Total Liabilities and Total Equity | $39.17M | $52.79M | $67.67M | $61.73M | $56.86M |
| Total Investments | $1.08M | $3.75M | $6.28M | $533.54K | $6.59M |
| Total Debt | $47.79K | $152.96K | $153.45K | $157.50K | $157.50K |
| Net Debt | $-524.84K | $-1.55M | $-5.95M | $-8.93M | $-254.64K |
Balance Sheet Charts
| Breakdown | June 30, 2024 | December 31, 2023 | June 30, 2023 | December 31, 2022 | June 30, 2022 | December 31, 2021 | June 30, 2021 | December 31, 2020 | June 30, 2020 | December 31, 2019 | June 30, 2019 | December 31, 2018 | June 30, 2018 | December 31, 2017 | June 30, 2017 | December 31, 2016 | June 30, 2016 | December 31, 2015 | June 30, 2015 | December 31, 2014 |
|---|---|---|---|---|---|---|---|---|---|---|---|---|---|---|---|---|---|---|---|---|
| Cash and Cash Equivalents | $572.63K | $1.57M | $1.70M | $1.65M | $6.11M | $2.56M | $9.08M | $7.93M | $412.14K | $283.76K | $821.48K | $6.09M | $27.05M | $15.28M | $329.20K | $504.24K | $18.15K | $435.92K | $340.92K | $204.69K |
| Short Term Investments | $1.08M | $3.21M | $3.75M | $945.00K | $6.28M | $1.97M | $533.54K | $325.98K | $6.59M | $- | $- | $277.10K | $430.73K | $- | $103.90K | $- | $15.99K | $15.99K | $15.99K | $41.26K |
| Cash and Short Term Investments | $1.65M | $4.78M | $5.45M | $2.60M | $12.39M | $4.53M | $9.62M | $8.25M | $7.00M | $283.76K | $821.48K | $6.36M | $27.48M | $15.28M | $433.10K | $504.24K | $34.14K | $451.91K | $356.91K | $245.96K |
| Net Receivables | $88.47K | $121.36K | $54.08K | $572.55K | $104.68K | $- | $168.64K | $92.08K | $6.36K | $404.61K | $54.50K | $292.95K | $1.85M | $413.78K | $316.87K | $42.44K | $101.59K | $42.60K | $4.16K | $63.58K |
| Inventory | $- | $-3.33M | $- | $-1.52M | $- | $- | $- | $-92.08K | $- | $460.20K | $460.20K | $468.20K | $-2.28M | $- | $1 | $- | $-101.59K | $- | $1 | $- |
| Other Current Assets | $88.22K | $121.36K | $69.02K | $572.55K | $178.03K | $3.38M | $1.74M | $92.08K | $444.00K | $- | $199.75K | $- | $- | $- | $299.74K | $- | $- | $- | $- | $- |
| Total Current Assets | $1.83M | $4.90M | $5.57M | $3.17M | $12.67M | $7.92M | $11.53M | $8.35M | $7.45M | $1.15M | $1.54M | $7.13M | $29.33M | $15.70M | $1.05M | $546.68K | $135.73K | $494.51K | $424.50K | $309.54K |
| Property Plant Equipment Net | $37.34M | $48.06M | $15.16M | $15.42M | $27.67M | $26.26M | $23.56M | $23.56M | $23.57M | $23.64M | $60.54M | $57.54M | $40.57M | $2.72M | $9.00M | $9.00K | $1.63M | $- | $6.74M | $- |
| Goodwill | $- | $- | $- | $- | $- | $- | $- | $- | $- | $- | $- | $- | $- | $- | $- | $- | $- | $- | $- | $- |
| Intangible Assets | $- | $- | $- | $5.29K | $3.52K | $14.66K | $33.73K | $52.51K | $71.68K | $90.49K | $109.41K | $116.98K | $83.25K | $19.34M | $- | $2.00M | $1.63M | $4.68M | $6.74M | $7.37M |
| Goodwill and Intangible Assets | $- | $- | $- | $5.29K | $3.52K | $14.66K | $33.73K | $52.51K | $71.68K | $90.49K | $109.41K | $116.98K | $83.25K | $19.34M | $- | $2.00M | $1.63M | $4.68M | $6.74M | $7.37M |
| Long Term Investments | $- | $- | $- | $- | $- | $- | $- | $- | $- | $- | $- | $- | $- | $15.72M | $- | $- | $- | $- | $- | $- |
| Tax Assets | $- | $- | $- | $- | $- | $- | $- | $- | $- | $- | $- | $- | $- | $- | $- | $- | $- | $- | $- | $- |
| Other Non-Current Assets | $- | $- | $32.05M | $31.21M | $27.32M | $28.67M | $26.60M | $28.14M | $25.77M | $33.20M | $-60.65M | $-1 | $-40.66M | $-37.77M | $-9.00M | $-2.01M | $-1.63M | $-4.68M | $-6.74M | $-7.37M |
| Total Non-Current Assets | $37.34M | $48.06M | $47.21M | $46.63M | $55.00M | $54.94M | $50.20M | $51.75M | $49.41M | $56.93M | $60.65M | $57.65M | $40.66M | $37.77M | $9.00M | $2.01M | $1.63M | $4.68M | $6.74M | $7.37M |
| Other Assets | $- | $- | $- | $1 | $- | $- | $- | $- | $- | $- | $- | $- | $- | $- | $- | $- | $- | $- | $- | $- |
| Total Assets | $39.17M | $52.96M | $52.79M | $49.80M | $67.67M | $62.86M | $61.73M | $60.10M | $56.86M | $58.08M | $62.19M | $64.78M | $69.98M | $53.47M | $10.05M | $2.55M | $1.77M | $5.18M | $7.16M | $7.68M |
| Account Payables | $1.11M | $1.23M | $1.53M | $1.61M | $2.93M | $3.33M | $2.64M | $1.58M | $1.83M | $2.32M | $1.52M | $2.00M | $7.45M | $1.13M | $1.80M | $562.76K | $529.74K | $646.21K | $924.97K | $529.57K |
| Short Term Debt | $47.79K | $100.20K | $103.38K | $149.54K | $44.14K | $- | $- | $29.20K | $157.50K | $156.91K | $5.79M | $7.42M | $3.91M | $4.02M | $2.33M | $120.00K | $- | $- | $939.19K | $208.00K |
| Tax Payables | $- | $- | $- | $- | $- | $- | $- | $- | $- | $- | $- | $- | $- | $- | $- | $- | $- | $- | $- | $- |
| Deferred Revenue | $- | $1 | $- | $- | $- | $- | $- | $-29.20K | $- | $1 | $-5.79M | $- | $-3.91M | $- | $-2.33M | $-120.00K | $- | $- | $-939.19K | $- |
| Other Current Liabilities | $256.39K | $19.84K | $14.73K | $53.41K | $39.47K | $22.98K | $2.17K | $10.13K | $10.13K | $10.13K | $44.86K | $25.22K | $8.93K | $2.24M | $- | $- | $- | $- | $- | $-100 |
| Total Current Liabilities | $1.41M | $1.35M | $1.65M | $1.81M | $3.02M | $3.35M | $2.65M | $1.62M | $2.00M | $2.48M | $7.35M | $9.45M | $11.37M | $7.40M | $4.13M | $682.76K | $529.74K | $646.21K | $1.86M | $737.47K |
| Long Term Debt | $- | $- | $49.58K | $185.34K | $109.31K | $- | $- | $- | $- | $11.40K | $- | $- | $- | $1.98M | $- | $- | $- | $- | $- | $- |
| Deferred Revenue Non-Current | $- | $- | $- | $- | $- | $- | $- | $- | $- | $- | $- | $- | $- | $- | $- | $- | $- | $- | $- | $- |
| Deferred Tax Liabilities Non-Current | $- | $- | $- | $- | $- | $- | $- | $- | $- | $- | $- | $- | $- | $- | $- | $- | $- | $- | $- | $- |
| Other Non-Current Liabilities | $5.92M | $5.72M | $5.72M | $5.22M | $5.22M | $4.06M | $1.41M | $1.41M | $1.41M | $1.41M | $1.41M | $- | $- | $- | $- | $- | $- | $- | $- | $- |
| Total Non-Current Liabilities | $5.92M | $5.72M | $5.77M | $5.41M | $5.33M | $4.06M | $1.41M | $1.41M | $1.41M | $1.42M | $1.41M | $- | $- | $1.98M | $- | $- | $- | $- | $- | $- |
| Other Liabilities | $- | $- | $- | $- | $- | $- | $1 | $1 | $1 | $- | $1 | $- | $- | $- | $- | $- | $- | $- | $- | $0 |
| Total Liabilities | $7.33M | $7.07M | $7.42M | $7.22M | $8.35M | $7.42M | $4.06M | $3.04M | $3.41M | $3.91M | $8.77M | $9.45M | $11.37M | $9.38M | $4.13M | $682.76K | $529.74K | $646.21K | $1.86M | $737.47K |
| Preferred Stock | $- | $- | $- | $- | $- | $- | $- | $- | $- | $- | $- | $- | $- | $- | $- | $- | $- | $- | $- | $- |
| Common Stock | $120.24M | $119.54M | $117.40M | $115.01M | $114.93M | $105.86M | $105.89M | $98.91M | $92.29M | $89.70M | $81.44M | $80.65M | $79.13M | $67.76M | $39.07M | $33.29M | $32.37M | $32.37M | $29.96M | $29.91M |
| Retained Earnings | $-88.91M | $-74.14M | $-72.42M | $-74.54M | $-58.33M | $-53.80M | $-51.56M | $-46.38M | $-42.11M | $-37.61M | $-30.59M | $-27.27M | $-21.24M | $-23.94M | $-33.32M | $-31.42M | $-31.14M | $-27.97M | $-24.78M | $-23.13M |
| Accumulated Other Comprehensive Income Loss | $499.11K | $487.65K | $389.36K | $2.12M | $2.73M | $3.38M | $3.35M | $4.53M | $3.26M | $2.08M | $2.57M | $1.95M | $725.00K | $272.25K | $172.00K | $-0 | $- | $125.00K | $125.00K | $156.28K |
| Other Total Stockholders Equity | $- | $- | $- | $- | $- | $- | $- | $- | $- | $1 | $- | $- | $- | $- | $- | $0 | $- | $- | $- | $- |
| Total Stockholders Equity | $31.83M | $45.89M | $45.37M | $42.58M | $59.32M | $55.44M | $57.67M | $57.06M | $53.45M | $54.17M | $53.42M | $55.33M | $58.61M | $44.09M | $5.92M | $1.87M | $1.24M | $4.53M | $5.30M | $6.93M |
| Total Equity | $31.83M | $45.89M | $45.37M | $42.58M | $59.32M | $55.44M | $57.67M | $57.06M | $53.45M | $54.17M | $53.42M | $55.33M | $58.61M | $44.09M | $5.92M | $1.87M | $1.24M | $4.53M | $5.30M | $6.93M |
| Total Liabilities and Stockholders Equity | $39.17M | $52.96M | $52.79M | $49.80M | $67.67M | $62.86M | $61.73M | $60.10M | $56.86M | $58.08M | $62.19M | $64.78M | $69.98M | $53.47M | $10.05M | $2.55M | $1.77M | $5.18M | $7.16M | $7.68M |
| Minority Interest | $- | $- | $- | $- | $- | $- | $- | $- | $- | $- | $- | $- | $- | $- | $- | $- | $- | $- | $- | $- |
| Total Liabilities and Total Equity | $39.17M | $52.96M | $52.79M | $49.80M | $67.67M | $62.86M | $61.73M | $60.10M | $56.86M | $58.08M | $62.19M | $64.78M | $69.98M | $53.47M | $10.05M | $2.55M | $1.77M | $5.18M | $7.16M | $7.68M |
| Total Investments | $1.08M | $3.21M | $3.75M | $945.00K | $6.28M | $1.97M | $533.54K | $325.98K | $6.59M | $- | $- | $277.10K | $430.73K | $15.72M | $103.90K | $- | $15.99K | $15.99K | $15.99K | $41.26K |
| Total Debt | $47.79K | $100.20K | $152.96K | $334.88K | $153.45K | $- | $- | $29.20K | $157.50K | $168.31K | $5.79M | $7.42M | $3.91M | $6.01M | $2.33M | $120.00K | $- | $- | $939.19K | $208.00K |
| Net Debt | $-524.84K | $-1.47M | $-1.55M | $-1.32M | $-5.95M | $-2.56M | $-9.08M | $-7.90M | $-254.64K | $-115.45K | $4.97M | $1.33M | $-23.13M | $-9.28M | $2.00M | $-384.24K | $-18.15K | $-435.92K | $598.27K | $3.31K |
Annual Cash Flow
| Breakdown | June 30, 2024 | June 30, 2023 | June 30, 2022 | June 30, 2021 | June 30, 2020 |
|---|---|---|---|---|---|
| Net Income | $-16.59M | $-16.92M | $-7.53M | $-10.48M | $-12.27M |
| Depreciation and Amortization | $- | $201.77K | $97.99K | $115.74K | $180.00K |
| Deferred Income Tax | $- | $-2.05M | $18.94K | $-995.49K | $-930.49K |
| Stock Based Compensation | $- | $475.30K | $112.20K | $1.40M | $1.86M |
| Change in Working Capital | $146.42K | $-668.80K | $327.11K | $637.00K | $1.29M |
| Accounts Receivables | $- | $159.60K | $26.84K | $-139.41K | $84.12K |
| Inventory | $- | $- | $- | $- | $460.20K |
| Accounts Payables | $- | $-1.33M | $300.27K | $776.40K | $743.52K |
| Other Working Capital | $146.42K | $500.00K | $- | $- | $- |
| Other Non Cash Items | $14.64M | $16.09M | $3.11M | $7.39M | $7.79M |
| Net Cash Provided by Operating Activities | $-1.81M | $-2.87M | $-3.86M | $-1.93M | $-2.09M |
| Investments in Property Plant and Equipment | $-2.45M | $-6.02M | $-8.15M | $-9.81M | $-3.00M |
| Acquisitions Net | $- | $1.50K | $- | $- | $- |
| Purchases of Investments | $- | $-224.50K | $-224.50K | $-508.94K | $- |
| Sales Maturities of Investments | $- | $2.21M | $308.60K | $7.41M | $820.00K |
| Other Investing Activities | $- | $224.50K | $500.00K | $369.00K | $820.00K |
| Net Cash Used for Investing Activities | $-2.45M | $-3.80M | $-7.57M | $-2.54M | $-2.18M |
| Debt Repayment | $- | $- | $- | $-116.67K | $-5.39M |
| Common Stock Issued | $3.43M | $2.38M | $9.01M | $13.30M | $9.35M |
| Common Stock Repurchased | $-185.10K | $-166.99K | $-436.59K | $-608.83K | $-529.63K |
| Dividends Paid | $- | $- | $- | $- | $- |
| Other Financing Activities | $-109.92K | $-98.54K | $-13.12K | $-40.82K | $-100.95K |
| Net Cash Used Provided by Financing Activities | $3.13M | $2.28M | $8.99M | $13.15M | $3.86M |
| Effect of Forex Changes on Cash | $-1.85K | $-9.95K | $-539.53K | $1.52K | $1.09K |
| Net Change in Cash | $-1.13M | $-4.40M | $-2.98M | $8.67M | $-409.34K |
| Cash at End of Period | $572.63K | $1.70M | $6.11M | $9.08M | $412.14K |
| Cash at Beginning of Period | $1.70M | $6.11M | $9.08M | $412.14K | $821.48K |
| Operating Cash Flow | $-1.81M | $-2.87M | $-3.86M | $-1.93M | $-2.09M |
| Capital Expenditure | $-2.45M | $-6.02M | $-8.15M | $-9.81M | $-3.00M |
| Free Cash Flow | $-4.26M | $-8.89M | $-12.01M | $-11.74M | $-5.09M |
Cash Flow Charts
| Breakdown | June 30, 2024 | December 31, 2023 | June 30, 2023 | December 31, 2022 | June 30, 2022 | December 31, 2021 | June 30, 2021 | December 31, 2020 | June 30, 2020 | December 31, 2019 | June 30, 2019 | December 31, 2018 | June 30, 2018 | December 31, 2017 | June 30, 2017 | December 31, 2016 | June 30, 2016 | December 31, 2015 | June 30, 2015 | December 31, 2014 |
|---|---|---|---|---|---|---|---|---|---|---|---|---|---|---|---|---|---|---|---|---|
| Net Income | $-14.76M | $-1.83M | $274.43K | $-17.20M | $-5.30M | $-2.23M | $-6.21M | $-4.27M | $-4.22M | $-8.05M | $-3.32M | $-6.03M | $2.70M | $9.37M | $-1.89M | $-284.06K | $-3.30M | $-3.18M | $-1.65M | $-2.30M |
| Depreciation and Amortization | $86.42K | $93.06K | $142.53K | $59.24K | $30.91K | $67.07K | $69.53K | $46.22K | $91.17K | $88.84K | $56.89K | $322.52K | $202.22K | $3.00K | $2.00K | $- | $3.21M | $2.55M | $698.84K | $1.53M |
| Deferred Income Tax | $- | $- | $-546.65K | $- | $-200.87K | $- | $-124.64K | $- | $-2.15M | $- | $-1.33M | $- | $-1.78M | $- | $-756.98K | $- | $- | $- | $-33.08K | $- |
| Stock Based Compensation | $-141.28K | $211.28K | $102.00K | $373.30K | $112.20K | $- | $124.99K | $1.28M | $1.42M | $439.06K | $1.62M | $1.90M | $2.07M | $272.25K | $1.27M | $- | $- | $- | $46.50K | $- |
| Change in Working Capital | $146.42K | $- | $659.60K | $- | $26.84K | $- | $-139.41K | $- | $544.32K | $- | $-291.21K | $- | $-288.41K | $- | $-515.02K | $- | $-34.01K | $- | $-13.42K | $- |
| Accounts Receivables | $-53.58K | $- | $159.60K | $- | $26.84K | $- | $-139.41K | $- | $84.12K | $- | $169.00K | $- | $-288.41K | $- | $-515.02K | $- | $-34.01K | $- | $-13.42K | $- |
| Inventory | $- | $- | $- | $- | $- | $- | $- | $- | $460.20K | $- | $-460.20K | $- | $- | $- | $- | $- | $- | $- | $- | $- |
| Accounts Payables | $- | $- | $- | $- | $- | $- | $- | $- | $- | $- | $- | $- | $- | $- | $- | $- | $- | $- | $- | $- |
| Other Working Capital | $200.00K | $- | $500.00K | $- | $- | $- | $- | $- | $- | $- | $- | $- | $- | $- | $- | $- | $- | $- | $- | $- |
| Other Non Cash Items | $13.81M | $571.21K | $-1.53M | $15.79M | $2.52M | $1.24M | $6.02M | $2.65M | $3.31M | $7.06M | $921.40K | $1.67M | $-6.31M | $-11.46M | $202.83K | $221.38K | $-57.23K | $-6.13K | $342.27K | $-72.02K |
| Net Cash Provided by Operating Activities | $-853.58K | $-956.13K | $-1.40M | $-1.47M | $-2.81M | $-1.05M | $-263.78K | $-1.67M | $-1.00M | $-1.08M | $-2.46M | $-2.14M | $-1.63M | $-1.81M | $-932.63K | $-62.68K | $-177.74K | $-636.17K | $-577.29K | $-838.82K |
| Investments in Property Plant and Equipment | $-1.19M | $-1.26M | $-871.15K | $-5.14M | $-2.91M | $-5.24M | $-4.93M | $-4.88M | $-1.67M | $-1.33M | $8.71M | $-22.08M | $-14.15M | $-5.02M | $-3.82M | $-281.89K | $-401.25K | $-185.11K | $-290.83K | $-544.33K |
| Acquisitions Net | $- | $- | $1.50K | $- | $- | $- | $-369.00K | $369.00K | $-20.27K | $20.27K | $- | $- | $- | $-1.50M | $- | $- | $- | $- | $- | $- |
| Purchases of Investments | $- | $- | $- | $- | $- | $-224.50K | $-264.74K | $-244.21K | $-799.73K | $- | $- | $- | $- | $- | $- | $- | $- | $- | $- | $- |
| Sales Maturities of Investments | $- | $- | $- | $2.21M | $308.60K | $- | $77.70K | $7.33M | $820.00K | $- | $208.88K | $- | $- | $- | $- | $- | $- | $- | $- | $- |
| Other Investing Activities | $- | $- | $1.50K | $2.21M | $500.00K | $-224.50K | $369.00K | $7.45M | $799.73K | $20.27K | $215.63K | $- | $20.11M | $-589.42K | $100.00K | $62.24K | $161.22K | $104.19K | $273.16K | $215.06K |
| Net Cash Used for Investing Activities | $-1.19M | $-1.26M | $-869.65K | $-2.93M | $-2.10M | $-5.47M | $-5.12M | $2.58M | $-871.76K | $-1.31M | $-1.78M | $-22.08M | $5.96M | $-7.11M | $-3.72M | $-219.66K | $-240.03K | $-80.92K | $-17.67K | $-329.27K |
| Debt Repayment | $- | $-55.80K | $- | $-35.54K | $- | $- | $- | $- | $- | $-68.12K | $-1.03M | $- | $- | $- | $- | $- | $- | $- | $- | $- |
| Common Stock Issued | $843.74K | $2.14M | $2.38M | $- | $9.01M | $- | $6.69M | $6.61M | $2.26M | $7.09M | $202.49K | $- | $- | $- | $- | $- | $- | $- | $- | $- |
| Common Stock Repurchased | $- | $- | $- | $- | $- | $- | $- | $- | $- | $- | $- | $- | $- | $- | $- | $- | $- | $- | $- | $- |
| Dividends Paid | $- | $- | $- | $- | $- | $- | $- | $- | $- | $- | $- | $- | $- | $- | $- | $- | $- | $- | $- | $- |
| Other Financing Activities | $1.05M | $2.14M | $2.32M | $- | $8.99M | $- | $6.54M | $6.61M | $2.00M | $1.92M | $- | $3.03M | $7.21M | $23.88M | $4.48M | $768.43K | $- | $812.09K | $731.19K | $621.29K |
| Net Cash Used Provided by Financing Activities | $1.05M | $2.09M | $2.32M | $-35.54K | $8.99M | $- | $6.54M | $6.61M | $2.00M | $1.86M | $-1.03M | $3.03M | $7.21M | $23.88M | $4.48M | $768.43K | $- | $812.09K | $731.19K | $621.29K |
| Effect of Forex Changes on Cash | $210 | $-2.06K | $2.67K | $-12.62K | $-539.53K | $- | $1.52K | $412.14K | $1.09K | $821.48K | $-3.24K | $226.12K | $226.30K | $329.20K | $-329.20K | $18.15K | $- | $340.92K | $-340.92K | $751.50K |
| Net Change in Cash | $-998.26K | $-132.13K | $50.23K | $-4.45M | $3.54M | $-6.52M | $1.15M | $7.52M | $128.38K | $-537.72K | $-5.27M | $-20.96M | $11.77M | $15.28M | $-504.24K | $504.24K | $-417.77K | $435.92K | $-204.69K | $204.69K |
| Cash at End of Period | $572.63K | $1.57M | $1.70M | $1.65M | $6.11M | $2.56M | $9.08M | $7.93M | $412.14K | $283.76K | $821.48K | $6.09M | $27.05M | $15.28M | $- | $504.24K | $18.15K | $435.92K | $- | $204.69K |
| Cash at Beginning of Period | $1.57M | $1.70M | $1.65M | $6.11M | $2.56M | $9.08M | $7.93M | $412.14K | $283.76K | $821.48K | $6.09M | $27.05M | $15.28M | $- | $504.24K | $- | $435.92K | $- | $204.69K | $- |
| Operating Cash Flow | $-853.58K | $-956.13K | $-1.40M | $-1.47M | $-2.81M | $-1.05M | $-263.78K | $-1.67M | $-1.00M | $-1.08M | $-2.46M | $-2.14M | $-1.63M | $-1.81M | $-932.63K | $-62.68K | $-177.74K | $-636.17K | $-577.29K | $-838.82K |
| Capital Expenditure | $-1.19M | $-1.26M | $-871.15K | $-5.14M | $-2.91M | $-5.24M | $-4.93M | $-4.88M | $-1.67M | $-1.33M | $8.71M | $-22.08M | $-14.15M | $-5.02M | $-3.82M | $-281.89K | $-401.25K | $-185.11K | $-290.83K | $-544.33K |
| Free Cash Flow | $-2.04M | $-2.22M | $-2.27M | $-6.61M | $-5.72M | $-6.30M | $-5.20M | $-6.55M | $-2.68M | $-2.41M | $6.25M | $-24.22M | $-15.78M | $-6.83M | $-4.75M | $-344.57K | $-578.99K | $-821.28K | $-868.12K | $-1.38M |

Artemis Resources Limited engages in the exploration and development of mineral properties. The company explores for gold, nickel, cobalt, and copper deposits. Its flagship projects include the Carlow Castle Gold-Copper-Cobalt project located in the West Pilbara region of Western Australia; and the Paterson Central Gold-Copper project covering an area of approximately 605 square kilometers located in the Yaneena Basin of the Paterson Province, Western Australia. Artemis Resources Limited was incorporated in 2003 and is based in Subiaco, Australia.
$0.01
Stock Price
$15.17M
Market Cap
-
Employees
Subiaco, WA
Location
Revenue (FY 2024)
$240.38K
199.8% YoY
Net Income (FY 2024)
$-16.59M
2.0% YoY
EPS (FY 2024)
$-0.01
14.5% YoY
Free Cash Flow (FY 2024)
$-4.26M
52.0% YoY
Profitability
Gross Margin
100.0%
Net Margin
-6902.4%
ROE
-52.1%
ROA
-42.4%
Valuation
P/E Ratio
-1.19
P/S Ratio
82.46
EV/EBITDA
-15.53
Market Cap
$15.17M
Revenue & Net Income
Profit Margins
Cash Flow Summary
Operating Cash Flow
$-1.81M
37.0% YoY
Free Cash Flow
$-4.26M
52.0% YoY
Balance Sheet Summary
Total Assets
$39.17M
-25.8% YoY
Total Debt
$47.79K
68.8% YoY
Shareholder Equity
$31.83M
-38.6% YoY
Dividend Overview
No Dividend Data
Artemis Resources Limited doesn't currently pay dividends.
Artemis Resources Dividends
Explore Artemis Resources's dividend history, including dividend yield, payout ratio, and historical payments.
Artemis Resources News
Read the latest news about Artemis Resources, including recent articles, headlines, and updates.
Artemis Resources to kick off substantial Pilbara gold exploration program
Artemis Resources Ltd is planning a substantial drilling program to test high-priority gold exploration targets at Carlow tenement within the Karratha Gold Project in the North Pilbara gold province of Western Australia. Artemis expects to begin a diamond and reverse circulation (RC) drilling program in early February, testing several compelling targets within a 4-kilometre-long northwest trending zone centred around the company’s Carlow mineral resource estimate (MRE). While close to the Carlow resource, the targets to be drilled in the current quarter have never been tested. The Carlow MRE of 704,000 ounces gold equivalent (AuEq), includes 374,000 ounces of gold and 64,000 tonnes of copper, and remains open. Artemis tenements in Pilbara region with Carlow Tenement hatched “As a result of the excellent work completed by the Karratha exploration team during 2024 and following the announced capital raising in December, Artemis is now in a strong position to undertake drilling of some exciting targets at the Karratha Gold Project”, said recently appointed managing director Julian Hanna. “Exploration in the following months will be focused on the Carlow Tenement which hosts a significant gold-copper resource at Carlow and covers a wide range of exploration targets within a wide, prospective corridor with minimal previous drilling. “I look forward to working closely with the very experienced and committed team at Artemis and updating shareholders with results from the drilling in due course.” Having recently raised $4 million via a share placement, the company is well-funded to drill priority targets around Carlow and progress other promising gold targets. The first of the planned drill holes will test the large Marillion electro-magnetic (EM) conductor 500 metres east of the Carlow resource, near the base of the Andover Intrusion. Diamond drilling will then test the potential for significant extensions to the Carlow resource, down plunge from previous high-grade gold intersections. Marillion is a large, highly conductive electro-magnetic (FLTEM) anomaly modelled by the company’s consulting geophysicist as a 500-metre-long, circa 11,000 siemens conductor with the top at around 350 metres vertical depth. Marillion is undrilled and the source of the conductive anomaly is unknown. Carlow resource long section showing high-grade gold intersections in the East zone and proposed diamond drill holes. Marillion EM conductor is projected south onto the Carlow section. Drilling is planned to start in early February with the first drill hole designed to test the centre of the Marillion EM anomaly for possible sulphide-hosted mineralisation. Artemis says Marillion may represent an extension of the Carlow gold/copper deposit offset more than 500 metres by a fault, or represent a possible sulphide accumulation at the interpreted base of the Andover Intrusion which is mapped in outcrop near Marillion. RC drilling is then planned across the Titan Prospect, 2-kilometres northwest of Carlow, as an initial test of widespread high-grade gold occurrences at surface. Titan was the subject of several surface rock chip sampling programs during 2024. These programs delivered very high-grade gold assay results from selected samples of quartz/ironstone veins and gossanous chert outcrops in several areas at Titan. Assays from outcrops of chert and quartz/ironstone veins include 51.8 g/t of gold and 41.4 g/t of gold, with nine other samples assaying greater than 4 g/t gold. There is no known drilling of the surface gold occurrences. Titan Prospect - outcrop of brecciated and banded chert (approx. 5 metres wide) with thin stockwork iron oxide veining. Artemis says that surface gold occurrences at Titan may be associated with a large gravity-low feature surrounded by chert outcrops, interpreted major faults and thrusts. The known surface gold occurrences appear to be associated with a 2-kilometre-long gravity-low feature in the centre of the Carlow Tenement, the source of which is unknown. An initial program of shallow RC drilling at Titan is planned to start in the current quarter, subject to access approvals over some areas. The RC program is planned to test down dip from the surface gold occurrences, test the central gravity-low feature and provide geological and geochemical data to support deeper drilling programs. Artemis has planned for a conceptual open pit study to be carried out by an independent consulting group based on the existing October 2022 Carlow MRE. The total mineral resource at Carlow includes an Inferred open pit resource of 7.25 million tonnes at 1.3 g/t gold for 296,000 ounces of gold, contained within an optimised pit shell. While the Karratha Gold Project remains Artemis’s core asset, the company is working to identify other high-quality exploration targets with potential for the discovery of major mineral deposits. Priorities are for targets which can be acquired and tested at relatively low cost. Artemis recently applied for an exploration licence — the Cassowary Intrusion 440 kilometres east of Kalgoorlie — to cover an interpreted intrusion with potential for IOCG copper-gold mineralisation. Once the tenement is granted, exploration will test the potential for IOCG-type copper/gold mineralisation which may be associated with the intrusion. A high-resolution magnetic and gravity survey will probably be used to assist drill targeting. As it announces the largest acquisition in its history, Diversified Energy Company PLC (LSE:DEC, NYSE:DEC) is a ‘buy’, according to stockbroker Peel Hunt. DEC has not been a stranger to deal-making as M&A has driven much of its growth since it floated on the London Stock Exchange in 2016 – when it came to market with a $50 million raise and a £69 million market cap. Today, acquiring Maverick Natural Resources for its portfolio of Anadarko and Permian basin assets, in a deal worth $1.2 billion, the London-listed firm is practically set to double in size. DEC today announced the deal that takes production to around 200,000 boepd and boosts revenue by 95% (and free cash flow by 55%). Peel Hunt analyst Sam Wahab described the acquisition metrics as ‘compelling’ and highlighted that the deal transforms DEC, in terms of scale, and also materially enhances margins. “Today’s proposed transaction represents a significant deal for DEC, marking the company as the largest consolidator of mature assets in the US,” Wahab said in a note. Whilst the analyst noted that his model will need updating to account for the transformational deal, he currently rates DEC as a ‘Buy’ with a price target of £30.00, compared to Monday’s share price of £13.03. Creates long-term cash generation DEC, in this morning’s statement, told investors that the deal adds immediate scale, increases liquids production, and creates a combined company with long-term free cash flow generation, superior unit cash margins, and a compelling sustainability profile. It sees the production profile increase to around 200,000 barrels of oil equivalent per day. "This acquisition expands our unique and highly focused energy production company with a complementary portfolio of attractive, high-quality assets,” chief executive Rusty Hutson said in a statement. “We have a proven track record of unlocking value from acquisitions while maintaining our commitment to sustainability leadership, and this acquisition provides us with great assets and employees that complement this strategy.” “The acquired producing assets have demonstrated leading well performance and are a natural fit with our operating advantage and existing acreage.” Hutson added: “Notably, the combined footprint in Oklahoma and the Western Anadarko Basin creates one of the largest in terms of production and acreage, which includes the emerging Cherokee formation.” Meanwhile, Maverick chief executive Rick Gideon said: Maverick has built a strong foundation of execution and efficiency across our portfolio, and we look forward to combining our complementary portfolio of assets with Diversified.” What’s in the deal? To acquire Maverick, DEC is to assume some $700 million of the company’s debt plus a mix of cash and shares to satisfy the balance ($207 million of cash, $345 million of shares). The combined company will be led by Rusty Hutson. It is expected that the transaction will close in the first half of 2025.
Artemis Resources appoints exploration heavyweight as technical director
Artemis Resources Ltd (ASX:ARV, AIM:ARV, OTCQB:ARTTF) has appointed mining veteran Julian Hanna as its technical director. Hanna led nickel miner Western Areas from a start-up to its subsequent acquisition twelve years later by IGO (IGO Limited (ASX:IGO)) in June 2022 for A$1 billion after which he joined junior explorer MOD Resources as managing director.

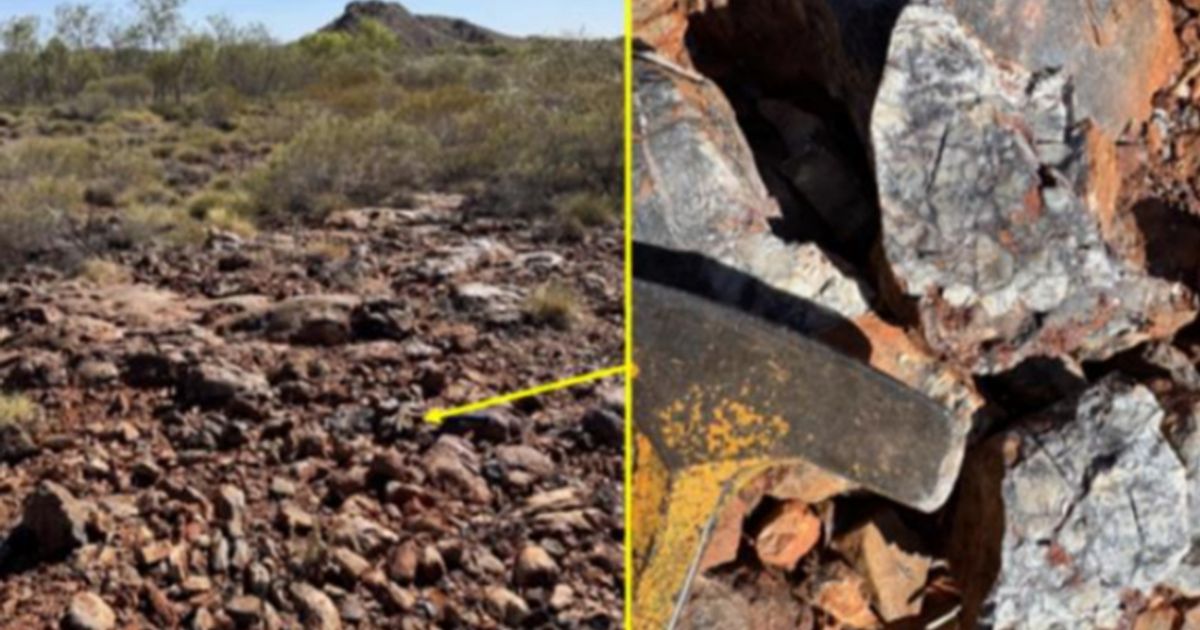
Artemis Resources unearths rock chips up to 45.8 g/t gold and 10.3% copper at Thorpe prospect, Karratha Project
Artemis Resources Ltd (ASX:ARV, AIM:ARV, OTCQB:ARTTF) has delivered promising gold and copper grades in rock chip sampling at Karratha Gold Project’s Thorpe prospect in the Pilbara region of Western Australia, with results up to 45.8 g/t gold and 10.3% copper. The company was targeting outcropping mineralised veins across the Carlow tenement, expanding the gold footprint while also defining priority targets for drilling programs to explore. “We are very excited that prospects located on the Carlow tenement continue to deliver further high-grade gold, copper and silver results from extensive veins at surface,” Artemis Resources executive director George Ventouras said. “While several of these prospects have had minor drilling programs, the exploration team continues to compile data to identify the source of the widespread gold discovered at surface. “Combined with the Titan prospect and other targets in the immediate Carlow area, the future looks very bright for the Karratha Gold Project.” Rock chip results of note included: Artemis plans to commence drilling of key targets within the Carlow tenement starting in early 2025, subject to heritage clearance and other regulatory requirements. The company has commenced the process for surveys of areas not already cleared.
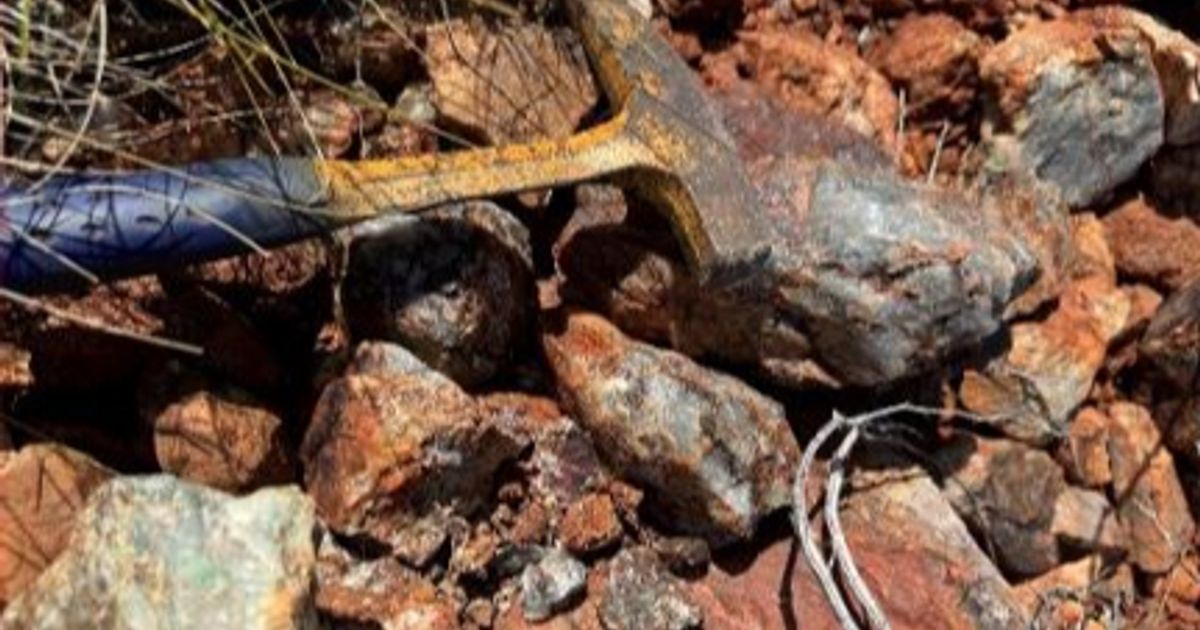
Artemis Resources up 80% as it pulls gold whopper from Titan
Artemis Resources Ltd (ASX:ARV, AIM:ARV, OTCQB:ARTTF) jumped more than 80% as the explorer pulled a rock chip as big as a child's fist and packed with gold from its Titan prospect in Pilbara, Western Australia. The big sample registered more than 10,000 g/t gold, which was the limit of the measuring equipment.

Artemis Resources expands gold exploration in West Pilbara amid favorable market conditions
Artemis Resources Ltd (ASX:ARV, AIM:ARV, OTCQB:ARTTF) executive director George Ventouras tells Proactie's Stephen Gunnion that a review of the company's Karratha Gold Precinct coincides perfectly with the recent rally in the gold price to record levels. The Karratha Gold Precinct in the West Pilbara region includes the discovery of a significant resource at the Carlow tenement, which boasts over 700,000-ounce equivalents of high-grade gold.

Artemis Resources shares set alight on exploration update
Artemis Resources Ltd (ASX:ARV, AIM:ARV, OTCQB:ARTTF) was a top mover in the junior mining segment after today providing an exploration update on its projects in West Pilbara, focusing on the potential of its Kobe and Osborne sites for lithium extraction. Recent drilling has revealed sub-vertical orientations of pegmatites at these locations, with one drill hole possibly stopping short of the Osborne target.

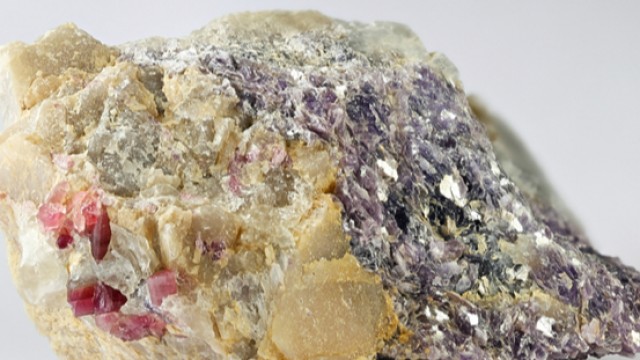
Artemis Resources confirms ‘significant' lithium mineralisation in West Pilbara
Artemis Resources Ltd (ASX:ARV, AIM:ARV, OTCQB:ARTTF) has provided an exploration update on its projects in West Pilbara, focusing on the potential of its Kobe and Osborne sites for lithium extraction. Recent drilling has revealed sub-vertical orientations of pegmatites at these locations, with one drill hole possibly stopping short of the Osborne target.

Artemis Resources increasing activity across portfolio
Artemis Resources said it is waiting for assay results from the recent drilling at the Osborne joint venture in Western Australia. Three diamond drill holes were completed at Osborne including two at the Southern pegmatite trend and one at the Kobe pegmatite trend with pegmatite intersections up to 24.6m thick, 550m down dip of Osborne trend lithium pegmatite surface outcrops.
Similar Companies
Related Metrics
Explore detailed financial metrics and analysis for ARTTF.