Arizona Sonoran Copper Key Executives
This section highlights Arizona Sonoran Copper's key executives, including their titles and compensation details.
Find Contacts at Arizona Sonoran Copper
(Showing 0 of )
Arizona Sonoran Copper Earnings
This section highlights Arizona Sonoran Copper's earnings, including key dates, EPS, earnings reports, and earnings call transcripts.
Next Earnings Date
Last Earnings Results
Earnings Call Transcripts
| Transcript | Quarter | Year | Date | Estimated EPS | Actual EPS |
|---|

Arizona Sonoran Copper Company Inc. engages in the identification, acquisition, exploration, development, and production of base metal properties. The company's principal asset is the 100% interest in the Cactus Project located in Pinal County, Arizona. The company was formerly known as Elim Mining Incorporated and changed its name to Arizona Sonoran Copper Company Inc. in July 2021. Arizona Sonoran Copper Company Inc. was incorporated in 2019 and is based in Tempe, Arizona.
$1.66
Stock Price
$246.36M
Market Cap
-
Employees
Tempe, AZ
Location
Financial Statements
Access annual & quarterly financial statements for Arizona Sonoran Copper, including income statements, balance sheets, and cash flow statements..
Annual Income Statement
| Breakdown | December 31, 2023 | December 31, 2022 | December 31, 2021 | December 31, 2020 | December 31, 2019 |
|---|---|---|---|---|---|
| Revenue | $- | $- | $- | $- | $- |
| Cost of Revenue | $63.00K | $84.00K | $75.00K | $17.00K | $- |
| Gross Profit | $-63.00K | $-84.00K | $-75.00K | $-17.00K | $- |
| Gross Profit Ratio | 0.00% | 0.00% | 0.00% | 0.00% | 0.00% |
| Research and Development Expenses | $- | $- | $- | $- | $- |
| General and Administrative Expenses | $1.23M | $5.87M | $8.40M | $2.74M | $1.09M |
| Selling and Marketing Expenses | $5.12M | $1.10M | $2.01M | $- | $1.84M |
| Selling General and Administrative Expenses | $6.34M | $6.96M | $8.40M | $2.74M | $1.84M |
| Other Expenses | $- | $6.00K | $5.00K | $- | $- |
| Operating Expenses | $6.41M | $6.96M | $8.40M | $2.74M | $1.84M |
| Cost and Expenses | $6.52M | $7.05M | $8.47M | $2.75M | $1.84M |
| Interest Income | $874.75K | $316.00K | $11.00K | $4.00K | $- |
| Interest Expense | $16.29K | $375.00K | $3.99M | $2.35M | $- |
| Depreciation and Amortization | $113.03K | $80.67K | $74.34K | $17.90K | $2.22M |
| EBITDA | $-6.99M | $-6.40M | $-8.38M | $-2.74M | $375.08K |
| EBITDA Ratio | 0.00% | 0.00% | 0.00% | 0.00% | 0.00% |
| Operating Income | $-6.34M | $-6.96M | $-8.40M | $-2.74M | $-1.84M |
| Operating Income Ratio | 0.00% | 0.00% | 0.00% | 0.00% | 0.00% |
| Total Other Income Expenses Net | $-776.17K | $-158.00K | $-4.66M | $-2.37M | $2 |
| Income Before Tax | $-7.12M | $-7.12M | $-13.06M | $-5.10M | $-1.84M |
| Income Before Tax Ratio | 0.00% | 0.00% | 0.00% | 0.00% | 0.00% |
| Income Tax Expense | $- | $381.00K | $3.99M | $-13.00K | $-2.22K |
| Net Income | $-7.12M | $-7.12M | $-13.06M | $-5.10M | $-1.84M |
| Net Income Ratio | 0.00% | 0.00% | 0.00% | 0.00% | 0.00% |
| EPS | $-0.07 | $-0.09 | $-0.28 | $-0.19 | $-0.07 |
| EPS Diluted | $-0.07 | $-0.09 | $-0.28 | $-0.19 | $-0.07 |
| Weighted Average Shares Outstanding | 105.49M | 82.28M | 46.99M | 27.00M | 27.00M |
| Weighted Average Shares Outstanding Diluted | 105.49M | 82.28M | 46.99M | 27.00M | 27.00M |
| SEC Filing | Source | Source | Source | Source | Source |
| Breakdown | September 30, 2024 | June 30, 2024 | March 31, 2024 | December 31, 2023 | September 30, 2023 | June 30, 2023 | March 31, 2023 | December 31, 2022 | September 30, 2022 | June 30, 2022 | March 31, 2022 | December 31, 2021 | September 30, 2021 | June 30, 2021 | March 31, 2021 | December 31, 2020 | September 30, 2020 | June 30, 2020 | March 31, 2020 |
|---|---|---|---|---|---|---|---|---|---|---|---|---|---|---|---|---|---|---|---|
| Revenue | $- | $- | $- | $- | $- | $- | $- | $- | $- | $- | $- | $- | $- | $- | $- | $- | $- | $- | $- |
| Cost of Revenue | $16.00K | $17.00K | $28.87K | $28.77K | $16.00K | $3.00K | $28.00K | $17.00K | $23.00K | $24.00K | $20.00K | $21.00K | $18.00K | $19.00K | $17.00K | $8.00K | $- | $- | $- |
| Gross Profit | $-16.00K | $-17.00K | $-28.87K | $-28.77K | $-16.00K | $-3.00K | $-28.00K | $-17.00K | $-23.00K | $-24.00K | $-20.00K | $-21.00K | $-18.00K | $-19.00K | $-17.00K | $-8.00K | $- | $- | $- |
| Gross Profit Ratio | 0.00% | 0.00% | 0.00% | 0.00% | 0.00% | 0.00% | 0.00% | 0.00% | 0.00% | 0.00% | 0.00% | 0.00% | 0.00% | 0.00% | 0.00% | 0.00% | 0.00% | 0.00% | 0.00% |
| Research and Development Expenses | $- | $- | $- | $- | $- | $- | $- | $- | $- | $- | $- | $- | $- | $- | $- | $- | $- | $- | $- |
| General and Administrative Expenses | $1.13M | $324.00K | $943.00K | $2.25M | $913.00K | $975.00K | $1.25M | $1.12M | $977.00K | $1.57M | $2.20M | $1.82M | $2.01M | $3.34M | $789.00K | $1.03M | $537.00K | $660.00K | $268.00K |
| Selling and Marketing Expenses | $362.00K | $848.00K | $310.00K | $302.00K | $157.00K | $198.00K | $302.00K | $234.00K | $170.00K | $389.00K | $305.00K | $- | $541.00K | $343.00K | $441.00K | $- | $- | $- | $260.50K |
| Selling General and Administrative Expenses | $1.49M | $1.17M | $1.23M | $2.61M | $1.07M | $1.17M | $1.55M | $1.36M | $1.15M | $1.96M | $2.50M | $1.82M | $2.01M | $3.34M | $1.23M | $1.03M | $537.00K | $660.00K | $528.50K |
| Other Expenses | $-1.51M | $- | $174.00K | $223.00K | $- | $4.00K | $1.14M | $20.00K | $-4.00K | $- | $1.00K | $- | $- | $- | $- | $- | $- | $- | $- |
| Operating Expenses | $-16.00K | $1.17M | $1.23M | $2.61M | $1.07M | $1.17M | $1.55M | $1.36M | $1.15M | $1.96M | $2.50M | $1.82M | $2.01M | $3.34M | $1.23M | $1.03M | $537.00K | $660.00K | $587.00K |
| Cost and Expenses | $1.51M | $1.17M | $1.26M | $2.63M | $1.09M | $1.18M | $1.58M | $1.37M | $1.17M | $1.98M | $2.52M | $1.84M | $2.03M | $3.36M | $1.25M | $1.04M | $537.00K | $660.00K | $587.00K |
| Interest Income | $129.00K | $91.00K | $157.00K | $140.79K | $243.00K | $288.00K | $191.00K | $208 | $109.00K | $22.00K | $16.00K | $6.00K | $1.00K | $2.00K | $1.00K | $4.00K | $- | $- | $169.50K |
| Interest Expense | $313.00K | $298.00K | $475.00K | $3.08K | $538.00K | $- | $146.00K | $- | $162.00K | $29.00K | $234.00K | $1.50M | $935.00K | $790.00K | $759.00K | $816.00K | $1.20M | $140.00K | $- |
| Depreciation and Amortization | $32.00K | $29.00K | $28.87K | $28.77K | $26.66K | $15.20K | $41.00K | $17.02K | $21.71K | $23.80K | $20.25K | $20.93K | $17.88K | $18.84K | $17.13K | $8.00K | $52.75K | $4.50K | $4.50K |
| EBITDA | $-1.50M | $-936.81K | $-904.94K | $-2.10M | $-863.00K | $-2.80M | $-213.02K | $-1.11M | $-1.07M | $-2.02M | $-2.42M | $-2.18M | $-2.01M | $-3.34M | $-1.47M | $-1.03M | $-537.00K | $-671.36K | $-528.50K |
| EBITDA Ratio | 0.00% | 0.00% | 0.00% | 0.00% | 0.00% | 0.00% | 0.00% | 0.00% | 0.00% | 0.00% | 0.00% | 0.00% | 0.00% | 0.00% | 0.00% | 0.00% | 0.00% | 0.00% | 0.00% |
| Operating Income | $- | $-1.17M | $-1.26M | $-2.63M | $-1.07M | $-1.17M | $-1.55M | $-1.36M | $-1.15M | $1.96M | $-2.50M | $-1.82M | $-2.01M | $-3.34M | $-1.23M | $-1.03M | $-537.00K | $-660.00K | $-533.00K |
| Operating Income Ratio | 0.00% | 0.00% | 0.00% | 0.00% | 0.00% | 0.00% | 0.00% | 0.00% | 0.00% | 0.00% | 0.00% | 0.00% | 0.00% | 0.00% | 0.00% | 0.00% | 0.00% | 0.00% | 0.00% |
| Total Other Income Expenses Net | $-1.84M | $-151.00K | $-144.00K | $165.00K | $-358.00K | $-1.60M | $-1.95M | $232.00K | $-109.00K | $-135.00K | $-146.00K | $-1.89M | $-951.00K | $-807.00K | $-1.01M | $-820.00K | $-1.20M | $-140.00K | $-174.00K |
| Income Before Tax | $-1.84M | $-1.32M | $-1.41M | $-2.45M | $-1.43M | $-2.78M | $-400.00K | $-1.12M | $-1.26M | $-2.09M | $-2.65M | $-3.71M | $-2.96M | $-4.15M | $-2.24M | $-1.85M | $-1.74M | $-800.00K | $-756.50K |
| Income Before Tax Ratio | 0.00% | 0.00% | 0.00% | 0.00% | 0.00% | 0.00% | 0.00% | 0.00% | 0.00% | 0.00% | 0.00% | 0.00% | 0.00% | 0.00% | 0.00% | 0.00% | 0.00% | 0.00% | 0.00% |
| Income Tax Expense | $- | $- | $2 | $3 | $538.00K | $4.00K | $1.28M | $-19.00K | $158.00K | $29.00K | $235.00K | $1.51M | $935.00K | $-17.00K | $759.00K | $-4.00K | $-52.75K | $-4.50K | $- |
| Net Income | $-1.84M | $-1.32M | $-1.41M | $-2.45M | $-1.43M | $-2.78M | $-400.00K | $-1.12M | $-1.26M | $-2.09M | $-2.65M | $-3.71M | $-2.96M | $-4.15M | $-2.24M | $-1.85M | $-1.74M | $-800.00K | $-756.50K |
| Net Income Ratio | 0.00% | 0.00% | 0.00% | 0.00% | 0.00% | 0.00% | 0.00% | 0.00% | 0.00% | 0.00% | 0.00% | 0.00% | 0.00% | 0.00% | 0.00% | 0.00% | 0.00% | 0.00% | 0.00% |
| EPS | $-0.02 | $-0.01 | $-0.01 | $-0.02 | $-0.01 | $-0.03 | $0.00 | $-0.01 | $-0.01 | $-0.03 | $-0.04 | $-0.06 | $-0.06 | $-0.08 | $-0.04 | $-0.06 | $-0.03 | $-0.02 | $-0.05 |
| EPS Diluted | $-0.02 | $-0.01 | $-0.01 | $-0.02 | $-0.01 | $-0.03 | $0.00 | $-0.01 | $-0.01 | $-0.03 | $-0.04 | $-0.06 | $-0.06 | $-0.08 | $-0.04 | $-0.06 | $-0.03 | $-0.02 | $-0.05 |
| Weighted Average Shares Outstanding | 109.52M | 109.40M | 109.16M | 109.07M | 109.03M | 107.56M | 96.13M | 88.83M | 88.70M | 80.41M | 70.98M | 61.82M | 49.06M | 51.40M | 51.40M | 31.69M | 51.40M | 51.40M | 14.15M |
| Weighted Average Shares Outstanding Diluted | 109.52M | 109.40M | 109.16M | 109.07M | 109.03M | 107.56M | 96.13M | 88.83M | 88.70M | 80.41M | 70.98M | 61.82M | 51.40M | 51.40M | 51.40M | 31.69M | 51.40M | 51.40M | 14.16M |
| SEC Filing | Source | Source | Source | Source | Source | Source | Source | Source | Source | Source | Source | Source | Source | Source | Source | Source | Source | Source | Source |
Annual Balance Sheet
| Breakdown | December 31, 2023 | December 31, 2022 | December 31, 2021 | December 31, 2020 | December 31, 2019 |
|---|---|---|---|---|---|
| Cash and Cash Equivalents | $10.49M | $19.86M | $27.31M | $7.25M | $47.00K |
| Short Term Investments | $- | $- | $- | $- | $- |
| Cash and Short Term Investments | $10.49M | $19.86M | $27.31M | $7.25M | $47.00K |
| Net Receivables | $10.02M | $- | $400.00K | $76.00K | $38.00K |
| Inventory | $2 | $- | $- | $24.00K | $- |
| Other Current Assets | $314.00K | $90.00K | $118.00K | $2.05M | $10.00K |
| Total Current Assets | $20.72M | $20.02M | $27.82M | $9.38M | $95.00K |
| Property Plant Equipment Net | $89.98M | $49.39M | $26.60M | $8.61M | $12.02M |
| Goodwill | $- | $- | $- | $- | $- |
| Intangible Assets | $3.38M | $2.47M | $1.83M | $478.00K | $- |
| Goodwill and Intangible Assets | $3.38M | $2.47M | $1.83M | $478.00K | $- |
| Long Term Investments | $- | $164.00K | $- | $- | $- |
| Tax Assets | $- | $- | $- | $- | $- |
| Other Non-Current Assets | $- | $-2.47M | $-1.83M | $-478.00K | $- |
| Total Non-Current Assets | $93.36M | $49.56M | $26.60M | $8.61M | $12.02M |
| Other Assets | $- | $- | $- | $- | $- |
| Total Assets | $114.08M | $69.58M | $54.42M | $17.99M | $12.12M |
| Account Payables | $1.19M | $995.00K | $776.00K | $1.27M | $388.00K |
| Short Term Debt | $64.00K | $48.00K | $6.76M | $- | $- |
| Tax Payables | $- | $- | $- | $- | $- |
| Deferred Revenue | $- | $- | $- | $- | $- |
| Other Current Liabilities | $7.13M | $2.49M | $1.73M | $3.30M | $9.91M |
| Total Current Liabilities | $8.39M | $3.53M | $9.27M | $4.57M | $10.30M |
| Long Term Debt | $3.00K | $67.00K | $115.00K | $6.34M | $- |
| Deferred Revenue Non-Current | $- | $- | $- | $- | $- |
| Deferred Tax Liabilities Non-Current | $- | $- | $- | $- | $- |
| Other Non-Current Liabilities | $21.14M | $- | $962.00K | $88.00K | $- |
| Total Non-Current Liabilities | $21.15M | $67.00K | $1.08M | $6.43M | $- |
| Other Liabilities | $- | $- | $- | $- | $- |
| Total Liabilities | $29.53M | $3.60M | $10.35M | $11.00M | $10.30M |
| Preferred Stock | $- | $- | $- | $- | $- |
| Common Stock | $111.17M | $86.02M | $58.67M | $11.62M | $3.63M |
| Retained Earnings | $-34.08M | $-27.09M | $-19.97M | $-6.91M | $-1.80M |
| Accumulated Other Comprehensive Income Loss | $-0 | $-0 | $5.37M | $2.28M | $- |
| Other Total Stockholders Equity | $7.46M | $7.05M | $- | $- | $- |
| Total Stockholders Equity | $84.55M | $65.98M | $44.08M | $6.99M | $1.82M |
| Total Equity | $84.55M | $65.98M | $44.08M | $6.99M | $1.82M |
| Total Liabilities and Stockholders Equity | $114.08M | $69.58M | $54.42M | $17.99M | $12.12M |
| Minority Interest | $- | $- | $- | $- | $- |
| Total Liabilities and Total Equity | $114.08M | $69.58M | $54.42M | $17.99M | $12.12M |
| Total Investments | $-53.69K | $164.00K | $- | $- | $- |
| Total Debt | $67.00K | $115.00K | $6.88M | $6.34M | $- |
| Net Debt | $-10.43M | $-19.75M | $-20.43M | $-903.00K | $-47.00K |
Balance Sheet Charts
| Breakdown | September 30, 2024 | June 30, 2024 | March 31, 2024 | December 31, 2023 | September 30, 2023 | June 30, 2023 | March 31, 2023 | December 31, 2022 | September 30, 2022 | June 30, 2022 | March 31, 2022 | December 31, 2021 | September 30, 2021 | June 30, 2021 | March 31, 2021 | December 31, 2020 | March 31, 2020 |
|---|---|---|---|---|---|---|---|---|---|---|---|---|---|---|---|---|---|
| Cash and Cash Equivalents | $8.48M | $11.02M | $12.07M | $10.44M | $12.00M | $23.63M | $27.70M | $19.86M | $27.95M | $31.86M | $13.37M | $27.31M | $4.45M | $4.46M | $-7.25M | $7.25M | $-47.00K |
| Short Term Investments | $- | $-1.62K | $- | $- | $- | $- | $- | $- | $- | $- | $- | $- | $- | $- | $14.50M | $- | $94.00K |
| Cash and Short Term Investments | $8.48M | $11.02M | $12.07M | $10.44M | $12.00M | $23.63M | $27.70M | $19.86M | $27.95M | $31.86M | $13.37M | $27.31M | $4.45M | $4.46M | $7.25M | $7.25M | $47.00K |
| Net Receivables | $31.00K | $-442.00K | $-502.09K | $9.86M | $- | $- | $79.00K | $- | $- | $17.00K | $- | $400.00K | $- | $123.00K | $- | $76.00K | $- |
| Inventory | $- | $1 | $1 | $2 | $- | $- | $- | $- | $- | $- | $- | $160 | $133 | $200.00K | $- | $24.00K | $- |
| Other Current Assets | $344.00K | $929.93K | $1.17M | $313.20K | $358.00K | $554.00K | $536.00K | $90.00K | $184.00K | $358.00K | $472.00K | $118.00K | $90.00K | $288.00K | $- | $2.05M | $- |
| Total Current Assets | $8.85M | $11.50M | $12.74M | $20.62M | $12.36M | $24.18M | $28.32M | $20.02M | $28.21M | $32.24M | $14.08M | $27.82M | $4.64M | $4.87M | $7.25M | $9.38M | $47.00K |
| Property Plant Equipment Net | $93.61M | $93.42M | $4.37M | $3.59M | $85.02M | $69.07M | $62.65M | $49.39M | $44.76M | $38.43M | $32.84M | $26.60M | $25.63M | $15.35M | $- | $8.61M | $- |
| Goodwill | $- | $- | $- | $- | $- | $- | $- | $- | $- | $- | $- | $- | $- | $- | $- | $- | $- |
| Intangible Assets | $4.17M | $4.17M | $4.17M | $3.38M | $3.32M | $3.10M | $3.10M | $2.47M | $2.47M | $2.47M | $2.47M | $1.83M | $- | $- | $- | $478.00K | $- |
| Goodwill and Intangible Assets | $4.17M | $4.17M | $4.17M | $3.38M | $3.32M | $3.10M | $3.10M | $2.47M | $2.47M | $2.47M | $2.47M | $1.83M | $- | $- | $- | $478.00K | $- |
| Long Term Investments | $- | $- | $- | $- | $134.00K | $146.00K | $158.00K | $164.00K | $143.00K | $172.00K | $- | $- | $- | $- | $- | $- | $- |
| Tax Assets | $- | $- | $- | $- | $-84.36M | $- | $- | $- | $- | $- | $- | $- | $- | $- | $- | $- | $- |
| Other Non-Current Assets | $- | $- | $88.23M | $85.91M | $84.36M | $-3.10M | $-3.10M | $-2.47M | $-2.47M | $-2.47M | $-2.47M | $-1.83M | $- | $- | $-7.25M | $-478.00K | $-47.00K |
| Total Non-Current Assets | $97.78M | $97.59M | $96.78M | $92.88M | $88.47M | $69.22M | $62.81M | $49.56M | $44.91M | $38.60M | $32.84M | $26.60M | $25.63M | $15.35M | $-7.25M | $8.61M | $-47.00K |
| Other Assets | $- | $-14.31K | $1 | $- | $0 | $- | $- | $- | $- | $- | $- | $- | $- | $- | $- | $- | $- |
| Total Assets | $106.63M | $109.08M | $109.51M | $113.50M | $100.83M | $93.40M | $91.13M | $69.58M | $73.11M | $70.84M | $46.92M | $54.42M | $30.27M | $20.22M | $- | $17.99M | $- |
| Account Payables | $894.00K | $1.02M | $1.13M | $1.19M | $2.39M | $1.57M | $1.24M | $995.00K | $845.00K | $298.00K | $774.00K | $776.00K | $3.49M | $3.68M | $- | $1.27M | $- |
| Short Term Debt | $29.00K | $42.00K | $52.00K | $64.00K | $64.00K | $64.00K | $51.00K | $48.00K | $39.00K | $37.00K | $35.00K | $6.76M | $13.02M | $7.39M | $- | $- | $- |
| Tax Payables | $- | $- | $- | $- | $- | $- | $- | $- | $- | $- | $- | $- | $- | $- | $- | $- | $- |
| Deferred Revenue | $- | $- | $-1.13M | $-1.19M | $- | $- | $- | $- | $- | $- | $- | $- | $-3.49M | $-3.68M | $- | $- | $- |
| Other Current Liabilities | $7.73M | $9.21M | $8.86M | $7.13M | $5.28M | $3.16M | $370.00K | $2.49M | $4.31M | $1.93M | $2.08M | $1.73M | $- | $- | $- | $3.30M | $- |
| Total Current Liabilities | $8.66M | $10.27M | $10.02M | $8.34M | $7.74M | $4.79M | $1.66M | $3.53M | $5.19M | $2.27M | $2.89M | $9.27M | $16.51M | $11.07M | $- | $4.57M | $- |
| Long Term Debt | $- | $- | $- | $3.00K | $16.00K | $28.00K | $53.00K | $67.00K | $80.00K | $92.00K | $104.00K | $115.00K | $- | $- | $- | $6.34M | $- |
| Deferred Revenue Non-Current | $- | $- | $- | $- | $- | $- | $- | $- | $- | $- | $- | $- | $- | $- | $- | $- | $- |
| Deferred Tax Liabilities Non-Current | $- | $- | $- | $- | $- | $- | $- | $- | $- | $- | $- | $- | $- | $- | $- | $- | $- |
| Other Non-Current Liabilities | $16.19M | $15.88M | $15.78M | $21.04M | $5.53M | $- | $- | $- | $- | $- | $998.00K | $962.00K | $- | $- | $- | $88.00K | $- |
| Total Non-Current Liabilities | $16.19M | $15.88M | $15.78M | $21.04M | $5.55M | $28.00K | $53.00K | $67.00K | $80.00K | $92.00K | $1.10M | $1.08M | $- | $- | $- | $6.43M | $- |
| Other Liabilities | $- | $2.33K | $1 | $1 | $- | $- | $- | $- | $- | $- | $- | $- | $- | $- | $- | $- | $- |
| Total Liabilities | $24.85M | $26.15M | $25.80M | $29.38M | $13.29M | $4.82M | $1.71M | $3.60M | $5.27M | $2.36M | $3.99M | $10.35M | $16.51M | $11.07M | $- | $11.00M | $- |
| Preferred Stock | $- | $- | $- | $- | $- | $- | $- | $- | $- | $- | $- | $- | $- | $- | $- | $- | $- |
| Common Stock | $111.53M | $111.43M | $111.16M | $110.60M | $111.27M | $111.27M | $109.33M | $86.02M | $85.97M | $85.93M | $58.92M | $58.67M | $24.02M | $18.78M | $- | $11.62M | $- |
| Retained Earnings | $-38.65M | $-36.81M | $-35.45M | $-33.90M | $-31.69M | $-30.27M | $-27.49M | $-27.09M | $-25.96M | $-24.71M | $-22.61M | $-19.97M | $-16.26M | $-13.29M | $- | $-6.91M | $- |
| Accumulated Other Comprehensive Income Loss | $- | $-0 | $0 | $-0 | $0 | $0 | $-0 | $-0 | $0 | $-0 | $- | $5.37M | $6.00M | $3.66M | $6.99M | $2.28M | $1.82M |
| Other Total Stockholders Equity | $8.91M | $8.33M | $8.01M | $8.02M | $7.96M | $7.58M | $7.58M | $7.05M | $7.83M | $7.26M | $6.62M | $- | $- | $- | $- | $- | $- |
| Total Stockholders Equity | $81.78M | $82.95M | $83.71M | $84.11M | $87.54M | $88.58M | $89.42M | $65.98M | $67.84M | $68.48M | $42.93M | $44.08M | $13.76M | $9.15M | $6.99M | $6.99M | $1.82M |
| Total Equity | $81.78M | $82.95M | $83.71M | $84.11M | $87.54M | $88.58M | $89.42M | $65.98M | $67.84M | $68.48M | $42.93M | $44.08M | $13.76M | $9.15M | $6.99M | $6.99M | $1.82M |
| Total Liabilities and Stockholders Equity | $106.63M | $109.08M | $109.51M | $113.50M | $100.83M | $93.40M | $91.13M | $69.58M | $73.11M | $70.84M | $46.92M | $54.42M | $30.27M | $20.22M | $6.99M | $17.99M | $1.82M |
| Minority Interest | $- | $- | $- | $- | $- | $- | $- | $- | $- | $- | $- | $- | $- | $- | $- | $- | $- |
| Total Liabilities and Total Equity | $106.63M | $109.08M | $109.51M | $113.50M | $100.83M | $93.40M | $91.13M | $69.58M | $73.11M | $70.84M | $46.92M | $54.42M | $30.27M | $20.22M | $6.99M | $17.99M | $1.82M |
| Total Investments | $- | $-1.62K | $- | $- | $134.00K | $146.00K | $158.00K | $164.00K | $143.00K | $172.00K | $- | $- | $- | $- | $14.50M | $- | $94.00K |
| Total Debt | $29.00K | $42.00K | $5.86M | $66.66K | $80.00K | $92.00K | $104.00K | $115.00K | $119.00K | $129.00K | $139.00K | $6.88M | $13.02M | $7.39M | $- | $6.34M | $- |
| Net Debt | $-8.45M | $-10.97M | $-6.21M | $-10.37M | $-11.92M | $-23.53M | $-27.60M | $-19.75M | $-27.83M | $-31.74M | $-13.23M | $-20.43M | $8.57M | $2.93M | $7.25M | $-903.00K | $47.00K |
Annual Cash Flow
| Breakdown | December 31, 2023 | December 31, 2022 | December 31, 2021 | December 31, 2020 | December 31, 2019 |
|---|---|---|---|---|---|
| Net Income | $-6.99M | $-7.12M | $-13.06M | $-5.10M | $-1.84M |
| Depreciation and Amortization | $110.00K | $80.67K | $74.34K | $17.90K | $- |
| Deferred Income Tax | $- | $-80.67K | $-74.34K | $-17.90K | $- |
| Stock Based Compensation | $2.30M | $1.82M | $2.94M | $670.00K | $- |
| Change in Working Capital | $-29.00K | $1.16M | $125.00K | $899.00K | $1.28M |
| Accounts Receivables | $163.00K | $159.42K | $-321.15K | $-40.01K | $-39.91K |
| Inventory | $- | $- | $- | $- | $- |
| Accounts Payables | $- | $- | $- | $- | $- |
| Other Working Capital | $-192.00K | $1.00M | $446.15K | $939.01K | $1.32M |
| Other Non Cash Items | $-6.92M | $583.00K | $3.70M | $2.29M | $39.91K |
| Net Cash Provided by Operating Activities | $-11.52M | $-3.55M | $-6.29M | $-1.48M | $-561.76K |
| Investments in Property Plant and Equipment | $-27.30M | $-774.00K | $-18.60M | $-13.32M | $-1.99M |
| Acquisitions Net | $- | $- | $- | $- | $- |
| Purchases of Investments | $- | $- | $- | $- | $- |
| Sales Maturities of Investments | $- | $- | $- | $- | $- |
| Other Investing Activities | $- | $-29.02M | $-17.23M | $5.02M | $- |
| Net Cash Used for Investing Activities | $-27.30M | $-29.80M | $-18.60M | $-8.30M | $-1.99M |
| Debt Repayment | $-64.00K | $-48.00K | $5.86M | $-58.00K | $- |
| Common Stock Issued | $22.78M | $25.93M | $33.29M | $3.77M | $2.60M |
| Common Stock Repurchased | $- | $- | $- | $- | $- |
| Dividends Paid | $- | $- | $- | $- | $- |
| Other Financing Activities | $6.82M | $210.00K | $5.80M | $13.26M | $2.60M |
| Net Cash Used Provided by Financing Activities | $29.53M | $26.09M | $44.95M | $16.97M | $2.60M |
| Effect of Forex Changes on Cash | $-82.00K | $-180.00K | $121.00K | $- | $- |
| Net Change in Cash | $-9.37M | $-7.45M | $20.06M | $7.20M | $48.09K |
| Cash at End of Period | $10.49M | $19.86M | $27.31M | $7.25M | $47.00K |
| Cash at Beginning of Period | $19.86M | $27.31M | $7.25M | $47.00K | $-1.09K |
| Operating Cash Flow | $-11.52M | $-3.55M | $-6.29M | $-1.48M | $-561.76K |
| Capital Expenditure | $-27.30M | $-774.00K | $-18.60M | $-13.32M | $-1.99M |
| Free Cash Flow | $-38.82M | $-4.33M | $-24.89M | $-14.79M | $-2.55M |
Cash Flow Charts
| Breakdown | September 30, 2024 | June 30, 2024 | March 31, 2024 | December 31, 2023 | September 30, 2023 | June 30, 2023 | March 31, 2023 | December 31, 2022 | September 30, 2022 | June 30, 2022 | March 31, 2022 | December 31, 2021 | September 30, 2021 | June 30, 2021 | March 31, 2021 | December 31, 2020 | September 30, 2020 | June 30, 2020 | March 31, 2020 |
|---|---|---|---|---|---|---|---|---|---|---|---|---|---|---|---|---|---|---|---|
| Net Income | $-1.84M | $-1.32M | $-1.41M | $-2.45M | $-1.43M | $-2.78M | $-400.00K | $-1.12M | $-1.26M | $-2.09M | $-2.65M | $-3.71M | $-2.96M | $-4.15M | $-2.24M | $-1.85M | $-1.74M | $-800 | $-756 |
| Depreciation and Amortization | $- | $- | $28.87K | $28.77K | $26.66K | $15.20K | $41.00K | $17.02K | $21.71K | $23.80K | $20.25K | $20.93K | $17.88K | $19 | $17 | $8 | $- | $4 | $4 |
| Deferred Income Tax | $- | $- | $- | $-294.87K | $-26.66K | $-15.20K | $-41.00K | $-17.02K | $-21.71K | $-23.80K | $- | $- | $- | $- | $- | $- | $- | $- | $- |
| Stock Based Compensation | $713.00K | $391.00K | $661.00K | $335.00K | $386.00K | $395.00K | $1.19M | $215.00K | $223.00K | $760.00K | $623.00K | $437.00K | $1.15M | $1.15M | $205.00K | $202.00K | $234.00K | $- | $- |
| Change in Working Capital | $-19.00K | $-1.59M | $-5.33M | $670.49K | $-1.56M | $3.19M | $-2.33M | $-1.60M | $3.07M | $602.00K | $-908.00K | $-768.00K | $1.12M | $1.17M | $-1.40M | $542.00K | $-149.00K | $-174 | $-174 |
| Accounts Receivables | $- | $62.00K | $-12.94K | $97.68K | $62.19K | $9.14K | $-3.00K | $-12.00K | $-20.08K | $48.89K | $165.00K | $-293.02K | $15.69K | $31 | $-78 | $-68 | $-4 | $17 | $17 |
| Inventory | $- | $- | $- | $- | $- | $- | $- | $- | $- | $- | $- | $- | $- | $- | $- | $- | $- | $- | $- |
| Accounts Payables | $- | $-1.78M | $-4.91M | $- | $- | $3.12M | $-1.88M | $- | $- | $- | $- | $- | $- | $- | $- | $- | $- | $- | $- |
| Other Working Capital | $-19.00K | $121.00K | $-5.32M | $572.81K | $-1.62M | $3.18M | $-2.32M | $-1.59M | $3.09M | $553.11K | $-1.08M | $-472.02K | $1.09M | $-74 | $10 | $-16 | $383 | $-190 | $-190 |
| Other Non Cash Items | $309.00K | $345.00K | $1.20M | $-444.33K | $-5.61M | $-87.00K | $-547.00K | $-794.00K | $521.00K | $440.00K | $416.00K | $1.96M | $349.00K | $879.00K | $516.00K | $818.00K | $1.47M | $470 | $426 |
| Net Cash Provided by Operating Activities | $-838.00K | $-2.18M | $-5.57M | $-2.15M | $-8.21M | $724.00K | $-2.09M | $-3.31M | $2.56M | $-291.00K | $-2.52M | $-2.08M | $-345.00K | $-953.00K | $-2.92M | $-293.00K | $-184.00K | $-499 | $-499 |
| Investments in Property Plant and Equipment | $10.46M | $-4.76M | $-6.56M | $-4.63M | $-3.40M | $-6.44M | $-13.30M | $24.51M | $-6.37M | $-7.22M | $-11.55M | $-3.24M | $-10.67M | $-2.08M | $-2.62M | $-2.11M | $-10.60M | $-306 | $-306 |
| Acquisitions Net | $- | $- | $- | $- | $- | $- | $- | $- | $- | $- | $- | $- | $- | $- | $- | $- | $- | $- | $- |
| Purchases of Investments | $- | $- | $- | $- | $- | $- | $- | $- | $- | $- | $- | $- | $- | $- | $- | $- | $- | $- | $- |
| Sales Maturities of Investments | $- | $- | $- | $- | $- | $- | $- | $- | $- | $- | $- | $- | $- | $- | $- | $- | $- | $- | $- |
| Other Investing Activities | $-14.91M | $93.77K | $-5.80M | $- | $- | $- | $-12.65M | $-29.16M | $- | $- | $- | $- | $200.00K | $-200.00K | $- | $-22.00K | $5.04M | $- | $- |
| Net Cash Used for Investing Activities | $-4.45M | $-4.67M | $-6.56M | $-4.63M | $-3.40M | $-6.44M | $-13.30M | $-4.65M | $-6.37M | $-7.22M | $-11.55M | $-3.24M | $-10.47M | $-2.28M | $-2.62M | $-2.13M | $-5.55M | $-306 | $-306 |
| Debt Repayment | $-16.00K | $-16.00K | $- | $-16.00K | $-16.00K | $-16.00K | $-16.00K | $- | $-107.00K | $74.00K | $-15.00K | $15.00K | $5.99M | $-92.00K | $-19.00K | $4.34M | $8.96M | $- | $- |
| Common Stock Issued | $- | $33.99K | $- | $-153.00K | $-33.91K | $1.51M | $22.93M | $1.04M | $6.00K | $25.92M | $149.82K | $30.85M | $516.00K | $21.00K | $1.90M | $3.73M | $- | $- | $- |
| Common Stock Repurchased | $- | $-42.99K | $- | $-153.00K | $-1 | $- | $- | $- | $- | $- | $- | $- | $- | $- | $- | $- | $- | $- | $- |
| Dividends Paid | $- | $- | $- | $- | $- | $- | $- | $- | $- | $- | $- | $- | $- | $- | $- | $- | $- | $- | $- |
| Other Financing Activities | $2.77M | $5.80M | $13.78M | $4.85M | $-1.00K | $144.72K | $318.00K | $46.00K | $1.00K | $15.00K | $148.00K | $-2.69M | $4.30M | $- | $4.17M | $-4.26M | $2.60M | $806 | $806 |
| Net Cash Used Provided by Financing Activities | $2.75M | $5.78M | $13.72M | $5.20M | $-17.00K | $1.63M | $23.23M | $46.00K | $-100.00K | $26.01M | $133.00K | $28.18M | $10.80M | $-71.00K | $6.05M | $3.81M | $11.55M | $806 | $806 |
| Effect of Forex Changes on Cash | $- | $- | $- | $84.23K | $- | $1.00K | $-1.00K | $-180.00K | $- | $- | $- | $121 | $- | $- | $- | $- | $- | $- | $- |
| Net Change in Cash | $-2.54M | $-1.06M | $1.63M | $-1.50M | $-11.63M | $-4.08M | $7.84M | $-8.09M | $-3.91M | $18.49M | $-13.94M | $22.86M | $-11.00K | $-3.31M | $518.00K | $1.38M | $5.82M | $- | $- |
| Cash at End of Period | $8.48M | $11.02M | $12.07M | $10.44M | $12.00M | $23.63M | $27.70M | $19.86M | $27.95M | $31.86M | $13.37M | $27.31M | $4.45M | $4.46M | $7.77M | $7.25M | $5.87M | $- | $- |
| Cash at Beginning of Period | $11.02M | $12.08M | $10.44M | $11.94M | $23.63M | $27.70M | $19.86M | $27.95M | $31.86M | $13.37M | $27.31M | $4.45M | $4.46M | $7.77M | $7.25M | $5.87M | $47.00K | $- | $- |
| Operating Cash Flow | $-838.00K | $-2.18M | $-5.57M | $-2.15M | $-8.21M | $724.00K | $-2.09M | $-3.31M | $2.56M | $-291.00K | $-2.52M | $-2.08M | $-345.00K | $-953.00K | $-2.92M | $-293.00K | $-184.00K | $-499 | $-499 |
| Capital Expenditure | $-4.45M | $-4.76M | $-6.56M | $-4.63M | $-3.40M | $-6.44M | $-13.30M | $24.51M | $-6.37M | $-7.22M | $-11.55M | $-3.24M | $-10.67M | $-2.08M | $-2.62M | $-2.11M | $-10.60M | $-306 | $-306 |
| Free Cash Flow | $-5.29M | $-7.02M | $-12.14M | $-6.79M | $-11.61M | $-5.71M | $-15.39M | $21.20M | $-3.81M | $-7.52M | $-14.07M | $-5.32M | $-11.01M | $-3.04M | $-5.53M | $-2.40M | $-10.78M | $-806 | $-806 |
Arizona Sonoran Copper Dividends
Explore Arizona Sonoran Copper's dividend history, including dividend yield, payout ratio, and historical payments.
Arizona Sonoran Copper News
Read the latest news about Arizona Sonoran Copper, including recent articles, headlines, and updates.

Arizona Sonoran Announces Filing of Final Short Form Prospectus in connection with C$30,000,000 Bought Deal Financing
CASA GRANDE, Ariz. & TORONTO--(BUSINESS WIRE)---- $ASCU #Arizona--ASCU has filed and been receipted for a final short form prospectus in connection with its $30M bought deal offering at a price of C$1.45/share.

Arizona Sonoran Announces Filing of Preliminary Short Form Prospectus in connection with C$30,000,000 Bought Deal Financing
CASA GRANDE, Ariz. & TORONTO--(BUSINESS WIRE)---- $ASCU #Arizona--ASCU announces the filing and receipt for a preliminary short form prospectus in connection with its bought deal offering for gross proceeds of $30M.

Arizona Sonoran Announces Upsize to Bought Deal Public Offering to $30 Million
NOT FOR DISTRIBUTION TO UNITED STATES NEWS WIRE SERVICES OR FOR DISSEMINATION IN THE UNITED STATES TORONTO, Sept. 24, 2024 (GLOBE NEWSWIRE) -- Arizona Sonoran Copper Company Inc. (“Arizona Sonoran” or the “Company”) (TSX:ASCU) is pleased to announce that the Company has entered into an amending agreement with Raymond James Ltd.


BTV Highlights: Founders Metals, Arizona Sonoran, Prime Mining, enCore Energy & Reunion Gold
Vancouver, British Columbia--(Newsfile Corp. - February 29, 2024) - On BNN Bloomberg broadcast on March 2 & 3, 2023 - BTV-Business Television interviews emerging companies in the markets including: Cannot view this video? Visit: https://www.youtube.com/watch?v=WMF8-B3FdPw Founders Metals Inc. (TSXV: FDR) (OTCQX: FDMIF) VIDEO - is spearheading gold exploration in Suriname's Guiana Shield, uncovering significant gold potential in this underexplored region.

Arizona Sonoran and Nuton LLC Announce Option to Joint Venture on Cactus Project in Arizona
CASA GRANDE, Ariz. & TORONTO--(BUSINESS WIRE)--Arizona Sonoran Copper Company Inc. (TSX:ASCU | OTCQX:ASCUF) (“ASCU” or the “Company”) is pleased to announce today that it has entered into an option to joint venture agreement with Nuton LLC (“Nuton”), a wholly-owned subsidiary of Rio Tinto, to establish a strategic alliance for deployment of the Nuton technologies at its Cactus Mine and the Parks/Salyer Project (collectively, the “Cactus Project”), in Arizona, USA. All dollar figures herein are in United States dollars unless otherwise indicated.

Arizona Sonoran Reports Final Extraction Rates from Phase 1 of Nuton™ Technologies on the Cactus Sulphides and Expands the Program
CASA GRANDE, Ariz. & TORONTO--(BUSINESS WIRE)---- $ASCU #Arizona--Arizona Sonoran Copper Company Inc. (TSX:ASCU | OTCQX:ASCUF) (“ASCU” or the “Company”) an emerging US-based copper developer and near-term producer, today announces metallurgical results from the Nuton Phase 1 column leach program from ASCU's Cactus copper porphyry project in Arizona, USA (see FIGURES 1-3). George Ogilvie, Arizona Sonoran Copper Company President and CEO commented, “We are encouraged by the extraction rates resulting from our prima.

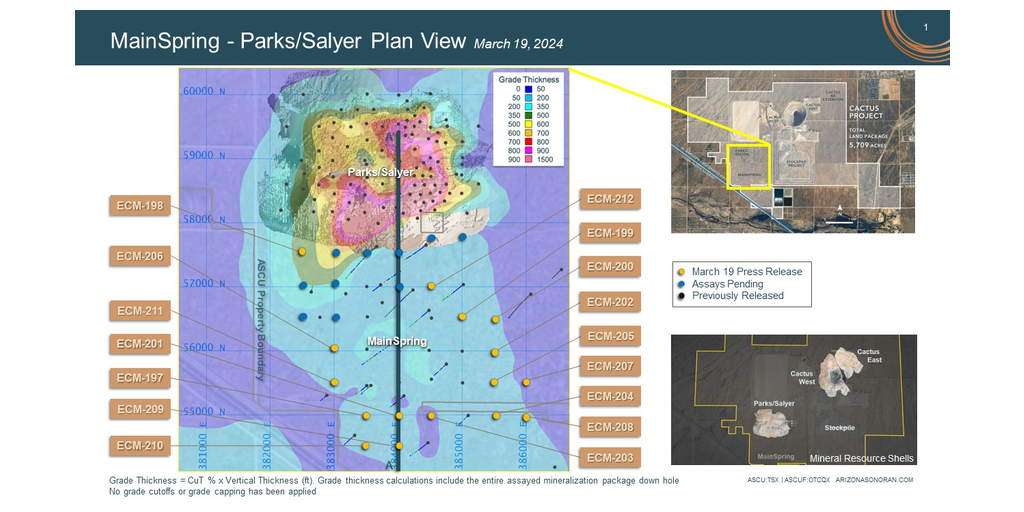
Arizona Sonoran Exploration Drilling Intersects Near Surface Mineralization 2,500 ft (762 m) South of Parks/Salyer
CASA GRANDE, Ariz. & TORONTO--(BUSINESS WIRE)---- $ASCU #Arizona--ASCU reports that exploration drilling at the MainSpring property intersected near surface copper mineralization from 4 drill holes.

Arizona Sonoran to Attend the Red Cloud and Scotiabank Conferences in Toronto, Canada and 121 Conference in London, UK in November
CASA GRANDE, Ariz. & TORONTO--(BUSINESS WIRE)---- $ASCU #Arizona--ASCU to attend three conferences in November: Red Cloud and Scotia invite only conferences in Toronto, and 121 Mining Investment in London.

THE Mining Investment Event of the North - Quebec City, June 2023 Announces THE Global Private Streaming Platform
Special Sponsor: Government of Québec Premier Sponsor: Laurentian Bank Securities Critical Metals Day Platinum Sponsor: National Bank Financial Markets Gold Sponsors: BMO, IBK Capital, O3 Mining, Troilus Gold, Maple Gold Mines, JDS Group of Companies Silver Sponsors: PearTree Financial, Stifel GMP, TMX Group, Invest Yukon, Mi3 Financial ESG Sponsor: Socialsuite Copper Sponsors: Cassels, Crux Investor, CDPQ, Amex Exploration, Out of the Box Capital, Amvest Capital, INFOR Financial, Global Business Reports, Generation IACP, Brooks & Nelson, Alliance Advisors, VRIFY Technology Partners: BTV, Kitco, Mining Network, The Northern Miner, Newsfile, Resource World, LFG EquitiesSimply Better Marketing, Quebec City Business Destination, EBL Consultants, The Prospector Toronto, Ontario--(Newsfile Corp. - June 6, 2023) - THE Mining Investment Event of the North ("THE Event"), Québec City, June 19-21, 2023 is pleased to announce the launch of THE Global Private Streaming Platform dedicated to virtual attendance – limited availability through registration only. Once you have registered you will be able to log on daily with your unique code to THE Event as a virtual global audience member and view live presentations from C-suite members of participating companies, and the world's foremost thought leaders, panelists and keynotes delivered at THE Event from 8:00 am ET to 5:00 pm ET, Monday June 19-Wednesday June 21, 2023.

Similar Companies
Related Metrics
Explore detailed financial metrics and analysis for ASCUF.