Blackstone Minerals Key Executives
This section highlights Blackstone Minerals's key executives, including their titles and compensation details.
Find Contacts at Blackstone Minerals
(Showing 0 of )
Blackstone Minerals Earnings
This section highlights Blackstone Minerals's earnings, including key dates, EPS, earnings reports, and earnings call transcripts.
Next Earnings Date
Last Earnings Results
Earnings Call Transcripts
| Transcript | Quarter | Year | Date | Estimated EPS | Actual EPS |
|---|

Blackstone Minerals Limited engages in the exploration and development of mineral properties. The company primarily explores for nickel, cobalt, copper, gold, platinum, and palladium deposits. It holds a 100% interest in the Gold Bridge project, which covers an area of 367 square kilometers located in the British Columbia, Canada. The company also holds a 90% interest in the Ta Khoa project located in Son La Province, Vietnam. Blackstone Minerals Limited was incorporated in 2016 and is based in West Perth, Australia.
$0.05
Stock Price
$33.83M
Market Cap
-
Employees
West Perth, WA
Location
Financial Statements
Access annual & quarterly financial statements for Blackstone Minerals, including income statements, balance sheets, and cash flow statements..
Annual Income Statement
| Breakdown | June 30, 2024 | June 30, 2023 | June 30, 2022 | June 30, 2021 | June 30, 2020 |
|---|---|---|---|---|---|
| Revenue | $- | $383.56K | $35.90K | $77.25K | $46.33K |
| Cost of Revenue | $- | $1.01M | $1.12M | $804.56K | $227.38K |
| Gross Profit | $- | $-627.37K | $-1.09M | $-727.31K | $-181.04K |
| Gross Profit Ratio | 0.00% | -163.56% | -3031.13% | -941.54% | -390.74% |
| Research and Development Expenses | $- | $- | $- | $- | $- |
| General and Administrative Expenses | $4.32M | $9.94M | $11.39M | $6.78M | $3.81M |
| Selling and Marketing Expenses | $11.16M | $22.96M | $27.61M | $10.31M | $3.48M |
| Selling General and Administrative Expenses | $15.47M | $32.90M | $38.99M | $17.10M | $7.29M |
| Other Expenses | $- | $-905.86K | $482.67K | $744.20K | $2.26M |
| Operating Expenses | $15.47M | $32.90M | $38.51M | $17.10M | $7.29M |
| Cost and Expenses | $15.47M | $33.91M | $39.63M | $17.90M | $7.52M |
| Interest Income | $- | $383.56K | $35.90K | $77.25K | $46.33K |
| Interest Expense | $- | $47.62K | $48.08K | $100.20K | $32.80K |
| Depreciation and Amortization | $834.13K | $1.01M | $1.12M | $804.56K | $227.38K |
| EBITDA | $-11.30M | $-26.30M | $-38.51M | $-17.10M | $-7.73M |
| EBITDA Ratio | - | -6857.04% | -107267.77% | -22132.01% | -16690.51% |
| Operating Income | $-15.47M | $-33.91M | $-39.63M | $-17.90M | $-7.52M |
| Operating Income Ratio | - | -8841.77% | -110398.91% | -23173.55% | -16226.30% |
| Total Other Income Expenses Net | $-2.44M | $-4.62M | $2.57M | $-982.02K | $-828.23K |
| Income Before Tax | $-17.91M | $-38.32M | $-36.01M | $-17.81M | $-7.97M |
| Income Before Tax Ratio | - | -9989.54% | -100313.77% | -23060.68% | -17200.66% |
| Income Tax Expense | $- | $-3.83M | $-470.08K | $-634.06K | $-75.27K |
| Net Income | $-17.33M | $-32.15M | $-31.94M | $-15.88M | $-7.89M |
| Net Income Ratio | - | -8382.51% | -88965.39% | -20557.79% | -17038.19% |
| EPS | $-0.03 | $-0.06 | $-0.07 | $-0.05 | $-0.04 |
| EPS Diluted | $-0.03 | $-0.06 | $-0.07 | $-0.05 | $-0.04 |
| Weighted Average Shares Outstanding | 503.85M | 495.97M | 429.90M | 323.73M | 201.03M |
| Weighted Average Shares Outstanding Diluted | 488.24M | 495.97M | 429.90M | 323.73M | 201.03M |
| SEC Filing | Source | Source | Source | Source | Source |
| Breakdown | December 31, 2023 | September 30, 2023 | June 30, 2023 | March 31, 2023 | December 31, 2022 | September 30, 2022 | June 30, 2022 | March 31, 2022 | December 31, 2021 | September 30, 2021 | June 30, 2021 | March 31, 2021 | December 31, 2020 | September 30, 2020 | June 30, 2020 | March 31, 2020 | December 31, 2019 | September 30, 2019 | June 30, 2019 | March 31, 2019 |
|---|---|---|---|---|---|---|---|---|---|---|---|---|---|---|---|---|---|---|---|---|
| Revenue | $31.60K | $31.60K | $63.58K | $63.58K | $128.21K | $128.21K | $10.80K | $10.80K | $7.15K | $7.15K | $27.92K | $27.92K | $10.70K | $10.70K | $-196.12K | $-196.12K | $219.28K | $219.28K | $-42.34K | $-42.34K |
| Cost of Revenue | $- | $- | $494.00K | $- | $516.93K | $- | $593.51K | $- | $530.56K | $- | $710.85K | $- | $135.65K | $- | $137.42K | $- | $89.95K | $- | $7.67K | $- |
| Gross Profit | $31.60K | $31.60K | $-430.43K | $63.58K | $-388.72K | $128.21K | $-582.72K | $10.80K | $-523.41K | $7.15K | $-682.93K | $27.92K | $-124.95K | $10.70K | $-333.54K | $-196.12K | $129.33K | $219.28K | $-50.02K | $-42.34K |
| Gross Profit Ratio | 100.00% | 100.00% | -677.04% | 100.00% | -303.20% | 100.00% | -5397.03% | 100.00% | -7317.35% | 100.00% | -2445.92% | 100.00% | -1167.40% | 100.00% | 170.07% | 100.00% | 58.98% | 100.00% | 118.12% | 100.00% |
| Research and Development Expenses | $- | $- | $- | $- | $- | $- | $- | $- | $- | $- | $- | $- | $- | $- | $- | $- | $- | $- | $- | $- |
| General and Administrative Expenses | $1.54M | $1.54M | $1.06M | $1.06M | $1.48M | $1.48M | $1.59M | $1.59M | $1.90M | $1.90M | $1.20M | $1.20M | $824.78K | $824.78K | $568.88K | $568.88K | $450.62K | $450.63K | $182.58K | $182.58K |
| Selling and Marketing Expenses | $4.03M | $4.03M | $12.85M | $5.80M | $17.52M | $7.89M | $21.87M | $9.63M | $13.63M | $6.20M | $8.97M | $3.83M | $6.10M | $2.60M | $2.20M | $780.57K | $4.08M | $1.79M | $1.38M | $583.39K |
| Selling General and Administrative Expenses | $5.57M | $5.57M | $13.91M | $6.85M | $19.00M | $9.37M | $23.46M | $11.21M | $15.53M | $8.09M | $10.17M | $5.03M | $6.93M | $3.43M | $2.76M | $1.35M | $4.53M | $2.24M | $1.56M | $765.98K |
| Other Expenses | $- | $- | $- | $- | $- | $- | $482.67K | $- | $- | $- | $- | $- | $- | $- | $- | $- | $- | $- | $- | $- |
| Operating Expenses | $5.57M | $6.75M | $13.91M | $6.77M | $19.00M | $10.64M | $22.98M | $9.46M | $15.53M | $8.31M | $10.17M | $5.13M | $6.93M | $3.49M | $2.76M | $1.69M | $4.53M | $2.31M | $1.56M | $740.87K |
| Cost and Expenses | $5.57M | $6.75M | $14.40M | $6.77M | $19.51M | $10.64M | $23.57M | $9.46M | $16.06M | $8.31M | $10.88M | $5.13M | $7.06M | $3.49M | $2.90M | $1.69M | $4.62M | $2.31M | $1.57M | $740.87K |
| Interest Income | $63.19K | $5.91K | $127.15K | $18.92K | $256.41K | $4.89K | $21.59K | $20.69K | $14.31K | $3.35K | $55.84K | $4.02K | $21.41K | $4.79K | $45.21K | $5.53K | $1.12K | $6.38K | $3.95K | $- |
| Interest Expense | $246.96K | $- | $22.79K | $- | $24.83K | $- | $29.01K | $- | $19.07K | $- | $86.63K | $- | $13.57K | $- | $15.03K | $- | $17.77K | $- | $- | $- |
| Depreciation and Amortization | $212.10K | $212.10K | $494.00K | $174.74K | $516.93K | $232.38K | $593.51K | $198.16K | $530.56K | $215.46K | $710.85K | $304.04K | $135.65K | $37.59K | $137.42K | $1.40M | $89.95K | $14.56K | $7.67K | $3.83K |
| EBITDA | $-5.62M | $-5.62M | $-2.64M | $-4.94M | $-9.31M | $-9.31M | $-10.82M | $-10.82M | $-7.97M | $-7.97M | $-4.70M | $-4.70M | $-3.43M | $-3.43M | $-2.76M | $-1.33M | $-2.06M | $-2.06M | $-764.00K | $-764.00K |
| EBITDA Ratio | -17772.02% | -17772.02% | -4158.67% | -7778.10% | -7263.79% | -7263.73% | -100192.21% | -100192.21% | -111387.24% | -111387.22% | -16837.63% | -16837.63% | -32029.79% | -32029.80% | 1409.38% | 679.97% | -937.38% | -937.38% | 1804.27% | 1804.27% |
| Operating Income | $-5.53M | $-5.83M | $-14.40M | $-5.12M | $-19.51M | $-9.54M | $-23.57M | $-11.02M | $-16.06M | $-8.18M | $-10.88M | $-5.01M | $-7.06M | $-3.47M | $-2.90M | $-2.73M | $-4.62M | $-2.07M | $-1.57M | $-767.84K |
| Operating Income Ratio | -17517.00% | -18443.30% | -22649.56% | -8052.96% | -15221.15% | -7444.99% | -218318.51% | -102027.57% | -224540.19% | -114399.41% | -38971.31% | -17926.55% | -65978.04% | -32381.02% | 1479.45% | 1393.52% | -2105.32% | -944.02% | 3698.21% | 1813.33% |
| Total Other Income Expenses Net | $-1.19M | $-901.27K | $-13.11M | $148.24K | $9.00M | $-969.01K | $14.10M | $1.74M | $7.76M | $-216.90K | $5.77M | $-102.30K | $3.58M | $-16.50K | $1.01M | $-341.29K | $-72.82K | $-27.85K | $25.11K | $25.11K |
| Income Before Tax | $-6.73M | $-6.73M | $-17.29M | $-6.73M | $-21.03M | $-10.51M | $-23.19M | $-9.47M | $-12.42M | $-8.30M | $-11.86M | $-5.11M | $-6.96M | $-3.48M | $-3.77M | $-1.89M | $-4.20M | $-2.10M | $-1.57M | $-783.21K |
| Income Before Tax Ratio | -21295.79% | -21295.79% | -27193.60% | -10582.62% | -16401.75% | -8200.81% | -214784.87% | -87693.05% | -173618.55% | -116078.08% | -42466.56% | -18292.95% | -65070.33% | -32535.17% | 1924.21% | 962.10% | -1913.43% | -956.71% | 3699.28% | 1849.64% |
| Income Tax Expense | $- | $-437.87K | $-3.83M | $-568.38K | $-1.19M | $-597.34K | $-262.65K | $-1.03M | $-207.43K | $-767.47K | $-112.44K | $-508.51K | $-282.32K | $-141.16K | $-75.28K | $-37.64K | $-3 | $- | $-1 | $- |
| Net Income | $-6.29M | $-6.29M | $-12.32M | $-6.16M | $-19.83M | $-9.92M | $-20.39M | $-8.43M | $-11.55M | $-7.54M | $-7.78M | $-4.60M | $-6.68M | $-3.34M | $-3.70M | $-1.85M | $-4.20M | $-2.10M | $-1.57M | $-783.21K |
| Net Income Ratio | -19909.95% | -19909.95% | -19377.16% | -9688.58% | -15469.90% | -7734.89% | -188822.54% | -78111.43% | -161490.37% | -105348.76% | -27853.39% | -16471.69% | -62432.56% | -31216.29% | 1885.83% | 942.91% | -1913.43% | -956.71% | 3699.28% | 1849.64% |
| EPS | $-0.01 | $-0.01 | $-0.02 | $-0.01 | $-0.04 | $-0.02 | $-0.04 | $-0.02 | $-0.03 | $-0.02 | $-0.02 | $-0.01 | $-0.02 | $-0.01 | $-0.02 | $-0.01 | $-0.02 | $-0.01 | $-0.01 | $-0.01 |
| EPS Diluted | $-0.01 | $-0.01 | $-0.02 | $-0.01 | $-0.04 | $-0.02 | $-0.04 | $-0.02 | $-0.03 | $-0.02 | $-0.02 | $-0.01 | $-0.02 | $-0.01 | $-0.02 | $-0.01 | $-0.02 | $-0.01 | $-0.01 | $-0.01 |
| Weighted Average Shares Outstanding | 478.17M | 478.17M | 496.51M | 473.52M | 495.64M | 472.85M | 476.21M | 469.79M | 366.91M | 350.49M | 342.27M | 327.17M | 304.53M | 290.53M | 225.89M | 208.76M | 183.25M | 174.83M | 128.38M | 113.34M |
| Weighted Average Shares Outstanding Diluted | 478.16M | 478.16M | 496.51M | 473.49M | 495.64M | 472.85M | 476.21M | 469.77M | 366.91M | 350.49M | 342.27M | 327.16M | 304.53M | 290.53M | 225.89M | 208.75M | 183.25M | 174.83M | 128.38M | 113.34M |
| SEC Filing | Source | Source | Source | Source | Source | Source | Source | Source | Source | Source | Source | Source | Source | Source | Source | Source | Source | Source | Source | Source |
Annual Balance Sheet
| Breakdown | June 30, 2024 | June 30, 2023 | June 30, 2022 | June 30, 2021 | June 30, 2020 |
|---|---|---|---|---|---|
| Cash and Cash Equivalents | $4.16M | $12.38M | $40.75M | $21.80M | $6.79M |
| Short Term Investments | $6.76K | $174.84K | $- | $- | $- |
| Cash and Short Term Investments | $4.17M | $12.56M | $40.75M | $21.80M | $6.79M |
| Net Receivables | $1.72M | $- | $- | $- | $- |
| Inventory | $- | $-2.33M | $-2.18M | $-1.05M | $-2.23M |
| Other Current Assets | $1.71M | $- | $- | $- | $- |
| Total Current Assets | $5.88M | $14.89M | $42.94M | $22.85M | $9.01M |
| Property Plant Equipment Net | $9.68M | $5.06M | $5.90M | $5.38M | $11.90M |
| Goodwill | $- | $- | $- | $- | $- |
| Intangible Assets | $- | $- | $87.16K | $87.16K | $- |
| Goodwill and Intangible Assets | $- | $- | $87.16K | $87.16K | $- |
| Long Term Investments | $3.69M | $8.40M | $13.74M | $575.17K | $114.84K |
| Tax Assets | $- | $- | $- | $-87.16K | $- |
| Other Non-Current Assets | $- | $8.36M | $7.47M | $7.40M | $7.93M |
| Total Non-Current Assets | $13.37M | $21.83M | $27.19M | $13.35M | $19.95M |
| Other Assets | $- | $1 | $- | $- | $- |
| Total Assets | $19.25M | $36.72M | $70.13M | $36.20M | $28.96M |
| Account Payables | $315.46K | $2.86M | $2.39M | $1.24M | $1.51M |
| Short Term Debt | $1.12M | $269.27K | $219.71K | $-2.26M | $-4.91M |
| Tax Payables | $- | $33.81K | $56.28K | $2.42M | $5.04M |
| Deferred Revenue | $- | $33.81K | $56.28K | $2.42M | $5.04M |
| Other Current Liabilities | $1.09M | $2.44M | $2.56M | $-1.30M | $-3.87M |
| Total Current Liabilities | $2.52M | $5.67M | $5.35M | $4.93M | $7.86M |
| Long Term Debt | $- | $133.83K | $423.25K | $138.03K | $258.80K |
| Deferred Revenue Non-Current | $- | $- | $- | $-2.23M | $- |
| Deferred Tax Liabilities Non-Current | $- | $- | $- | $2.23M | $2.34M |
| Other Non-Current Liabilities | $475.60K | $521.39K | $848.23K | $425.38K | $2.80M |
| Total Non-Current Liabilities | $475.60K | $655.22K | $1.27M | $563.40K | $3.06M |
| Other Liabilities | $- | $- | $- | $- | $- |
| Total Liabilities | $2.99M | $6.33M | $6.62M | $5.49M | $10.92M |
| Preferred Stock | $- | $- | $- | $- | $- |
| Common Stock | $131.53M | $127.37M | $127.37M | $61.36M | $38.17M |
| Retained Earnings | $-119.83M | $-105.81M | $-73.66M | $-41.72M | $-21.38M |
| Accumulated Other Comprehensive Income Loss | $8.36M | $9.96M | $8.95M | $7.18M | $1.35M |
| Other Total Stockholders Equity | $- | $- | $- | $-2.95M | $- |
| Total Stockholders Equity | $20.06M | $31.52M | $62.65M | $26.82M | $18.15M |
| Total Equity | $16.26M | $30.39M | $63.51M | $30.71M | $18.03M |
| Total Liabilities and Stockholders Equity | $19.25M | $36.72M | $70.13M | $36.20M | $28.96M |
| Minority Interest | $-3.80M | $-1.12M | $861.35K | $3.89M | $-111.58K |
| Total Liabilities and Total Equity | $19.25M | $36.72M | $70.13M | $36.20M | $28.96M |
| Total Investments | $3.69M | $8.58M | $13.74M | $575.17K | $114.84K |
| Total Debt | $1.12M | $436.92K | $699.23K | $296.27K | $395.53K |
| Net Debt | $-3.04M | $-11.95M | $-40.05M | $-21.50M | $-6.39M |
Balance Sheet Charts
| Breakdown | June 30, 2024 | March 31, 2024 | December 31, 2023 | September 30, 2023 | June 30, 2023 | March 31, 2023 | December 31, 2022 | September 30, 2022 | June 30, 2022 | March 31, 2022 | December 31, 2021 | September 30, 2021 | June 30, 2021 | March 31, 2021 | December 31, 2020 | September 30, 2020 | June 30, 2020 | March 31, 2020 | December 31, 2019 | September 30, 2019 |
|---|---|---|---|---|---|---|---|---|---|---|---|---|---|---|---|---|---|---|---|---|
| Cash and Cash Equivalents | $4.16M | $4.16M | $4.90M | $4.90M | $12.38M | $12.38M | $21.23M | $21.23M | $40.75M | $40.75M | $60.15M | $60.15M | $21.80M | $21.80M | $22.05M | $22.05M | $6.79M | $6.79M | $2.83M | $2.83M |
| Short Term Investments | $6.76K | $6.76K | $118.33K | $118.33K | $174.84K | $174.84K | $- | $- | $- | $- | $- | $- | $- | $- | $- | $- | $- | $- | $- | $- |
| Cash and Short Term Investments | $4.17M | $4.17M | $5.02M | $5.02M | $12.56M | $12.56M | $21.23M | $21.23M | $40.75M | $40.75M | $60.15M | $60.15M | $21.80M | $21.80M | $22.05M | $22.05M | $6.79M | $6.79M | $2.83M | $2.83M |
| Net Receivables | $1.72M | $- | $- | $- | $- | $- | $- | $- | $- | $- | $- | $- | $- | $- | $- | $- | $- | $- | $576.27K | $576.27K |
| Inventory | $- | $- | $-2.14M | $- | $-2.33M | $- | $- | $- | $-2.18M | $- | $-1.88M | $- | $-1.05M | $- | $-2.17M | $- | $-2.23M | $- | $1 | $1 |
| Other Current Assets | $1.71M | $1.71M | $2.14M | $2.14M | $- | $2.33M | $2.46M | $2.46M | $- | $2.18M | $1.88M | $1.88M | $- | $1.05M | $2.17M | $2.17M | $- | $2.23M | $435.46K | $435.46K |
| Total Current Assets | $5.88M | $5.88M | $7.16M | $7.16M | $14.89M | $14.89M | $23.69M | $23.69M | $42.94M | $42.94M | $62.03M | $62.03M | $22.85M | $22.85M | $24.22M | $24.22M | $9.01M | $9.01M | $3.85M | $3.85M |
| Property Plant Equipment Net | $9.68M | $9.68M | $11.98M | $11.98M | $5.06M | $12.61M | $5.65M | $13.19M | $5.90M | $13.37M | $11.35M | $17.23M | $11.38M | $12.78M | $11.97M | $19.42M | $11.90M | $19.83M | $678.80K | $10.88M |
| Goodwill | $- | $- | $- | $- | $- | $- | $- | $- | $- | $- | $- | $- | $- | $- | $- | $- | $- | $- | $- | $- |
| Intangible Assets | $- | $- | $- | $- | $- | $- | $- | $- | $87.16K | $87.16K | $104.59K | $104.59K | $- | $- | $- | $- | $- | $- | $- | $- |
| Goodwill and Intangible Assets | $- | $- | $- | $- | $- | $- | $- | $- | $87.16K | $87.16K | $104.59K | $104.59K | $- | $- | $- | $- | $- | $- | $- | $- |
| Long Term Investments | $3.69M | $1.66M | $7.14M | $7.14M | $8.40M | $8.40M | $11.22M | $11.22M | $13.74M | $12.88M | $5.20M | $4.72M | $575.17K | $- | $549.75K | $- | $114.84K | $- | $496.18K | $- |
| Tax Assets | $- | $- | $- | $- | $- | $- | $- | $- | $- | $- | $- | $- | $- | $- | $- | $- | $- | $- | $- | $- |
| Other Non-Current Assets | $- | $2.03M | $2.11M | $2.11M | $8.36M | $816.59K | $8.32M | $783.10K | $7.47M | $857.79K | $12.23M | $6.84M | $5.80M | $575.17K | $7.45M | $549.75K | $7.93M | $114.84K | $10.20M | $496.18K |
| Total Non-Current Assets | $13.37M | $13.37M | $21.23M | $21.23M | $21.83M | $21.83M | $25.19M | $25.19M | $27.19M | $27.19M | $28.89M | $28.89M | $17.75M | $13.35M | $19.97M | $19.97M | $19.95M | $19.95M | $11.38M | $11.38M |
| Other Assets | $- | $- | $- | $- | $1 | $- | $- | $- | $- | $- | $- | $- | $- | $- | $- | $- | $- | $- | $- | $- |
| Total Assets | $19.25M | $19.25M | $28.39M | $28.39M | $36.72M | $36.72M | $48.88M | $48.88M | $70.13M | $70.13M | $90.93M | $90.93M | $40.60M | $36.20M | $44.19M | $44.19M | $28.96M | $28.96M | $15.23M | $15.23M |
| Account Payables | $315.46K | $315.46K | $1.30M | $1.30M | $2.86M | $2.86M | $2.40M | $2.40M | $2.39M | $2.39M | $2.93M | $2.93M | $4.38M | $1.24M | $703.70K | $703.70K | $1.51M | $1.51M | $492.69K | $492.69K |
| Short Term Debt | $1.12M | $1.12M | $3.10M | $3.10M | $269.27K | $303.08K | $295.65K | $295.65K | $219.71K | $275.98K | $243.49K | $243.49K | $158.25K | $158.25K | $129.70K | $129.70K | $-4.91M | $136.72K | $117.21K | $117.21K |
| Tax Payables | $- | $- | $12.37K | $- | $33.81K | $- | $65.94K | $- | $56.28K | $- | $29.65K | $- | $- | $- | $4.78M | $- | $5.04M | $- | $- | $- |
| Deferred Revenue | $- | $395.47K | $12.37K | $- | $33.81K | $- | $65.94K | $- | $56.28K | $- | $29.65K | $- | $- | $- | $4.78M | $- | $5.04M | $- | $- | $- |
| Other Current Liabilities | $1.09M | $1.09M | $1.42M | $1.43M | $2.44M | $2.51M | $1.64M | $1.70M | $2.56M | $2.68M | $1.48M | $1.51M | $390.19K | $3.53M | $623.88K | $5.40M | $-3.87M | $6.22M | $188.72K | $188.72K |
| Total Current Liabilities | $2.52M | $2.52M | $5.83M | $5.83M | $5.67M | $5.67M | $4.40M | $4.40M | $5.35M | $5.35M | $4.68M | $4.68M | $4.93M | $4.93M | $6.24M | $6.24M | $7.86M | $7.86M | $798.62K | $798.62K |
| Long Term Debt | $- | $- | $99.52K | $99.52K | $133.83K | $133.83K | $273.53K | $273.53K | $423.25K | $423.25K | $278.66K | $278.66K | $138.03K | $138.03K | $197.82K | $197.82K | $258.80K | $258.80K | $314.31K | $314.31K |
| Deferred Revenue Non-Current | $- | $- | $- | $- | $- | $- | $- | $- | $- | $- | $-1 | $- | $- | $- | $-1 | $- | $1 | $- | $- | $- |
| Deferred Tax Liabilities Non-Current | $- | $- | $- | $- | $- | $- | $- | $- | $- | $- | $2.02M | $- | $2.23M | $- | $2.34M | $- | $2.34M | $- | $- | $- |
| Other Non-Current Liabilities | $475.60K | $475.60K | $467.22K | $467.22K | $521.39K | $521.39K | $507.44K | $507.44K | $848.23K | $848.23K | $2.46M | $2.46M | $425.38K | $425.38K | $431.96K | $2.77M | $2.80M | $2.80M | $- | $- |
| Total Non-Current Liabilities | $475.60K | $475.60K | $566.74K | $566.74K | $655.22K | $655.22K | $780.97K | $780.97K | $1.27M | $1.27M | $2.73M | $2.73M | $2.79M | $563.40K | $2.97M | $2.97M | $3.06M | $3.06M | $314.31K | $314.31K |
| Other Liabilities | $- | $- | $- | $- | $- | $- | $1 | $- | $- | $- | $1 | $- | $- | $- | $1 | $- | $- | $- | $1 | $- |
| Total Liabilities | $2.99M | $2.99M | $6.40M | $6.40M | $6.33M | $6.33M | $5.18M | $5.18M | $6.62M | $6.62M | $7.42M | $7.42M | $7.72M | $5.49M | $9.20M | $9.20M | $10.92M | $10.92M | $1.11M | $1.11M |
| Preferred Stock | $- | $- | $- | $- | $- | $- | $- | $- | $- | $- | $- | $- | $- | $- | $- | $- | $- | $- | $- | $- |
| Common Stock | $131.53M | $131.53M | $131.17M | $131.17M | $127.37M | $127.37M | $127.37M | $127.37M | $127.37M | $127.37M | $127.18M | $127.18M | $61.36M | $61.36M | $60.37M | $60.37M | $38.17M | $38.17M | $30.10M | $30.10M |
| Retained Earnings | $-119.83M | $-119.83M | $-118.39M | $-118.39M | $-105.81M | $-105.81M | $-93.49M | $-93.49M | $-73.66M | $-73.66M | $-47.39M | $-47.39M | $-35.84M | $-41.72M | $-28.06M | $-28.06M | $-21.38M | $-21.38M | $-17.68M | $-17.68M |
| Accumulated Other Comprehensive Income Loss | $8.36M | $8.36M | $10.12M | $10.12M | $9.96M | $9.96M | $9.93M | $9.93M | $8.95M | $8.95M | $5.04M | $5.04M | $4.24M | $7.18M | $3.04M | $3.04M | $1.35M | $1.35M | $1.69M | $1.69M |
| Other Total Stockholders Equity | $- | $1 | $- | $- | $- | $1 | $- | $- | $- | $- | $- | $1 | $- | $- | $- | $1 | $- | $- | $- | $- |
| Total Stockholders Equity | $20.06M | $20.06M | $22.90M | $22.90M | $31.52M | $31.52M | $43.80M | $43.80M | $62.65M | $62.65M | $84.83M | $84.83M | $29.77M | $26.82M | $35.34M | $35.34M | $18.15M | $18.15M | $14.11M | $14.11M |
| Total Equity | $16.26M | $16.26M | $21.99M | $21.99M | $30.39M | $30.39M | $43.70M | $43.70M | $63.51M | $63.51M | $83.51M | $83.51M | $32.88M | $30.71M | $34.99M | $34.99M | $18.03M | $18.03M | $14.11M | $14.11M |
| Total Liabilities and Stockholders Equity | $19.25M | $19.25M | $28.39M | $28.39M | $36.72M | $36.72M | $48.88M | $48.88M | $70.13M | $70.13M | $90.93M | $90.93M | $40.60M | $36.20M | $44.19M | $44.19M | $28.96M | $28.96M | $15.23M | $15.23M |
| Minority Interest | $-3.80M | $-3.80M | $-913.39K | $-913.39K | $-1.12M | $-1.12M | $-99.81K | $-99.81K | $861.35K | $861.35K | $-1.32M | $-1.32M | $3.12M | $3.89M | $-357.59K | $-357.59K | $-111.58K | $-111.58K | $- | $- |
| Total Liabilities and Total Equity | $19.25M | $19.25M | $28.39M | $28.39M | $36.72M | $36.72M | $48.88M | $48.88M | $70.13M | $70.13M | $90.93M | $90.93M | $40.60M | $36.20M | $44.19M | $44.19M | $28.96M | $28.96M | $15.23M | $15.23M |
| Total Investments | $3.69M | $1.67M | $7.26M | $7.26M | $8.58M | $8.58M | $11.22M | $11.22M | $13.74M | $12.88M | $5.20M | $4.72M | $575.17K | $- | $549.75K | $- | $114.84K | $- | $496.18K | $- |
| Total Debt | $1.12M | $1.00M | $2.80M | $2.90M | $436.92K | $133.83K | $569.18K | $273.53K | $699.23K | $423.25K | $522.15K | $278.66K | $296.27K | $138.03K | $327.52K | $197.82K | $395.53K | $258.80K | $431.51K | $314.31K |
| Net Debt | $-3.04M | $-3.16M | $-2.10M | $-2.00M | $-11.95M | $-12.25M | $-20.66M | $-20.95M | $-40.05M | $-40.33M | $-59.63M | $-59.87M | $-21.50M | $-21.66M | $-21.73M | $-21.86M | $-6.39M | $-6.53M | $-2.40M | $-2.52M |
Annual Cash Flow
| Breakdown | June 30, 2024 | June 30, 2023 | June 30, 2022 | June 30, 2021 | June 30, 2020 |
|---|---|---|---|---|---|
| Net Income | $-17.33M | $-32.15M | $-31.94M | $-15.88M | $-7.89M |
| Depreciation and Amortization | $1.11M | $1.01M | $1.12M | $804.56K | $227.38K |
| Deferred Income Tax | $- | $-1.49M | $-2.58M | $-2.57M | $-1.75M |
| Stock Based Compensation | $1.55M | $1.49M | $2.58M | $2.57M | $1.75M |
| Change in Working Capital | $617.63K | $-248.64K | $-874.80K | $-1.42M | $1.31M |
| Accounts Receivables | $747.45K | $-71.08K | $-2.35M | $1.08M | $33.93K |
| Inventory | $- | $- | $- | $- | $- |
| Accounts Payables | $- | $-158.79K | $1.21M | $-2.57M | $1.28M |
| Other Working Capital | $-129.82K | $-18.78K | $261.20K | $75.31K | $- |
| Other Non Cash Items | $338.31K | $3.48M | $-4.13M | $1.50M | $-133.82K |
| Net Cash Provided by Operating Activities | $-13.72M | $-27.91M | $-35.82M | $-15.00M | $-6.49M |
| Investments in Property Plant and Equipment | $- | $-73.87K | $-591.71K | $-312.26K | $-353.37K |
| Acquisitions Net | $- | $- | $- | $- | $183.63K |
| Purchases of Investments | $- | $-175.59K | $-9.60M | $- | $- |
| Sales Maturities of Investments | $- | $- | $- | $- | $- |
| Other Investing Activities | $-723.88K | $-175.59K | $-9.70M | $- | $- |
| Net Cash Used for Investing Activities | $-723.88K | $-249.46K | $-10.19M | $-312.26K | $-169.75K |
| Debt Repayment | $-318.21K | $- | $- | $- | $- |
| Common Stock Issued | $5.98M | $1.30K | $69.53M | $30.48M | $13.14M |
| Common Stock Repurchased | $-296.97K | $- | $-4.25M | $- | $- |
| Dividends Paid | $- | $- | $- | $- | $- |
| Other Financing Activities | $833.40K | $-295.54K | $-248.58K | $-130.54K | $- |
| Net Cash Used Provided by Financing Activities | $6.20M | $-294.24K | $65.03M | $30.35M | $13.14M |
| Effect of Forex Changes on Cash | $18.87K | $81.25K | $-65.49K | $-22.63K | $- |
| Net Change in Cash | $-8.22M | $-28.37M | $18.95M | $15.01M | $6.48M |
| Cash at End of Period | $4.16M | $12.38M | $40.75M | $21.80M | $6.79M |
| Cash at Beginning of Period | $12.38M | $40.75M | $21.80M | $6.79M | $307.53K |
| Operating Cash Flow | $-13.72M | $-27.91M | $-35.82M | $-15.00M | $-6.49M |
| Capital Expenditure | $-1.25M | $-73.87K | $-591.71K | $-312.26K | $-353.37K |
| Free Cash Flow | $-14.97M | $-27.98M | $-36.42M | $-15.31M | $-6.84M |
Cash Flow Charts
| Breakdown | December 31, 2023 | September 30, 2023 | June 30, 2023 | March 31, 2023 | December 31, 2022 | September 30, 2022 | June 30, 2022 | March 31, 2022 | December 31, 2021 | September 30, 2021 | June 30, 2021 | March 31, 2021 | December 31, 2020 | September 30, 2020 | June 30, 2020 | March 31, 2020 | December 31, 2019 | September 30, 2019 | June 30, 2019 | March 31, 2019 |
|---|---|---|---|---|---|---|---|---|---|---|---|---|---|---|---|---|---|---|---|---|
| Net Income | $-6.29M | $-6.29M | $-12.32M | $-6.16M | $-19.83M | $-9.92M | $-20.39M | $-8.43M | $-11.55M | $-7.54M | $-7.78M | $-4.60M | $-6.68M | $-3.34M | $-3.70M | $-1.85M | $-4.20M | $-2.10M | $-1.57M | $-783.21K |
| Depreciation and Amortization | $292.67K | $292.67K | $494.00K | $247.00K | $516.93K | $302.07K | $593.51K | $298.53K | $530.56K | $254.80K | $710.85K | $334.45K | $135.65K | $67.83K | $137.42K | $1.43M | $89.95K | $44.98K | $7.67K | $3.83K |
| Deferred Income Tax | $- | $- | $-1.14M | $- | $- | $- | $-430.57K | $- | $- | $- | $- | $- | $- | $- | $- | $- | $- | $- | $- | $- |
| Stock Based Compensation | $120.05K | $120.05K | $196.55K | $196.55K | $549.83K | $549.83K | $286.42K | $286.42K | $1.00M | $1.00M | $699.19K | $699.19K | $585.93K | $585.93K | $225.95K | $225.95K | $650.35K | $650.35K | $77.77K | $77.77K |
| Change in Working Capital | $- | $- | $-44.93K | $-44.93K | $- | $- | $-1.04M | $-1.04M | $- | $- | $575.37K | $575.37K | $- | $- | $16.96K | $16.96K | $- | $- | $42.86K | $42.86K |
| Accounts Receivables | $- | $- | $-35.54K | $-35.54K | $- | $- | $-1.17M | $-1.17M | $- | $- | $537.71K | $537.71K | $- | $- | $16.96K | $16.96K | $- | $- | $33.32K | $33.32K |
| Inventory | $- | $- | $- | $- | $- | $- | $- | $- | $- | $- | $- | $- | $- | $- | $- | $- | $- | $- | $- | $- |
| Accounts Payables | $- | $- | $- | $- | $- | $- | $- | $- | $- | $- | $- | $- | $- | $- | $- | $- | $- | $- | $- | $- |
| Other Working Capital | $- | $- | $-9.39K | $-9.39K | $- | $- | $130.60K | $130.60K | $- | $- | $37.66K | $37.66K | $- | $- | $- | $- | $- | $- | $9.54K | $9.54K |
| Other Non Cash Items | $-333.49K | $-333.49K | $4.38M | $1.54M | $878.96K | $-670.88K | $-1.19M | $-1.55M | $-1.57M | $-1.19M | $-162 | $-1.25M | $307.71K | $-567.73K | $423.04K | $-1.53M | $1.21M | $-134.50K | $296.56K | $19.98K |
| Net Cash Provided by Operating Activities | $-6.21M | $-6.21M | $-8.44M | $-4.22M | $-19.47M | $-9.74M | $-22.17M | $-10.44M | $-13.65M | $-7.47M | $-8.49M | $-4.24M | $-6.51M | $-3.26M | $-3.41M | $-1.71M | $-3.07M | $-1.54M | $-1.28M | $-638.77K |
| Investments in Property Plant and Equipment | $-2.63K | $-2.63K | $-70.39K | $-35.20K | $-3.48K | $-1.74K | $-261.74K | $-141.35K | $-329.97K | $-102.21K | $-91.22K | $-45.61K | $-221.04K | $-110.52K | $-247.30K | $-123.65K | $-106.08K | $-53.04K | $-79.56K | $-39.78K |
| Acquisitions Net | $- | $- | $- | $- | $- | $- | $- | $- | $- | $- | $- | $- | $- | $- | $183.63K | $91.81K | $- | $- | $- | $- |
| Purchases of Investments | $- | $- | $-175.59K | $- | $- | $- | $3.87M | $- | $-13.47M | $- | $- | $- | $- | $- | $- | $- | $- | $- | $- | $- |
| Sales Maturities of Investments | $- | $- | $- | $- | $- | $- | $- | $- | $- | $- | $- | $- | $- | $- | $- | $- | $- | $- | $- | $- |
| Other Investing Activities | $-693.00K | $-693.00K | $-87.80K | $-87.80K | $- | $- | $-1.79M | $-1.79M | $-3.07M | $-3.07M | $- | $- | $- | $- | $-1 | $-1 | $- | $- | $-20.00K | $-10.00K |
| Net Cash Used for Investing Activities | $-695.63K | $-695.63K | $-245.99K | $-122.99K | $-3.48K | $-1.74K | $3.61M | $-1.93M | $-13.80M | $-3.17M | $-91.22K | $-45.61K | $-221.04K | $-110.52K | $-63.67K | $-31.84K | $-106.08K | $-53.04K | $-99.56K | $-49.78K |
| Debt Repayment | $- | $- | $- | $- | $- | $- | $- | $- | $- | $- | $- | $- | $- | $- | $- | $- | $- | $- | $- | $- |
| Common Stock Issued | $3.81M | $- | $- | $- | $1.30K | $- | $-588.87K | $- | $65.87M | $- | $8.44M | $- | $22.04M | $- | $7.43M | $- | $5.71M | $- | $484.82K | $- |
| Common Stock Repurchased | $- | $- | $- | $- | $- | $- | $- | $- | $- | $- | $- | $- | $- | $- | $- | $- | $- | $- | $- | $- |
| Dividends Paid | $- | $- | $- | $- | $- | $- | $- | $- | $- | $- | $- | $- | $- | $- | $- | $- | $- | $- | $- | $- |
| Other Financing Activities | $3.16M | $3.16M | $-80.62K | $-80.62K | $-66.50K | $-66.50K | $-758.54K | $-316.50K | $65.79M | $32.83M | $8.31M | $4.15M | $22.04M | $11.02M | $3.71M | $3.71M | $2.85M | $2.85M | $242.41K | $242.41K |
| Net Cash Used Provided by Financing Activities | $3.16M | $3.16M | $-161.24K | $-80.62K | $-133.00K | $-66.50K | $-758.54K | $-316.50K | $65.79M | $32.83M | $8.31M | $4.15M | $22.04M | $11.02M | $7.43M | $3.71M | $5.71M | $2.85M | $484.82K | $242.41K |
| Effect of Forex Changes on Cash | $9.44K | $9.44K | $-1 | $-1 | $40.63K | $40.63K | $-39.14K | $-39.14K | $6.40K | $6.40K | $9.23K | $9.23K | $-20.55K | $-20.55K | $- | $- | $- | $- | $- | $- |
| Net Change in Cash | $-7.48M | $-3.74M | $-8.84M | $-4.42M | $-19.53M | $-9.76M | $-19.40M | $-12.73M | $38.35M | $22.20M | $-253.17K | $-126.58K | $15.27M | $7.63M | $3.95M | $1.98M | $2.53M | $1.26M | $-892.28K | $-446.14K |
| Cash at End of Period | $4.90M | $-3.74M | $12.38M | $16.80M | $21.23M | $-9.76M | $40.75M | $53.48M | $60.15M | $22.20M | $21.80M | $21.93M | $22.05M | $7.63M | $6.79M | $4.81M | $2.83M | $1.26M | $307.53K | $753.67K |
| Cash at Beginning of Period | $12.38M | $- | $21.23M | $21.23M | $40.75M | $- | $60.15M | $66.21M | $21.80M | $- | $22.05M | $22.05M | $6.79M | $- | $2.83M | $2.83M | $307.53K | $- | $1.20M | $1.20M |
| Operating Cash Flow | $-6.21M | $-6.21M | $-8.44M | $-4.22M | $-19.47M | $-9.74M | $-22.17M | $-10.44M | $-13.65M | $-7.47M | $-8.49M | $-4.24M | $-6.51M | $-3.26M | $-3.41M | $-1.71M | $-3.07M | $-1.54M | $-1.28M | $-638.77K |
| Capital Expenditure | $-2.63K | $-2.63K | $-70.39K | $-35.20K | $-3.48K | $-1.74K | $-261.74K | $-141.35K | $-329.97K | $-102.21K | $-91.22K | $-45.61K | $-221.04K | $-110.52K | $-247.30K | $-123.65K | $-106.08K | $-53.04K | $-79.56K | $-39.78K |
| Free Cash Flow | $-6.21M | $-6.21M | $-8.51M | $-4.25M | $-19.47M | $-9.74M | $-22.43M | $-10.59M | $-13.98M | $-7.57M | $-8.58M | $-4.29M | $-6.73M | $-3.37M | $-3.66M | $-1.83M | $-3.18M | $-1.59M | $-1.36M | $-678.55K |
Blackstone Minerals Dividends
Explore Blackstone Minerals's dividend history, including dividend yield, payout ratio, and historical payments.
Blackstone Minerals News
Read the latest news about Blackstone Minerals, including recent articles, headlines, and updates.
CaNickel Announces Expiry of Option Agreement for Sale of the Bucko Lake Mine to Cobalt One and Blackstone Minerals
Vancouver, British Columbia--(Newsfile Corp. - January 6, 2025) - CaNickel Mining Limited (TSXV: CML) ("CaNickel" or the "Company") announces that the Option Agreement it signed with Cobalt One Energy Corporation ("Cobalt One") and Blackstone Minerals Limited ("Blackstone Minerals") on December 4, 2023, pursuant to which Cobalt One had been granted the exclusive right and option for a 12-month period (the "Option") to purchase CaNickel's 100% owned Bucko Lake Mine Project (the "Project") located approximately 110 km southwest of Thompson, Manitoba, has expired. "Recent nickel price weakness has unfortunately impacted the ability of Cobalt One and Blackstone Minerals to finance this transaction within the time period allotted in the Option," stated Shirley Anthony, Chief Executive Officer of CaNickel.

Blackstone Secures Option to Acquire Major Nickel Asset
HIGHLIGHTS Blackstone has executed an option agreement to acquire 100% of the Wabowden nickel sulphide project located in the world-class Thompson Nickel Belt in Manitoba, Canada. Attractive opportunity for Blackstone given large scale resource base, established infrastructure, low-cost hydro power and synergies with Blackstone's other strategic nickel interests in Manitoba.

Blackstone Minerals makes strategic investment in one of the largest undeveloped nickel resources globally
Blackstone Minerals Ltd (ASX:BSX, OTCQX:BLSTF) has made a strategic investment in NICO Resources Limited, which successfully completed its initial public offering (IPO) and listed on January 17, 2021. Blackstone's initial investment of A$2.75 million gives it a 15.11% interest in the common equity of NICO.

Blackstone Minerals maintains $1.00 share price target and BUY rating from Euroz Hartleys following updated Ta Khoa resource
Blackstone Minerals Ltd (ASX:BSX, OTCQX:BLSTF) has maintained a speculative buy rating from stockbroking firm Euroz Hartleys and retained a share price target of $1.00 following an updated mineral resource for its Ta Khoa nickel-cobalt-platinum group metals (PGE) project in Vietnam. The Ta Khoa global resource was increased to 130 million tonnes at 0.37% nickel for 485,000 tonnes of nickel equivalent.

Blackstone Minerals delivers 73% boost in Ta Khoa nickel resource to 485,000 tonnes
Blackstone Minerals Ltd (ASX:BSX, OTCQX:BLSTF) has delivered an impressive 73% increase in the mineral resource for its Ta Khoa Nickel Project in northern Vietnam, bringing the asset up to 485,000-tonnes of nickel with strong upside potential. A global resource update is founded on an upgrade for the cornerstone Ban Phuc deposit along with maiden inferred resources at the Ban Chang, King Snake and Ban Khoa targets.
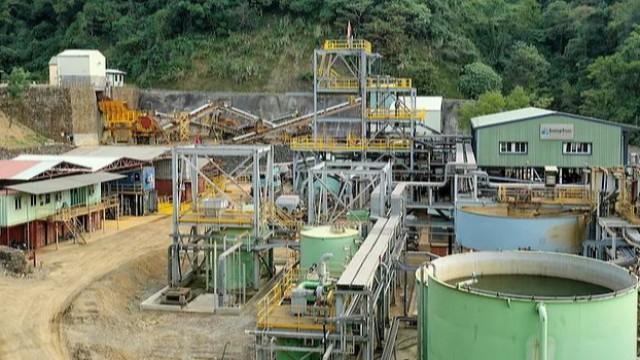
Blackstone Minerals passes key milestone with underground mining restarting at Ta Khoa Nickel Project in Vietnam
Blackstone Minerals Ltd (ASX:BSX, OTCQX:BLSTF) has notched up a key achievement with underground mining activities recommencing at its 90%-owned Ta Khoa Nickel Project in northern Vietnam. Using a combination of Australian and Vietnamese mining professionals and operators, Blackstone plans to complete around 1,000 metres of development through the Ban Phuc disseminated orebody generating nickel ore representative of the life of mine plant feed.
Blackstone Minerals shines with first hole at Jewel prospect in Canada intersecting copper, nickel and cobalt
Blackstone Minerals Ltd (ASX:BSX, OTCQX:BLSTF) has added exploration upside to its Gold Bridge Project in British Columbia, Canada, by intersecting copper, nickel and cobalt mineralisation in the first hole drilled at Jewel prospect. Drilling targeted a large, induced polarisation (IP) anomaly at this prospect and intersected massive sulpharsenide vein mineralisation.
Blackstone Minerals Ltd completes A$5.3 million share purchase plan to follow A$22 million placement
Blackstone Minerals Ltd (ASX:BSX, OTCQX:BLSTF) has raised A$5.3 million in an oversubscribed share purchase plan (SPP), part of the ongoing A$60 million capital raise to fund its Ta Khoa Nickel-Copper-Platinum Group Element (PGE) Project in Vietnam. As per the SPP, the company will issue 9.1 million shares at A$0.58 cents apiece on November 26, 2021, with trading on the ASX expected to begin on November 29, 2021.

Blackstone Minerals continues to intersect MSV's at Ta Khoa Nickel-Copper-PGE Project for inclusion in upstream PFS
Blackstone Minerals Ltd's (ASX:BSX) (OTCMKTS:BLSTF) (FRA:B9S) March 2021 quarter was "transformative" as it continued with its aggressive drilling program and expressed confidence that its Ta Khoa Nickel-Copper-PGE project will feed a significant downstream refinery in Vietnam. The company, which outlined its plans to expand its downstream refinery capacity to the market in the quarter, said that executing on the planned strategy will turn the company into a globally significant Class-1 nickel producer.
Blackstone Minerals enhances nickel sulphide exposure with investment in large Canadian project
Blackstone Minerals Ltd (ASX:BSX, OTCQX:BLSTF) has made a strategic investment in Flying Nickel Mining Corp, a subsidiary of Vancouver-based Silver Elephant Mining Corp, gaining exposure to a large nickel sulphide project and advancing efforts toward a fully vertically integrated battery metals business. Flying Nickel intends to list on the TSX Ventures Exchange in early 2022 with its core asset, the Minago Nickel Sulphide Project southwest of Thompson in Manitoba, Canada.


Blackstone Minerals brings strong geological expertise with board appointment
Blackstone Minerals Ltd (ASX:BSX, OTCQX:BLSTF) has enhanced the skillset of its board through the appointment of Dr Frank Bierlein as a non-executive director. The company will leverage Dr Bierlein's geological expertise, drawn from a career spanning three decades, six continents and multiple commodities.

Blackstone Minerals raises A$22.1 million in first tranche of A$55 million capital raising
Blackstone Minerals Ltd has made good on the first phase of its plan to raise A$55 million to continue driving its Ta Khoa Nickel-Copper-Platinum Group Element (PGE) Project in Vietnam toward production. The first tranche of more than 38 million new shares was issued at A$0.58 and has raised A$22.1 million before costs.

Blackstone Minerals inaugural sustainability report sets highest levels of ESG compliance
Blackstone Minerals Ltd (ASX:BSX, OTCQX:BLSTF) has published its inaugural sustainability report, describing the company's commitment to create a baseline for future reporting and transparency, and set benchmarks from which to work towards “the highest levels of Environmental, Social and Governance (ESG) compliance.” Blackstone's flagship Ta Khoa Nickel-Copper-Platinum Group Elements (PGE) Project in Vietnam presents what the company calls a compelling opportunity: a nickel product mined and refined using hydroelectric power, with strong support from the local community, in one of the fastest-growing electric vehicle and lithium-ion battery hubs in Australasia.

Blackstone Minerals readies for new pilot plant phase of nickel sulphide project with A$60 million capital raise
Blackstone Minerals Ltd is readying for the next chapter at its Ta Khoa Nickel-Copper-Platinum Group Element (PGE) Project in Vietnam with a A$60 million capital raise. The battery metals stock will field A$55 million from a heavily oversubscribed placement and is out to raise a further A$5 million from a share purchase plan.

Blackstone Minerals positions to be leader in implementing mine-to-consumer nickel traceability into EVs
Blackstone Minerals Ltd has partnered with Circulor Ltd, a UK-headquartered industry leader in supply chain traceability, to establish a full Nickel and Cathode Precursor (PCAM) traceability system with dynamic carbon dioxide equivalent and environmental, social and governance tracking for its Vietnam Ta Khoa assets, a first in South-East Asia. End users are now demanding traceability for all products in the electric vehicle and energy storage sectors because of increasing awareness of the impacts associated with nickel and other critical raw materials sourced for battery production.
Blackstone Minerals strengthens the team behind its downstream DFS
Blackstone Minerals Ltd has appointed Tier 1 engineering, minerals processing and metallurgical consultants Wood and ALS to help it deliver a definitive feasibility study (DFS) for the downstream Ta Khoa Refinery (TKR) in Vietnam. The company is focused on building an integrated upstream and downstream battery metals processing business in Vietnam that produces Nickel: Cobalt: Manganese (NCM) Precursor products for Asia's growing lithium-ion battery industry.

Blackstone Minerals initiated by Shaw and Partners with a A$1.90 per share price target
Blackstone Minerals Ltd has been initiated by investment and wealth manager Shaw and Partners with a buy recommendation and a price target of A$1.90 per share, implying a four-fold upside from the current share price of 46 cents. The company owns a 90% Interest in the Ta Khoa Nickel-Cu-PGE Project in the Son La Province of Vietnam.

Blackstone Minerals will collaborate with Vietnamese Government to identify new nickel opportunities
Blackstone Minerals Ltd will collaborate with the Vietnamese Government to identify new nickel opportunities outside of the company's Ta Khoa nickel-copper-PGE district tenement holdings in the country's north. The company's 90%-owned subsidiary Ban Phuc Nickel Mines (BPNM) will work with the General Department of Geology & Minerals of Vietnam (GDGMV), initially conducting new geophysics exploration to advance the Chim Van target, a highly prospective nickel target, 10 kilometres from the company's large Ban Phuc open-pit deposit.
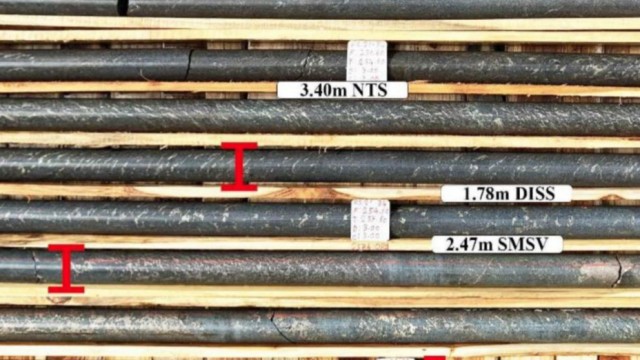
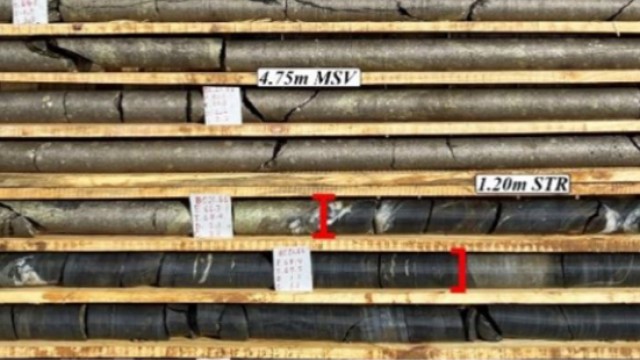
Blackstone Minerals intersects 8.5 metres of massive, semi-massive nickel sulphides at King Snake
Blackstone Minerals Ltd has intersected 8.5 metres of massive sulphide vein (MSV), semi-massive sulphide vein (SMSV) and net textured sulphide (NTS) from infill drill hole KS21-34 at the King Snake prospect within Ta Khoa Nickel-Copper-PGE Project in Northern Vietnam. Several assays have also been received from drilling at King Snake with highlights including: KS21-18: 1.18 metres at 1.73% nickel, 1.09% copper, 0.06% cobalt & 1.07g/t PGE1 from 190.62 metres; KS21-19: 4.90 metres at 1.09% nickel, 0.97% copper, 0.04% cobalt & 0.89g/t PGE1 from 133 metres including 1.88 metres at 2.66% nickel, 1.92% copper, 0.1% cobalt & 2.13g/t PGE1 from 134.68 metres; and KS21-29: 1.16 metres at 1.06% nickel, 2.21% copper, 0.04% cobalt & 3.7g/t PGE1 from 42.34 metres.
Blackstone Minerals hits 5.35 metres of massive nickel sulphide at Ta Khoa's Ban Chang target
Blackstone Minerals Ltd has intersected more massive nickel sulphide during infill drilling at a key target within its Ta Khoa Nickel-Copper-Platinum Group Element (PGE) Project in northern Vietnam. The base metal explorer hit 5.35 metres of massive nickel sulphide within a broader 11.4-metre intersection at Ban Chang, the most advanced massive sulphide vein (MSV) target within the multi-element asset.
Blackstone Minerals intersects 147 metres of disseminated nickel sulphide in maiden drilling at Ban Khoa
Blackstone Minerals Ltd has intersected 147 metres of disseminated nickel sulphide during its maiden drilling at the new Ban Khoa prospect within Ta Khoa Nickel-Copper-PGE Project in northern Vietnam. Ban Khoa is a bulk tonnage open pit opportunity that has potential to provide mine life extension and complement mining at the nearby large Ban Phuc open pit deposit.
Blackstone Minerals appoints major Korean bank as debt advisor for Ta Khoa Project
Blackstone Minerals Ltd has appointed leading independent advisors to arrange debt financing for the development of its vertically integrated Ta Khoa Nickel-Copper-PGE (platinum group elements) Project and Downstream Refinery Project in Vietnam. The company will act jointly and in collaboration with the Korea Development Bank (KDB) and BurnVoir Corporate Finance to secure an attractive, flexible funding package for the development of the project.

Blackstone Minerals increases Ban Phuc resource confidence on intersecting 375 metres of nickel sulphide from 2 metres
Blackstone Minerals Ltd has intersected 375 metres of nickel sulphide from 2 metres at the Ban Phuc DSS deposit within the wider Ta Khoa Nickel-Copper-PGE Project in northern Vietnam, demonstrating the large bulk tonnage potential. The company has been undertaking a final infill drill program and has received some of the best, broad intersections at the deposit to date, including: 374.7 metres at 0.3% nickel (Ni), 0.01% copper (Cu), 0.01% cobalt (Co) and 0.07 g/t platinum group elements (PGE) from 2 metres, including 49 metres at 0.45% Ni, 0.04% Cu, 0.01% CO and 0.17 g/t PGE from 2 metres; 211.38 metres at 0.43% Ni, 0.03% Cu, 0.01% Co and 0.13 g/t PGE from 111.62 metres, including 52.24 metres at 0.74% Ni, 0.11% Cu, 0.01% Co and 0.31 g/t PGE from 241 metres; 156.25 metres 0.50% Ni, 0.07% Cu, 0.01% Co and 0.15 g/t PGE from 79.75 metres, including 31.05 metres at 0.75% Ni, 0.14% Cu, 0.01% Co and 0.26 g/t PGE from 83.75 metres; and 169 metres at 0.43% Ni, 0.04% Cu, 0.01% Co and 0.15 g/t PGE from 62 metres, including 10.3 metres at 1.13% Ni, 0.18% Cu, 0.02% Co and 0.48 g/t PGE from 98 metres.

Blackstone Minerals coverage comes with A$1.90 target and buy recommendation
Blackstone Minerals Ltd's potential to become a globally significant green battery metals supplier has led Shaw and Partners to initiate coverage with a buy recommendation and A$1.90 price target. This is well above last sales at A$0.43.

Blackstone Minerals substantial holder Delphi AG lifts stake to 17.87%
Blackstone Minerals Ltd (ASX:BSX, OTCQX:BLSTF, FRA:B9S) substantial holder Delphi Unternehmensberatung AG and related entities have increased their stake in the nickel sulphide explorer to 17.87% from 16.79%. This move further demonstrates the strong support from the Wilhelm KT Zours backed German investors for junior resource companies with solid exploration success, strong projects and firm development plans.

Blackstone Minerals' board of directors approve first phase pilot plant work and DFS at Ta Khoa Refinery
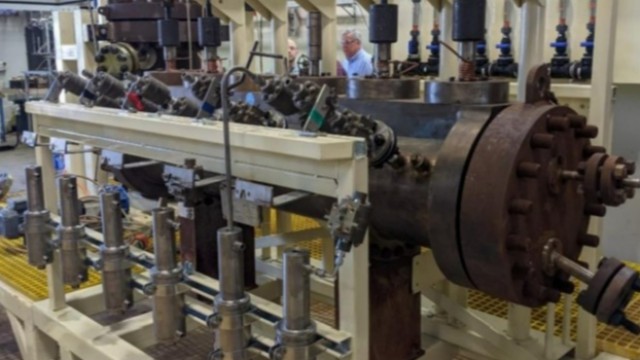
Blackstone Minerals Ltd's board of directors have approved the first phase of pilot plant work at the Ta Khoa Refinery (TKR) in Vietnam, as well as the definitive feasibility study, following compelling pre-feasibility study (PFS) outcomes. The first phase of piloting will be designed to process 20 kilograms per hour of nickel concentrate feed and will produce approximately 1.75 kilograms per hour of nickel in nickel-cobalt-manganese (NCM) products.

Blackstone Minerals passes key milestone as downstream PFS confirms technically and economically robust hydrometallurgical refining process
Blackstone Minerals Ltd has welcomed the outcomes of a pre-feasibility study (PFS) for the proposed downstream Ta Khoa Refinery (TKR) in Northern Vietnam that confirms a technically and economically robust hydrometallurgical refining process The PFS considers a refinery that can process up to 400,000 tonnes of nickel concentrate per annum over a 10-year life of operation and will require just under US$500,000 in upfront project capital to construct. Ultimately, Blackstone says the PFS demonstrates that a very low capital intensity is required for the TKR to produce Class I nickel at a scale that would make Blackstone a globally significant producer.
Blackstone Minerals produces battery-grade NCM811 precursor sample on path to downstream value-add
Blackstone Minerals Ltd (ASX:BSX) (OTCMKTS:BLSTF) (FRA:B9S) has produced the first batch of battery-grade Nickel:Cobalt:Manganese 811 (NCM811) precursor sample, as it aims to provide batteries for Asia's growing lithium-ion battery industry. NCM811 is a type of battery using an 8:1:1 ratio of nickel, cobalt and manganese with Blackstone's first precursor sample achieving an NCM purity of in excess of 99.7%.
Similar Companies
Related Metrics
Explore detailed financial metrics and analysis for BLSTF.