Bird Global Key Executives
This section highlights Bird Global's key executives, including their titles and compensation details.
Find Contacts at Bird Global
(Showing 0 of )
Bird Global Earnings
This section highlights Bird Global's earnings, including key dates, EPS, earnings reports, and earnings call transcripts.
Next Earnings Date
Last Earnings Results
Earnings Call Transcripts
| Transcript | Quarter | Year | Date | Estimated EPS | Actual EPS |
|---|---|---|---|---|---|
| Read Transcript | Q2 | 2023 | 2023-08-10 | N/A | N/A |
| Read Transcript | Q1 | 2023 | 2023-05-11 | $-0.08 | $-3.50 |

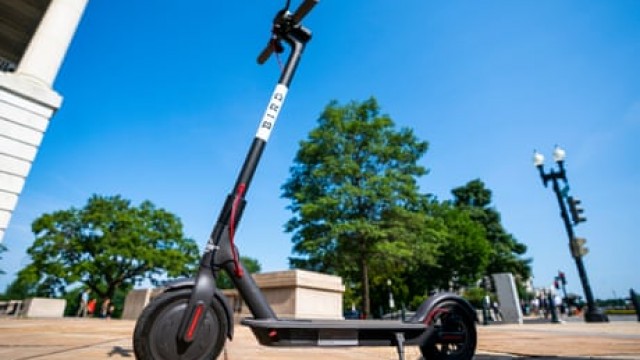
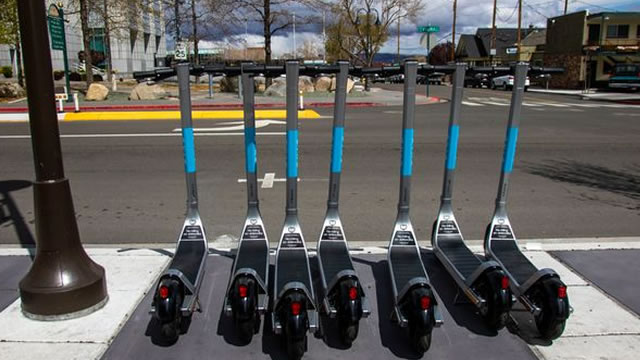
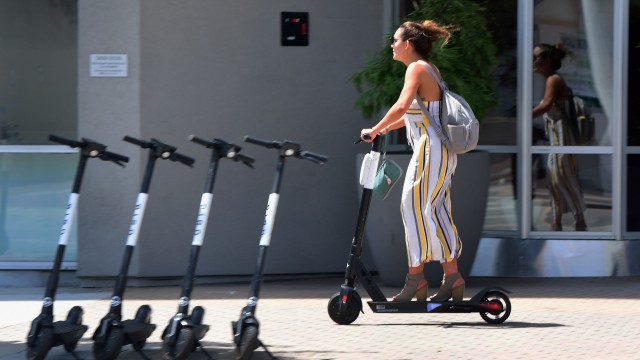
Bird Global, Inc., a micromobility company, engages in delivering electric transportation solutions for short distances. Its sharing vehicles include e-scooters and e-bikes. The company offers a fleet of shared micro electric vehicles to riders through bird.co, as well as sells vehicles to distributors, retailers, and direct customers. Bird Global, Inc. was founded in 2017 and is headquartered in Miami, Florida.
$0.08
Stock Price
$1.34M
Market Cap
427
Employees
Miami, FL
Location
Financial Statements
Access annual & quarterly financial statements for Bird Global, including income statements, balance sheets, and cash flow statements..
Annual Income Statement
| Breakdown | December 31, 2022 | December 31, 2021 | December 31, 2020 | December 31, 2019 |
|---|---|---|---|---|
| Revenue | $244.66M | $205.14M | $90.11M | $150.52M |
| Cost of Revenue | $209.96M | $165.74M | $115.99M | $286.20M |
| Gross Profit | $34.70M | $39.41M | $-25.89M | $-135.68M |
| Gross Profit Ratio | 14.18% | 19.20% | -28.73% | -90.14% |
| Research and Development Expenses | $40.11M | $31.43M | $34.38M | $40.84M |
| General and Administrative Expenses | $233.81M | $210.00M | $154.37M | $192.06M |
| Selling and Marketing Expenses | $16.32M | $17.91M | $18.40M | $16.66M |
| Selling General and Administrative Expenses | $250.13M | $227.90M | $172.78M | $208.72M |
| Other Expenses | $125.40M | $29.87M | $5.95M | $2.98M |
| Operating Expenses | $290.24M | $259.33M | $207.15M | $249.56M |
| Cost and Expenses | $500.19M | $425.07M | $323.14M | $535.75M |
| Interest Income | $- | $- | $- | $- |
| Interest Expense | $10.77M | $6.07M | $6.56M | $4.96M |
| Depreciation and Amortization | $187.11M | $81.47M | $13.46M | $119.93M |
| EBITDA | $-68.42M | $-157.05M | $-194.60M | $-265.30M |
| EBITDA Ratio | -27.97% | -67.49% | -215.97% | -176.25% |
| Operating Income | $-255.53M | $-219.92M | $-208.05M | $-385.23M |
| Operating Income Ratio | -104.44% | -107.21% | -230.90% | -255.93% |
| Total Other Income Expenses Net | $-101.20M | $39.08M | $-616.00K | $-1.98M |
| Income Before Tax | $-356.73M | $-196.12M | $-208.67M | $-387.21M |
| Income Before Tax Ratio | -145.81% | -95.60% | -231.58% | -257.24% |
| Income Tax Expense | $2.01M | $209.00K | $64.00K | $276.00K |
| Net Income | $-358.74M | $-196.33M | $-208.73M | $-387.48M |
| Net Income Ratio | -146.63% | -95.71% | -231.66% | -257.42% |
| EPS | $-1.32 | $-18.00 | $-19.02 | $-35.31 |
| EPS Diluted | $-1.32 | $-18.00 | $-19.02 | $-35.31 |
| Weighted Average Shares Outstanding | 272.62M | 10.90M | 10.97M | 10.97M |
| Weighted Average Shares Outstanding Diluted | 272.62M | 10.90M | 10.97M | 10.97M |
| SEC Filing | Source | Source | Source | Source |
| Breakdown | September 30, 2023 | June 30, 2023 | March 31, 2023 | December 31, 2022 | September 30, 2022 | June 30, 2022 | March 31, 2022 | December 31, 2021 | September 30, 2021 | June 30, 2021 | March 31, 2021 | December 31, 2020 | September 30, 2020 |
|---|---|---|---|---|---|---|---|---|---|---|---|---|---|
| Revenue | $54.33M | $48.33M | $29.54M | $69.66M | $72.86M | $76.66M | $37.98M | $54.02M | $65.41M | $55.65M | $24.25M | $19.42M | $40.19M |
| Cost of Revenue | $35.09M | $28.98M | $24.45M | $40.25M | $45.15M | $90.01M | $34.55M | $45.86M | $51.94M | $45.51M | $23.63M | $23.64M | $39.10M |
| Gross Profit | $19.24M | $19.35M | $5.08M | $29.41M | $27.71M | $-13.35M | $3.42M | $8.16M | $13.46M | $10.15M | $617.00K | $-4.22M | $1.08M |
| Gross Profit Ratio | 35.40% | 40.00% | 17.20% | 42.20% | 38.00% | -17.40% | 9.00% | 15.10% | 20.60% | 18.20% | 2.50% | -21.72% | 2.69% |
| Research and Development Expenses | $1.41M | $3.73M | $6.98M | $7.89M | $9.39M | $12.32M | $10.51M | $12.33M | $5.80M | $5.99M | $7.30M | $6.11M | $6.16M |
| General and Administrative Expenses | $31.39M | $30.42M | $31.64M | $47.89M | $16.88M | $84.39M | $84.65M | $117.21M | $30.84M | $31.77M | $29.38M | $34.20M | $35.38M |
| Selling and Marketing Expenses | $963.00K | $1.18M | $1.94M | $2.73M | $3.18M | $5.36M | $5.05M | $7.03M | $3.39M | $3.98M | $3.51M | $4.77M | $4.28M |
| Selling General and Administrative Expenses | $32.35M | $31.61M | $33.58M | $50.62M | $20.05M | $89.75M | $89.70M | $124.23M | $34.23M | $35.75M | $32.89M | $38.97M | $39.66M |
| Other Expenses | $86.00K | $8.27M | $-5.98M | $-2.82M | $-3.88M | $23.52M | $108.58M | $89.98M | $-9.99M | $-14.46M | $-35.65M | $5.78M | $2.52M |
| Operating Expenses | $33.77M | $35.34M | $40.55M | $58.51M | $29.44M | $102.08M | $100.21M | $136.56M | $40.03M | $41.74M | $40.19M | $45.08M | $45.82M |
| Cost and Expenses | $68.86M | $64.33M | $65.01M | $98.76M | $74.59M | $192.08M | $134.77M | $182.42M | $91.98M | $87.24M | $63.81M | $68.72M | $84.92M |
| Interest Income | $6.00K | $105.00K | $7.00K | $- | $- | $- | $- | $- | $- | $- | $- | $- | $- |
| Interest Expense | $2.02M | $1.91M | $1.97M | $3.00M | $3.77M | $2.61M | $1.40M | $1.06M | $325.00K | $3.11M | $1.57M | $1.56M | $1.51M |
| Depreciation and Amortization | $9.81M | $8.05M | $4.25M | $17.93M | $12.14M | $258.66M | $9.51M | $14.51M | $18.47M | $12.53M | $6.09M | $7.38M | $2.52M |
| EBITDA | $-4.63M | $-16.73M | $-35.47M | $-11.17M | $-1.73M | $-331.24M | $21.30M | $-81.45M | $-26.57M | $-33.52M | $-69.13M | $-36.14M | $-42.22M |
| EBITDA Ratio | -8.52% | 0.88% | -105.68% | -16.03% | 8.95% | -94.68% | 56.09% | -71.12% | -27.66% | -60.23% | -285.12% | -186.06% | -105.06% |
| Operating Income | $-14.63M | $-16.73M | $-35.47M | $-29.10M | $-5.61M | $-331.24M | $11.79M | $-128.40M | $-26.57M | $-31.59M | $-39.57M | $-48.95M | $-44.74M |
| Operating Income Ratio | -26.93% | -34.62% | -120.08% | -41.77% | -7.70% | -432.08% | 31.04% | -237.68% | -40.62% | -56.76% | -163.19% | -252.03% | -111.34% |
| Total Other Income Expenses Net | $-1.93M | $6.47M | $-7.94M | $-5.81M | $-7.65M | $20.91M | $-1.40M | $82.72M | $-10.32M | $-17.58M | $-37.22M | $4.23M | $1.00M |
| Income Before Tax | $-16.56M | $-10.27M | $-43.41M | $-34.91M | $-9.38M | $-310.33M | $10.39M | $-39.48M | $-36.89M | $-49.17M | $-76.79M | $-44.72M | $-43.73M |
| Income Before Tax Ratio | -30.48% | -21.24% | -146.97% | -50.12% | -12.87% | -404.81% | 27.35% | -73.08% | -56.40% | -88.34% | -316.71% | -230.26% | -108.83% |
| Income Tax Expense | $3.25M | $-956.00K | $908.00K | $1.50M | $389.00K | $84.00K | $37.00K | $99.00K | $-20.00K | $110.00K | $20.00K | $-83.00K | $60.00K |
| Net Income | $-19.81M | $-9.31M | $-44.32M | $-36.41M | $-9.77M | $-310.42M | $10.35M | $-39.58M | $-36.87M | $-49.28M | $-76.81M | $-44.64M | $-43.80M |
| Net Income Ratio | -36.47% | -19.26% | -150.04% | -52.26% | -13.40% | -404.92% | 27.26% | -73.26% | -56.37% | -88.54% | -316.79% | -229.84% | -108.98% |
| EPS | $-1.47 | $-0.73 | $-3.50 | $-0.13 | $-0.03 | $-1.14 | $0.04 | $-3.63 | $-3.36 | $-4.49 | $-7.00 | $0.00 | $-3.99 |
| EPS Diluted | $-1.47 | $-0.73 | $-3.50 | $-0.13 | $-0.03 | $-1.14 | $0.04 | $-3.63 | $-3.36 | $-4.49 | $-7.00 | $0.00 | $-3.99 |
| Weighted Average Shares Outstanding | 13.49M | 12.78M | 12.65M | 272.62M | 280.91M | 272.02M | 280.95M | 10.90M | 10.97M | 10.97M | 10.97M | - | 10.97M |
| Weighted Average Shares Outstanding Diluted | 13.49M | 12.78M | 12.65M | 272.62M | 280.91M | 272.02M | 280.95M | 10.90M | 10.97M | 10.97M | 10.97M | - | 10.97M |
| SEC Filing | Source | Source | Source | Source | Source | Source | Source | Source | Source | Source | Source | Source | Source |
Annual Balance Sheet
| Breakdown | December 31, 2022 | December 31, 2021 | December 31, 2020 |
|---|---|---|---|
| Cash and Cash Equivalents | $33.47M | $128.56M | $43.16M |
| Short Term Investments | $- | $- | $- |
| Cash and Short Term Investments | $33.47M | $128.56M | $43.16M |
| Net Receivables | $13.94M | $8.40M | $2.86M |
| Inventory | $1.53M | $28.24M | $5.26M |
| Other Current Assets | $15.84M | $63.92M | $17.21M |
| Total Current Assets | $64.78M | $229.12M | $68.48M |
| Property Plant Equipment Net | $149.48M | $237.55M | $98.55M |
| Goodwill | $- | $121.17M | $131.25M |
| Intangible Assets | $- | $- | $- |
| Goodwill and Intangible Assets | $- | $121.17M | $131.25M |
| Long Term Investments | $- | $- | $- |
| Tax Assets | $- | $- | $- |
| Other Non-Current Assets | $11.39M | $9.43M | $4.94M |
| Total Non-Current Assets | $160.87M | $368.15M | $234.75M |
| Other Assets | $- | $- | $- |
| Total Assets | $225.66M | $597.26M | $303.23M |
| Account Payables | $20.23M | $5.00M | $12.21M |
| Short Term Debt | $22.20M | $49.09M | $29.28M |
| Tax Payables | $- | $- | $- |
| Deferred Revenue | $47.82M | $43.34M | $47.40M |
| Other Current Liabilities | $44.36M | $17.42M | $23.75M |
| Total Current Liabilities | $134.62M | $133.96M | $112.64M |
| Long Term Debt | $56.20M | $- | $- |
| Deferred Revenue Non-Current | $- | $- | $- |
| Deferred Tax Liabilities Non-Current | $- | $- | $- |
| Other Non-Current Liabilities | $9.72M | $142.48M | $1.05B |
| Total Non-Current Liabilities | $65.93M | $142.48M | $1.05B |
| Other Liabilities | $- | $- | $- |
| Total Liabilities | $200.55M | $276.44M | $1.17B |
| Preferred Stock | $- | $597.26M | $- |
| Common Stock | $30.00K | $27.00K | $- |
| Retained Earnings | $-1.54B | $-1.16B | $-966.21M |
| Accumulated Other Comprehensive Income Loss | $-7.62M | $7.54M | $9.69M |
| Other Total Stockholders Equity | $1.57B | $1.49B | $92.65M |
| Total Stockholders Equity | $25.11M | $320.82M | $-863.86M |
| Total Equity | $25.11M | $320.82M | $-863.86M |
| Total Liabilities and Stockholders Equity | $225.66M | $597.26M | $303.23M |
| Minority Interest | $- | $- | $- |
| Total Liabilities and Total Equity | $225.66M | $597.26M | $303.23M |
| Total Investments | $- | $- | $- |
| Total Debt | $78.41M | $49.09M | $29.28M |
| Net Debt | $44.94M | $-79.46M | $-13.88M |
Balance Sheet Charts
| Breakdown | September 30, 2023 | June 30, 2023 | March 31, 2023 | December 31, 2022 | September 30, 2022 | June 30, 2022 | March 31, 2022 | December 31, 2021 | September 30, 2021 | December 31, 2020 |
|---|---|---|---|---|---|---|---|---|---|---|
| Cash and Cash Equivalents | $10.23M | $6.81M | $12.84M | $33.47M | $38.53M | $57.14M | $35.03M | $128.56M | $38.67M | $43.16M |
| Short Term Investments | $- | $- | $- | $- | $- | $- | $- | $- | $- | $- |
| Cash and Short Term Investments | $10.23M | $6.81M | $12.84M | $33.47M | $38.53M | $57.14M | $35.03M | $128.56M | $38.67M | $43.16M |
| Net Receivables | $3.55M | $2.88M | $3.39M | $13.94M | $13.25M | $4.70M | $9.88M | $8.40M | $473.00K | $2.86M |
| Inventory | $1.84M | $1.48M | $1.36M | $1.53M | $2.17M | $5.47M | $23.26M | $28.24M | $17.73M | $5.26M |
| Other Current Assets | $13.29M | $14.05M | $16.39M | $15.84M | $63.20M | $27.82M | $58.05M | $63.92M | $41.78M | $17.21M |
| Total Current Assets | $28.92M | $25.20M | $33.99M | $64.78M | $117.15M | $141.54M | $160.06M | $229.12M | $98.66M | $68.48M |
| Property Plant Equipment Net | $150.24M | $129.67M | $139.43M | $149.48M | $169.04M | $180.09M | $278.81M | $237.55M | $163.75M | $98.55M |
| Goodwill | $29.82M | $30.08M | $29.44M | $- | $- | $- | $118.91M | $121.17M | $124.06M | $131.25M |
| Intangible Assets | $- | $- | $- | $- | $- | $- | $- | $- | $- | $- |
| Goodwill and Intangible Assets | $29.82M | $30.08M | $29.44M | $- | $- | $- | $118.91M | $121.17M | $124.06M | $131.25M |
| Long Term Investments | $- | $- | $- | $- | $- | $- | $- | $- | $- | $- |
| Tax Assets | $- | $- | $- | $- | $- | $- | $- | $- | $- | $- |
| Other Non-Current Assets | $13.46M | $10.05M | $10.90M | $11.39M | $7.83M | $9.69M | $9.27M | $9.43M | $8.31M | $4.94M |
| Total Non-Current Assets | $193.52M | $169.81M | $179.77M | $160.87M | $176.87M | $189.78M | $406.99M | $368.15M | $296.12M | $234.75M |
| Other Assets | $- | $- | $- | $- | $- | $- | $- | $- | $- | $- |
| Total Assets | $222.44M | $195.01M | $213.76M | $225.66M | $294.02M | $331.32M | $567.05M | $597.26M | $394.77M | $303.23M |
| Account Payables | $29.61M | $21.47M | $20.40M | $20.23M | $15.99M | $16.88M | $8.29M | $5.00M | $9.64M | $12.21M |
| Short Term Debt | $19.13M | $21.01M | $19.50M | $22.20M | $103.63M | $124.79M | $68.61M | $49.09M | $11.27M | $29.28M |
| Tax Payables | $- | $- | $- | $- | $- | $- | $- | $- | $- | $- |
| Deferred Revenue | $48.74M | $43.16M | $44.73M | $47.82M | $74.61M | $37.58M | $42.76M | $43.34M | $45.33M | $47.40M |
| Other Current Liabilities | $57.97M | $36.85M | $39.35M | $44.36M | $44.05M | $50.86M | $40.45M | $36.52M | $30.38M | $23.75M |
| Total Current Liabilities | $155.46M | $122.49M | $123.98M | $134.62M | $238.28M | $230.10M | $160.11M | $133.96M | $96.62M | $112.64M |
| Long Term Debt | $83.16M | $75.99M | $87.69M | $56.20M | $- | $- | $- | $- | $- | $- |
| Deferred Revenue Non-Current | $- | $- | $- | $- | $- | $- | $- | $- | $- | $- |
| Deferred Tax Liabilities Non-Current | $- | $- | $- | $- | $- | $- | $- | $- | $- | $- |
| Other Non-Current Liabilities | $8.98M | $7.46M | $9.65M | $9.72M | $12.07M | $5.84M | $33.27M | $142.48M | $1.33B | $1.05B |
| Total Non-Current Liabilities | $92.14M | $83.44M | $97.35M | $65.93M | $12.07M | $5.84M | $33.27M | $142.48M | $1.33B | $1.05B |
| Other Liabilities | $- | $- | $- | $- | $- | $- | $- | $- | $- | $- |
| Total Liabilities | $247.60M | $205.94M | $221.33M | $200.55M | $250.34M | $235.94M | $193.38M | $276.44M | $1.42B | $1.17B |
| Preferred Stock | $- | $- | $- | $- | $- | $- | $567.05M | $597.26M | $132.41M | $- |
| Common Stock | $32.00K | $32.00K | $32.00K | $30.00K | $29.00K | $28.00K | $27.00K | $27.00K | $1.04B | $- |
| Retained Earnings | $-1.61B | $-1.59B | $-1.58B | $-1.54B | $-1.50B | $-1.46B | $-1.15B | $-1.16B | $-1.12B | $-966.21M |
| Accumulated Other Comprehensive Income Loss | $-8.33M | $-7.17M | $-7.16M | $-7.62M | $-11.68M | $-8.50M | $3.06M | $7.54M | $9.77M | $9.69M |
| Other Total Stockholders Equity | $1.60B | $1.59B | $1.58B | $1.57B | $1.56B | $1.57B | $1.52B | $1.48B | $1.26B | $92.65M |
| Total Stockholders Equity | $-25.16M | $-10.93M | $-7.57M | $25.11M | $43.67M | $95.38M | $373.67M | $320.82M | $-1.03B | $-863.86M |
| Total Equity | $-25.16M | $-10.93M | $-7.57M | $25.11M | $43.67M | $95.38M | $373.67M | $- | $- | $- |
| Total Liabilities and Stockholders Equity | $222.44M | $195.01M | $213.76M | $225.66M | $294.02M | $331.32M | $567.05M | $597.26M | $394.77M | $303.23M |
| Minority Interest | $- | $- | $- | $- | $- | $- | $- | $- | $- | $- |
| Total Liabilities and Total Equity | $222.44M | $195.01M | $213.76M | $225.66M | $294.02M | $331.32M | $567.05M | $597.26M | $394.77M | $303.23M |
| Total Investments | $- | $- | $- | $- | $- | $- | $- | $- | $- | $- |
| Total Debt | $102.29M | $97.00M | $107.19M | $78.41M | $103.63M | $124.79M | $68.61M | $49.09M | $11.27M | $29.28M |
| Net Debt | $92.06M | $90.20M | $94.35M | $44.94M | $65.11M | $67.65M | $33.58M | $-79.46M | $-27.39M | $-13.88M |
Annual Cash Flow
| Breakdown | December 31, 2022 | December 31, 2021 | December 31, 2020 | December 31, 2019 |
|---|---|---|---|---|
| Net Income | $-358.74M | $-196.33M | $-208.73M | $-387.48M |
| Depreciation and Amortization | $61.71M | $51.59M | $32.49M | $116.95M |
| Deferred Income Tax | $- | $-32.59M | $463.00K | $3.65M |
| Stock Based Compensation | $95.33M | $86.63M | $6.17M | $30.74M |
| Change in Working Capital | $41.93M | $-50.25M | $1.71M | $8.00M |
| Accounts Receivables | $3.62M | $-8.37M | $-662.00K | $-4.55M |
| Inventory | $15.92M | $-9.33M | $-901.00K | $-4.36M |
| Accounts Payables | $15.01M | $-7.49M | $-15.10M | $-15.51M |
| Other Working Capital | $7.38M | $-25.06M | $18.37M | $32.43M |
| Other Non Cash Items | $102.94M | $9.32M | $17.74M | $18.76M |
| Net Cash Provided by Operating Activities | $-56.83M | $-131.63M | $-150.15M | $-209.38M |
| Investments in Property Plant and Equipment | $-89.41M | $-215.70M | $-12.36M | $-108.56M |
| Acquisitions Net | $- | $- | $68.66M | $-171.00K |
| Purchases of Investments | $- | $- | $- | $- |
| Sales Maturities of Investments | $- | $- | $- | $- |
| Other Investing Activities | $- | $- | $- | $- |
| Net Cash Used for Investing Activities | $-89.41M | $-215.70M | $56.30M | $-108.73M |
| Debt Repayment | $- | $- | $- | $- |
| Common Stock Issued | $1.05M | $423.00K | $933.00K | $1.22M |
| Common Stock Repurchased | $- | $- | $- | $- |
| Dividends Paid | $- | $- | $- | $- |
| Other Financing Activities | $19.59M | $443.37M | $31.87M | $318.61M |
| Net Cash Used Provided by Financing Activities | $19.59M | $443.37M | $31.87M | $318.61M |
| Effect of Forex Changes on Cash | $5.80M | $10.09M | $-3.59M | $-1.05M |
| Net Change in Cash | $-120.86M | $106.13M | $-65.57M | $-545.00K |
| Cash at End of Period | $39.05M | $159.90M | $53.77M | $119.34M |
| Cash at Beginning of Period | $159.90M | $53.77M | $119.34M | $119.89M |
| Operating Cash Flow | $-56.83M | $-131.63M | $-150.15M | $-209.38M |
| Capital Expenditure | $-89.41M | $-215.70M | $-12.36M | $-108.56M |
| Free Cash Flow | $-146.24M | $-347.32M | $-162.51M | $-317.94M |
Cash Flow Charts
| Breakdown | September 30, 2023 | June 30, 2023 | March 31, 2023 | December 31, 2022 | September 30, 2022 | June 30, 2022 | March 31, 2022 | December 31, 2021 | September 30, 2021 | June 30, 2021 | March 31, 2021 | December 31, 2020 |
|---|---|---|---|---|---|---|---|---|---|---|---|---|
| Net Income | $-19.81M | $-9.31M | $-44.32M | $-36.41M | $-22.27M | $-310.42M | $10.35M | $-39.58M | $-30.67M | $-49.28M | $-76.81M | $-44.64M |
| Depreciation and Amortization | $9.81M | $8.05M | $10.22M | $20.75M | $12.14M | $19.32M | $9.51M | $14.51M | $18.47M | $12.53M | $6.09M | $7.38M |
| Deferred Income Tax | $-797.00K | $-7.57M | $- | $- | $- | $- | $- | $-90.10M | $7.04M | $18.47M | $32.01M | $-581.00K |
| Stock Based Compensation | $4.24M | $5.92M | $7.28M | $13.30M | $-10.32M | $43.65M | $48.70M | $82.33M | $1.53M | $1.28M | $1.49M | $1.42M |
| Change in Working Capital | $10.17M | $559.00K | $-3.95M | $21.31M | $13.94M | $12.38M | $-5.69M | $-36.27M | $-22.36M | $9.35M | $-963.00K | $-13.90M |
| Accounts Receivables | $354.00K | $-325.00K | $1.94M | $5.95M | $-1.10M | $286.00K | $-1.51M | $-9.26M | $-136.00K | $779.00K | $243.00K | $-226.00K |
| Inventory | $518.00K | $895.00K | $473.00K | $1.23M | $6.96M | $4.40M | $3.32M | $-718.00K | $-12.66M | $1.03M | $3.02M | $-469.00K |
| Accounts Payables | $4.30M | $1.07M | $-93.00K | $4.50M | $-1.13M | $8.31M | $3.33M | $-5.15M | $2.01M | $-1.91M | $-2.43M | $-8.53M |
| Other Working Capital | $5.00M | $-1.08M | $-6.27M | $9.63M | $9.21M | $-625.00K | $-10.84M | $-21.14M | $-11.58M | $9.45M | $-1.79M | $-4.67M |
| Other Non Cash Items | $3.38M | $515.00K | $9.10M | $-30.87M | $8.75M | $230.50M | $-105.44M | $3.83M | $5.24M | $-1.61M | $1.86M | $8.55M |
| Net Cash Provided by Operating Activities | $6.99M | $-1.84M | $-21.67M | $-11.93M | $2.24M | $-4.58M | $-42.56M | $-65.27M | $-20.75M | $-9.26M | $-36.34M | $-41.77M |
| Investments in Property Plant and Equipment | $-99.00K | $284.00K | $-3.60M | $-2.63M | $-3.47M | $-19.70M | $-63.62M | $-100.23M | $-44.09M | $-59.20M | $-12.18M | $3.87M |
| Acquisitions Net | $- | $- | $- | $- | $- | $- | $- | $- | $- | $- | $- | $- |
| Purchases of Investments | $- | $- | $- | $- | $- | $- | $- | $- | $- | $- | $- | $- |
| Sales Maturities of Investments | $- | $- | $- | $- | $- | $- | $- | $- | $- | $- | $- | $- |
| Other Investing Activities | $-6.63M | $199.00K | $- | $- | $- | $- | $- | $- | $- | $- | $- | $- |
| Net Cash Used for Investing Activities | $-6.73M | $483.00K | $-3.60M | $-2.63M | $-3.47M | $-19.70M | $-63.62M | $-100.23M | $-44.09M | $-59.20M | $-12.18M | $3.87M |
| Debt Repayment | $- | $- | $- | $- | $- | $- | $- | $- | $- | $- | $- | $- |
| Common Stock Issued | $6.00K | $45.00K | $205.00K | $683.00K | $114.00K | $89.00K | $169.00K | $-39.00K | $9.00K | $18.00K | $435.00K | $237.00K |
| Common Stock Repurchased | $- | $- | $- | $- | $- | $- | $- | $- | $- | $- | $- | $- |
| Dividends Paid | $- | $- | $- | $- | $- | $- | $- | $- | $- | $- | $- | $- |
| Other Financing Activities | $2.92M | $-4.59M | $4.23M | $-33.03M | $-19.55M | $54.53M | $17.63M | $258.75M | $1.35M | $-4.95M | $188.22M | $213.00K |
| Net Cash Used Provided by Financing Activities | $2.92M | $-4.59M | $4.23M | $-33.03M | $-19.55M | $54.53M | $17.63M | $258.75M | $1.35M | $-4.95M | $188.22M | $213.00K |
| Effect of Forex Changes on Cash | $-1.16M | $-599.00K | $295.00K | $-1.09M | $3.39M | $4.50M | $-1.00M | $3.81M | $2.44M | $-1.53M | $5.36M | $-2.78M |
| Net Change in Cash | $2.02M | $-6.55M | $-20.75M | $-48.67M | $-17.39M | $34.76M | $-89.55M | $97.07M | $-61.05M | $-74.93M | $145.06M | $-40.46M |
| Cash at End of Period | $13.76M | $11.74M | $18.30M | $39.05M | $87.71M | $105.10M | $70.35M | $159.90M | $62.84M | $123.89M | $198.82M | $53.77M |
| Cash at Beginning of Period | $11.74M | $18.30M | $39.05M | $87.71M | $105.10M | $70.35M | $159.90M | $62.84M | $123.89M | $198.82M | $53.77M | $94.23M |
| Operating Cash Flow | $6.99M | $-1.84M | $-21.67M | $-11.93M | $2.24M | $-4.58M | $-42.56M | $-65.27M | $-20.75M | $-9.26M | $-36.34M | $-41.77M |
| Capital Expenditure | $-99.00K | $284.00K | $-3.60M | $-2.63M | $-3.47M | $-19.70M | $-63.62M | $-100.23M | $-44.09M | $-59.20M | $-12.18M | $3.87M |
| Free Cash Flow | $6.89M | $-1.56M | $-25.27M | $-14.55M | $-1.24M | $-24.27M | $-106.18M | $-165.50M | $-64.84M | $-68.46M | $-48.52M | $-37.90M |
Bird Global Dividends
Explore Bird Global's dividend history, including dividend yield, payout ratio, and historical payments.
Bird Global News
Read the latest news about Bird Global, including recent articles, headlines, and updates.
Bird Enters into Comprehensive Restructuring Support Agreement with First- and Second-Lien Lenders to Strengthen Financial Position
Bird has sufficient liquidity to meet financial obligations to city partners, vendors, suppliers, and employees during and after the restructuring process, and will operate as usual Agreement has unanimous support of first- and second-lien lenders Apollo Global Management and second-lien lenders to provide $ 25 million in DIP financing MIAMI , Dec. 20, 2023 /PRNewswire/ -- Bird Global, Inc. (OTCQX: BRDS), ("Bird" or the "Company") a leader in environmentally friendly electric transportation, today announced its entry into a financial restructuring process aimed at strengthening its balance sheet and better positioning the company for long-term, sustainable growth. Bird will operate as usual during this process, maintaining the same service for its riders and upholding its commitments to partner cities, fleet managers, and employees.

Bird Commences Micromobility Operations at Barksdale Air Force Base in Louisiana
MIAMI--(BUSINESS WIRE)--Bird Global, Inc. (OTCQX:BRDS), the largest micromobility operator in North America, is thrilled to announce the launch of its state-of-the-art escooters within Barksdale Air Force Base in Louisiana. The company aims to provide sustainable and convenient micromobility solutions to the military community, enhancing transportation options and promoting eco-friendly practices on the base. Bird specializes in offering electric scooters and bikes, providing a convenient, effi.

Bird Partners with Rock the Vote to Boost Voter Turnout and Civic Engagement
MIAMI--(BUSINESS WIRE)--In a groundbreaking partnership to boost voter turnout and civic engagement, Bird Global, Inc. (OTCQX:BRDS), the largest micromobility operator in North America, is joining forces with Rock the Vote, the preeminent organization dedicated to engaging and building the political power of young people. This collaboration aims to promote and amplify the importance of voting and help to ensure that every eligible voter has the tools and information they need to participate in.

Bird Announces Suspended NYSE Trading, Will Begin Trading on the OTC Exchange Effective September 25, 2023
MIAMI--(BUSINESS WIRE)--Bird Global, Inc. (NYSE:BRDS) (“Bird” or the “Company”) a leader in environmentally friendly electric transportation, today announced it received notice from the New York Stock Exchange (“NYSE”) that NYSE will suspend trading of, and commence proceedings to, delist shares of Bird's Class A common stock, effective at the open of business eastern standard time on September 25, 2023. The determination was made in connection with Bird's non-compliance with an NYSE listing re.

NYSE to Commence Delisting Proceedings Against Bird Global, Inc. (BRDS)
NEW YORK--(BUSINESS WIRE)--The New York Stock Exchange (“NYSE”, the “Exchange”) announced today that the staff of NYSE Regulation has determined to commence proceedings to delist the two securities enumerated below (“Securities”) of Bird Global, Inc. (the “Company”) from the NYSE. Trading in the Company's Securities will be suspended immediately. Symbol Description BRDS Class A common stock BRDS WS Warrants, each whole warrant exercisable to purchase one share of Class A common stock at an exer.

Bird Acquires Spin, Now North America's Largest Micromobility Operator By Market Share
MIAMI--(BUSINESS WIRE)--Bird Global, Inc. (NYSE:BRDS), (“Bird” or the “Company”) a leader in environmentally friendly electric transportation, today announced it has acquired shared electric bike and scooter operator Skinny Labs, Inc, (doing business as Spin) from Berlin-based TIER Mobility. The transaction makes Bird the largest micromobility operator in North America by market share1 and is expected to be immediately accretive to earnings. Spin is now a wholly-owned subsidiary of Bird Rides,.

Bird Global Promotes Hunter Gray to Chief Technology Officer
MIAMI--(BUSINESS WIRE)--Bird Global, Inc. (NYSE:BRDS), a leader in environmentally friendly electric transportation, today announced the promotion of Hunter Gray to Chief Technology Officer. Throughout his tenure at Bird, Mr. Gray has led the product, data, and design teams, spearheading the creation and execution of the company's product roadmap across vehicles, payments, rider experience, city solutions, and marketplace, which is Bird's AI technology for predicting where there will be rider d.

Bird Global Appoints H. Joseph Prodan as CFO
MIAMI--(BUSINESS WIRE)--Bird Global, Inc. (NYSE:BRDS), a leader in environmentally friendly electric transportation, today announced the appointment of H. Joseph (Joe) Prodan as Chief Financial Officer (CFO), effective August 30, 2023. Mr. Prodan succeeds Michael Washinushi, following his recent appointment to Interim CEO. "I am delighted to welcome Joe as our new Chief Financial Officer,” said Washinushi. “His deep expertise in running the finance function at both public and private companies.

Bird Soars to New Heights with Remarkable Summer Ridership
MIAMI--(BUSINESS WIRE)--Bird Global, Inc. (NYSE:BRDS), a leader in environmentally friendly electric transportation, today reported ridership results from the 2023 summer season. From June 1st through September 3rd, Bird riders clocked in nearly 16 million total miles – equivalent to circling the earth over 600 times. “This has been another incredible summer for Bird as we've expanded our reach, improved accessibility, and contributed to a greener, more connected world. Our ridership figures ar.

Bird Celebrates Back to School with New Ride Pass For College Students
MIAMI--(BUSINESS WIRE)--Bird Global, Inc. (NYSE:BRDS), a leader in environmentally friendly electric transportation, today announced the launch of its new Back to School Ride Pass for students on college campuses across North America. The ride pass is designed to offer students safer, greener, and more enjoyable commute alternatives in areas where Bird operates. “Ride pass testing has consistently shown increased weekly active users, improved customer retention, and longer ride distances, highl.

Bird Scooters Takes Flight in South Miami, Offering a Regional Commuting Solution
SOUTH MIAMI, Fla.--(BUSINESS WIRE)--Bird Global, Inc. (NYSE:BRDS), a leader in environmentally friendly electric transportation and current e-scooter operator in the Greater Miami area, announced its official launch in South Miami, marking an important milestone in the company's mission to make cities more livable by reducing car usage, traffic, and congestion. Bird's expansion into South Miami further highlights the company's dedication to the South Florida region, and ensures more people betw.

Bird and Cuyahoga Metropolitan Housing Authority Join Forces to Provide Affordable Mobility Solutions for Programs and Developments
CLEVELAND--(BUSINESS WIRE)--Bird Global, Inc. (NYSE:BRDS), a leader in environmentally friendly electric transportation, is excited to announce a strategic partnership with the Cuyahoga Metropolitan Housing Authority (CMHA) to enhance mobility options and ensure affordable access to transportation for residents in Cleveland. This partnership aims to address transportation challenges faced by individuals residing in affordable housing developments, providing them with convenient and affordable a.

Bird's Roll to the Polls Initiative Takes Flight in Montgomery to Boost Voter Turnout
MONTGOMERY, Ala.--(BUSINESS WIRE)--Bird Global, Inc. (NYSE:BRDS), a leader in environmentally friendly electric transportation, is launching its esteemed Roll to the Polls initiative in Montgomery to encourage residents to exercise their right to vote. In an effort to make voting as accessible as possible, Bird is offering two free rides* to each resident of Montgomery — one to travel to their polling location and another to return home. As part of this initiative, on Election Day, residents wi.

Bird Global, Inc. (BRDS) Q2 2023 Earnings Call Transcript
Bird Global, Inc. (NYSE:BRDS ) Q2 2023 Earnings Conference Call August 10, 2023 8:00 AM ET Company Participants Taylor Giles - IR Michael Washinushi - Interim CEO and CFO Stewart Lyons - President Conference Call Participants Operator Greetings, and welcome to the Bird Global Second Quarter 2023 Earnings Conference Call. At this time, all participants are in a listen-only mode.

Bird Global Appoints Michael Washinushi as Interim CEO
MIAMI--(BUSINESS WIRE)--Bird Global, Inc. (NYSE:BRDS), a leader in environmentally friendly electric transportation, today announced the appointment of Michael Washinushi as interim Chief Executive Officer (CEO), effective immediately. Mr. Washinushi will succeed Shane Torchiana and continue to oversee the finance organization until a CEO replacement is appointed. “On behalf of the board, we extend our gratitude to Shane for his leadership during this transitional time for the company,” said Jo.

Bird Reports Second Quarter 2023 Financial Results with Improvements in Gross Margin and Operating Expense Spend
MIAMI--(BUSINESS WIRE)--Bird Global, Inc. ("Bird" or the "Company") (NYSE: BRDS), a leader in environmentally friendly electric transportation, today announced financial results for the second quarter ended June 30, 2023. The Company also announced the appointment of Michael Washinushi as interim CEO. "Today, as I step into the interim CEO role, I'm more convinced than ever that the Bird platform is the best solution to support the evolving transit and climate initiatives of all cities," said W.

Bird Expects Increased Ridership as Students Return to College Campuses
MIAMI--(BUSINESS WIRE)--Bird Global, Inc. (NYSE:BRDS), a leader in environmentally friendly electric transportation, today announced that it has renewed its operational permits across more than a dozen campuses in North America, including esteemed institutions such as University of California, Los Angeles, University of Florida, The Ohio State University, University of Tennessee, and University of Kentucky. The company anticipates a strong increase in university ridership as students return to.

Bird Announces Major Summer Price Reduction for Greater Phoenix Area Riders
PHOENIX--(BUSINESS WIRE)--Bird Global, Inc. (NYSE:BRDS), a leader in environmentally friendly electric transportation, is thrilled to announce a significant price reduction for its ride services in the Greater Phoenix area, including Tempe, Scottsdale, Gilbert, Chandler and Mesa. This move underscores Bird's commitment to making clean, efficient, and affordable transportation accessible to everyone. Starting today, Bird users in Phoenix will pay only $.29 per minute, making it easier than ever.

Bird Announces Major Summer Price Reduction for Kansas City Riders
KANSAS CITY, Mo.--(BUSINESS WIRE)--Bird Global, Inc. (NYSE:BRDS), a leader in environmentally friendly electric transportation, is thrilled to announce a significant price reduction for its ride services in Kansas City where the company is the exclusive e-scooter provider. This move underscores Bird's commitment to making clean, efficient, and affordable transportation accessible to everyone. Starting today, Bird users in Kansas City will pay only $.29 per minute, making it easier than ever to.

Bird Announces Major Summer Price Reduction for Austin Riders
AUSTIN, Texas--(BUSINESS WIRE)--Bird Global, Inc. (NYSE:BRDS), a leader in environmentally friendly electric transportation, is thrilled to announce a significant summer price reduction for its ride services in Austin, Texas. This move underscores Bird's commitment to making clean, efficient, and affordable transportation accessible to everyone in this vibrant city. Starting today, Bird users in Austin will pay only $.29 per minute, making it easier than ever to get around the city while reduci.

Bird Announces Second Quarter 2023 Earnings Release Date
MIAMI--(BUSINESS WIRE)--Bird Global, Inc. (“Bird” or the “Company”) (NYSE:BRDS), a leader in environmentally friendly electric transportation, today announced that it will release financial results for the second quarter 2023 after the U.S. market closes on Wednesday, August 9, 2023. The Company will host a webcast and conference call the following day at 8:00 a.m. Eastern Time on Thursday, August 10, 2023, to discuss the financial results and other business updates. Interested parties are invi.

Bird Receives NYSE Notice of Compliance with Listing Standard
MIAMI--(BUSINESS WIRE)--Bird Global, Inc. (“Bird” or the “Company”) (NYSE: BRDS), a leader in environmentally friendly electric transportation, today announced that it has received confirmation from NYSE of Bird's compliance with NYSE's $1.00 share price listing requirement. In accordance with NYSE procedures, Bird has submitted a business plan advising NYSE of the actions the Company has taken, or anticipates taking, to bring it into compliance with NYSE's market capitalization and stockholder.

Bird Renews City Permits for Micromobility Operations Across Select Cities in Italy, France and Spain
MIAMI--(BUSINESS WIRE)--Bird Global, Inc. (NYSE:BRDS), a leader in environmentally friendly electric transportation, today announced the renewal of its operations in select cities across Italy, France and Spain. These extensions mark a significant milestone for Bird as it continues to strengthen its commitment to sustainable transportation and urban mobility in Europe. In Italy, Bird has renewed and expanded its operation in the city of Rome, doubling its fleet size to 4,000 scooters. The compa.

Similar Companies
Related Metrics
Explore detailed financial metrics and analysis for BRDS.
