Beazer Homes USA Key Executives
This section highlights Beazer Homes USA's key executives, including their titles and compensation details.
Find Contacts at Beazer Homes USA
(Showing 0 of )
Beazer Homes USA Earnings
This section highlights Beazer Homes USA's earnings, including key dates, EPS, earnings reports, and earnings call transcripts.
Next Earnings Date
Last Earnings Results
Earnings Call Transcripts
| Transcript | Quarter | Year | Date | Estimated EPS | Actual EPS |
|---|---|---|---|---|---|
| Read Transcript | Q1 | 2025 | 2025-01-30 | $0.31 | $0.10 |
| Read Transcript | Q4 | 2024 | 2024-11-14 | N/A | N/A |
| Read Transcript | Q3 | 2024 | 2024-08-01 | $0.84 | $0.88 |
| Read Transcript | Q2 | 2024 | 2024-05-01 | $0.91 | $1.26 |
| Read Transcript | Q1 | 2024 | 2024-02-01 | $0.71 | $0.70 |
| Read Transcript | Q4 | 2023 | 2023-11-16 | $1.39 | $1.80 |
| Read Transcript | Q3 | 2023 | 2023-07-27 | $0.88 | $1.42 |
| Read Transcript | Q2 | 2023 | 2023-04-27 | $0.82 | $1.13 |
| Read Transcript | Q1 | 2023 | 2023-02-02 | $0.74 | $0.83 |
Financial Statements
Access annual & quarterly financial statements for Beazer Homes USA, including income statements, balance sheets, and cash flow statements..
Annual Income Statement
| Breakdown | September 30, 2024 | September 30, 2023 | September 30, 2022 | September 30, 2021 | September 30, 2020 |
|---|---|---|---|---|---|
| Revenue | $2.33B | $2.21B | $2.32B | $2.14B | $2.13B |
| Cost of Revenue | $1.91B | $1.76B | $1.78B | $1.74B | $1.78B |
| Gross Profit | $424.29M | $442.69M | $537.51M | $404.25M | $347.64M |
| Gross Profit Ratio | 18.21% | 20.06% | 23.20% | 18.89% | 16.34% |
| Research and Development Expenses | $- | $- | $- | $- | $- |
| General and Administrative Expenses | $186.34M | $179.79M | $177.32M | $163.28M | $170.39M |
| Selling and Marketing Expenses | $- | $- | $74.34M | $80.12M | $82.51M |
| Selling General and Administrative Expenses | $186.34M | $179.79M | $251.66M | $243.41M | $252.89M |
| Other Expenses | $94.92M | $85.65M | $13.36M | $13.98M | $15.64M |
| Operating Expenses | $281.27M | $265.44M | $265.02M | $257.39M | $268.53M |
| Cost and Expenses | $2.19B | $2.03B | $2.04B | $1.99B | $2.05B |
| Interest Income | $- | $- | $- | $2.78M | $8.47M |
| Interest Expense | $- | $68.49M | $- | $90.07M | $103.34M |
| Depreciation and Amortization | $14.87M | $12.20M | $13.36M | $13.98M | $15.64M |
| EBITDA | $157.89M | $190.09M | $285.85M | $160.84M | $94.75M |
| EBITDA Ratio | 6.78% | 8.61% | 12.34% | 7.52% | 4.45% |
| Operating Income | $143.03M | $177.25M | $272.49M | $146.87M | $79.11M |
| Operating Income Ratio | 6.14% | 8.03% | 11.76% | 6.86% | 3.72% |
| Total Other Income Expenses Net | $16.06M | $5.39M | $1.50M | $-3.14M | $-7.82M |
| Income Before Tax | $159.09M | $182.65M | $273.99M | $143.73M | $71.29M |
| Income Before Tax Ratio | 6.83% | 8.28% | 11.83% | 6.72% | 3.35% |
| Income Tax Expense | $18.91M | $23.96M | $53.27M | $21.55M | $17.97M |
| Net Income | $140.18M | $158.61M | $220.70M | $122.02M | $52.23M |
| Net Income Ratio | 6.02% | 7.19% | 9.53% | 5.70% | 2.46% |
| EPS | $4.59 | $5.23 | $7.25 | $4.07 | $1.76 |
| EPS Diluted | $4.53 | $5.16 | $7.17 | $4.01 | $1.74 |
| Weighted Average Shares Outstanding | 30.55M | 30.35M | 30.43M | 29.95M | 29.70M |
| Weighted Average Shares Outstanding Diluted | 30.95M | 30.75M | 30.80M | 30.44M | 29.95M |
| SEC Filing | Source | Source | Source | Source | Source |
| Breakdown | December 31, 2024 | September 30, 2024 | June 30, 2024 | March 31, 2024 | December 31, 2023 | September 30, 2023 | June 30, 2023 | March 31, 2023 | December 31, 2022 | September 30, 2022 | June 30, 2022 | March 31, 2022 | December 31, 2021 | September 30, 2021 | June 30, 2021 | March 31, 2021 | December 31, 2020 | September 30, 2020 | June 30, 2020 | March 31, 2020 |
|---|---|---|---|---|---|---|---|---|---|---|---|---|---|---|---|---|---|---|---|---|
| Revenue | $468.95M | $806.16M | $595.68M | $541.54M | $386.82M | $645.40M | $572.54M | $543.91M | $444.93M | $827.67M | $526.67M | $508.51M | $454.15M | $590.94M | $570.93M | $549.89M | $428.54M | $686.75M | $533.11M | $489.41M |
| Cost of Revenue | $396.88M | $664.75M | $496.27M | $441.05M | $309.09M | $508.12M | $455.80M | $441.01M | $359.16M | $639.77M | $394.20M | $388.76M | $356.75M | $475.43M | $455.41M | $451.96M | $353.25M | $570.15M | $444.05M | $410.57M |
| Gross Profit | $72.08M | $141.41M | $99.41M | $100.49M | $77.73M | $137.29M | $116.74M | $102.90M | $85.77M | $187.89M | $132.47M | $119.75M | $97.40M | $115.51M | $115.52M | $97.93M | $75.29M | $116.60M | $89.06M | $78.84M |
| Gross Profit Ratio | 15.37% | 17.54% | 16.69% | 18.56% | 20.09% | 21.27% | 20.39% | 18.92% | 19.28% | 22.70% | 25.15% | 23.55% | 21.45% | 19.55% | 20.23% | 17.81% | 17.57% | 16.98% | 16.71% | 16.11% |
| Research and Development Expenses | $- | $- | $- | $- | $- | $- | $- | $- | $- | $- | $- | $- | $- | $- | $- | $- | $- | $- | $- | $- |
| General and Administrative Expenses | $49.77M | $50.70M | $49.66M | $44.00M | $41.99M | $49.90M | $46.46M | $42.78M | $40.65M | $48.26M | $45.76M | $45.53M | $37.77M | $43.38M | $42.19M | $39.74M | $37.98M | $49.36M | $41.28M | $40.05M |
| Selling and Marketing Expenses | $- | $- | $21.23M | $18.29M | $13.25M | $-51.88M | $19.47M | $18.30M | $14.11M | $25.67M | $16.28M | $16.58M | $15.81M | $21.78M | $20.95M | $20.88M | $16.51M | $26.85M | $20.85M | $18.74M |
| Selling General and Administrative Expenses | $49.77M | $50.70M | $70.89M | $62.29M | $41.99M | $49.90M | $65.94M | $61.08M | $54.75M | $73.93M | $62.04M | $62.11M | $53.58M | $65.16M | $63.14M | $60.62M | $54.48M | $76.21M | $62.13M | $58.79M |
| Other Expenses | $20.17M | $32.46M | $- | $-2.21M | $2.66M | $2.18M | $2.18M | $3.02M | $2.51M | $4.26M | $3.19M | $3.03M | $131.00K | $644.00K | $-10.00K | $-894.00K | $-1.45M | $-2.13M | $-2.90M | $-1.79M |
| Operating Expenses | $69.94M | $83.16M | $74.78M | $64.50M | $57.47M | $75.23M | $68.84M | $64.10M | $57.27M | $78.19M | $65.23M | $65.14M | $56.46M | $68.64M | $66.83M | $64.31M | $57.60M | $81.01M | $65.91M | $62.42M |
| Cost and Expenses | $466.81M | $747.91M | $567.16M | $505.55M | $366.55M | $583.35M | $524.64M | $505.12M | $416.43M | $717.97M | $459.43M | $453.89M | $413.21M | $544.07M | $522.24M | $516.27M | $410.85M | $651.16M | $509.96M | $472.99M |
| Interest Income | $- | $- | $- | $- | $- | $- | $- | $- | $- | $- | $- | $- | $- | $- | $- | $- | $- | $- | $- | $- |
| Interest Expense | $- | $- | $- | $- | $11.19M | $991.00K | $17.50M | $- | $16.00K | $- | $- | $- | $- | $- | $- | $- | $- | $- | $- | $- |
| Depreciation and Amortization | $4.05M | $5.17M | $3.89M | $3.57M | $2.23M | $3.76M | $2.91M | $3.02M | $2.51M | $4.26M | $3.19M | $3.03M | $2.88M | $3.48M | $3.69M | $3.68M | $3.12M | $4.81M | $3.78M | $3.63M |
| EBITDA | $6.19M | $63.41M | $32.42M | $39.56M | $22.50M | $65.82M | $50.81M | $41.81M | $31.02M | $113.96M | $70.43M | $57.64M | $43.82M | $50.35M | $52.38M | $37.30M | $20.81M | $40.39M | $26.93M | $20.05M |
| EBITDA Ratio | 1.32% | 7.87% | 5.44% | 7.31% | 5.82% | 10.20% | 8.87% | 7.69% | 6.97% | 13.77% | 13.37% | 11.34% | 9.65% | 8.52% | 9.17% | 6.78% | 4.86% | 5.88% | 5.05% | 4.10% |
| Operating Income | $2.14M | $58.25M | $28.52M | $35.99M | $20.27M | $62.06M | $47.90M | $38.79M | $28.50M | $109.70M | $67.24M | $54.61M | $40.94M | $46.87M | $48.69M | $33.62M | $17.69M | $35.59M | $23.15M | $16.42M |
| Operating Income Ratio | 0.46% | 7.23% | 4.79% | 6.65% | 5.24% | 9.62% | 8.37% | 7.13% | 6.41% | 13.25% | 12.77% | 10.74% | 9.01% | 7.93% | 8.53% | 6.11% | 4.13% | 5.18% | 4.34% | 3.36% |
| Total Other Income Expenses Net | $1.03M | $2.36M | $1.14M | $9.92M | $2.64M | $2.17M | $2.16M | $1.01M | $61.00K | $717.00K | $223.00K | $139.00K | $419.00K | $402.00K | $-747.00K | $-1.27M | $-1.53M | $-1.93M | $-2.90M | $-1.64M |
| Income Before Tax | $3.17M | $60.61M | $29.66M | $45.91M | $22.91M | $64.23M | $50.06M | $39.80M | $28.56M | $110.42M | $67.46M | $54.75M | $41.36M | $47.27M | $47.95M | $32.35M | $16.16M | $33.66M | $20.25M | $14.79M |
| Income Before Tax Ratio | 0.68% | 7.52% | 4.98% | 8.48% | 5.92% | 9.95% | 8.74% | 7.32% | 6.42% | 13.34% | 12.81% | 10.77% | 9.11% | 8.00% | 8.40% | 5.88% | 3.77% | 4.90% | 3.80% | 3.02% |
| Income Tax Expense | $36.00K | $8.54M | $2.45M | $6.74M | $1.18M | $8.47M | $6.24M | $5.09M | $4.16M | $23.59M | $13.15M | $10.07M | $6.46M | $-1.09M | $10.80M | $7.70M | $4.12M | $9.03M | $4.98M | $4.17M |
| Net Income | $3.13M | $52.07M | $27.21M | $39.17M | $21.73M | $55.76M | $43.82M | $34.71M | $24.33M | $86.82M | $54.32M | $44.67M | $34.88M | $48.36M | $37.13M | $24.53M | $12.00M | $23.68M | $15.19M | $10.61M |
| Net Income Ratio | 0.67% | 6.46% | 4.57% | 7.23% | 5.62% | 8.64% | 7.65% | 6.38% | 5.47% | 10.49% | 10.31% | 8.78% | 7.68% | 8.18% | 6.50% | 4.46% | 2.80% | 3.45% | 2.85% | 2.17% |
| EPS | $0.10 | $-2.88 | $0.89 | $1.27 | $0.71 | $1.83 | $1.44 | $1.14 | $0.81 | $2.87 | $1.78 | $1.46 | $1.15 | $1.61 | $1.24 | $0.82 | $0.40 | $0.80 | $0.51 | $0.36 |
| EPS Diluted | $0.10 | $-2.85 | $0.88 | $1.26 | $0.70 | $1.80 | $1.42 | $1.13 | $0.80 | $2.82 | $1.76 | $1.45 | $1.14 | $1.57 | $1.22 | $0.81 | $0.40 | $0.80 | $0.51 | $0.35 |
| Weighted Average Shares Outstanding | 30.43M | 30.55M | 30.51M | 30.77M | 30.59M | 30.41M | 30.39M | 30.39M | 30.22M | 30.29M | 30.51M | 30.59M | 30.34M | 30.07M | 30.02M | 29.95M | 29.77M | 29.60M | 29.60M | 29.87M |
| Weighted Average Shares Outstanding Diluted | 30.80M | 30.95M | 30.93M | 31.13M | 30.98M | 31.04M | 30.86M | 30.61M | 30.48M | 30.77M | 30.87M | 30.82M | 30.72M | 30.87M | 30.56M | 30.21M | 30.09M | 29.60M | 29.67M | 29.98M |
| SEC Filing | Source | Source | Source | Source | Source | Source | Source | Source | Source | Source | Source | Source | Source | Source | Source | Source | Source | Source | Source | Source |
Annual Balance Sheet
| Breakdown | September 30, 2024 | September 30, 2023 | September 30, 2022 | September 30, 2021 | September 30, 2020 |
|---|---|---|---|---|---|
| Cash and Cash Equivalents | $203.91M | $345.59M | $214.59M | $246.72M | $327.69M |
| Short Term Investments | $- | $- | $- | $- | $- |
| Cash and Short Term Investments | $203.91M | $345.59M | $214.59M | $246.72M | $327.69M |
| Net Receivables | $65.42M | $45.60M | $45.50M | $35.61M | $29.07M |
| Inventory | $2.04B | $1.76B | $1.74B | $1.50B | $1.35B |
| Other Current Assets | $38.70M | $40.70M | $37.23M | $27.43M | $14.84M |
| Total Current Assets | $2.35B | $2.19B | $2.04B | $1.81B | $1.72B |
| Property Plant Equipment Net | $56.98M | $48.54M | $34.36M | $35.23M | $35.38M |
| Goodwill | $11.38M | $11.38M | $11.38M | $11.38M | $11.38M |
| Intangible Assets | $- | $- | $- | $- | $- |
| Goodwill and Intangible Assets | $11.38M | $11.38M | $11.38M | $11.38M | $11.38M |
| Long Term Investments | $- | $- | $964.00K | $4.46M | $4.00M |
| Tax Assets | $128.53M | $133.95M | $156.36M | $204.77M | $225.14M |
| Other Non-Current Assets | $19.78M | $29.08M | $13.71M | $11.62M | $9.24M |
| Total Non-Current Assets | $216.66M | $222.94M | $216.77M | $267.45M | $285.14M |
| Other Assets | $26.19M | $- | $- | $- | $- |
| Total Assets | $2.59B | $2.41B | $2.25B | $2.08B | $2.01B |
| Account Payables | $164.39M | $154.26M | $143.64M | $133.39M | $132.19M |
| Short Term Debt | $- | $- | $- | $51.50M | $- |
| Tax Payables | $2.40M | $272.00K | $320.00K | $- | $584.00K |
| Deferred Revenue | $- | $27.58M | $34.27M | $28.53M | $18.94M |
| Other Current Liabilities | $-2.40M | $62.97M | $-34.59M | $-80.03M | $68.23M |
| Total Current Liabilities | $164.39M | $245.07M | $143.64M | $133.39M | $193.62M |
| Long Term Debt | $1.05B | $992.87M | $994.65M | $1.02B | $1.15B |
| Deferred Revenue Non-Current | $- | $- | $- | $- | $- |
| Deferred Tax Liabilities Non-Current | $- | $- | $- | $- | $- |
| Other Non-Current Liabilities | $149.90M | $70.27M | $79.64M | $63.48M | $135.98M |
| Total Non-Current Liabilities | $1.20B | $1.06B | $1.17B | $1.22B | $1.22B |
| Other Liabilities | $- | $- | $- | $- | $- |
| Total Liabilities | $1.36B | $1.31B | $1.31B | $1.35B | $1.41B |
| Preferred Stock | $- | $- | $- | $- | $1 |
| Common Stock | $31.00K | $31.00K | $31.00K | $31.00K | $31.00K |
| Retained Earnings | $378.19M | $238.01M | $79.40M | $-141.31M | $-263.33M |
| Accumulated Other Comprehensive Income Loss | $- | $- | $- | $0 | $0 |
| Other Total Stockholders Equity | $853.89M | $864.78M | $859.86M | $866.16M | $856.47M |
| Total Stockholders Equity | $1.23B | $1.10B | $939.29M | $724.88M | $593.17M |
| Total Equity | $1.23B | $1.10B | $939.29M | $724.88M | $593.17M |
| Total Liabilities and Stockholders Equity | $2.59B | $2.41B | $2.25B | $2.08B | $2.01B |
| Minority Interest | $- | $- | $- | $- | $- |
| Total Liabilities and Total Equity | $2.59B | $2.41B | $2.25B | $2.08B | $2.01B |
| Total Investments | $- | $- | $964.00K | $4.46M | $4.00M |
| Total Debt | $1.05B | $997.00M | $994.65M | $1.07B | $1.15B |
| Net Debt | $841.22M | $651.41M | $780.05M | $821.47M | $818.44M |
Balance Sheet Charts
| Breakdown | December 31, 2024 | September 30, 2024 | June 30, 2024 | March 31, 2024 | December 31, 2023 | September 30, 2023 | June 30, 2023 | March 31, 2023 | December 31, 2022 | September 30, 2022 | June 30, 2022 | March 31, 2022 | December 31, 2021 | September 30, 2021 | June 30, 2021 | March 31, 2021 | December 31, 2020 | September 30, 2020 | June 30, 2020 | March 31, 2020 |
|---|---|---|---|---|---|---|---|---|---|---|---|---|---|---|---|---|---|---|---|---|
| Cash and Cash Equivalents | $80.38M | $203.91M | $73.21M | $165.39M | $104.23M | $345.59M | $276.12M | $240.83M | $120.75M | $214.59M | $42.04M | $163.91M | $157.70M | $246.72M | $358.33M | $355.53M | $244.63M | $327.69M | $152.27M | $294.26M |
| Short Term Investments | $- | $- | $- | $- | $- | $- | $- | $- | $- | $- | $897.00K | $- | $- | $- | $- | $- | $- | $- | $- | $- |
| Cash and Short Term Investments | $80.38M | $203.91M | $73.21M | $165.39M | $104.23M | $345.59M | $276.12M | $240.83M | $120.75M | $214.59M | $42.04M | $163.91M | $157.70M | $246.72M | $358.33M | $355.53M | $244.63M | $327.69M | $152.27M | $294.26M |
| Net Receivables | $70.72M | $65.42M | $66.24M | $54.47M | $65.30M | $45.60M | $33.20M | $28.77M | $34.46M | $45.50M | $35.07M | $34.16M | $30.41M | $35.61M | $32.53M | $26.36M | $27.80M | $29.07M | $27.07M | $29.80M |
| Inventory | $2.16B | $2.04B | $2.17B | $2.06B | $1.95B | $1.76B | $1.74B | $1.74B | $1.78B | $1.74B | $1.86B | $1.68B | $1.58B | $1.50B | $1.41B | $1.38B | $1.41B | $1.35B | $1.51B | $1.60B |
| Other Current Assets | $39.09M | $38.70M | $35.22M | $32.53M | $34.10M | $40.70M | $39.54M | $38.32M | $35.90M | $37.23M | $39.76M | $33.34M | $29.20M | $27.43M | $24.69M | $18.16M | $17.42M | $14.84M | $13.09M | $18.28M |
| Total Current Assets | $2.35B | $2.35B | $2.35B | $2.28B | $2.16B | $2.19B | $2.09B | $2.05B | $1.97B | $2.04B | $1.98B | $1.91B | $1.80B | $1.81B | $1.82B | $1.78B | $1.70B | $1.72B | $1.70B | $1.94B |
| Property Plant Equipment Net | $57.89M | $56.98M | $57.31M | $52.71M | $51.06M | $48.54M | $45.08M | $40.64M | $32.90M | $34.36M | $35.61M | $34.47M | $35.03M | $35.23M | $35.07M | $34.71M | $35.70M | $35.38M | $38.14M | $40.93M |
| Goodwill | $11.38M | $11.38M | $11.38M | $11.38M | $11.38M | $11.38M | $11.38M | $11.38M | $11.38M | $11.38M | $11.38M | $11.38M | $11.38M | $11.38M | $11.38M | $11.38M | $11.38M | $11.38M | $11.38M | $11.38M |
| Intangible Assets | $- | $- | $- | $- | $- | $- | $- | $- | $- | $- | $- | $- | $- | $- | $- | $- | $- | $- | $- | $- |
| Goodwill and Intangible Assets | $11.38M | $11.38M | $11.38M | $11.38M | $11.38M | $11.38M | $11.38M | $11.38M | $11.38M | $11.38M | $11.38M | $11.38M | $11.38M | $11.38M | $11.38M | $11.38M | $11.38M | $11.38M | $11.38M | $11.38M |
| Long Term Investments | $- | $- | $- | $- | $- | $- | $- | $- | $- | $964.00K | $897.00K | $4.67M | $4.59M | $4.46M | $4.36M | $4.11M | $3.93M | $4.00M | $4.04M | $4.04M |
| Tax Assets | $131.10M | $128.53M | $131.95M | $132.52M | $135.58M | $133.95M | $141.76M | $147.60M | $152.77M | $156.36M | $179.04M | $190.88M | $198.95M | $204.77M | $204.73M | $213.62M | $221.17M | $225.14M | $233.99M | $238.77M |
| Other Non-Current Assets | $19.57M | $19.78M | $47.31M | $41.48M | $34.21M | $29.08M | $29.87M | $18.61M | $19.00M | $13.71M | $15.76M | $10.24M | $11.15M | $11.62M | $13.47M | $8.08M | $8.46M | $9.24M | $10.64M | $6.24M |
| Total Non-Current Assets | $219.93M | $216.66M | $247.94M | $238.08M | $232.23M | $222.94M | $228.09M | $218.22M | $216.05M | $216.77M | $242.68M | $251.63M | $261.09M | $267.45M | $269.00M | $271.90M | $280.63M | $285.14M | $298.18M | $301.35M |
| Other Assets | $26.34M | $26.19M | $1 | $1 | $- | $- | $- | $- | $- | $- | $- | $- | $- | $- | $- | $- | $- | $- | $- | $- |
| Total Assets | $2.60B | $2.59B | $2.59B | $2.52B | $2.39B | $2.41B | $2.32B | $2.27B | $2.19B | $2.25B | $2.22B | $2.16B | $2.06B | $2.08B | $2.09B | $2.06B | $1.98B | $2.01B | $2.00B | $2.24B |
| Account Payables | $151.72M | $164.39M | $188.87M | $168.67M | $154.63M | $154.26M | $136.81M | $125.24M | $106.82M | $143.64M | $145.86M | $147.26M | $114.70M | $133.39M | $155.08M | $150.63M | $120.86M | $132.19M | $131.20M | $137.24M |
| Short Term Debt | $- | $- | $- | $- | $- | $- | $- | $- | $- | $- | $- | $- | $- | $- | $- | $- | $- | $- | $- | $- |
| Tax Payables | $5.00M | $2.40M | $- | $- | $2.71M | $272.00K | $120.00K | $775.00K | $914.00K | $320.00K | $174.00K | $- | $262.00K | $- | $770.00K | $717.00K | $722.00K | $584.00K | $1.18M | $1.00M |
| Deferred Revenue | $- | $- | $26.65M | $28.72M | $27.02M | $27.58M | $32.85M | $31.43M | $29.61M | $34.27M | $44.05M | $38.39M | $31.32M | $28.53M | $28.73M | $27.32M | $22.92M | $18.94M | $16.29M | $17.15M |
| Other Current Liabilities | $-5.00M | $-2.40M | $-26.65M | $79.78M | $-29.72M | $-27.85M | $69.37M | $109.66M | $65.75M | $-34.59M | $-44.23M | $-38.39M | $-31.58M | $140.37M | $73.03M | $40.13M | $33.30M | $87.17M | $110.67M | $109.61M |
| Total Current Liabilities | $151.72M | $164.39M | $188.87M | $277.16M | $208.35M | $154.26M | $206.30M | $201.65M | $173.49M | $143.64M | $226.79M | $229.53M | $182.71M | $133.39M | $216.69M | $218.79M | $177.80M | $193.62M | $217.79M | $220.79M |
| Long Term Debt | $1.09B | $1.05B | $1.09B | $1.04B | $992.93M | $997.00M | $998.79M | $1.00B | $994.52M | $994.65M | $1.06B | $1.06B | $1.07B | $1.02B | $1.12B | $1.14B | $1.15B | $1.15B | $1.20B | $1.45B |
| Deferred Revenue Non-Current | $- | $- | $- | $- | $- | $- | $- | $- | $- | $- | $- | $- | $- | $- | $- | $- | $- | $- | $16.29M | $17.15M |
| Deferred Tax Liabilities Non-Current | $- | $- | $- | $- | $- | $- | $- | $- | $- | $- | $- | $- | $- | $- | $- | $- | $- | $- | $-16.29M | $-17.15M |
| Other Non-Current Liabilities | $123.90M | $149.90M | $72.72M | $146.52M | $120.87M | $66.15M | $138.21M | $141.98M | $122.44M | $79.64M | $155.18M | $147.58M | $121.44M | $63.48M | $139.07M | $133.57M | $110.26M | $135.98M | $110.63M | $108.34M |
| Total Non-Current Liabilities | $1.21B | $1.20B | $1.16B | $1.08B | $1.06B | $1.15B | $1.07B | $1.07B | $1.05B | $1.17B | $1.14B | $1.13B | $1.12B | $1.22B | $1.20B | $1.20B | $1.20B | $1.22B | $1.22B | $1.47B |
| Other Liabilities | $- | $- | $65.77M | $- | $- | $- | $- | $- | $- | $- | $- | $- | $- | $- | $- | $- | $- | $- | $- | $- |
| Total Liabilities | $1.37B | $1.36B | $1.42B | $1.35B | $1.27B | $1.31B | $1.27B | $1.27B | $1.22B | $1.31B | $1.36B | $1.36B | $1.30B | $1.35B | $1.42B | $1.42B | $1.38B | $1.41B | $1.44B | $1.69B |
| Preferred Stock | $- | $- | $- | $- | $- | $- | $1 | $- | $- | $- | $- | $1 | $- | $- | $- | $- | $- | $- | $1 | $- |
| Common Stock | $31.00K | $31.00K | $31.00K | $32.00K | $32.00K | $31.00K | $31.00K | $31.00K | $31.00K | $31.00K | $31.00K | $31.00K | $31.00K | $31.00K | $31.00K | $31.00K | $31.00K | $31.00K | $31.00K | $31.00K |
| Retained Earnings | $381.31M | $378.19M | $326.12M | $298.91M | $259.74M | $238.01M | $182.25M | $138.44M | $103.73M | $79.40M | $-7.42M | $-61.75M | $-106.42M | $-141.31M | $-189.67M | $-226.80M | $-251.33M | $-263.33M | $-287.00M | $-302.19M |
| Accumulated Other Comprehensive Income Loss | $- | $- | $- | $0 | $0 | $- | $0 | $- | $0 | $- | $0 | $0 | $0 | $0 | $0 | $0 | $0 | $-27.17M | $0 | $- |
| Other Total Stockholders Equity | $852.70M | $853.89M | $852.16M | $862.64M | $861.24M | $864.78M | $862.50M | $860.52M | $858.84M | $859.86M | $863.52M | $864.07M | $861.65M | $866.16M | $863.24M | $860.54M | $857.36M | $856.47M | $851.29M | $849.64M |
| Total Stockholders Equity | $1.23B | $1.23B | $1.18B | $1.16B | $1.12B | $1.10B | $1.04B | $998.99M | $962.60M | $939.29M | $856.13M | $802.36M | $755.26M | $724.88M | $673.61M | $633.77M | $606.06M | $593.17M | $564.32M | $547.48M |
| Total Equity | $1.23B | $1.23B | $1.18B | $1.16B | $1.12B | $1.10B | $1.04B | $998.99M | $962.60M | $939.29M | $856.13M | $802.36M | $755.26M | $724.88M | $673.61M | $633.77M | $606.06M | $593.17M | $564.32M | $547.48M |
| Total Liabilities and Stockholders Equity | $2.60B | $2.59B | $2.59B | $2.52B | $2.39B | $2.41B | $2.32B | $2.27B | $2.19B | $2.25B | $2.22B | $2.16B | $2.06B | $2.08B | $2.09B | $2.06B | $1.98B | $2.01B | $2.00B | $2.24B |
| Minority Interest | $- | $- | $- | $- | $- | $- | $- | $- | $- | $- | $- | $- | $- | $- | $- | $- | $- | $- | $- | $- |
| Total Liabilities and Total Equity | $2.60B | $2.59B | $2.59B | $2.52B | $2.39B | $2.41B | $2.32B | $2.27B | $2.19B | $2.25B | $2.22B | $2.16B | $2.06B | $2.08B | $2.09B | $2.06B | $1.98B | $2.01B | $2.00B | $2.24B |
| Total Investments | $- | $- | $-1 | $- | $- | $- | $- | $- | $- | $964.00K | $1.79M | $4.67M | $4.59M | $4.46M | $4.36M | $4.11M | $3.93M | $4.00M | $4.04M | $4.04M |
| Total Debt | $1.09B | $1.05B | $1.09B | $1.04B | $992.93M | $997.00M | $998.79M | $1.00B | $994.52M | $994.65M | $1.06B | $1.06B | $1.07B | $1.07B | $1.12B | $1.14B | $1.15B | $1.15B | $1.20B | $1.45B |
| Net Debt | $1.01B | $841.22M | $1.02B | $875.46M | $888.71M | $651.41M | $722.67M | $761.07M | $873.77M | $780.05M | $1.02B | $898.90M | $911.09M | $821.47M | $766.53M | $782.07M | $902.66M | $818.44M | $1.04B | $1.15B |
Annual Cash Flow
| Breakdown | September 30, 2024 | September 30, 2023 | September 30, 2022 | September 30, 2021 | September 30, 2020 |
|---|---|---|---|---|---|
| Net Income | $140.18M | $158.61M | $220.70M | $122.02M | $52.23M |
| Depreciation and Amortization | $14.87M | $12.20M | $13.36M | $13.98M | $15.64M |
| Deferred Income Tax | $- | $23.94M | $53.27M | $21.50M | $17.66M |
| Stock Based Compensation | $7.39M | $7.28M | $8.48M | $12.17M | $10.04M |
| Change in Working Capital | $-312.30M | $-26.26M | $-216.91M | $-139.97M | $190.95M |
| Accounts Receivables | $-19.82M | $-9.71M | $-10.20M | $-5.80M | $6.52M |
| Inventory | $-282.06M | $-14.75M | $-231.44M | $-147.51M | $154.87M |
| Accounts Payables | $10.13M | $10.62M | $10.25M | $1.20M | $1.04M |
| Other Working Capital | $-20.55M | $-12.42M | $14.48M | $12.15M | $28.52M |
| Other Non Cash Items | $12.33M | $2.30M | $2.17M | $1.96M | $2.58M |
| Net Cash Provided by Operating Activities | $-137.54M | $178.06M | $81.07M | $31.66M | $289.10M |
| Investments in Property Plant and Equipment | $-22.35M | $-20.33M | $-15.05M | $-14.64M | $-10.64M |
| Acquisitions Net | $- | $- | $339.00K | $456.00K | $478.00K |
| Purchases of Investments | $-8.09M | $-9.78M | $- | $- | $- |
| Sales Maturities of Investments | $-8.59M | $- | $- | $- | $- |
| Other Investing Activities | $9.02M | $443.00K | $339.00K | $456.00K | $478.00K |
| Net Cash Used for Investing Activities | $-30.01M | $-29.67M | $-14.71M | $-14.19M | $-10.16M |
| Debt Repayment | $47.80M | $-9.00M | $-73.90M | $-82.48M | $-51.35M |
| Common Stock Issued | $- | $- | $- | $- | $- |
| Common Stock Repurchased | $-12.93M | $-2.62M | $-8.15M | $-3.04M | $-3.33M |
| Dividends Paid | $- | $- | $- | $- | $- |
| Other Financing Activities | $-11.00M | $-4.93M | $-6.63M | $-3.38M | $-4.52M |
| Net Cash Used Provided by Financing Activities | $23.88M | $-13.93M | $-88.68M | $-85.85M | $-59.20M |
| Effect of Forex Changes on Cash | $- | $- | $- | $- | $- |
| Net Change in Cash | $-143.68M | $134.46M | $-22.32M | $-68.39M | $219.73M |
| Cash at End of Period | $242.61M | $386.29M | $251.83M | $274.14M | $342.53M |
| Cash at Beginning of Period | $386.29M | $251.83M | $274.14M | $342.53M | $122.79M |
| Operating Cash Flow | $-137.54M | $178.06M | $81.07M | $31.66M | $289.10M |
| Capital Expenditure | $-22.35M | $-20.33M | $-15.05M | $-14.64M | $-10.64M |
| Free Cash Flow | $-159.90M | $157.72M | $66.03M | $17.01M | $278.45M |
Cash Flow Charts
| Breakdown | December 31, 2024 | September 30, 2024 | June 30, 2024 | March 31, 2024 | December 31, 2023 | September 30, 2023 | June 30, 2023 | March 31, 2023 | December 31, 2022 | September 30, 2022 | June 30, 2022 | March 31, 2022 | December 31, 2021 | September 30, 2021 | June 30, 2021 | March 31, 2021 | December 31, 2020 | September 30, 2020 | June 30, 2020 | March 31, 2020 |
|---|---|---|---|---|---|---|---|---|---|---|---|---|---|---|---|---|---|---|---|---|
| Net Income | $3.13M | $52.07M | $27.21M | $39.17M | $21.73M | $55.76M | $43.82M | $34.71M | $24.33M | $86.82M | $54.32M | $44.67M | $34.88M | $48.36M | $37.13M | $24.53M | $12.00M | $23.68M | $15.19M | $10.61M |
| Depreciation and Amortization | $4.05M | $5.17M | $3.89M | $3.57M | $2.23M | $3.76M | $2.91M | $3.02M | $2.51M | $4.26M | $3.19M | $3.03M | $2.88M | $3.48M | $3.69M | $3.68M | $3.12M | $4.81M | $3.78M | $3.63M |
| Deferred Income Tax | $- | $8.54M | $2.45M | $6.74M | $1.18M | $8.47M | $6.24M | $5.09M | $4.13M | $23.58M | $13.15M | $10.07M | $6.46M | $-1.09M | $10.80M | $7.67M | $4.11M | $8.76M | $4.96M | $4.17M |
| Stock Based Compensation | $1.91M | $1.85M | $2.47M | $1.39M | $1.67M | $2.03M | $1.99M | $1.68M | $1.58M | $1.96M | $1.98M | $2.42M | $2.11M | $2.91M | $3.19M | $2.55M | $3.51M | $5.17M | $1.66M | $899.00K |
| Change in Working Capital | $-168.45M | $116.09M | $-119.48M | $-56.60M | $-252.31M | $12.24M | $364.00K | $82.47M | $-121.33M | $127.45M | $-178.97M | $-41.46M | $-123.94M | $-100.89M | $-27.36M | $86.03M | $-97.76M | $187.13M | $77.12M | $19.45M |
| Accounts Receivables | $-5.30M | $818.00K | $- | $10.83M | $-19.70M | $-12.40M | $-4.73M | $-3.60M | $11.02M | $-10.75M | $-842.00K | $-3.49M | $4.88M | $-2.65M | $-5.86M | $1.49M | $1.23M | $-2.03M | $2.74M | $-1.13M |
| Inventory | $-122.32M | $130.60M | $- | $-102.78M | $-196.33M | $-13.52M | $1.05M | $38.21M | $-40.49M | $119.98M | $-177.20M | $-95.07M | $-79.16M | $-92.64M | $-23.64M | $31.43M | $-62.66M | $161.48M | $82.55M | $-20.16M |
| Accounts Payables | $-12.67M | $-24.48M | $20.20M | $14.03M | $379.00K | $17.44M | $11.57M | $18.42M | $-36.82M | $-2.22M | $-1.39M | $32.56M | $-18.69M | $-21.69M | $4.45M | $29.77M | $-11.33M | $992.00K | $-6.04M | $27.09M |
| Other Working Capital | $-28.16M | $9.15M | $-139.68M | $21.32M | $215.66M | $20.72M | $-7.52M | $29.43M | $-55.05M | $20.45M | $468.00K | $24.54M | $-30.98M | $16.11M | $-2.31M | $23.34M | $-25.00M | $26.68M | $-2.13M | $13.66M |
| Other Non Cash Items | $-14.00K | $1.72M | $44.00K | $78.30M | $-83.00K | $-27.00K | $246.00K | $84.00K | $2.00M | $1.49M | $-56.00K | $946.00K | $-209.00K | $329.00K | $940.00K | $252.00K | $435.00K | $598.00K | $2.17M | $-143.00K |
| Net Cash Provided by Operating Activities | $-159.37M | $185.44M | $-83.41M | $-13.88M | $-225.58M | $82.22M | $55.56M | $127.05M | $-86.78M | $245.58M | $-106.37M | $19.69M | $-77.82M | $-46.89M | $28.40M | $124.72M | $-74.58M | $230.14M | $104.87M | $38.62M |
| Investments in Property Plant and Equipment | $-5.22M | $-5.66M | $-5.19M | $-5.96M | $-5.54M | $-6.21M | $-6.30M | $-4.58M | $-3.25M | $-3.86M | $-5.00M | $-3.30M | $-2.89M | $-4.33M | $-3.81M | $-3.56M | $-2.95M | $-3.13M | $-2.03M | $-2.85M |
| Acquisitions Net | $- | $- | $- | $98.00K | $96.00K | $302.00K | $91.00K | $36.00K | $16.00K | $82.00K | $98.00K | $76.00K | $83.00K | $148.00K | $138.00K | $- | $- | $- | $- | $-19.00K |
| Purchases of Investments | $-503.00K | $-551.00K | $-82.00K | $-125.00K | $-7.33M | $-1.94M | $-7.84M | $- | $- | $- | $- | $- | $- | $- | $- | $- | $- | $- | $- | $- |
| Sales Maturities of Investments | $- | $- | $- | $-8.59M | $-96.00K | $-302.00K | $7.75M | $- | $- | $- | $- | $- | $- | $- | $- | $- | $- | $- | $- | $- |
| Other Investing Activities | $50.00K | $76.00K | $158.00K | $-27.00K | $96.00K | $302.00K | $-7.75M | $36.00K | $-2.00K | $82.00K | $98.00K | $76.00K | $83.00K | $148.00K | $138.00K | $75.00K | $95.00K | $264.00K | $78.00K | $70.00K |
| Net Cash Used for Investing Activities | $-5.67M | $-6.14M | $-5.11M | $-5.98M | $-12.78M | $-7.85M | $-14.04M | $-4.54M | $-3.23M | $-3.77M | $-4.90M | $-3.23M | $-2.81M | $-4.18M | $-3.67M | $-3.49M | $-2.86M | $-2.87M | $-1.95M | $-2.79M |
| Debt Repayment | $45.00M | $-45.00M | $45.00M | $46.92M | $-4.28M | $-4.00M | $-5.00M | $- | $- | $-66.15M | $-1.64M | $- | $- | $-57.35M | $-14.92M | $-10.21M | $- | $-50.10M | $-250.00M | $220.00M |
| Common Stock Issued | $- | $- | $- | $16.00K | $- | $-12.00K | $12.00K | $- | $- | $- | $1.00K | $4.00K | $- | $- | $- | $- | $- | $- | $- | $- |
| Common Stock Repurchased | $- | $- | $-12.93M | $-10.00K | $-5.21M | $- | $-18.00K | $- | $-2.60M | $-5.63M | $-2.53M | $-2.00K | $-6.62M | $- | $-491.00K | $- | $-2.62M | $-12.00K | $-13.00K | $-3.33M |
| Dividends Paid | $- | $- | $- | $- | $- | $- | $- | $- | $- | $- | $- | $- | $- | $- | $- | $- | $- | $- | $- | $- |
| Other Financing Activities | $-3.11M | $-125.00K | $-508.00K | $-10.00K | $-5.33M | $262.00K | $-6.00K | $- | $-5.17M | $- | $-11.00K | $-6.12M | $-6.62M | $-469.00K | $-491.00K | $628.00K | $-3.04M | $10.00K | $-110.00K | $16.00K |
| Net Cash Used Provided by Financing Activities | $41.89M | $-45.12M | $31.56M | $46.93M | $-9.61M | $-3.75M | $-5.00M | $- | $-5.17M | $-71.78M | $-4.17M | $-6.11M | $-6.62M | $-57.82M | $-15.41M | $-9.58M | $-3.04M | $-50.09M | $-250.11M | $216.69M |
| Effect of Forex Changes on Cash | $- | $- | $- | $- | $- | $- | $- | $- | $- | $- | $- | $- | $- | $- | $- | $- | $- | $- | $- | $- |
| Net Change in Cash | $-123.14M | $134.17M | $-56.96M | $27.07M | $-247.97M | $70.62M | $36.52M | $122.50M | $-95.18M | $170.03M | $-115.45M | $10.35M | $-87.25M | $-108.88M | $9.33M | $111.65M | $-80.48M | $177.18M | $-147.19M | $252.51M |
| Cash at End of Period | $119.47M | $242.61M | $108.44M | $165.39M | $138.32M | $386.29M | $315.67M | $279.15M | $156.65M | $251.83M | $81.80M | $197.25M | $186.90M | $274.14M | $383.02M | $373.69M | $262.05M | $342.53M | $165.35M | $312.55M |
| Cash at Beginning of Period | $242.61M | $108.44M | $165.39M | $138.32M | $386.29M | $315.67M | $279.15M | $156.65M | $251.83M | $81.80M | $197.25M | $186.90M | $274.14M | $383.02M | $373.69M | $262.05M | $342.53M | $165.35M | $312.55M | $60.04M |
| Operating Cash Flow | $-159.37M | $185.44M | $-83.41M | $-13.88M | $-225.58M | $82.22M | $55.56M | $127.05M | $-86.78M | $245.58M | $-106.37M | $19.69M | $-77.82M | $-46.89M | $28.40M | $124.72M | $-74.58M | $230.14M | $104.87M | $38.62M |
| Capital Expenditure | $-5.22M | $-5.66M | $-5.19M | $-5.96M | $-5.54M | $-6.21M | $-6.30M | $-4.58M | $-3.25M | $-3.86M | $-5.00M | $-3.30M | $-2.89M | $-4.33M | $-3.81M | $-3.56M | $-2.95M | $-3.13M | $-2.03M | $-2.85M |
| Free Cash Flow | $-164.58M | $179.77M | $-88.60M | $-19.83M | $-231.13M | $76.01M | $49.27M | $122.47M | $-90.03M | $241.72M | $-111.37M | $16.39M | $-80.71M | $-51.21M | $24.60M | $121.16M | $-77.53M | $227.01M | $102.84M | $35.77M |

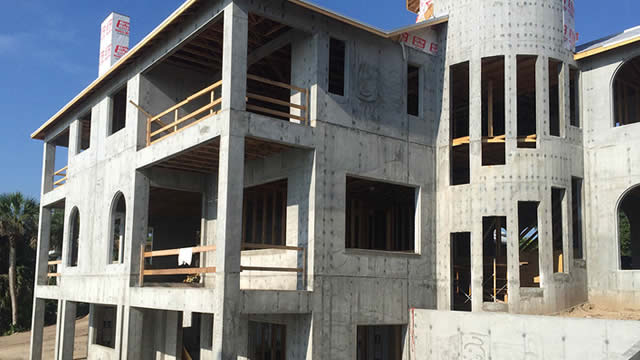
Beazer Homes USA, Inc. operates as a homebuilder in the United States. It designs, constructs, and sells single-family and multi-family homes under the Beazer Homes, Gatherings, and Choice Plans names. The company sells its homes through commissioned new home sales counselors and independent brokers in Arizona, California, Nevada, Texas, Delaware, Maryland, Indiana, Tennessee, Virginia, Florida, Georgia, North Carolina, and South Carolina. Beazer Homes USA, Inc. was founded in 1985 and is headquartered in Atlanta, Georgia.
$19.35
Stock Price
$603.78M
Market Cap
1.16K
Employees
Atlanta, GA
Location
Revenue (FY 2024)
$2.33B
5.6% YoY
Net Income (FY 2024)
$140.18M
-11.6% YoY
EPS (FY 2024)
$4.53
-12.2% YoY
Free Cash Flow (FY 2024)
$-159.90M
-201.4% YoY
Profitability
Gross Margin
18.2%
Net Margin
6.0%
ROE
11.4%
ROA
5.4%
Valuation
P/E Ratio
7.45
P/S Ratio
0.45
EV/EBITDA
11.94
Market Cap
$603.78M
Revenue & Net Income
Profit Margins
Cash Flow Summary
Operating Cash Flow
$-137.54M
-177.2% YoY
Free Cash Flow
$-159.90M
-201.4% YoY
Balance Sheet Summary
Total Assets
$2.59B
7.5% YoY
Total Debt
$1.05B
4.8% YoY
Shareholder Equity
$1.23B
11.0% YoY
Dividend Overview
$0.10
Latest Dividend
%
Dividend Yield
%
Payout Ratio
Recent Dividend History
| Date | Amount | Type |
|---|---|---|
| 2007-09-06 | $0.10 | September 06, 07 |
| 2007-06-07 | $0.10 | June 07, 07 |
| 2007-03-07 | $0.10 | March 07, 07 |
| 2006-12-07 | $0.10 | December 07, 06 |
| 2006-09-07 | $0.10 | September 07, 06 |
| 2006-06-08 | $0.10 | June 08, 06 |
| 2006-03-08 | $0.10 | March 08, 06 |
| 2005-12-07 | $0.10 | December 07, 05 |
| 2005-09-08 | $0.10 | September 08, 05 |
| 2005-06-08 | $0.10 | June 08, 05 |
Beazer Homes USA Dividends
Explore Beazer Homes USA's dividend history, including dividend yield, payout ratio, and historical payments.
Dividend Yield
-
Dividend Payout Ratio
-
Dividend Paid & Capex Coverage Ratio
-6.15x
Beazer Homes USA Dividend History
| Dividend | Adjusted Dividend | Date | Record Date | Payment Date | Declaration Date |
|---|---|---|---|---|---|
| $0.1 | $0.5 | September 06, 2007 | September 10, 2007 | September 21, 2007 | August 03, 2007 |
| $0.1 | $0.5 | June 07, 2007 | June 11, 2007 | June 22, 2007 | May 03, 2007 |
| $0.1 | $0.5 | March 07, 2007 | March 09, 2007 | March 22, 2007 | February 07, 2007 |
| $0.1 | $0.5 | December 07, 2006 | December 11, 2006 | December 22, 2006 | November 03, 2006 |
| $0.1 | $0.5 | September 07, 2006 | September 11, 2006 | September 22, 2006 | August 10, 2006 |
| $0.1 | $0.5 | June 08, 2006 | June 12, 2006 | June 22, 2006 | May 05, 2006 |
| $0.1 | $0.5 | March 08, 2006 | March 10, 2006 | March 22, 2006 | February 03, 2006 |
| $0.1 | $0.5 | December 07, 2005 | December 09, 2005 | December 21, 2005 | November 09, 2005 |
| $0.1 | $0.5 | September 08, 2005 | September 12, 2005 | September 22, 2005 | August 03, 2005 |
| $0.1 | $0.5 | June 08, 2005 | June 10, 2005 | June 22, 2005 | May 11, 2005 |
| $0.3 | $0.5 | March 08, 2005 | March 10, 2005 | March 22, 2005 | February 07, 2005 |
| $0.1 | $0.16667 | December 08, 2004 | December 10, 2004 | December 22, 2004 | November 05, 2004 |
| $0.1 | $0.16667 | September 08, 2004 | September 10, 2004 | September 22, 2004 | August 09, 2004 |
| $0.1 | $0.16667 | June 08, 2004 | June 10, 2004 | June 22, 2004 | May 10, 2004 |
| $0.1 | $0.16667 | March 08, 2004 | March 10, 2004 | March 22, 2004 | February 11, 2004 |
| $0.1 | $0.16667 | December 08, 2003 | December 10, 2003 | December 22, 2003 | November 05, 2003 |
Beazer Homes USA News
Read the latest news about Beazer Homes USA, including recent articles, headlines, and updates.
Beazer Homes USA, Inc. to Webcast Its Fiscal Second Quarter Results Conference Call on Thursday, May 1, 2025
ATLANTA--(BUSINESS WIRE)-- #GetMoreWithBeazer--Beazer Homes (NYSE: BZH) (www.beazer.com) has scheduled the release of its financial results for the quarter ended March 31, 2025 on Thursday, May 1, 2025 after the close of the market. Management will host a conference call on the same day at 5:00 PM ET to discuss the results. The public may listen to the conference call and view the Company's slide presentation on the "Investor Relations" page of the Company's website, www.beazer.com. In addition, the conference call.


Beazer Homes Unites Employees Nationwide for National Day of Service, Raising $3 Million for Fisher House Foundation
ATLANTA--(BUSINESS WIRE)-- #BeazerDayofService--Beazer Homes, one of the nation's leading homebuilders, has taken its commitment to giving back to new heights. On Friday, March 14, nearly all of Beazer's employees, along with partners and suppliers, united across 17 cities for the company's National Day of Service. This nationwide effort demonstrated Beazer's dedication to not just building homes, but also fostering thriving and healthy communities. Volunteers lent a hand to a wide range of local nonprofits, with a.

3 Housing-Related Book Value Bargains
The housing sector continues to be more than challenged triggering a recent sharp downturn in most housing related stocks. Housing affordability remains near historical lows, new home inventory is surging, and mortgage rates are stubbornly hovering near the 7% level. New tariffs are also pushing the price of lumber higher, which will hurt profit margins for the home builders.


Beazer Homes Accelerates Pace of Share Repurchases
ATLANTA--(BUSINESS WIRE)-- #GetMoreWithBeazer--Beazer Homes USA, Inc. (NYSE: BZH) today announced that it is accelerating the pace of its share repurchases in light of recent share price dislocation. The Company will continue to repurchase shares pursuant to the Company's previously authorized share repurchase program, under which approximately $24.8 million remains available. Since January 30th, after reporting earnings for the first quarter of 2025, the Company has repurchased approximately $4.1 million of its sh.

Compared to Estimates, Beazer (BZH) Q1 Earnings: A Look at Key Metrics
Although the revenue and EPS for Beazer (BZH) give a sense of how its business performed in the quarter ended December 2024, it might be worth considering how some key metrics compare with Wall Street estimates and the year-ago numbers.

Beazer Homes USA, Inc. (BZH) Q1 2025 Earnings Call Transcript
Start Time: 17:00 January 1, 0000 5:47 PM ET Beazer Homes USA, Inc. (NYSE:BZH ) Q1 2025 Earnings Conference Call January 30, 2025, 17:00 PM ET Company Participants Allan Merrill - Chairman and CEO Dave Goldberg - SVP and CFO Conference Call Participants Tyler Batory - Oppenheimer Alan Ratner - Zelman & Associates Julio Romero - Sidoti & Company Jay McCanless - Wedbush Operator Good afternoon, and welcome to the Beazer Homes Earnings Conference Call for the First Quarter and Fiscal Year ended December 31, 2024. Today's call is being recorded, and a replay will be available on the company's website later today.


Beazer Homes Reports First Quarter Fiscal 2025 Results
ATLANTA--(BUSINESS WIRE)-- #GetMoreWithBeazer--Beazer Homes USA, Inc. (NYSE: BZH) (www.beazer.com) today announced its financial results for the three months ended December 31, 2024. “Despite a challenging new home sales environment, we had a productive first quarter and made progress toward our full year and Multi-Year Goals,” said Allan P. Merrill, the Company's Chairman and Chief Executive Officer. “Net new orders and closings increased year-over-year, supported by a 20% higher community count. We also grew our.

Beazer Homes USA, Inc. to Webcast Its Fiscal First Quarter Results Conference Call on Thursday, January 30, 2025
ATLANTA--(BUSINESS WIRE)-- #GetMoreWithBeazer--Beazer Homes (NYSE: BZH) (www.beazer.com) has scheduled the release of its financial results for the quarter ended December 31, 2024 on Thursday, January 30, 2025 after the close of the market. Management will host a conference call on the same day at 5:00 PM ET to discuss the results. The public may listen to the conference call and view the Company's slide presentation on the "Investor Relations" page of the Company's website, www.beazer.com. In addition, the confere.

Green Builder Media and Beazer Homes Announce the Launch of VISION House Las Vegas at IBS/KBIS 2025
The VISION House Las Vegas project showcases Beazer's commitment to building all of its homes to the DOE Zero Energy Ready Home (ZERH) certification by the end of 2025. The VISION House Las Vegas project showcases Beazer's commitment to building all of its homes to the DOE Zero Energy Ready Home (ZERH) certification by the end of 2025.

Beazer Homes USA: Still A Great Play As Shares Continue To Rise
Despite rising home prices, a housing shortage boosts demand, making homebuilding stocks, especially Beazer Homes USA, a strong long-term investment. Beazer Homes USA saw a 17.6% share increase since June and a 78.3% rise since January 2022, outperforming the S&P 500. Revenue rose 5.6% in 2024, but profits and cash flows declined due to rising costs; however, operating cash flow surged in the final quarter.

Beazer Homes: Growth Ambitions May Be Derailed By Macro Forces
Beazer Homes faces challenges with high interest rates, lower buyer affordability, and increased construction costs, leading to skepticism about its growth plans. Despite a revenue increase in fiscal 2024, rising costs caused a drop in gross profit and operating income, straining cash flow. The company plans to expand its inventory and community developments, but lower backlog and higher cancellation rates pose risks.


Beazer Homes USA, Inc. (BZH) Q4 2024 Earnings Call Transcript
Beazer Homes USA, Inc. (NYSE:BZH ) Q4 2024 Earnings Call Transcript November 13, 2024 5:00 PM ET Company Participants Dave Goldberg - SVP and CFO Allan Merrill - Chairman and CEO Conference Call Participants Alex Hantman - Sidoti & Company Alan Ratner - Zelman & Associates Tyler Batory - Oppenheimer Jay McCanless - Wedbush Alex Rygiel - B. Riley Alex Barron - Housing Research Center Operator Good afternoon, and welcome to the Beazer Homes Earnings Conference Call for the Fourth Quarter and Fiscal Year Ended September 30th 2024.


Beazer Homes Reports Fourth Quarter and Full Fiscal 2024 Results
ATLANTA--(BUSINESS WIRE)-- #GetMoreWithBeazer--Beazer Homes USA, Inc. (NYSE: BZH) (www.beazer.com) today announced its financial results for the quarter and fiscal year ended September 30, 2024. "We generated strong fourth quarter and full year results, despite a challenging operating environment for much of the period," said Allan P. Merrill, the Company's Chairman and Chief Executive Officer. "We ended the year with 162 active communities, up 20.9% year-over-year, which contributed to revenue growth for the quart.


Beazer Homes USA, Inc. to Webcast Its Fourth Quarter and Full Year Fiscal 2024 Financial Results Conference Call on November 13, 2024
ATLANTA--(BUSINESS WIRE)-- #GetMoreWithBeazer--Beazer Homes (NYSE: BZH) (www.beazer.com) has scheduled the release of its financial results for the quarter ended September 30, 2024 on Wednesday, November 13, 2024 after the close of the market. Management will host a conference call on the same day at 5:00 PM ET to discuss the results. The public may listen to the conference call and view the Company's slide presentation on the "Investor Relations" page of the Company's website, www.beazer.com. In addition, the conf.

Beazer Homes Celebrates 30 Years on NYSE and Energy Efficiency Leadership
NEW YORK--(BUSINESS WIRE)-- #BeazerHomes--Today Beazer Homes USA, Inc. (NYSE: BZH) will ring The Opening Bell® at the New York Stock Exchange. This year marks Beazer's 30th Anniversary of Listing on the New York Stock Exchange. The national homebuilder has since become a leader in energy efficient construction, operating in 17 markets across the U.S. The senior leadership team will ring the bell in celebration of the milestone anniversary and National Energy Awareness Month. On October 2, Beazer Homes was rec.


Beazer Homes to Present at the 32nd Annual Deutsche Bank Leveraged Finance Conference on September 25, 2024
ATLANTA--(BUSINESS WIRE)-- #GetMoreWithBeazer--Beazer Homes USA, Inc. (NYSE: BZH) (www.beazer.com) will present at the 32nd Annual Deutsche Bank Leveraged Finance Conference in Scottsdale, AZ on Wednesday, September 25, 2024 at 8:40 am MST or 11:40 am EDT. A live audio webcast and subsequent replay of the discussion will be available on Beazer Homes' website, https://ir.beazer.com/. About Beazer Homes USA, Inc. Headquartered in Atlanta, Beazer Homes (NYSE: BZH) is one of the country's largest homebuilders. Every Be.


Similar Companies
Related Metrics
Explore detailed financial metrics and analysis for BZH.