Cosan S.A Key Executives
This section highlights Cosan S.A's key executives, including their titles and compensation details.
Find Contacts at Cosan S.A
(Showing 0 of )
Cosan S.A Earnings
This section highlights Cosan S.A's earnings, including key dates, EPS, earnings reports, and earnings call transcripts.
Next Earnings Date
Last Earnings Results
Earnings Call Transcripts
| Transcript | Quarter | Year | Date | Estimated EPS | Actual EPS |
|---|---|---|---|---|---|
| Read Transcript | Q4 | 2024 | 2025-02-27 | N/A | N/A |
| Read Transcript | Q3 | 2024 | 2024-11-14 | N/A | N/A |
| Read Transcript | Q2 | 2024 | 2024-08-15 | N/A | N/A |
| Read Transcript | Q1 | 2024 | 2024-05-29 | N/A | N/A |
| Read Transcript | Q3 | 2023 | 2023-11-14 | N/A | N/A |
| Read Transcript | Q2 | 2023 | 2023-08-15 | N/A | N/A |
| Read Transcript | Q1 | 2023 | 2023-05-16 | $0.22 | $-0.02 |

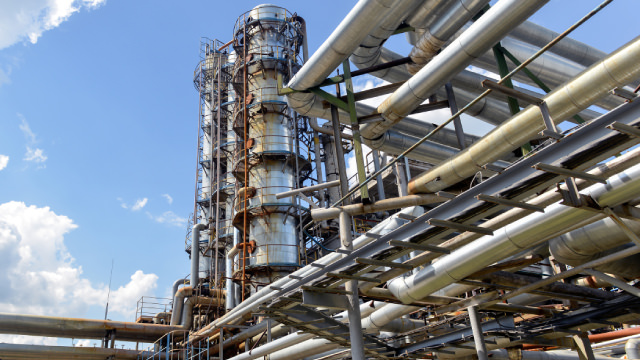
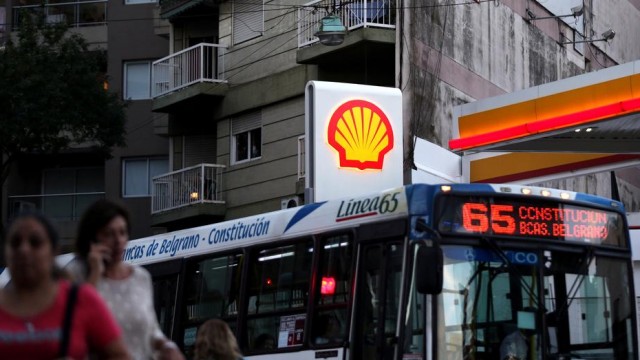
Cosan S.A., through its subsidiaries, primarily engages in the fuel distribution business in Brazil, Europe, Latin America, North America, Asia, and internationally. The company's Raízen segment distributes and markets fuels through a franchised network of service stations under the Shell brand; engages in the petroleum refining; operation of convenience stores; manufacture and sale of automotive and industrial lubricants; and production and sale of liquefied petroleum gas. This segment also markets various products derived from sugar cane, including raw sugar, and anhydrous and hydrated ethanol, as well as engages in activities related to energy cogeneration from sugarcane bagasse; sale of electricity; and holds interests in companies involved in research and development on new technology. The company's Gas and Power segment distributes piped natural gas to customers in the industrial, residential, commercial, automotive, and cogeneration sectors; and engages in purchase and sale of electricity to other traders. Its Moove segment produces and distributes lubricants under the Mobil and Comma brands. The company's Logistics segment provides logistics services for rail transportation, storage and port loading of commodities, including grains and sugar; and leases locomotives, wagons, and another railroad equipment. Its Cosan Investments segment manages agricultural, mining, and logistics projects; and invests in climate tech fund. Cosan S.A. was founded in 1936 and is headquartered in São Paulo, Brazil.
$5.45
Stock Price
$2.53B
Market Cap
11.66K
Employees
São Paulo, SP
Location
Financial Statements
Access annual & quarterly financial statements for Cosan S.A, including income statements, balance sheets, and cash flow statements..
Annual Income Statement
| Breakdown | December 31, 2024 | December 31, 2023 | December 31, 2022 | December 31, 2021 | December 31, 2020 |
|---|---|---|---|---|---|
| Revenue | $43.95B | $39.47B | $39.74B | $24.91B | $13.51B |
| Cost of Revenue | $30.24B | $28.55B | $30.75B | $18.57B | $9.82B |
| Gross Profit | $13.71B | $10.92B | $8.98B | $6.34B | $3.69B |
| Gross Profit Ratio | 31.20% | 27.66% | 22.61% | 25.45% | 27.34% |
| Research and Development Expenses | $- | $- | $- | $- | $- |
| General and Administrative Expenses | $2.85B | $2.53B | $1.98B | $2.05B | $1.01B |
| Selling and Marketing Expenses | $1.58B | $1.35B | $1.28B | $716.21M | $927.35M |
| Selling General and Administrative Expenses | $4.42B | $3.88B | $3.25B | $2.77B | $1.93B |
| Other Expenses | $- | $- | $-114.81M | $-287.01M | $-29.82M |
| Operating Expenses | $4.42B | $4.04B | $3.14B | $2.48B | $1.90B |
| Cost and Expenses | $34.66B | $32.59B | $33.89B | $21.05B | $11.72B |
| Interest Income | $- | $2.51B | $388.77M | $410.50M | $173.21M |
| Interest Expense | $- | $5.64B | $5.89B | $3.96B | $1.15B |
| Depreciation and Amortization | $3.26B | $3.36B | $3.01B | $2.22B | $623.08M |
| EBITDA | $13.22B | $14.12B | $6.87B | $4.53B | $1.39B |
| EBITDA Ratio | 30.07% | 35.77% | 17.29% | 18.18% | 10.29% |
| Operating Income | $9.29B | $6.88B | $5.93B | $8.70B | $2.58B |
| Operating Income Ratio | 21.15% | 17.43% | 14.93% | 34.95% | 19.09% |
| Total Other Income Expenses Net | $-14.54B | $-1.77B | $-3.23B | $2.14B | $-587.58M |
| Income Before Tax | $-5.25B | $5.11B | $2.70B | $5.90B | $1.17B |
| Income Before Tax Ratio | -11.93% | 12.96% | 6.80% | 23.69% | 8.64% |
| Income Tax Expense | $3.19B | $274.43M | $-118.40M | $-450.75M | $257.85M |
| Net Income | $-9.42B | $1.09B | $2.82B | $6.31B | $859.48M |
| Net Income Ratio | -21.44% | 2.77% | 7.10% | 25.34% | 6.36% |
| EPS | $-21.44 | $2.36 | $6.04 | $13.36 | $2.20 |
| EPS Diluted | $-20.84 | $2.32 | $6.00 | $13.32 | $2.20 |
| Weighted Average Shares Outstanding | 452.52M | 466.75M | 467.27M | 458.63M | 385.59M |
| Weighted Average Shares Outstanding Diluted | 465.68M | 468.59M | 468.64M | 459.81M | 386.65M |
| SEC Filing | Source | Source | Source | Source | Source |
| Breakdown | December 31, 2024 | September 30, 2024 | June 30, 2024 | March 31, 2024 | December 31, 2023 | September 30, 2023 | June 30, 2023 | March 31, 2023 | December 31, 2022 | September 30, 2022 | June 30, 2022 | March 31, 2022 | December 31, 2021 | September 30, 2021 | June 30, 2021 | March 31, 2021 | December 31, 2020 | September 30, 2020 | June 30, 2020 | March 31, 2020 |
|---|---|---|---|---|---|---|---|---|---|---|---|---|---|---|---|---|---|---|---|---|
| Revenue | $11.77B | $11.65B | $10.69B | $9.84B | $9.57B | $10.25B | $10.01B | $9.63B | $10.75B | $11.51B | $9.57B | $7.90B | $6.75B | $6.89B | $6.56B | $4.72B | $3.93B | $3.71B | $2.36B | $3.51B |
| Cost of Revenue | $8.36B | $7.81B | $7.14B | $6.93B | $7.33B | $6.96B | $7.14B | $7.13B | $8.59B | $8.70B | $7.28B | $6.19B | $5.31B | $4.96B | $4.94B | $3.37B | $3.04B | $2.64B | $1.65B | $2.49B |
| Gross Profit | $3.41B | $3.84B | $3.56B | $2.91B | $2.25B | $3.30B | $2.88B | $2.50B | $2.17B | $2.81B | $2.29B | $1.72B | $1.44B | $1.93B | $1.62B | $1.35B | $889.96M | $1.08B | $704.73M | $1.02B |
| Gross Profit Ratio | 28.95% | 32.95% | 33.26% | 29.60% | 23.46% | 32.17% | 28.72% | 25.94% | 20.16% | 24.41% | 23.95% | 21.70% | 21.36% | 28.06% | 24.67% | 28.54% | 22.64% | 29.01% | 29.90% | 29.09% |
| Research and Development Expenses | $- | $- | $- | $- | $- | $- | $- | $- | $- | $- | $- | $- | $- | $- | $- | $- | $- | $- | $- | $- |
| General and Administrative Expenses | $701.42M | $949.19M | $611.41M | $583.25M | $638.12M | $745.80M | $594.27M | $549.78M | $578.76M | $563.98M | $447.76M | $385.83M | $656.23M | $549.34M | $484.64M | $363.61M | $340.22M | $288.49M | $206.69M | $171.22M |
| Selling and Marketing Expenses | $420.44M | $417.55M | $376.50M | $361.40M | $339.87M | $329.46M | $341.51M | $339.73M | $460.25M | $378.62M | $261.02M | $176.39M | $197.88M | $178.92M | $180.75M | $158.66M | $169.88M | $171.37M | $306.70M | $279.40M |
| Selling General and Administrative Expenses | $1.12B | $1.37B | $987.91M | $944.66M | $977.98M | $1.08B | $935.78M | $889.52M | $1.04B | $942.60M | $708.78M | $562.22M | $854.11M | $728.26M | $665.39M | $522.26M | $510.11M | $459.86M | $513.38M | $450.62M |
| Other Expenses | $6.83B | $2.47B | $2.27B | $-13.51M | $-31.34M | $731.17M | $-132.89M | $23.56M | $-36.89M | $-203.00K | $-48.99M | $-19.77M | $-9.49M | $17.53M | $81.86M | $-5.16M | $-6.41M | $-4.04M | $32.37M | $40.91M |
| Operating Expenses | $7.95B | $3.84B | $3.26B | $958.17M | $1.01B | $1.07B | $935.78M | $889.52M | $1.00B | $942.39M | $659.79M | $562.22M | $844.62M | $691.99M | $424.13M | $522.26M | $480.28M | $459.86M | $513.38M | $450.62M |
| Cost and Expenses | $16.31B | $11.65B | $10.40B | $7.89B | $8.34B | $8.02B | $8.07B | $8.02B | $9.59B | $9.64B | $7.94B | $6.75B | $6.15B | $5.65B | $5.36B | $3.89B | $3.52B | $3.10B | $2.17B | $2.94B |
| Interest Income | $- | $96.23M | $635.20M | $562.35M | $668.48M | $111.20M | $126.34M | $99.56M | $127.40M | $122.93M | $63.33M | $80.56M | $62.29M | $78.52M | $185.55M | $84.15M | $108.36M | $6.92M | $87.67M | $30.07M |
| Interest Expense | $- | $1.62B | $1.93B | $1.77B | $1.05B | $1.36B | $1.37B | $2.01B | $2.16B | $1.14B | $1.34B | $1.33B | $1.57B | $1.10B | $741.80M | $622.39M | $304.01M | $348.08M | $182.16M | $379.98M |
| Depreciation and Amortization | $805.35M | $1.07B | $926.46M | $907.26M | $887.13M | $867.63M | $824.96M | $785.22M | $851.73M | $679.05M | $728.84M | $754.86M | $657.01M | $634.54M | $616.22M | $311.31M | $162.03M | $168.39M | $149.15M | $143.52M |
| EBITDA | $2.97B | $4.19B | $-865.90M | $1.46B | $3.87B | $3.57B | $3.03B | $651.23M | $3.28B | $1.29B | $797.76M | $1.53B | $1.80B | $1.19B | $1.83B | $869.64M | $665.95M | $380.31M | $250.16M | $98.35M |
| EBITDA Ratio | 25.25% | 35.98% | -8.10% | 14.80% | 40.46% | 34.83% | 30.24% | 6.76% | 30.48% | 11.21% | 8.34% | 19.35% | 26.61% | 17.28% | 27.84% | 18.44% | 16.94% | 10.24% | 10.62% | 2.80% |
| Operating Income | $-4.54B | $- | $294.95M | $1.96B | $1.24B | $3.09B | $2.20B | $2.90B | $1.20B | $1.70B | $1.85B | $1.16B | $1.14B | $4.62B | $1.84B | $1.09B | $885.81M | $834.33M | $101.01M | $817.12M |
| Operating Income Ratio | -38.62% | 0.00% | 2.76% | 19.87% | 12.92% | 30.18% | 22.00% | 30.07% | 11.20% | 14.82% | 19.31% | 14.66% | 16.87% | 67.04% | 28.11% | 23.12% | 22.54% | 22.46% | 4.29% | 23.30% |
| Total Other Income Expenses Net | $-1.38B | $1.50B | $-2.66B | $-1.71B | $2.18B | $-718.50M | $-2.72B | $-1.22B | $735.12M | $-1.70B | $-1.65B | $-528.49M | $-399.31M | $2.20B | $-177.60M | $-157.23M | $392.83M | $-221.19M | $-242.27M | $-466.99M |
| Income Before Tax | $-5.92B | $1.50B | $-2.36B | $190.39M | $2.97B | $2.23B | $-913.22M | $385.45M | $2.14B | $3.72M | $-63.68M | $624.95M | $333.96M | $3.44B | $1.46B | $666.44M | $802.51M | $402.89M | $-141.26M | $102.53M |
| Income Before Tax Ratio | -50.30% | 12.92% | -22.09% | 1.93% | 31.04% | 21.72% | -9.12% | 4.00% | 19.88% | 0.03% | -0.67% | 7.91% | 4.95% | 49.93% | 22.25% | 14.13% | 20.42% | 10.85% | -5.99% | 2.92% |
| Income Tax Expense | $2.80B | $510.05M | $-108.52M | $-15.64M | $-563.38M | $500.10M | $-466.48M | $804.18M | $198.16M | $-250.12M | $-115.55M | $49.11M | $-755.41M | $82.70M | $263.79M | $-41.82M | $162.76M | $73.68M | $35.59M | $-14.18M |
| Net Income | $-9.30B | $292.88M | $-227.11M | $-192.18M | $2.36B | $678.75M | $-1.04B | $-418.73M | $1.94B | $253.85M | $51.87M | $510.19M | $1.47B | $3.26B | $942.36M | $638.81M | $620.15M | $303.84M | $-174.38M | $102.25M |
| Net Income Ratio | -79.00% | 2.51% | -2.12% | -1.95% | 24.68% | 6.62% | -10.42% | -4.35% | 18.03% | 2.21% | 0.54% | 6.45% | 21.72% | 47.38% | 14.37% | 13.55% | 15.78% | 8.18% | -7.40% | 2.92% |
| EPS | $-21.00 | $0.64 | $-0.48 | $-0.40 | $5.08 | $1.44 | $-2.24 | $-0.88 | $4.16 | $0.56 | $0.11 | $1.08 | $2.32 | $7.00 | $2.00 | $1.48 | $1.44 | $0.80 | $-0.44 | $0.26 |
| EPS Diluted | $-20.48 | $0.64 | $-0.48 | $-0.40 | $5.04 | $1.44 | $-2.24 | $-0.88 | $4.12 | $0.56 | $0.11 | $1.08 | $2.32 | $7.00 | $2.00 | $1.48 | $1.44 | $0.80 | $-0.44 | $0.26 |
| Weighted Average Shares Outstanding | 453.89M | 466.29M | 465.37M | 466.43M | 466.89M | 466.80M | 466.66M | 466.66M | 467.28M | 467.15M | 467.15M | 467.15M | 467.15M | 466.72M | 466.72M | 433.37M | 433.37M | 384.86M | 389.76M | 390.13M |
| Weighted Average Shares Outstanding Diluted | 465.71M | 466.29M | 465.37M | 466.43M | 467.57M | 466.80M | 466.66M | 466.66M | 468.64M | 468.37M | 468.77M | 468.71M | 468.71M | 467.47M | 467.52M | 434.12M | 434.12M | 385.15M | 390.41M | 391.43M |
| SEC Filing | Source | Source | Source | Source | Source | Source | Source | Source | Source | Source | Source | Source | Source | Source | Source | Source | Source | Source | Source | Source |
Annual Balance Sheet
| Breakdown | December 31, 2024 | December 31, 2023 | December 31, 2022 | December 31, 2021 | December 31, 2020 |
|---|---|---|---|---|---|
| Cash and Cash Equivalents | $16.90B | $14.66B | $13.30B | $16.17B | $13.64B |
| Short Term Investments | $3.27B | $3.62B | $2.66B | $4.86B | $3.98B |
| Cash and Short Term Investments | $20.18B | $18.27B | $15.96B | $21.04B | $17.62B |
| Net Receivables | $3.88B | $5.47B | $6.05B | $4.56B | $1.63B |
| Inventory | $2.07B | $1.79B | $1.87B | $1.15B | $935.26M |
| Other Current Assets | $4.64B | $3.07B | $1.93B | $543.54M | $3.25B |
| Total Current Assets | $30.77B | $28.61B | $25.58B | $27.29B | $23.43B |
| Property Plant Equipment Net | $32.98B | $30.75B | $26.96B | $24.60B | $21.98B |
| Goodwill | $1.59B | $1.39B | $1.46B | $1.13B | $1.09B |
| Intangible Assets | $24.75B | $21.26B | $20.66B | $16.65B | $16.22B |
| Goodwill and Intangible Assets | $26.33B | $22.65B | $22.12B | $17.78B | $17.31B |
| Long Term Investments | $21.34B | $29.79B | $34.01B | $12.12B | $8.37B |
| Tax Assets | $- | $5.61B | $4.47B | $3.05B | $1.90B |
| Other Non-Current Assets | $29.85B | $28.06B | $21.34B | $13.00B | $10.71B |
| Total Non-Current Assets | $110.49B | $111.26B | $108.91B | $70.55B | $60.28B |
| Other Assets | $- | $- | $- | $- | $- |
| Total Assets | $141.27B | $139.87B | $134.48B | $97.84B | $83.71B |
| Account Payables | $5.17B | $3.92B | $4.32B | $3.25B | $2.63B |
| Short Term Debt | $5.41B | $5.62B | $5.09B | $4.65B | $5.46B |
| Tax Payables | $- | $1.12B | $964.43M | $607.44M | $803.45M |
| Deferred Revenue | $- | $- | $- | $- | $- |
| Other Current Liabilities | $7.33B | $5.50B | $5.42B | $4.45B | $3.65B |
| Total Current Liabilities | $17.91B | $16.16B | $15.80B | $12.96B | $12.55B |
| Long Term Debt | $67.55B | $56.56B | $51.43B | $44.28B | $39.79B |
| Deferred Revenue Non-Current | $- | $19.13M | $624.80M | $36.44M | $43.00M |
| Deferred Tax Liabilities Non-Current | $- | $5.23B | $5.47B | $3.82B | $3.69B |
| Other Non-Current Liabilities | $16.40B | $10.92B | $13.00B | $7.88B | $6.82B |
| Total Non-Current Liabilities | $83.95B | $72.73B | $70.52B | $56.01B | $50.35B |
| Other Liabilities | $- | $- | $- | $- | $- |
| Total Liabilities | $101.87B | $88.88B | $86.32B | $68.97B | $62.89B |
| Preferred Stock | $- | $- | $- | $- | $- |
| Common Stock | $8.83B | $8.68B | $8.40B | $6.37B | $5.33M |
| Retained Earnings | $- | $9.49B | $9.47B | $10.66B | $4.77B |
| Accumulated Other Comprehensive Income Loss | $565.85M | $314.32M | $567.55M | $-521.61M | $-1.52B |
| Other Total Stockholders Equity | $1.51B | $2.47B | $2.21B | $-1.76B | $2.01B |
| Total Stockholders Equity | $10.90B | $20.96B | $20.65B | $14.74B | $5.26B |
| Total Equity | $39.40B | $50.98B | $48.17B | $28.87B | $20.82B |
| Total Liabilities and Stockholders Equity | $141.27B | $139.87B | $134.48B | $97.84B | $83.71B |
| Minority Interest | $28.49B | $30.03B | $27.52B | $14.13B | $15.56B |
| Total Liabilities and Total Equity | $141.27B | $139.87B | $134.48B | $97.84B | $83.71B |
| Total Investments | $24.61B | $33.41B | $36.67B | $16.98B | $12.35B |
| Total Debt | $72.97B | $62.18B | $56.52B | $48.93B | $45.25B |
| Net Debt | $56.06B | $47.52B | $43.22B | $32.75B | $31.61B |
Balance Sheet Charts
| Breakdown | December 31, 2024 | September 30, 2024 | June 30, 2024 | March 31, 2024 | December 31, 2023 | September 30, 2023 | June 30, 2023 | March 31, 2023 | December 31, 2022 | September 30, 2022 | June 30, 2022 | March 31, 2022 | December 31, 2021 | September 30, 2021 | June 30, 2021 | March 31, 2021 | December 31, 2020 | September 30, 2020 | June 30, 2020 | March 31, 2020 |
|---|---|---|---|---|---|---|---|---|---|---|---|---|---|---|---|---|---|---|---|---|
| Cash and Cash Equivalents | $16.90B | $14.63B | $17.24B | $16.40B | $14.66B | $15.08B | $15.74B | $11.39B | $13.30B | $15.49B | $12.68B | $12.08B | $16.17B | $15.63B | $8.57B | $7.93B | $13.64B | $4.85B | $4.73B | $3.34B |
| Short Term Investments | $3.27B | $4.90B | $3.86B | $4.19B | $3.62B | $4.63B | $3.69B | $3.48B | $2.66B | $9.44B | $4.40B | $4.80B | $4.86B | $4.45B | $3.89B | $3.99B | $3.98B | $3.42B | $3.34B | $2.43B |
| Cash and Short Term Investments | $20.18B | $19.53B | $21.10B | $20.59B | $18.27B | $19.71B | $19.43B | $14.87B | $15.96B | $24.92B | $17.08B | $16.88B | $21.04B | $20.07B | $12.46B | $11.92B | $17.62B | $8.26B | $8.07B | $5.77B |
| Net Receivables | $3.88B | $4.12B | $6.44B | $5.94B | $5.47B | $5.35B | $5.90B | $6.00B | $6.05B | $6.61B | $6.28B | $5.58B | $4.56B | $4.85B | $4.57B | $3.42B | $1.63B | $2.42B | $2.26B | $2.55B |
| Inventory | $2.07B | $2.23B | $2.15B | $1.95B | $1.79B | $1.87B | $1.77B | $1.92B | $1.87B | $1.86B | $1.69B | $1.05B | $1.15B | $1.22B | $1.08B | $961.98M | $935.26M | $625.81M | $590.20M | $609.06M |
| Other Current Assets | $4.64B | $5.65B | $3.88B | $3.42B | $3.07B | $1.31B | $1.13B | $1.33B | $1.70B | $2.27B | $922.14M | $1.15B | $543.54M | $1.26B | $1.25B | $1.03B | $3.25B | $1.60B | $1.54B | $541.26M |
| Total Current Assets | $30.77B | $31.53B | $33.56B | $31.65B | $28.61B | $28.13B | $28.01B | $23.91B | $25.58B | $35.27B | $25.97B | $24.19B | $27.29B | $26.94B | $19.13B | $17.08B | $23.43B | $11.74B | $11.37B | $9.47B |
| Property Plant Equipment Net | $32.98B | $23.92B | $22.78B | $22.84B | $22.41B | $29.96B | $27.66B | $27.33B | $26.96B | $26.47B | $26.26B | $25.30B | $24.60B | $23.76B | $23.28B | $22.57B | $21.98B | $492.17M | $501.18M | $475.19M |
| Goodwill | $1.59B | $1.49B | $1.49B | $1.41B | $1.39B | $1.41B | $1.39B | $1.42B | $1.46B | $1.82B | $1.91B | $1.49B | $1.13B | $1.12B | $1.08B | $1.12B | $1.09B | $991.33M | $957.78M | $944.64M |
| Intangible Assets | $24.75B | $31.87B | $21.61B | $29.77B | $29.60B | $21.02B | $20.98B | $20.99B | $20.66B | $20.01B | $20.54B | $19.31B | $16.65B | $16.60B | $16.48B | $16.38B | $16.22B | $8.88B | $8.78B | $8.72B |
| Goodwill and Intangible Assets | $26.33B | $33.35B | $23.10B | $31.18B | $30.99B | $22.43B | $22.37B | $22.42B | $22.12B | $21.83B | $22.45B | $20.80B | $17.78B | $17.73B | $17.57B | $17.50B | $17.31B | $9.87B | $9.74B | $9.66B |
| Long Term Investments | $21.34B | $27.32B | $48.02B | $29.21B | $29.79B | $29.85B | $29.21B | $32.61B | $34.01B | $14.99B | $12.54B | $12.17B | $12.12B | $10.63B | $7.70B | $8.53B | $8.37B | $7.98B | $7.93B | $8.34B |
| Tax Assets | $- | $6.67B | $6.67B | $6.00B | $5.61B | $5.68B | $5.59B | $4.61B | $4.47B | $4.14B | $3.70B | $3.02B | $3.05B | $2.49B | $2.35B | $2.15B | $1.90B | $610.94M | $469.09M | $408.90M |
| Other Non-Current Assets | $29.85B | $22.03B | $9.22B | $22.10B | $22.45B | $21.81B | $22.20B | $21.08B | $21.34B | $10.57B | $10.62B | $10.53B | $13.00B | $9.33B | $8.94B | $9.13B | $10.71B | $5.40B | $5.28B | $4.82B |
| Total Non-Current Assets | $110.49B | $113.30B | $109.79B | $111.33B | $111.26B | $109.72B | $107.03B | $108.05B | $108.91B | $78.01B | $75.56B | $71.81B | $70.55B | $63.94B | $59.85B | $59.87B | $60.28B | $24.36B | $23.92B | $23.71B |
| Other Assets | $- | $- | $- | $- | $- | $- | $- | $- | $- | $- | $- | $- | $- | $- | $- | $- | $- | $- | $- | $- |
| Total Assets | $141.27B | $144.83B | $143.35B | $142.98B | $139.87B | $137.85B | $135.04B | $131.95B | $134.48B | $113.28B | $101.53B | $96.01B | $97.84B | $90.88B | $78.97B | $76.96B | $83.71B | $36.10B | $35.29B | $33.18B |
| Account Payables | $5.17B | $4.51B | $4.44B | $3.67B | $3.92B | $3.61B | $3.66B | $3.78B | $4.32B | $4.38B | $3.90B | $3.14B | $3.25B | $3.04B | $3.03B | $2.31B | $2.63B | $1.69B | $1.80B | $1.82B |
| Short Term Debt | $5.41B | $5.47B | $7.52B | $7.05B | $5.62B | $6.37B | $5.17B | $5.11B | $5.09B | $12.12B | $4.01B | $4.25B | $4.65B | $2.46B | $2.58B | $2.95B | $5.46B | $2.59B | $2.54B | $1.14B |
| Tax Payables | $- | $1.10B | $1.30B | $1.11B | $1.12B | $2.57B | $2.36B | $2.17B | $964.43M | $781.87M | $866.30M | $591.80M | $607.44M | $777.14M | $928.36M | $516.09M | $803.45M | $833.68M | $574.20M | $513.07M |
| Deferred Revenue | $- | $- | $- | $- | $- | $5.38M | $719.10M | $- | $- | $- | $- | $- | $- | $- | $- | $- | $- | $- | $- | $- |
| Other Current Liabilities | $7.33B | $5.89B | $5.49B | $5.85B | $5.50B | $4.80B | $5.03B | $5.89B | $5.42B | $6.11B | $4.40B | $4.85B | $4.45B | $2.95B | $3.28B | $2.15B | $3.65B | $928.10M | $853.69M | $1.33B |
| Total Current Liabilities | $17.91B | $16.97B | $18.75B | $17.67B | $16.16B | $17.36B | $16.94B | $16.94B | $15.80B | $23.39B | $13.17B | $12.83B | $12.96B | $9.22B | $9.82B | $7.93B | $12.55B | $6.03B | $5.77B | $4.81B |
| Long Term Debt | $67.55B | $62.75B | $61.17B | $58.74B | $56.56B | $55.89B | $55.10B | $50.95B | $51.43B | $43.16B | $43.83B | $39.10B | $44.28B | $44.56B | $36.15B | $37.11B | $39.79B | $13.98B | $14.15B | $13.09B |
| Deferred Revenue Non-Current | $- | $17.22M | $17.86M | $18.49M | $19.13M | $28.17M | $29.50M | $30.85M | $624.80M | $626.29M | $112.88M | $113.07M | $36.44M | $37.79M | $39.14M | $40.39M | $43.00M | $- | $- | $- |
| Deferred Tax Liabilities Non-Current | $- | $5.96B | $5.25B | $5.29B | $5.23B | $5.25B | $5.29B | $5.23B | $5.47B | $4.84B | $4.76B | $4.74B | $3.82B | $3.61B | $3.55B | $3.68B | $3.69B | $1.25B | $1.28B | $1.33B |
| Other Non-Current Liabilities | $16.40B | $9.89B | $9.91B | $10.34B | $10.92B | $11.66B | $11.83B | $11.32B | $13.00B | $8.83B | $9.01B | $8.67B | $7.88B | $7.20B | $7.31B | $6.56B | $6.82B | $3.52B | $3.00B | $2.52B |
| Total Non-Current Liabilities | $83.95B | $78.62B | $76.34B | $74.39B | $72.73B | $72.83B | $72.25B | $67.52B | $70.52B | $57.46B | $57.71B | $52.62B | $56.01B | $55.42B | $47.05B | $47.39B | $50.35B | $18.75B | $18.42B | $16.95B |
| Other Liabilities | $- | $- | $- | $- | $- | $- | $- | $- | $- | $- | $- | $- | $- | $- | $- | $- | $- | $- | $- | $- |
| Total Liabilities | $101.87B | $95.59B | $95.09B | $92.06B | $88.88B | $90.19B | $89.18B | $84.46B | $86.32B | $80.84B | $70.88B | $65.45B | $68.97B | $64.64B | $56.87B | $55.32B | $62.89B | $24.78B | $24.19B | $21.76B |
| Preferred Stock | $- | $- | $- | $- | $- | $- | $- | $- | $- | $- | $- | $- | $- | $- | $- | $- | $- | $- | $- | $- |
| Common Stock | $8.83B | $8.83B | $8.83B | $8.68B | $8.68B | $8.68B | $8.68B | $8.40B | $8.40B | $8.40B | $8.40B | $6.37B | $6.37B | $6.37B | $6.37B | $6.37B | $5.33M | $5.73B | $5.05B | $5.05B |
| Retained Earnings | $- | $8.65B | $8.77B | $9.30B | $9.49B | $7.40B | $6.72B | $8.57B | $9.47B | $8.76B | $8.96B | $11.17B | $10.66B | $10.83B | $7.57B | $7.04B | $4.77B | $231.70M | $-72.14M | $102.25M |
| Accumulated Other Comprehensive Income Loss | $565.85M | $76.32M | $-85.21M | $359.24M | $314.32M | $-74.92M | $166.02M | $384.12M | $567.55M | $527.12M | $35.49M | $-141.59M | $-521.61M | $-888.38M | $-554.87M | $-263.32M | $-1.52B | $5.30B | $6.00B | $6.02B |
| Other Total Stockholders Equity | $1.51B | $2.37B | $2.26B | $2.34B | $2.47B | $2.47B | $2.36B | $2.25B | $2.21B | $-1.72B | $-1.72B | $-1.74B | $-1.76B | $-2.15B | $-3.06B | $-3.07B | $2.01B | $-604.12M | $-502.51M | $-344.12M |
| Total Stockholders Equity | $10.90B | $19.92B | $19.78B | $20.68B | $20.96B | $18.48B | $17.93B | $19.60B | $20.65B | $15.97B | $15.68B | $15.65B | $14.74B | $14.16B | $10.32B | $10.07B | $5.26B | $10.66B | $10.47B | $10.82B |
| Total Equity | $39.40B | $49.24B | $48.26B | $50.92B | $50.98B | $47.66B | $45.85B | $47.49B | $48.17B | $32.43B | $30.65B | $30.56B | $28.87B | $26.24B | $22.10B | $21.64B | $20.82B | $11.32B | $11.09B | $11.43B |
| Total Liabilities and Stockholders Equity | $141.27B | $144.83B | $143.35B | $142.98B | $139.87B | $137.85B | $135.04B | $131.95B | $134.48B | $113.28B | $101.53B | $96.01B | $97.84B | $90.88B | $78.97B | $76.96B | $83.71B | $36.10B | $35.29B | $33.18B |
| Minority Interest | $28.49B | $29.31B | $28.47B | $30.24B | $30.03B | $29.18B | $27.93B | $27.89B | $27.52B | $16.47B | $14.97B | $14.91B | $14.13B | $12.07B | $11.79B | $11.57B | $15.56B | $661.01M | $621.19M | $605.09M |
| Total Liabilities and Total Equity | $141.27B | $144.83B | $143.35B | $142.98B | $139.87B | $137.85B | $135.04B | $131.95B | $134.48B | $113.28B | $101.53B | $96.01B | $97.84B | $90.88B | $78.97B | $76.96B | $83.71B | $36.10B | $35.29B | $33.18B |
| Total Investments | $24.61B | $32.23B | $31.91B | $33.40B | $33.41B | $34.48B | $32.90B | $36.09B | $36.67B | $24.43B | $16.94B | $16.96B | $16.98B | $15.08B | $11.59B | $12.52B | $12.35B | $11.40B | $11.27B | $10.77B |
| Total Debt | $72.97B | $68.22B | $68.69B | $65.79B | $62.18B | $62.26B | $60.24B | $56.06B | $56.52B | $55.28B | $47.83B | $43.35B | $48.93B | $47.02B | $38.73B | $39.66B | $45.25B | $16.56B | $16.24B | $13.61B |
| Net Debt | $56.06B | $53.59B | $51.46B | $49.39B | $47.52B | $47.18B | $44.50B | $44.67B | $43.22B | $39.79B | $35.15B | $31.27B | $32.75B | $31.39B | $30.16B | $31.73B | $31.61B | $11.72B | $11.51B | $10.28B |
Annual Cash Flow
| Breakdown | December 31, 2024 | December 31, 2023 | December 31, 2022 | December 31, 2021 | December 31, 2020 |
|---|---|---|---|---|---|
| Net Income | $-9.42B | $5.11B | $2.70B | $5.90B | $1.17B |
| Depreciation and Amortization | $3.98B | $3.36B | $3.01B | $2.22B | $623.08M |
| Deferred Income Tax | $- | $-33.38M | $-110.54M | $-648.32M | $-29.82M |
| Stock Based Compensation | $65.90M | $207.71M | $99.09M | $53.13M | $272.69M |
| Change in Working Capital | $-985.09M | $-2.45B | $382.49M | $-1.05B | $-1.03B |
| Accounts Receivables | $546.22M | $839.88M | $-6.33M | $-315.61M | $54.11M |
| Inventory | $159.67M | $-83.17M | $-423.43M | $-243.62M | $-113.07M |
| Accounts Payables | $- | $-252.81M | $510.62M | $679.77M | $50.86M |
| Other Working Capital | $-1.69B | $-2.95B | $301.63M | $-1.17B | $-1.03B |
| Other Non Cash Items | $19.44B | $4.07B | $3.88B | $-1.25B | $1.40B |
| Net Cash Provided by Operating Activities | $13.08B | $10.28B | $9.97B | $5.22B | $2.14B |
| Investments in Property Plant and Equipment | $-7.83B | $-6.27B | $-4.53B | $-4.07B | $-1.05B |
| Acquisitions Net | $-962.38M | $-650.84M | $-5.39B | $7.12B | $-147.07M |
| Purchases of Investments | $- | $-672.06M | $-14.10B | $-14.17M | $-1.15B |
| Sales Maturities of Investments | $- | $814.08M | $1.97B | $1.11B | $11.12M |
| Other Investing Activities | $4.31B | $2.47B | $1.45B | $861.41M | $-194.00K |
| Net Cash Used for Investing Activities | $-4.49B | $-4.30B | $-20.61B | $5.01B | $-2.34B |
| Debt Repayment | $4.10B | $4.24B | $8.21B | $2.16B | $1.51B |
| Common Stock Issued | $- | $- | $2.37M | $69.16M | $65.48M |
| Common Stock Repurchased | $-397.88M | $-103.28M | $-84.59M | $-34.53M | $-485.04M |
| Dividends Paid | $-3.45B | $-2.58B | $-1.91B | $-1.84B | $-765.00M |
| Other Financing Activities | $-6.86B | $-6.07B | $1.93B | $685.23M | $-1.86B |
| Net Cash Used Provided by Financing Activities | $-6.61B | $-4.52B | $8.17B | $1.05B | $-1.54B |
| Effect of Forex Changes on Cash | $258.63M | $-100.00M | $-404.34M | $283.67M | $272.53M |
| Net Change in Cash | $2.25B | $1.36B | $-2.87B | $11.56B | $-1.46B |
| Cash at End of Period | $16.90B | $14.66B | $13.30B | $16.17B | $4.61B |
| Cash at Beginning of Period | $14.66B | $13.30B | $16.17B | $4.61B | $6.08B |
| Operating Cash Flow | $13.08B | $10.28B | $9.97B | $5.22B | $2.14B |
| Capital Expenditure | $-7.83B | $-6.27B | $-4.53B | $-4.07B | $-1.05B |
| Free Cash Flow | $5.25B | $4.01B | $5.44B | $1.16B | $1.09B |
Cash Flow Charts
| Breakdown | December 31, 2024 | September 30, 2024 | June 30, 2024 | March 31, 2024 | December 31, 2023 | September 30, 2023 | June 30, 2023 | March 31, 2023 | December 31, 2022 | September 30, 2022 | June 30, 2022 | March 31, 2022 | December 31, 2021 | September 30, 2021 | June 30, 2021 | March 31, 2021 | December 31, 2020 | September 30, 2020 | June 30, 2020 | March 31, 2020 |
|---|---|---|---|---|---|---|---|---|---|---|---|---|---|---|---|---|---|---|---|---|
| Net Income | $-9.30B | $1.50B | $-1.08B | $-192.18M | $2.32B | $2.23B | $-913.22M | $385.45M | $2.14B | $3.72M | $-63.69M | $624.95M | $333.96M | $3.44B | $1.46B | $666.44M | $802.51M | $402.89M | $-141.26M | $102.53M |
| Depreciation and Amortization | $999.65M | $1.07B | $926.46M | $907.26M | $887.13M | $867.63M | $824.96M | $785.22M | $851.73M | $679.05M | $728.84M | $754.86M | $657.01M | $637.00M | $616.22M | $311.31M | $162.03M | $168.39M | $149.15M | $143.52M |
| Deferred Income Tax | $- | $-7.00K | $- | $- | $-24.28M | $-4.88M | $-365.41M | $-4.22M | $-36.21M | $- | $-45.56M | $-28.77M | $2.37M | $-40.72M | $-609.96M | $- | $-22.82M | $-212.83M | $328.34M | $-162.60M |
| Stock Based Compensation | $- | $174.05M | $33.70M | $47.56M | $56.54M | $68.00M | $43.46M | $39.72M | $28.63M | $19.46M | $25.26M | $25.73M | $22.23M | $7.72M | $14.29M | $6.18M | $3.59M | $896.00K | $5.92M | $3.15M |
| Change in Working Capital | $504.41M | $-800.07M | $-350.34M | $-1.50B | $-802.14M | $-458.57M | $-31.71M | $-1.16B | $1.06B | $392.79M | $-78.38M | $-990.24M | $-147.04M | $-504.72M | $-190.09M | $-416.26M | $-172.31M | $-276.36M | $248.42M | $-833.52M |
| Accounts Receivables | $860.02M | $340.67M | $-35.37M | $-475.66M | $147.94M | $62.38M | $237.51M | $-100.24M | $1.04B | $22.54M | $-587.46M | $-477.80M | $167.37M | $-210.53M | $-227.44M | $-45.01M | $-110.21M | $-91.60M | $288.90M | $-32.98M |
| Inventory | $278.85M | $-36.95M | $43.36M | $-125.60M | $9.82M | $-118.64M | $113.40M | $-87.75M | $-179.65M | $-125.59M | $-175.89M | $57.69M | $25.23M | $-127.17M | $-134.85M | $-6.83M | $-74.63M | $-30.16M | $21.77M | $-30.05M |
| Accounts Payables | $- | $-202.06M | $278.89M | $-156.76M | $107.48M | $-44.59M | $8.32M | $-324.02M | $-284.41M | $391.35M | $557.79M | $-154.11M | $20.08M | $47.53M | $764.68M | $-152.51M | $235.65M | $-136.54M | $-54.69M | $6.44M |
| Other Working Capital | $-634.47M | $-901.73M | $-637.22M | $-738.18M | $-1.07B | $-357.73M | $-390.95M | $-646.16M | $485.97M | $104.49M | $127.18M | $-416.02M | $-359.71M | $-214.56M | $-592.47M | $-211.91M | $-223.12M | $-18.06M | $-7.57M | $-776.92M |
| Other Non Cash Items | $11.50B | $1.32B | $3.45B | $5.17B | $942.01M | $664.96M | $3.55B | $1.77B | $-1.61B | $2.54B | $2.04B | $913.81M | $398.30M | $-2.34B | $31.13M | $281.25M | $-119.15M | $585.96M | $267.75M | $708.65M |
| Net Cash Provided by Operating Activities | $3.70B | $3.26B | $2.98B | $1.82B | $1.84B | $3.36B | $3.11B | $1.82B | $2.43B | $3.64B | $2.60B | $1.30B | $1.27B | $1.20B | $1.92B | $842.74M | $653.84M | $668.94M | $858.31M | $-38.27M |
| Investments in Property Plant and Equipment | $-2.65B | $-1.98B | $-1.67B | $-1.54B | $-1.84B | $-1.53B | $-1.40B | $-1.51B | $-1.28B | $-1.08B | $-1.10B | $-1.08B | $-1.18B | $-1.10B | $-1.32B | $-467.80M | $-278.17M | $-267.21M | $-248.47M | $-258.64M |
| Acquisitions Net | $-614.74M | $-334.59M | $2.08B | $-4.34M | $-618.95M | $-47.30M | $-40.28M | $-20.93M | $-219.00M | $-1.52B | $-2.43B | $-1.23B | $-920.84M | $-87.94M | $8.13B | $1.57B | $-11.00K | $-33.09M | $-22.59M | $-91.39M |
| Purchases of Investments | $- | $-794.20M | $201.02M | $-444.10M | $1.15B | $-1.03B | $-96.09M | $-755.87M | $-10.89B | $-3.17B | $-18.11M | $-33.81M | $-14.17M | $- | $- | $- | $-1.09M | $-288.62M | $-413.18M | $-449.20M |
| Sales Maturities of Investments | $- | $103.02M | $35.27M | $5.51M | $814.08M | $721.77M | $40.28M | $21.40M | $1.24B | $121.81M | $479.11M | $125.32M | $-294.82M | $-291.54M | $1.72B | $1.57B | $- | $- | $- | $- |
| Other Investing Activities | $1.89B | $356.64M | $-70.44M | $-115.00K | $21.75M | $-149.91M | $123.94M | $830.48M | $1.01B | $-196.79M | $121.97M | $517.46M | $214.51M | $-147.17M | $-7.84B | $8.15B | $5.24M | $2.40M | $3.27M | $-450.34M |
| Net Cash Used for Investing Activities | $-1.37B | $-2.65B | $569.76M | $-1.98B | $-465.00M | $-2.03B | $-1.37B | $-1.41B | $-10.14B | $-5.84B | $-2.94B | $-1.69B | $-1.89B | $-1.33B | $-1.04B | $9.26B | $-274.03M | $-586.51M | $-680.96M | $-799.23M |
| Debt Repayment | $2.16B | $-834.86M | $-259.26M | $3.04B | $-190.51M | $-339.73M | $5.07B | $-218.69M | $413.23M | $7.14B | $2.64B | $-1.98B | $731.63M | $7.02B | $797.99M | $-6.39B | $-388.61M | $3.36M | $1.94B | $-1.88B |
| Common Stock Issued | $- | $- | $- | $- | $- | $- | $-12.25M | $21.96M | $- | $- | $20.00M | $- | $- | $1.62B | $334.00K | $- | $- | $- | $- | $- |
| Common Stock Repurchased | $-377.36M | $-20.33M | $-73.35M | $-91.33M | $-103.28M | $- | $12.25M | $-21.96M | $-59.51M | $- | $- | $-25.08M | $8.43M | $-963.00K | $- | $-34.53M | $-166.21M | $- | $-28.06M | $-290.77M |
| Dividends Paid | $-660.79M | $-580.92M | $-2.11B | $-93.85M | $-954.73M | $-168.37M | $-1.69B | $-102.71M | $-983.92M | $-71.78M | $-852.46M | $- | $-827.50M | $-288.04M | $-722.63M | $-3.32M | $-14.91M | $- | $-748.88M | $-1.21M |
| Other Financing Activities | $-1.31B | $-1.75B | $-378.85M | $-1.00B | $-510.13M | $-1.60B | $-930.58M | $-1.98B | $6.14B | $-1.97B | $-777.21M | $-1.36B | $-497.71M | $298.29M | $-163.03M | $-505.47M | $44.31M | $-14.56M | $-19.58M | $22.06M |
| Net Cash Used Provided by Financing Activities | $-194.95M | $-3.19B | $-2.82B | $1.85B | $-1.76B | $-2.02B | $2.70B | $-2.30B | $5.53B | $5.11B | $892.29M | $-3.36B | $1.04B | $7.03B | $-87.67M | $-6.93B | $-525.43M | $-11.20M | $1.15B | $-2.15B |
| Effect of Forex Changes on Cash | $137.00M | $-29.34M | $105.45M | $45.52M | $-34.27M | $33.15M | $-79.37M | $-19.52M | $-10.15M | $-99.70M | $40.42M | $-334.91M | $127.35M | $161.16M | $-157.59M | $152.74M | $-85.48M | $44.02M | $66.59M | $247.39M |
| Net Change in Cash | $2.28B | $-2.60B | $831.97M | $1.74B | $-422.52M | $-657.92M | $4.35B | $-1.92B | $-2.19B | $2.81B | $596.30M | $-4.09B | $545.93M | $7.06B | $634.28M | $3.32B | $-231.10M | $115.25M | $1.39B | $-2.74B |
| Cash at End of Period | $16.90B | $14.63B | $17.24B | $16.41B | $14.67B | $15.08B | $15.74B | $11.39B | $13.30B | $15.49B | $12.68B | $12.08B | $16.17B | $15.63B | $8.57B | $7.93B | $4.61B | $4.85B | $4.73B | $3.34B |
| Cash at Beginning of Period | $14.63B | $17.23B | $16.41B | $14.67B | $15.09B | $15.74B | $11.39B | $13.30B | $15.49B | $12.68B | $12.08B | $16.17B | $15.63B | $8.57B | $7.93B | $4.61B | $4.85B | $4.73B | $3.34B | $6.08B |
| Operating Cash Flow | $3.70B | $3.26B | $2.98B | $1.82B | $1.84B | $3.36B | $3.11B | $1.82B | $2.43B | $3.64B | $2.60B | $1.30B | $1.27B | $1.20B | $1.92B | $842.74M | $653.84M | $668.94M | $858.31M | $-38.27M |
| Capital Expenditure | $-2.65B | $-1.98B | $-1.67B | $-1.54B | $-1.84B | $-1.53B | $-1.40B | $-1.51B | $-1.28B | $-1.08B | $-1.10B | $-1.08B | $-1.18B | $-1.10B | $-1.32B | $-467.80M | $-278.17M | $-267.21M | $-248.47M | $-258.64M |
| Free Cash Flow | $1.06B | $1.28B | $1.31B | $284.38M | $-1.38M | $1.84B | $1.71B | $308.88M | $1.15B | $2.56B | $1.51B | $224.73M | $87.75M | $101.13M | $591.43M | $374.94M | $375.67M | $401.72M | $609.84M | $-296.92M |
Cosan S.A Dividends
Explore Cosan S.A's dividend history, including dividend yield, payout ratio, and historical payments.
Dividend Yield
5.53%
Dividend Payout Ratio
-8.92%
Dividend Paid & Capex Coverage Ratio
1.51x
Cosan S.A Dividend History
| Dividend | Adjusted Dividend | Date | Record Date | Payment Date | Declaration Date |
|---|---|---|---|---|---|
| $0.3469 | $0.3469 | June 10, 2024 | June 10, 2024 | July 08, 2024 | May 30, 2024 |
| $0.34459 | $0.34459 | May 19, 2023 | May 22, 2023 | June 07, 2023 | April 28, 2023 |
| $0.334 | $0.344 | May 09, 2022 | May 10, 2022 | May 27, 2022 | April 29, 2022 |
| $0.264 | $0.26413 | December 16, 2021 | December 17, 2021 | January 04, 2022 | December 07, 2021 |
| $0.1762 | $0.191 | May 12, 2021 | May 13, 2021 | May 27, 2021 | May 03, 2021 |
Cosan S.A News
Read the latest news about Cosan S.A, including recent articles, headlines, and updates.
Cosan S.A. (CSAN) Q4 2024 Earnings Call Transcript
Cosan S.A. (NYSE:CSAN ) Q4 2024 Earnings Conference Call February 27, 2025 11:00 AM ET Company Participants Nelson Gomes - Chief Executive Officer of Raízen Marcelo Martins - Chief Executive Officer Rodrigo Araujo - Chief Financial, Investor Relations Fernando Tinel - Head of IR & ESG Conference Call Participants Isabella Simonato - Bank of America Gabriel Barra - Citi. Thiago Duarte - BTG Pactual Victor Modanese - UBS Regis Cardoso - XP Operator Good afternoon everyone.

Cosan: I Was Wrong
Brazil faced economic deterioration in 2024, with rising interest rates and challenges that have impacted Cosan's valuation. Moove's failed IPO and Vale's misallocation of capital have damaged market confidence. Cosan has revamped its board and sold off Vale shares, finally addressing its leverage issues.

Cosan S.A. (CSAN) Q3 2024 Earnings Call Transcript
Cosan S.A. (NYSE:CSAN ) Q3 2024 Earnings Conference Call November 14, 2024 8:00 AM ET Company Participants Nelson Gomes - Chief Executive Officer of Raízen Marcelo Martins - Chief Executive Officer Rodrigo Araujo - Chief Financial, Investor Relations Fernando Tinel - Head of IR & ESG Conference Call Participants Isabella Simonato - BofA Merrill Lynch Thiago Duarte - BTG Matheus Enfeldt - UBS Monique Greco - Itaú Bruno Amorim - Goldman Sachs Vicente Falanga - Bradesco Regis Cardoso - XP Operator Good morning, everyone, and thank you for waiting. Welcome to Cosan's Third Quarter 2024 Earnings Conference Call.

Cosan Q2: This IPO Can Unlock Value
Rumo and Compass showed strong pricing power and earnings growth, while Moove's potential IPO could unlock significant value and aid in deleveraging. Cosan's net loss was largely due to non-recurring events, and the company is on a slow but positive deleveraging trend. The attractive valuation, combined with promising subsidiaries and the potential Moove IPO, makes Cosan a compelling buy.

Weak Ethanol And Sugar Prices And Core Operating Structure Impacted Cosan
Q2 results from Cosan showed okay performance, with healthy volumes in sugar and ethanol offsetting weaker realized prices, and strong results from Rumo. Core SEE prices have become more challenging, impacting revenue and EBITDA for Cosan. The sugar market appears roughly in balance now, and legislation in Brazil could drive increased ethanol consumption. Complexity and lack of transparency in Cosan's structure, reporting, and capital allocation priorities are real issues and may reasonably deter investors despite potential undervaluation.
Cosan S.A. (CSAN) Q2 2024 Earnings Call Transcript
Cosan S.A. (NYSE:CSAN ) Q2 2024 Earnings Conference Call August 15, 2024 10:00 AM ET Company Participants Rodrigo Araujo - CFO Ana Luisa Perina - Head, IR Conference Call Participants Luiz Carvalho - UBS Gabriel Barra - Citi Monique Greco - Itau BBA Bruno Montanari - Morgan Stanley Bruno Amorim - Goldman Sachs Lucas Ferreira - JPMorgan Pedro Soares - BTG Pactual Gustavo Sadka - Bradesco Operator Good morning, everyone. Thank you for waiting, and welcome to Cosan's Second Quarter 2024 Earnings Release Video Conference Call.

Cosan S.A. (CSAN) Q1 2024 Earnings Call Transcript
Cosan S.A. (NYSE:CSAN ) Q1 2024 Results Conference Call May 29, 2024 10:00 AM ET Company Participants Rodrigo Araujo - CFO Ana Luisa Perina - Head of IR Conference Call Participants Luiz Carvalho - UBS Ana Luísa Perina - Head of IR Isabella Simonato - Bank of America Gabriel Barra - Citi Regis Cardoso - XP Vicente Falanga - Bradesco BBI Bruno Montanari - Morgan Stanley Thiago Duarte - BTG Pactual Operator Good morning, everyone. Thank you for waiting.

Cosan: A Promising Player In Brazil's Energy Transition
Brazil has enormous potential to be the leading nation in the energy transition with decarbonized products. In this sense, Cosan stands out as having the most significant energy transition projects. Despite its promising and diversified business, the company is extremely discounted compared to national and international peers and when compared to its own history. With the end of the investment cycle approaching, the company should report better results and have a revaluation of multiples by the market.


Cosan: Deleveraging While Trading At A Substantial Holding Discount
Cosan, a Brazilian holding company, has experienced fluctuations in 2023 due to its diversified businesses tied to economic cycles of commodities. Despite a 9% growth in 2023, it lags behind the iShares MSCI Brazil ETF's performance. Cosan's investment thesis emphasizes moderate and continuous growth, resilience in challenging economic scenarios, and strategic capital allocation.
Cosan S.A. (CSAN) Q3 2023 Earnings Call Transcript
Cosan S.A. (NYSE:CSAN ) Q3 2023 Earnings Conference Call November 14, 2023 1:30 PM ET Company Participants Ricardo Lewin - Chief Financial & Investor Relations Officer Luis Henrique Guimarães - Chief Executive Officer Conference Call Participants Isabella Simonato - Bank of America Thiago Duarte - BTG André Vidal - XP Gabriel Barra - Citi Monique Greco - Itaú BBA Matheus Enfeldt - UBS Bruno Montanari - Morgan Stanley Operator Good afternoon, everyone. Thank you for waiting, and welcome to Cosan's Earnings Conference Call for the Third Quarter 2023.

Cosan: Long-Term Payoffs From Efficient Capital Allocation
Cosan is a Brazilian conglomerate operating in various sectors including agribusiness, fuel distribution, natural gas, and lubricants. Despite its complexity and history of mergers and acquisitions, Cosan maintains a consistent track record of financial results and efficient capital allocation across its portfolio of businesses. The company's key subsidiaries, such as Raízen, Rumo, Compass, and Moove, contribute to its overall performance, with growth and profitability varying by segment.


Cosan S.A. (CSAN) Q2 2023 Earnings Call Transcript
Cosan S.A. (NYSE:CSAN ) Q2 2023 Results Conference Call August 15, 2023 2:00 PM ET Company Participants Ricardo Lewin - CFO, IR Luis Guimaraes - CEO Marcelo Martins - CSO Conference Call Participants Gabriel Barra - Citi Luiz Carvalho - UBS Regis Cardoso - Credit Suisse Isabella Simonato - Bank of America Thiago Duarte - BTG Pactual Lucas Ferreira - JPMorgan Operator Good afternoon, everyone. Thank you for waiting.


Cosan S.A. (CSAN) Q1 2023 Earnings Call Transcript
Cosan S.A. (NYSE:CSAN ) Q1 2023 Results Conference Call May 16, 2023 9:00 AM ET Company Participants Luis Henrique - CEO Ricardo Lewin - CFO and IRO Conference Call Participants Pedro Soares - BTG Pactual Guilherme Palhares - Bank of America Luiz Carvalho - UBS Gabriel Barra - Citi Bruno Montanari - Morgan Stanley André Vidal - XP Investimentos Regis Cardoso - Credit Suisse Operator Good morning, everyone. Thank you for waiting.


Cosan: Volatility In SEE Markets Only Adds To The Complexity
Cosan has had to absorb weaker ethanol prices in Brazil and there is a growing risk of Brazilian sugar producers oversupplying the market in 2023, leading to weaker prices. Management's decision to acquire a sizable stake in Vale is consistent with past behavior, but the market didn't like the transaction.

Cosan S.A. (CSAN) Q3 2022 Earnings Call Transcript
Cosan S.A. (NYSE:CSAN ) Q3 2022 Earnings Conference Call November 14, 2022 4:00 PM ET Company Participants Luis Henrique Guimarães - Chief Executive Officer Ricardo Lewin - Chief Financial and Investor Relations Officer Conference Call Participants Thiago Duarte - BTG Pactual Bruno Montanari - Morgan Stanley Regis Cardoso - Credit Suisse Luiz Carvalho - UBS Operator Good afternoon, ladies and gentlemen, and thank you for waiting. Welcome to Cosan's Conference Call to discuss the results for the Third Quarter 2022.


Cosan Batted Around By Commodity And Macro Challenges, But The Core Investment Case Remains Solid
Despite volatility in ethanol prices, Cosan delivered a strong EBITDA beat in the second quarter and saw strong results from most businesses. The sugar/ethanol business is being impacted by weather and tax policies, but underlying demand is healthy.


Cosan S.A. (CSAN) CEO Luis Henrique Guimarães on Q1 2022 Results - Earnings Call Transcript
Cosan S.A. (NYSE:CSAN ) Q1 2022 Earnings Conference Call May 16, 2022 1:00 PM ET Company Participants Ricardo Lewin - CFO and IRO Luis Henrique Guimarães - CEO Ana Luisa Perina - Investor Relations Manager Conference Call Participants Isabella Simonato - Bank of America Merrill Lynch Christian Audi - Banco Santander Lucas Ferreira - JPMorgan Bruno Montanari - Morgan Stanley Gabriel Barra - Citigroup Operator Good afternoon, ladies and gentlemen, and thank you for waiting. Welcome to Cosan's Conference Call to discuss the results of the First Quarter of 2022.

5 'Magic Formula' Energy Stocks to Consider as Oil Prices Rise
Joel Greenblatt (Trades, Portfolio) introduced the investing world to the “Magic Formula” when he published his bestselling book, “The Little Book That Beats the Market,” in 2005. The idea behind the Magic Formula is to apply a simple mathematical formula to find profitable businesses that trade at bargain prices.


Similar Companies
Related Metrics
Explore detailed financial metrics and analysis for CSAN.