Constellium SE Key Executives
This section highlights Constellium SE's key executives, including their titles and compensation details.
Find Contacts at Constellium SE
(Showing 0 of )
Constellium SE Earnings
This section highlights Constellium SE's earnings, including key dates, EPS, earnings reports, and earnings call transcripts.
Next Earnings Date
Last Earnings Results
Earnings Call Transcripts
| Transcript | Quarter | Year | Date | Estimated EPS | Actual EPS |
|---|---|---|---|---|---|
| Read Transcript | Q4 | 2024 | 2025-02-20 | $0.13 | $-0.34 |
| Read Transcript | Q3 | 2024 | 2024-10-23 | $0.40 | $0.02 |
| Read Transcript | Q2 | 2024 | 2024-07-23 | $0.43 | $0.48 |
| Read Transcript | Q1 | 2024 | 2024-04-24 | $0.26 | $0.11 |
| Read Transcript | Q4 | 2023 | 2024-02-21 | $0.30 | $0.07 |
| Read Transcript | Q3 | 2023 | 2023-10-25 | $0.43 | $0.43 |
| Read Transcript | Q2 | 2023 | 2023-07-26 | $0.39 | $0.35 |
| Read Transcript | Q1 | 2023 | 2023-04-26 | $0.34 | $0.14 |
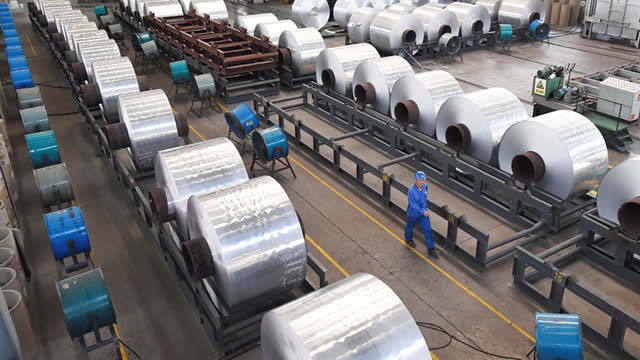
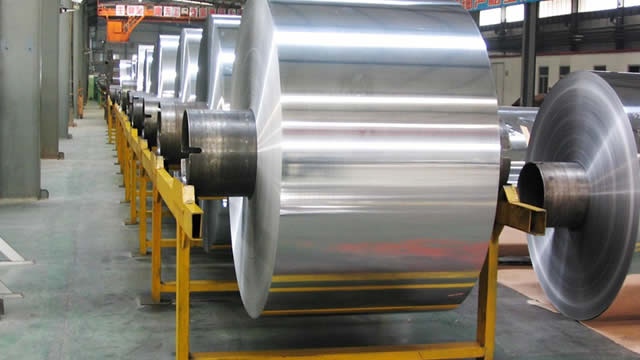
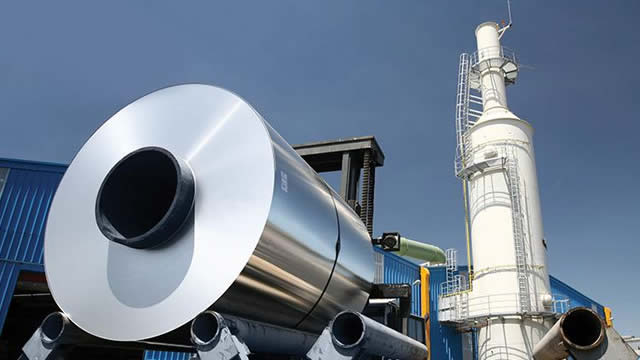
Constellium SE, together with its subsidiaries, engages in the design, manufacture, and sale of specialty rolled and extruded aluminum products for the packaging, aerospace, and automotive end-markets. The company operates through three segments: Packaging & Automotive Rolled Products, Aerospace & Transportation, and Automotive Structures & Industry. The Packaging & Automotive Rolled Products segment produces rolled aluminum products, including can stock and closure stock for the beverage and food industry, as well as foil stock for the flexible packaging market. It also supplies automotive body sheets and heat exchangers for the automotive market; and specialty reflective sheets. The Aerospace & Transportation segment provides rolled aluminum products, including aerospace plates, sheets, and extrusions; and aerospace wing skins, as well as plates and sheets for use in transportation, industry, and defense applications. The Automotive Structures & Industry segment offers extruded products and technologically advanced structures for the automotive industry, including crash-management systems, body structures, side impact beams, and battery enclosures; and hard and soft alloy extruded profiles for various industry applications in the automotive, engineering, rail, and other transportation end markets. This segment also provides downstream technology and services, which include pre-machining, surface treatment, research and development, and technical support services. The company sells its products directly or through distributors in France, Germany, the Czech Republic, the United Kingdom, Switzerland, and the United States, as well as Shanghai, and Seoul. Constellium SE was incorporated in 2010 and is headquartered in Paris, France.
$8.31
Stock Price
$1.19B
Market Cap
12.00K
Employees
Paris, None
Location
Financial Statements
Access annual & quarterly financial statements for Constellium SE, including income statements, balance sheets, and cash flow statements..
Annual Income Statement
| Breakdown | December 31, 2024 | December 31, 2023 | December 31, 2022 | December 31, 2021 | December 31, 2020 |
|---|---|---|---|---|---|
| Revenue | $7.08B | $7.24B | $8.12B | $6.15B | $4.88B |
| Cost of Revenue | $6.18B | $6.53B | $7.45B | $5.49B | $4.39B |
| Gross Profit | $905.45M | $710.00M | $672.00M | $664.00M | $490.00M |
| Gross Profit Ratio | 12.79% | 9.81% | 8.28% | 10.79% | 10.03% |
| Research and Development Expenses | $47.30M | $53.00M | $48.00M | $39.00M | $39.00M |
| General and Administrative Expenses | $- | $302.00M | $282.00M | $258.00M | $237.00M |
| Selling and Marketing Expenses | $- | $16.00M | $- | $- | $- |
| Selling General and Administrative Expenses | $302.14M | $318.00M | $282.00M | $258.00M | $237.00M |
| Other Expenses | $- | $2.00M | $-8.00M | $117.00M | $-89.00M |
| Operating Expenses | $349.44M | $373.00M | $330.00M | $297.00M | $276.00M |
| Cost and Expenses | $6.52B | $6.90B | $7.78B | $5.79B | $4.67B |
| Interest Income | $- | $16.00M | $100.00M | $116.00M | $131.00M |
| Interest Expense | $- | $115.00M | $131.00M | $167.00M | $159.00M |
| Depreciation and Amortization | $293.45M | $294.00M | $281.83M | $277.65M | $241.31M |
| EBITDA | $530.91M | $605.00M | $601.00M | $764.00M | $454.00M |
| EBITDA Ratio | 7.50% | 8.36% | 7.40% | 12.42% | 9.30% |
| Operating Income | $556.01M | $337.00M | $334.00M | $484.00M | $125.00M |
| Operating Income Ratio | 7.85% | 4.66% | 4.11% | 7.87% | 2.56% |
| Total Other Income Expenses Net | $-425.70M | $-141.00M | $-131.00M | $-167.00M | $-159.00M |
| Income Before Tax | $130.32M | $196.00M | $203.00M | $317.00M | $-34.00M |
| Income Before Tax Ratio | 1.84% | 2.71% | 2.50% | 5.15% | -0.70% |
| Income Tax Expense | $72.40M | $67.00M | $-105.00M | $55.00M | $-17.00M |
| Net Income | $54.06M | $125.00M | $301.00M | $257.00M | $-17.00M |
| Net Income Ratio | 0.76% | 1.73% | 3.71% | 4.18% | -0.35% |
| EPS | $0.37 | $0.84 | $2.06 | $1.90 | $-0.12 |
| EPS Diluted | $0.37 | $0.84 | $2.02 | $1.82 | $-0.12 |
| Weighted Average Shares Outstanding | 145.49M | 148.81M | 143.63M | 141.00M | 138.74M |
| Weighted Average Shares Outstanding Diluted | 147.44M | 149.24M | 146.61M | 147.17M | 138.74M |
| SEC Filing | Source | Source | Source | Source | Source |
| Breakdown | December 31, 2024 | September 30, 2024 | June 30, 2024 | March 31, 2024 | December 31, 2023 | September 30, 2023 | June 30, 2023 | March 31, 2023 | December 31, 2022 | September 30, 2022 | June 30, 2022 | March 31, 2022 | December 31, 2021 | September 30, 2021 | June 30, 2021 | March 31, 2021 | December 31, 2020 | September 30, 2020 | June 30, 2020 | March 31, 2020 |
|---|---|---|---|---|---|---|---|---|---|---|---|---|---|---|---|---|---|---|---|---|
| Revenue | $1.92B | $1.64B | $1.79B | $1.73B | $1.57B | $1.72B | $1.95B | $1.96B | $1.84B | $2.02B | $2.27B | $1.98B | $1.71B | $1.59B | $1.52B | $1.34B | $1.24B | $1.17B | $1.03B | $1.44B |
| Cost of Revenue | $1.48B | $1.52B | $1.60B | $1.57B | $1.40B | $1.56B | $1.74B | $1.79B | $1.74B | $1.89B | $2.06B | $1.76B | $1.55B | $1.42B | $1.32B | $1.20B | $1.11B | $1.05B | $962.00M | $1.28B |
| Gross Profit | $440.45M | $114.00M | $190.00M | $161.00M | $173.43M | $158.00M | $213.00M | $161.00M | $107.00M | $133.00M | $215.00M | $217.00M | $155.00M | $168.00M | $199.00M | $142.00M | $134.00M | $120.00M | $69.00M | $153.00M |
| Gross Profit Ratio | 22.99% | 6.96% | 10.58% | 9.30% | 11.04% | 9.19% | 10.92% | 8.23% | 5.80% | 6.58% | 9.45% | 10.97% | 9.09% | 10.59% | 13.11% | 10.59% | 10.78% | 10.24% | 6.69% | 10.65% |
| Research and Development Expenses | $8.30M | $11.00M | $13.00M | $15.00M | $14.62M | $11.00M | $13.00M | $13.00M | $16.00M | $11.00M | $10.00M | $11.00M | $9.00M | $10.00M | $9.00M | $11.00M | $10.00M | $9.00M | $7.00M | $13.00M |
| General and Administrative Expenses | $- | $- | $- | $- | $81.00M | $70.00M | $80.00M | $71.00M | $75.00M | $- | $75.00M | $- | $71.00M | $60.00M | $- | $60.00M | $59.00M | $55.00M | $- | $66.00M |
| Selling and Marketing Expenses | $- | $- | $- | $- | $-2.08M | $- | $- | $- | $1.00M | $- | $- | $- | $- | $- | $- | $- | $- | $- | $- | $- |
| Selling General and Administrative Expenses | $87.14M | $63.00M | $77.00M | $75.00M | $78.92M | $70.00M | $80.00M | $71.00M | $76.00M | $63.00M | $75.00M | $68.00M | $71.00M | $60.00M | $67.00M | $60.00M | $59.00M | $55.00M | $57.00M | $66.00M |
| Other Expenses | $18.00M | $-4.00M | $-27.00M | $13.00M | $- | $- | $-1.00M | $15.00M | $45.00M | $29.00M | $1.00M | $-110.00M | $-25.00M | $55.00M | $-1.00M | $43.00M | $-9.00M | $10.00M | $5.00M | $-1.00M |
| Operating Expenses | $113.44M | $70.00M | $63.00M | $103.00M | $93.54M | $40.00M | $93.00M | $99.00M | $92.00M | $103.00M | $85.00M | $-31.00M | $80.00M | $70.00M | $76.00M | $71.00M | $69.00M | $64.00M | $64.00M | $79.00M |
| Cost and Expenses | $1.59B | $1.59B | $1.67B | $1.67B | $1.49B | $1.60B | $1.83B | $1.89B | $1.83B | $1.99B | $2.15B | $1.73B | $1.63B | $1.49B | $1.40B | $1.27B | $1.18B | $1.12B | $1.03B | $1.36B |
| Interest Income | $- | $- | $- | $- | $35.00M | $36.00M | $26.00M | $35.00M | $2.00M | $36.00M | $- | $- | $- | $- | $- | $- | $- | $- | $- | $- |
| Interest Expense | $-101.00M | $36.00M | $32.00M | $33.00M | $34.10M | $36.00M | $30.00M | $35.00M | $33.00M | $36.00M | $27.00M | $30.00M | $41.00M | $34.00M | $27.00M | $34.00M | $35.00M | $34.00M | $33.00M | $34.00M |
| Depreciation and Amortization | $89.45M | $73.00M | $60.00M | $71.00M | $71.13M | $79.24M | $71.84M | $71.28M | $74.34M | $74.99M | $71.09M | $66.91M | $72.40M | $68.20M | $66.08M | $64.56M | $63.00M | $64.00M | $71.00M | $66.00M |
| EBITDA | $92.91M | $117.00M | $192.00M | $129.00M | $125.00M | $195.00M | $151.00M | $134.00M | $118.00M | $103.00M | $63.00M | $314.00M | $80.00M | $220.00M | $224.00M | $177.00M | $102.00M | $128.00M | $81.00M | $70.00M |
| EBITDA Ratio | 4.85% | 7.14% | 10.70% | 7.45% | 7.95% | 11.34% | 7.74% | 6.85% | 6.40% | 5.09% | 2.77% | 15.87% | 4.69% | 13.86% | 14.76% | 13.20% | 8.21% | 10.92% | 7.86% | 4.87% |
| Operating Income | $327.01M | $44.00M | $127.00M | $58.00M | $79.90M | $118.00M | $79.00M | $62.00M | $60.00M | $30.00M | $127.00M | $248.00M | $50.00M | $153.00M | $167.00M | $114.00M | $56.00M | $64.00M | $-1.00M | $6.00M |
| Operating Income Ratio | 17.07% | 2.68% | 7.08% | 3.35% | 5.08% | 6.86% | 4.05% | 3.17% | 3.25% | 1.48% | 5.58% | 12.53% | 2.93% | 9.64% | 11.00% | 8.50% | 4.51% | 5.46% | -0.10% | 0.42% |
| Total Other Income Expenses Net | $-324.70M | $-36.00M | $-32.00M | $-33.00M | $-35.00M | $-36.00M | $-35.00M | $-35.00M | $-33.00M | $-36.00M | $-32.00M | $-30.00M | $-41.00M | $-34.00M | $-37.00M | $-55.00M | $-35.00M | $-37.00M | $-42.00M | $-45.00M |
| Income Before Tax | $2.32M | $8.00M | $95.00M | $25.00M | $41.90M | $82.00M | $44.00M | $27.00M | $27.00M | $-6.00M | $-36.00M | $218.00M | $9.00M | $119.00M | $130.00M | $59.00M | $21.00M | $27.00M | $-43.00M | $-39.00M |
| Income Before Tax Ratio | 0.12% | 0.49% | 5.29% | 1.44% | 2.67% | 4.77% | 2.26% | 1.38% | 1.46% | -0.30% | -1.58% | 11.02% | 0.53% | 7.50% | 8.56% | 4.40% | 1.69% | 2.30% | -4.17% | -2.71% |
| Income Tax Expense | $35.40M | $5.00M | $24.00M | $8.00M | $31.18M | $18.00M | $12.00M | $5.00M | $-3.00M | $-137.00M | $-4.00M | $39.00M | $2.00M | $20.00M | $22.00M | $11.00M | $-5.00M | $7.00M | $-11.00M | $-8.00M |
| Net Income | $-34.94M | $2.00M | $71.00M | $16.00M | $10.00M | $64.00M | $31.00M | $20.00M | $28.00M | $130.00M | $-32.00M | $177.00M | $7.00M | $97.00M | $107.00M | $46.00M | $24.00M | $19.00M | $-33.00M | $-31.00M |
| Net Income Ratio | -1.82% | 0.12% | 3.96% | 0.92% | 0.64% | 3.72% | 1.59% | 1.02% | 1.52% | 6.43% | -1.41% | 8.94% | 0.41% | 6.11% | 7.05% | 3.43% | 1.93% | 1.62% | -3.20% | -2.16% |
| EPS | $-0.24 | $0.01 | $0.49 | $0.11 | $0.07 | $0.45 | $0.21 | $0.14 | $0.18 | $0.90 | $-0.22 | $1.25 | $0.05 | $0.68 | $0.76 | $0.33 | $0.18 | $0.13 | $-0.24 | $-0.22 |
| EPS Diluted | $-0.23 | $0.01 | $0.48 | $0.11 | $0.07 | $0.44 | $0.21 | $0.13 | $0.18 | $0.89 | $-0.22 | $1.20 | $0.05 | $0.65 | $0.73 | $0.32 | $0.17 | $0.13 | $-0.24 | $-0.22 |
| Weighted Average Shares Outstanding | 145.49M | 145.49M | 146.27M | 146.80M | 146.82M | 146.82M | 146.54M | 144.30M | 144.30M | 144.30M | 144.19M | 141.68M | 141.68M | 141.68M | 140.64M | 139.96M | 139.96M | 139.21M | 137.50M | 137.87M |
| Weighted Average Shares Outstanding Diluted | 147.44M | 147.44M | 149.04M | 146.80M | 149.24M | 148.70M | 148.19M | 147.31M | 146.61M | 146.76M | 144.19M | 147.53M | 147.17M | 147.15M | 146.73M | 145.90M | 145.14M | 143.00M | 137.90M | 137.87M |
| SEC Filing | Source | Source | Source | Source | Source | Source | Source | Source | Source | Source | Source | Source | Source | Source | Source | Source | Source | Source | Source | Source |
Annual Balance Sheet
| Breakdown | December 31, 2024 | December 31, 2023 | December 31, 2022 | December 31, 2021 | December 31, 2020 |
|---|---|---|---|---|---|
| Cash and Cash Equivalents | $141.00M | $180.00M | $166.00M | $147.00M | $439.00M |
| Short Term Investments | $- | $30.00M | $31.00M | $58.00M | $39.00M |
| Cash and Short Term Investments | $141.00M | $210.00M | $197.00M | $205.00M | $478.00M |
| Net Receivables | $486.00M | $388.00M | $467.00M | $605.00M | $343.00M |
| Inventory | $1.18B | $1.10B | $1.32B | $1.05B | $582.00M |
| Other Current Assets | $26.00M | $132.00M | $103.00M | $136.00M | $102.00M |
| Total Current Assets | $1.83B | $1.82B | $2.06B | $1.94B | $1.47B |
| Property Plant Equipment Net | $2.41B | $2.05B | $2.02B | $1.95B | $1.91B |
| Goodwill | $46.00M | $462.00M | $478.00M | $451.00M | $417.00M |
| Intangible Assets | $97.00M | $47.00M | $54.00M | $58.00M | $61.00M |
| Goodwill and Intangible Assets | $143.00M | $509.00M | $532.00M | $509.00M | $478.00M |
| Long Term Investments | $- | $2.00M | $8.00M | $12.00M | $19.00M |
| Tax Assets | $311.00M | $1.69M | $271.00M | $162.00M | $193.00M |
| Other Non-Current Assets | $38.00M | $281.31M | $57.00M | $55.00M | $67.00M |
| Total Non-Current Assets | $2.90B | $2.84B | $2.88B | $2.69B | $2.66B |
| Other Assets | $- | $- | $- | $- | $- |
| Total Assets | $4.73B | $4.66B | $4.94B | $4.62B | $4.13B |
| Account Payables | $1.26B | $931.00M | $1.16B | $1.06B | $626.00M |
| Short Term Debt | $39.00M | $54.00M | $148.00M | $258.00M | $103.00M |
| Tax Payables | $18.00M | $19.02M | $16.00M | $34.00M | $20.00M |
| Deferred Revenue | $- | $- | $55.00M | $77.00M | $81.00M |
| Other Current Liabilities | $75.25M | $383.98M | $-1.30B | $357.00M | $337.00M |
| Total Current Liabilities | $1.40B | $1.39B | $1.69B | $1.71B | $1.09B |
| Long Term Debt | $1.88B | $1.82B | $2.08B | $2.05B | $2.49B |
| Deferred Revenue Non-Current | $- | $-1.37M | $20.00M | $4.00M | $3.00M |
| Deferred Tax Liabilities Non-Current | $39.00M | $28.00M | $28.00M | $14.00M | $10.00M |
| Other Non-Current Liabilities | $643.00M | $565.63M | $372.00M | $547.00M | $637.00M |
| Total Non-Current Liabilities | $2.56B | $2.41B | $2.50B | $2.62B | $3.14B |
| Other Liabilities | $50.18M | $- | $- | $- | $- |
| Total Liabilities | $4.01B | $3.80B | $4.19B | $4.33B | $4.23B |
| Preferred Stock | $- | $- | $- | $- | $128.00M |
| Common Stock | $4.00M | $3.00M | $3.00M | $3.00M | $3.00M |
| Retained Earnings | $203.00M | $420.00M | $148.00M | $-149.00M | $-538.00M |
| Accumulated Other Comprehensive Income Loss | $141.90M | $146.00M | $160.00M | $4.00M | $-128.00M |
| Other Total Stockholders Equity | $332.60M | $274.00M | $260.00M | $420.00M | $548.00M |
| Total Stockholders Equity | $681.50M | $843.00M | $731.00M | $274.00M | $-115.00M |
| Total Equity | $701.77M | $864.02M | $752.00M | $291.00M | $-101.00M |
| Total Liabilities and Stockholders Equity | $4.73B | $4.66B | $4.94B | $4.62B | $4.13B |
| Minority Interest | $20.27M | $21.02M | $21.00M | $17.00M | $14.00M |
| Total Liabilities and Total Equity | $4.73B | $4.66B | $4.94B | $4.62B | $4.13B |
| Total Investments | $-399.52M | $32.00M | $39.00M | $70.00M | $58.00M |
| Total Debt | $1.94B | $1.87B | $2.06B | $2.13B | $2.39B |
| Net Debt | $1.79B | $1.69B | $1.89B | $1.98B | $1.95B |
Balance Sheet Charts
| Breakdown | December 31, 2024 | September 30, 2024 | June 30, 2024 | March 31, 2024 | December 31, 2023 | September 30, 2023 | June 30, 2023 | March 31, 2023 | December 31, 2022 | September 30, 2022 | June 30, 2022 | March 31, 2022 | December 31, 2021 | September 30, 2021 | June 30, 2021 | March 31, 2021 | December 31, 2020 | September 30, 2020 | June 30, 2020 | March 31, 2020 |
|---|---|---|---|---|---|---|---|---|---|---|---|---|---|---|---|---|---|---|---|---|
| Cash and Cash Equivalents | $136.11M | $152.00M | $213.13M | $180.17M | $202.17M | $159.00M | $158.00M | $193.00M | $166.00M | $171.00M | $132.00M | $160.00M | $147.00M | $323.00M | $290.00M | $342.00M | $439.00M | $432.00M | $378.00M | $270.00M |
| Short Term Investments | $- | $30.00M | $22.00M | $20.00M | $30.00M | $34.00M | $- | $29.00M | $31.00M | $47.00M | $- | $110.00M | $58.00M | $88.00M | $63.00M | $60.00M | $39.00M | $23.00M | $22.00M | $4.00M |
| Cash and Short Term Investments | $136.11M | $182.00M | $213.13M | $180.17M | $202.17M | $193.00M | $158.00M | $222.00M | $197.00M | $218.00M | $132.00M | $270.00M | $205.00M | $411.00M | $290.00M | $342.00M | $478.00M | $432.00M | $400.00M | $270.00M |
| Net Receivables | $469.14M | $591.00M | $580.00M | $655.00M | $388.00M | $642.00M | $666.00M | $770.00M | $467.00M | $822.00M | $923.00M | $927.00M | $605.00M | $689.00M | $588.00M | $462.00M | $343.00M | $399.00M | $387.00M | $451.00M |
| Inventory | $1.14B | $1.14B | $1.13B | $1.09B | $1.10B | $1.14B | $1.15B | $1.23B | $1.32B | $1.38B | $1.36B | $1.32B | $1.05B | $935.00M | $802.00M | $703.00M | $582.00M | $607.00M | $635.00M | $694.00M |
| Other Current Assets | $25.10M | $- | $- | $- | $132.00M | $- | $166.00M | $- | $103.00M | $- | $150.00M | $- | $136.00M | $- | $144.00M | $131.00M | $102.00M | $91.00M | $- | $130.00M |
| Total Current Assets | $1.77B | $1.91B | $2.06B | $1.94B | $1.82B | $1.97B | $2.16B | $2.22B | $2.06B | $2.42B | $2.59B | $2.52B | $1.94B | $2.04B | $1.82B | $1.64B | $1.47B | $1.53B | $1.49B | $1.54B |
| Property Plant Equipment Net | $2.32B | $2.08B | $2.09B | $2.05B | $2.05B | $2.02B | $1.99B | $2.00B | $2.02B | $2.06B | $1.99B | $1.94B | $1.95B | $1.90B | $1.90B | $1.92B | $1.91B | $1.97B | $2.03B | $2.08B |
| Goodwill | $44.40M | $461.00M | $477.28M | $472.44M | $462.38M | $482.00M | $470.00M | $469.00M | $478.00M | $522.00M | $491.00M | $460.00M | $451.00M | $441.00M | $430.00M | $436.00M | $417.00M | $437.00M | $456.00M | $466.00M |
| Intangible Assets | $93.63M | $42.00M | $45.00M | $45.00M | $47.00M | $50.00M | $50.00M | $51.00M | $54.00M | $57.00M | $57.00M | $57.00M | $58.00M | $62.00M | $59.00M | $61.00M | $61.00M | $64.00M | $68.00M | $70.00M |
| Goodwill and Intangible Assets | $138.04M | $503.00M | $522.00M | $517.00M | $509.00M | $532.00M | $520.00M | $520.00M | $532.00M | $579.00M | $548.00M | $517.00M | $509.00M | $503.00M | $489.00M | $497.00M | $478.00M | $501.00M | $524.00M | $536.00M |
| Long Term Investments | $- | $7.00M | $37.02M | $33.03M | $33.03M | $3.00M | $39.01M | $5.00M | $8.00M | $18.00M | $73.82M | $16.00M | $12.00M | $15.00M | $16.00M | $12.00M | $19.00M | $1.00M | $10.00M | $1.00M |
| Tax Assets | $- | $227.00M | $234.14M | $228.21M | $252.21M | $228.00M | $238.00M | $243.00M | $271.00M | $275.00M | $124.00M | $124.00M | $162.00M | $150.00M | $162.00M | $179.00M | $193.00M | $218.00M | $222.00M | $195.00M |
| Other Non-Current Assets | $336.89M | $37.00M | $307.02K | $479.15K | $419.65K | $40.00M | $-9.30K | $46.00M | $57.00M | $53.00M | $180.06K | $58.00M | $55.00M | $71.00M | $69.00M | $66.00M | $67.00M | $75.00M | $74.00M | $75.00M |
| Total Non-Current Assets | $2.80B | $2.85B | $2.88B | $2.83B | $2.84B | $2.82B | $2.79B | $2.81B | $2.88B | $2.98B | $2.74B | $2.66B | $2.69B | $2.64B | $2.63B | $2.67B | $2.66B | $2.77B | $2.86B | $2.88B |
| Other Assets | $- | $- | $- | $- | $1 | $- | $- | $- | $- | $- | $- | $- | $- | $- | $- | $- | $- | $- | $- | $- |
| Total Assets | $4.57B | $4.76B | $4.94B | $4.78B | $4.66B | $4.79B | $4.95B | $5.04B | $4.94B | $5.41B | $5.33B | $5.17B | $4.62B | $4.67B | $4.46B | $4.31B | $4.13B | $4.29B | $4.35B | $4.43B |
| Account Payables | $1.26B | $1.39B | $1.10B | $1.36B | $931.00M | $1.35B | $1.13B | $1.54B | $1.16B | $1.69B | $1.44B | $1.72B | $1.06B | $1.33B | $950.00M | $822.00M | $626.00M | $708.00M | $683.00M | $870.00M |
| Short Term Debt | $37.65M | $53.00M | $53.03M | $52.00M | $54.00M | $54.00M | $197.00M | $219.00M | $148.00M | $154.00M | $210.00M | $254.00M | $258.00M | $262.00M | $264.00M | $94.00M | $103.00M | $90.00M | $103.00M | $200.00M |
| Tax Payables | $- | $16.00M | $19.01M | $17.02M | $19.02M | $15.00M | $49.00M | $17.00M | $16.00M | $24.00M | $72.00M | $43.00M | $34.00M | $26.00M | $52.00M | $49.00M | $20.00M | $51.00M | $20.00M | $43.00M |
| Deferred Revenue | $- | $- | $19.01M | $17.02M | $62.05M | $36.00M | $54.00M | $- | $55.00M | $- | $75.00M | $- | $77.00M | $45.00M | $62.00M | $80.00M | $81.00M | $70.00M | $49.00M | $60.00M |
| Other Current Liabilities | $94.60M | $41.00M | $380.96M | $54.98M | $385.13M | $31.00M | $317.00M | $63.00M | $-1.30B | $109.00M | $420.00M | $45.00M | $357.00M | $1.00M | $320.00M | $331.00M | $337.00M | $336.00M | $393.00M | $377.00M |
| Total Current Liabilities | $1.40B | $1.50B | $1.55B | $1.49B | $1.39B | $1.49B | $1.76B | $1.84B | $1.69B | $1.98B | $2.14B | $2.06B | $1.71B | $1.67B | $1.59B | $1.30B | $1.09B | $1.19B | $1.20B | $1.49B |
| Long Term Debt | $1.81B | $1.77B | $2.02B | $1.83B | $1.82B | $1.85B | $1.83B | $1.88B | $2.08B | $2.02B | $1.95B | $1.88B | $2.05B | $2.02B | $2.00B | $2.26B | $2.33B | $2.39B | $2.44B | $2.21B |
| Deferred Revenue Non-Current | $- | $- | $- | $1 | $29.02M | $521.00M | $- | $- | $20.00M | $- | $17.00M | $- | $4.00M | $710.00M | $3.00M | $5.00M | $3.00M | $4.00M | $833.00M | $6.00M |
| Deferred Tax Liabilities Non-Current | $- | $33.00M | $27.02M | $5.00M | $28.02M | $4.00M | $4.00M | $4.00M | $28.00M | $5.00M | $15.00M | $13.00M | $14.00M | $13.00M | $12.00M | $10.00M | $10.00M | $27.00M | $25.00M | $22.00M |
| Other Non-Current Liabilities | $658.33M | $538.00M | $392.34M | $545.51M | $566.59M | $18.00M | $558.00M | $548.00M | $372.00M | $620.00M | $637.00M | $677.00M | $565.00M | $21.00M | $723.00M | $748.00M | $811.00M | $878.00M | $50.00M | $857.00M |
| Total Non-Current Liabilities | $2.47B | $2.35B | $2.42B | $2.38B | $2.41B | $2.39B | $2.38B | $2.43B | $2.50B | $2.63B | $2.59B | $2.56B | $2.62B | $2.75B | $2.73B | $3.01B | $3.14B | $3.27B | $3.32B | $3.06B |
| Other Liabilities | $- | $- | $1 | $1 | $- | $- | $- | $- | $- | $- | $- | $- | $- | $- | $- | $- | $- | $- | $- | $- |
| Total Liabilities | $3.87B | $3.84B | $3.97B | $3.87B | $3.80B | $3.88B | $4.14B | $4.27B | $4.19B | $4.61B | $4.73B | $4.63B | $4.33B | $4.42B | $4.31B | $4.30B | $4.23B | $4.46B | $4.52B | $4.55B |
| Preferred Stock | $- | $- | $103.06M | $124.11M | $118.10M | $- | $- | $- | $- | $- | $- | $- | $- | $27.02M | $- | $68.00M | $- | $- | $156.00M | $- |
| Common Stock | $3.86M | $3.00M | $3.00M | $3.00M | $3.00M | $3.00M | $3.00M | $3.00M | $3.00M | $3.00M | $3.00M | $3.00M | $3.00M | $3.00M | $3.00M | $3.00M | $3.00M | $3.00M | $3.00M | $3.00M |
| Retained Earnings | $89.77M | $363.00M | $361.21M | $290.27M | $274.23M | $264.00M | $362.00M | $321.00M | $148.00M | $347.00M | $159.00M | $105.00M | $-149.00M | $-187.00M | $-295.00M | $-432.00M | $-538.00M | $-596.00M | $-609.00M | $-557.00M |
| Accumulated Other Comprehensive Income Loss | $141.90M | $144.00M | $178.10M | $56.05M | $146.12M | $202.00M | $163.04M | $153.37M | $160.00M | $226.91M | $168.59M | $81.45M | $4.00M | $-27.02M | $-1.49B | $-68.00M | $-128.00M | $-162.00M | $-156.00M | $-1.25B |
| Other Total Stockholders Equity | $445.97M | $390.00M | $410.56M | $414.82M | $274.70M | $420.00M | $257.00M | $267.00M | $260.00M | $193.00M | $251.00M | $339.00M | $420.00M | $420.00M | $382.00M | $488.00M | $548.00M | $582.00M | $576.00M | $557.00M |
| Total Stockholders Equity | $681.50M | $900.00M | $952.56M | $890.82M | $843.70M | $889.00M | $785.00M | $744.00M | $731.00M | $770.00M | $582.00M | $528.00M | $274.00M | $236.00M | $128.00M | $-9.00M | $-115.00M | $-173.00M | $-186.00M | $-134.00M |
| Total Equity | $701.77M | $920.00M | $973.57M | $910.84M | $864.71M | $911.00M | $806.00M | $765.00M | $752.00M | $793.00M | $603.00M | $547.00M | $291.00M | $254.00M | $144.00M | $6.00M | $-101.00M | $-160.00M | $-174.00M | $-123.00M |
| Total Liabilities and Stockholders Equity | $4.57B | $4.76B | $4.94B | $4.78B | $4.66B | $4.79B | $4.95B | $5.04B | $4.94B | $5.41B | $5.33B | $5.17B | $4.62B | $4.67B | $4.46B | $4.31B | $4.13B | $4.29B | $4.35B | $4.43B |
| Minority Interest | $20.27M | $20.00M | $21.01M | $20.02M | $21.02M | $22.00M | $21.00M | $21.00M | $21.00M | $23.00M | $21.00M | $19.00M | $17.00M | $18.00M | $16.00M | $15.00M | $14.00M | $13.00M | $12.00M | $11.00M |
| Total Liabilities and Total Equity | $4.57B | $4.76B | $4.94B | $4.78B | $4.66B | $4.79B | $4.95B | $5.04B | $4.94B | $5.41B | $5.33B | $5.17B | $4.62B | $4.67B | $4.46B | $4.31B | $4.13B | $4.29B | $4.35B | $4.43B |
| Total Investments | $- | $37.00M | $37.02M | $33.03M | $33.03M | $37.00M | $39.01M | $34.00M | $39.00M | $65.00M | $73.82M | $126.00M | $70.00M | $103.00M | $79.00M | $72.00M | $58.00M | $24.00M | $32.00M | $5.00M |
| Total Debt | $1.85B | $1.83B | $1.90B | $1.88B | $1.87B | $1.91B | $2.03B | $2.10B | $2.06B | $2.17B | $2.16B | $2.14B | $2.13B | $2.28B | $2.26B | $2.33B | $2.39B | $2.46B | $2.54B | $2.40B |
| Net Debt | $1.72B | $1.68B | $1.68B | $1.70B | $1.67B | $1.75B | $1.87B | $1.91B | $1.89B | $2.00B | $2.03B | $1.98B | $1.98B | $1.96B | $1.97B | $1.98B | $1.95B | $2.02B | $2.16B | $2.13B |
Annual Cash Flow
| Breakdown | December 31, 2024 | December 31, 2023 | December 31, 2022 | December 31, 2021 | December 31, 2020 |
|---|---|---|---|---|---|
| Net Income | $54.06M | $125.00M | $308.00M | $262.00M | $-17.00M |
| Depreciation and Amortization | $293.45M | $294.00M | $287.00M | $267.00M | $259.00M |
| Deferred Income Tax | $75.00M | $67.00M | $-105.00M | $55.00M | $-17.00M |
| Stock Based Compensation | $24.13M | $- | $18.00M | $15.00M | $15.00M |
| Change in Working Capital | $-92.67M | $54.00M | $-32.00M | $-261.00M | $51.00M |
| Accounts Receivables | $-48.27M | $53.87M | $155.00M | $-227.00M | $36.00M |
| Inventory | $-23.17M | $190.02M | $-241.00M | $-435.00M | $63.00M |
| Accounts Payables | $- | $-190.00M | $41.00M | $396.00M | $-38.00M |
| Other Working Capital | $-21.24M | $103.99K | $13.00M | $5.00M | $-10.00M |
| Other Non Cash Items | $-63.42M | $-34.00M | $-25.00M | $135.00M | $125.00M |
| Net Cash Provided by Operating Activities | $290.56M | $506.00M | $451.00M | $357.00M | $334.00M |
| Investments in Property Plant and Equipment | $-398.67M | $-337.00M | $-273.00M | $-232.00M | $-182.00M |
| Acquisitions Net | $2.90M | $48.00M | $1.96M | $9.36M | $5.59M |
| Purchases of Investments | $- | $- | $- | $- | $- |
| Sales Maturities of Investments | $- | $- | $- | $- | $- |
| Other Investing Activities | $93.63M | $1.00M | $1.04M | $1.64M | $409.83K |
| Net Cash Used for Investing Activities | $-302.14M | $-288.00M | $-270.00M | $-221.00M | $-176.00M |
| Debt Repayment | $27.03M | $-173.00M | $-157.00M | $-377.00M | $118.00M |
| Common Stock Issued | $- | $- | $- | $- | $- |
| Common Stock Repurchased | $-76.26M | $- | $- | $- | $- |
| Dividends Paid | $- | $- | $- | $- | $- |
| Other Financing Activities | $-9.65M | $-9.00M | $-6.00M | $-58.00M | $-17.00M |
| Net Cash Used Provided by Financing Activities | $-58.88M | $-182.00M | $-163.00M | $-435.00M | $101.00M |
| Effect of Forex Changes on Cash | $-8.69M | $-1.00M | $2.00M | $7.00M | $-4.00M |
| Net Change in Cash | $-65.89M | $36.00M | $19.00M | $-292.00M | $255.00M |
| Cash at End of Period | $136.11M | $202.00M | $166.00M | $147.00M | $439.00M |
| Cash at Beginning of Period | $202.00M | $166.00M | $147.00M | $439.00M | $184.00M |
| Operating Cash Flow | $290.56M | $506.00M | $451.00M | $357.00M | $334.00M |
| Capital Expenditure | $-398.67M | $-337.00M | $-273.00M | $-232.00M | $-182.00M |
| Free Cash Flow | $-108.11M | $169.00M | $178.00M | $125.00M | $152.00M |
Cash Flow Charts
| Breakdown | December 31, 2024 | September 30, 2024 | June 30, 2024 | March 31, 2024 | December 31, 2023 | September 30, 2023 | June 30, 2023 | March 31, 2023 | December 31, 2022 | September 30, 2022 | June 30, 2022 | March 31, 2022 | December 31, 2021 | September 30, 2021 | June 30, 2021 | March 31, 2021 | December 31, 2020 | September 30, 2020 | June 30, 2020 | March 31, 2020 |
|---|---|---|---|---|---|---|---|---|---|---|---|---|---|---|---|---|---|---|---|---|
| Net Income | $-34.89M | $2.00M | $71.00M | $16.00M | $9.74M | $64.00M | $32.00M | $22.00M | $30.00M | $131.00M | $-32.00M | $179.00M | $7.00M | $99.00M | $108.00M | $48.00M | $26.00M | $20.00M | $-32.00M | $-31.00M |
| Depreciation and Amortization | $75.59M | $73.00M | $74.00M | $71.00M | $71.13M | $77.00M | $72.00M | $72.00M | $78.00M | $73.00M | $70.00M | $66.00M | $72.00M | $67.00M | $65.00M | $63.00M | $63.00M | $64.00M | $71.00M | $66.00M |
| Deferred Income Tax | $38.00M | $5.00M | $24.00M | $8.00M | $12.67M | $18.00M | $12.00M | $5.00M | $-3.00M | $-137.00M | $-4.00M | $39.00M | $2.00M | $20.00M | $22.00M | $11.00M | $-5.00M | $7.00M | $-11.00M | $-8.00M |
| Stock Based Compensation | $7.14M | $5.00M | $6.00M | $6.00M | $5.00M | $5.00M | $7.00M | $3.00M | $5.00M | $4.00M | $5.00M | $4.00M | $4.00M | $4.00M | $3.00M | $4.00M | $4.00M | $3.00M | $5.00M | $3.00M |
| Change in Working Capital | $69.23M | $59.00M | $-65.00M | $-136.00M | $60.99M | $63.00M | $-10.00M | $-72.00M | $89.00M | $93.00M | $-52.00M | $-162.00M | $-41.00M | $-74.00M | $-119.00M | $-27.00M | $-30.00M | $42.00M | $-26.00M | $67.00M |
| Accounts Receivables | $38.68M | $99.00M | $-42.00M | $-144.00M | $143.28M | $133.00M | $-7.00M | $-217.00M | $247.00M | $195.00M | $-77.00M | $-210.00M | $30.00M | $-23.00M | $-126.00M | $-108.00M | $48.00M | $-19.00M | $57.00M | $-50.00M |
| Inventory | $22.80M | $-23.00M | $-40.00M | $17.00M | $16.54M | $25.00M | $72.00M | $78.00M | $-3.00M | $18.00M | $14.06M | $-256.00M | $-101.00M | $-122.00M | $-103.00M | $-109.00M | $13.00M | $15.00M | $52.00M | $-17.00M |
| Accounts Payables | $- | $- | $- | $- | $-63.90M | $-109.00M | $-98.00M | $84.00M | $-165.00M | $-119.00M | $5.00M | $320.00M | $40.00M | $56.00M | $117.00M | $183.00M | $-58.00M | $38.00M | $-176.00M | $158.00M |
| Other Working Capital | $7.75M | $-17.00M | $17.00M | $-9.00M | $-34.93M | $14.00M | $23.00M | $-17.00M | $10.00M | $-1.00M | $5.94M | $-16.00M | $-10.00M | $15.00M | $-7.00M | $7.00M | $-33.00M | $8.00M | $41.00M | $-24.00M |
| Other Non Cash Items | $-156.34M | $-58.00M | $42.00M | $89.00M | $68.44M | $30.00M | $33.00M | $4.00M | $-71.00M | $-10.00M | $124.00M | $-64.00M | $35.00M | $24.00M | $30.00M | $46.00M | $20.00M | $25.00M | $52.00M | $48.00M |
| Net Cash Provided by Operating Activities | $-1.26M | $86.00M | $152.00M | $54.00M | $176.64M | $154.00M | $133.00M | $34.00M | $128.00M | $154.00M | $111.00M | $58.00M | $118.00M | $91.00M | $73.00M | $75.00M | $71.00M | $111.00M | $8.00M | $144.00M |
| Investments in Property Plant and Equipment | $-156.82M | $-96.00M | $-78.00M | $-68.00M | $-121.38M | $-76.00M | $-65.00M | $-69.00M | $-109.00M | $-80.00M | $-51.00M | $-33.00M | $-104.00M | $-54.00M | $-42.00M | $-32.00M | $-44.00M | $-38.00M | $-41.00M | $-57.00M |
| Acquisitions Net | $-102.24K | $3.00M | $- | $- | $-517.50K | $49.40M | $-2.98M | $989.97K | $2.85M | $58.71K | $-2.09M | $1.01M | $754.28K | $2.94M | $2.04M | $3.07M | $- | $- | $- | $- |
| Purchases of Investments | $- | $- | $- | $- | $- | $- | $- | $- | $- | $- | $- | $- | $- | $- | $- | $- | $- | $- | $- | $- |
| Sales Maturities of Investments | $- | $- | $- | $- | $- | $- | $- | $- | $- | $- | $- | $- | $- | $- | $- | $- | $- | $- | $- | $- |
| Other Investing Activities | $86.64M | $- | $1.00M | $6.00M | $-48.00M | $-1.40M | $2.98M | $10.03K | $-846.84K | $-58.71K | $2.09M | $1.00M | $1.00M | $3.00M | $4.00M | $3.00M | $1.00M | $2.00M | $1.00M | $- |
| Net Cash Used for Investing Activities | $-70.28M | $-93.00M | $-77.00M | $-62.00M | $-121.90M | $-28.00M | $-65.00M | $-68.00M | $-107.00M | $-80.00M | $-51.00M | $-32.00M | $-103.00M | $-51.00M | $-38.00M | $-29.00M | $-43.00M | $-36.00M | $-40.00M | $-57.00M |
| Debt Repayment | $57.92M | $-15.00M | $-9.00M | $-7.00M | $-10.00M | $-149.00M | $-77.00M | $63.00M | $-9.00M | $-66.00M | $-68.00M | $-14.00M | $-193.00M | $-9.00M | $-43.00M | $-132.00M | $-13.00M | $-16.00M | $152.00M | $-5.00M |
| Common Stock Issued | $- | $- | $- | $- | $- | $- | $- | $- | $- | $- | $- | $- | $- | $- | $- | $- | $- | $- | $- | $- |
| Common Stock Repurchased | $-20.29M | $-19.00M | $-31.00M | $-6.00M | $- | $- | $- | $- | $- | $- | $- | $- | $- | $- | $- | $- | $- | $- | $- | $- |
| Dividends Paid | $- | $- | $- | $- | $- | $- | $- | $- | $- | $- | $- | $- | $- | $- | $- | $- | $- | $- | $- | $- |
| Other Financing Activities | $13.42M | $-20.00M | $-2.00M | $-1.00M | $-5.00M | $1.00M | $-3.00M | $-2.00M | $-13.00M | $4.00M | $3.00M | $- | $-1.00M | $- | $-44.00M | $-13.00M | $-8.00M | $-2.00M | $-11.00M | $4.00M |
| Net Cash Used Provided by Financing Activities | $51.05M | $-54.00M | $-42.00M | $-14.00M | $-12.77M | $-148.00M | $-80.00M | $61.00M | $-22.00M | $-62.00M | $-65.00M | $-14.00M | $-194.00M | $-9.00M | $-87.00M | $-145.00M | $-21.00M | $-18.00M | $141.00M | $-1.00M |
| Effect of Forex Changes on Cash | $-8.69M | $- | $- | $- | $1.02M | $1.00M | $-1.00M | $-1.00M | $-3.00M | $3.00M | $1.00M | $1.00M | $3.00M | $2.00M | $- | $2.00M | $4.00M | $-3.00M | $-1.00M | $- |
| Net Change in Cash | $-15.89M | $-61.00M | $33.00M | $-22.00M | $42.92M | $-19.00M | $-15.00M | $26.00M | $-5.00M | $15.00M | $-4.00M | $13.00M | $-176.00M | $33.00M | $-52.00M | $-97.00M | $7.00M | $54.00M | $108.00M | $86.00M |
| Cash at End of Period | $136.11M | $152.00M | $213.00M | $180.00M | $202.17M | $159.00M | $178.00M | $193.00M | $166.00M | $171.00M | $156.00M | $160.00M | $147.00M | $323.00M | $290.00M | $342.00M | $439.00M | $432.00M | $378.00M | $270.00M |
| Cash at Beginning of Period | $152.00M | $213.00M | $180.00M | $202.00M | $159.25M | $178.00M | $193.00M | $167.00M | $171.00M | $156.00M | $160.00M | $147.00M | $323.00M | $290.00M | $342.00M | $439.00M | $432.00M | $378.00M | $270.00M | $184.00M |
| Operating Cash Flow | $-1.26M | $86.00M | $152.00M | $54.00M | $176.64M | $154.00M | $133.00M | $34.00M | $128.00M | $154.00M | $111.00M | $58.00M | $118.00M | $91.00M | $73.00M | $75.00M | $71.00M | $111.00M | $8.00M | $144.00M |
| Capital Expenditure | $-156.82M | $-96.00M | $-78.00M | $-68.00M | $-121.38M | $-76.00M | $-65.00M | $-69.00M | $-109.00M | $-80.00M | $-51.00M | $-33.00M | $-104.00M | $-54.00M | $-42.00M | $-32.00M | $-44.00M | $-38.00M | $-41.00M | $-57.00M |
| Free Cash Flow | $-158.08M | $-10.00M | $74.00M | $-14.00M | $55.26M | $78.00M | $68.00M | $-35.00M | $19.00M | $74.00M | $60.00M | $25.00M | $14.00M | $37.00M | $31.00M | $43.00M | $27.00M | $73.00M | $-33.00M | $87.00M |
Constellium SE Dividends
Explore Constellium SE's dividend history, including dividend yield, payout ratio, and historical payments.
Constellium SE News
Read the latest news about Constellium SE, including recent articles, headlines, and updates.
Constellium to Report First Quarter 2025 Results on April 30, 2025
PARIS, April 16, 2025 (GLOBE NEWSWIRE) -- Constellium SE (NYSE: CSTM) will host a conference call and webcast on Wednesday, April 30, 2025, at 10:00 AM (Eastern Time) to announce its first quarter 2025 results. The press release will be sent before market opening.

Constellium posts 2025 Annual General Meeting Materials
PARIS, April 15, 2025 (GLOBE NEWSWIRE) -- Constellium SE (NYSE: CSTM) (the “Company”) today announced that the Proxy Statement filed on Form 8-K and other documents for the Company's Annual General Meeting of Shareholders to be held on May 15, 2025, at 5 PM CET (11 AM EDT), are available on its website at https://www.constellium.com/investors/shareholder-meetings and will be available to shareholders entitled to vote free of charge at the offices of the Company by contacting the Corporate Secretary at cstm.corporatesecretary@constellium.com.

Tariff Turmoil: Cleveland-Cliffs, Constellium, Freeport-McMoRan Caught In The Crossfire, Says Analyst
President Donald Trump's fresh round of 25% auto import tariffs is shaking up the metals market, and JPMorgan analyst Bill Peterson sees near-term headwinds for key players in steel, aluminum, and copper.


Constellium Releases 2024 Sustainability Report, Advancing a Sustainable Economy Together
PARIS, March 04, 2025 (GLOBE NEWSWIRE) -- Constellium SE (NYSE: CSTM) today announced the release of its 2024 Sustainability Report, highlighting the company's commitment to advancing a sustainable and circular economy. The report details Constellium's key achievements and reports progress on the company's targets for decarbonization, recycling, safety, and women representation.

Constellium Joins Industry Consortium for Lightweight Vehicle Chassis Innovation Project
PARIS, Feb. 24, 2025 (GLOBE NEWSWIRE) -- Constellium SE (NYSE: CSTM) announced its participation in ‘Project M-LightEn,' an ambitious new initiative to develop ultra-lightweight, sustainable vehicle chassis structures. Led by Gordon Murray Group (GMG), the initiative is supported by Innovate UK and the Advanced Propulsion Centre (APC), and includes as partners Constellium, Carbon ThreeSixty, and Brunel University London. Over the next three years, the consortium aims to achieve breakthrough innovations in unibody vehicle architecture that reduce carbon intensity by 50% while being 25% lighter.

Constellium SE (CSTM) Q4 2024 Earnings Call Transcript
Constellium SE (NYSE:CSTM ) Q4 2024 Earnings Conference Call February 20, 2025 10:00 AM ET Company Participants Jason Hershiser - Director of Investor Relations Jean-Marc Germain - Chief Executive Officer Jack Guo - Senior Vice President and Chief Financial Officer Conference Call Participants Corinne Blanchard - Deutsche Bank Katja Jancic - BMO Capital Markets William Peterson - JPMorgan Timna Tanners - Wolfe Research Operator Hello and welcome to the Constellium Fourth Quarter and Full Year 2024 Results Conference Call. My name is Alex and I'll be coordinating the call today.


Constellium Announces Price Increase for Shipments of Flat Rolled Products in the US
PARIS, Feb. 18, 2025 (GLOBE NEWSWIRE) -- Constellium SE (NYSE: CSTM) today announced a minimum price increase of $0.15 per pound for all flat rolled products shipped in the US, due to recent market dynamics and other economic drivers. Select products may require higher increases.


Constellium to Voluntarily Transition to Reporting in U.S. Dollars Under U.S. GAAP; Will Begin Filing Annual Reports on Form 10-K
PARIS, Jan. 15, 2025 (GLOBE NEWSWIRE) -- Constellium SE (NYSE: CSTM) ("Constellium" or the "Company") announced today that, while it remains a foreign private issuer under applicable rules, it intends to voluntarily file its SEC reports on U.S. domestic issuer forms. As a result, beginning in 2025, Constellium will voluntarily file annual reports on Form 10-K, quarterly reports on Form 10-Q, and current reports on Form 8-K. In addition, Constellium expects to voluntarily file the proxy statement for its 2025 annual general meeting with the SEC and provide certain disclosures in accordance with the requirements of Schedule 14A under the Exchange Act (utilizing Form 8-K).

Constellium SE (CSTM) Q3 2024 Earnings Call Transcript
Constellium SE (NYSE:CSTM ) Q3 2024 Earnings Call Transcript October 23, 2024 10:00 AM ET Company Participants Jason Hershiser - Director, Investor Relations Jean Germain - Chief Executive Officer Jack Guo - Chief Financial Officer Conference Call Participants Katja Jancic - BMO Capital Markets Bill Peterson - JPMorgan Timna Tanners - Wolfe Research Josh Sullivan - The Benchmark Company Operator Hello, everyone and welcome to the Constellium Third Quarter 2024 Earnings Call. My name is Drew, and I will be coordinating your call today.


Constellium Showcases its Leading Aluminium Solutions at ALUMINIUM 2024 in Düsseldorf
PARIS, Oct. 08, 2024 (GLOBE NEWSWIRE) -- Constellium SE (NYSE: CSTM) is exhibiting at ALUMINIUM 2024 (Hall 3, Booth 3A49), the world's premier trade fair for the aluminium industry, taking place October 8-10 in Düsseldorf.

Constellium Partners with ISN® for Contractor Management in North America
DALLAS--(BUSINESS WIRE)--ISN, the global leader in contractor and supplier information management services, announced that Constellium has selected ISNetworld as its primary contractor information management platform. ISN will assist Constellium with streamlining all aspects of its contractor management processes in North America, including online training, badging and scanning at its sites, and Training Qualifications (TQ). “At Constellium, safety, sustainability and operational excellence are.

Constellium Receives Supplier of the Year Award from Stellantis for Strong Commitment to Corporate Social Responsibility
PARIS, Oct. 03, 2024 (GLOBE NEWSWIRE) -- Constellium SE (NYSE: CSTM) is proud to announce that it has received the Supplier of the Year Award from Stellantis for its strong commitment to Corporate Social Responsibility (CSR), applying strict requirements to its business and its supply chain, and receiving positive ratings from renowned international rating agencies. This award also recognizes Constellium's overall best-in-class performance in supplying this customer. A long-time partner of Stellantis' brands, Constellium provides aluminium automotive body sheet products and extrusion-based structural solutions for numerous vehicle platforms in Europe and the U.S.

Constellium Announces Partnership with Tesem to "Closing the Loop" on Aluminium Recycling
PARIS, Sept. 26, 2024 (GLOBE NEWSWIRE) -- Constellium is pleased to announce a partnership with Tesem, a global leader in luxury packaging, to advance sustainable aluminium production through an initiative called "Closing the Loop.


Constellium Achieves Aluminium Stewardship Initiative Certification for All Operations Worldwide
PARIS, Sept. 10, 2024 (GLOBE NEWSWIRE) -- Constellium SE (NYSE: CSTM) today announced it has achieved Aluminium Stewardship Initiative (ASI) Performance Standard Certification for all its operations, and for its corporate office in Paris.

Constellium Prices Company's Notes Offering
PARIS, July 25, 2024 (GLOBE NEWSWIRE) -- Constellium SE (NYSE: CSTM) (“Constellium” or the “Company”) announced today that the Company has priced a private offering (the “Notes Offering”) of €300 million of euro denominated senior unsecured notes due 2032 (the “Euro Notes”) and $350 million of U.S. dollar denominated senior unsecured notes due 2032 (the “USD Notes” and together with the Euro Notes, the “Notes”).

Constellium Launches Proposed Senior Notes Offering
PARIS, July 24, 2024 (GLOBE NEWSWIRE) -- Constellium SE (NYSE: CSTM) (“Constellium” or the “Company”) announced today the commencement of a proposed private offering of approximately €300 million of euro denominated senior unsecured notes due 2032 (the “Euro Notes”) and $350 million of U.S. dollar denominated senior unsecured notes due 2032 (together with the Euro Notes, the “Notes”), subject to market and other conditions (the “Notes Offering”).

Constellium SE (CSTM) Q2 2024 Earnings Call Transcript
Constellium SE (NYSE:CSTM ) Q2 2024 Earnings Conference Call July 23, 2024 9:00 AM ET Company Participants Jason Hershiser - Director of IR Jean-Marc Germain - CEO Jack Guo - CFO Conference Call Participants Katja Jancic - BMO Capital Markets Timna Tanners - Wolfe Research Bill Peterson - JPMorgan Corinne Blanchard - Deutsche Bank Josh Sullivan - The Benchmark Company Operator Good morning, everyone and welcome to the Constellium Second Quarter 2024 Results Call. My name is Angela, and I will be coordinating your call today.

Constellium's Muscle Shoals facility receives Department of Defense grant to increase casting capacity
PARIS, July 23, 2024 (GLOBE NEWSWIRE) -- Constellium (NYSE: CSTM) announced today that its facility in Muscle Shoals, Alabama has been selected by the U.S. Department of Defense (DoD) for an investment of $23 million under Title III, Defense Production Act to rebuild its Direct Chill aluminium casting center.

Constellium Reports Second Quarter and First Half 2024 Results
PARIS, July 23, 2024 (GLOBE NEWSWIRE) -- Constellium SE (NYSE: CSTM) ("Constellium" or the "Company") today reported results for the second quarter ended June 30, 2024. As a reminder of the press release issued on February 21, 2024 and following the SEC comment letter review process, Constellium will no longer report Value-Added Revenue (VAR), a Non-GAAP financial measure.

Similar Companies
Related Metrics
Explore detailed financial metrics and analysis for CSTM.