Consolidated Water Key Executives
This section highlights Consolidated Water's key executives, including their titles and compensation details.
Find Contacts at Consolidated Water
(Showing 0 of )
Consolidated Water Earnings
This section highlights Consolidated Water's earnings, including key dates, EPS, earnings reports, and earnings call transcripts.
Next Earnings Date
Last Earnings Results
Earnings Call Transcripts
| Transcript | Quarter | Year | Date | Estimated EPS | Actual EPS |
|---|---|---|---|---|---|
| Read Transcript | Q4 | 2024 | 2025-03-18 | N/A | N/A |
| Read Transcript | Q3 | 2024 | 2024-11-15 | N/A | N/A |
| Read Transcript | Q2 | 2024 | 2024-08-15 | N/A | N/A |
| Read Transcript | Q1 | 2024 | 2024-05-16 | N/A | N/A |
| Read Transcript | Q4 | 2023 | 2024-03-28 | $0.44 | $0.63 |
| Read Transcript | Q3 | 2023 | 2023-11-10 | N/A | N/A |
| Read Transcript | Q2 | 2023 | 2023-08-11 | N/A | N/A |
| Read Transcript | Q1 | 2023 | 2023-05-16 | N/A | N/A |

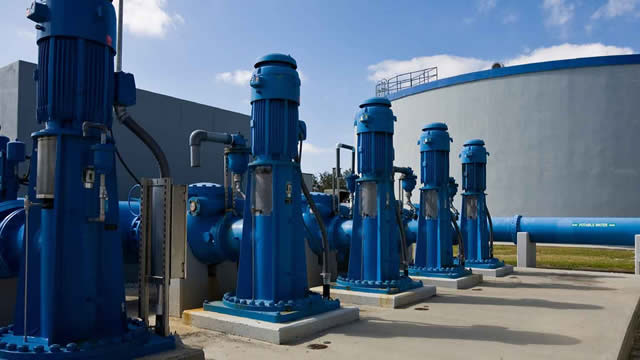
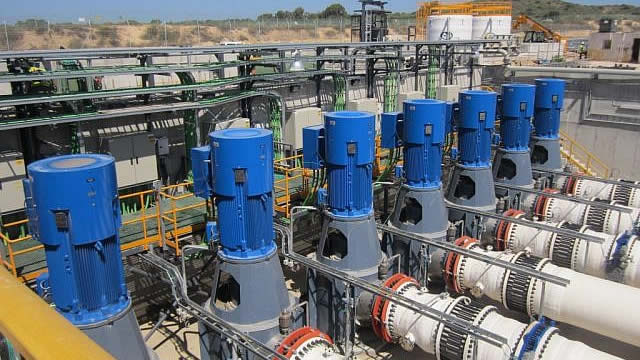
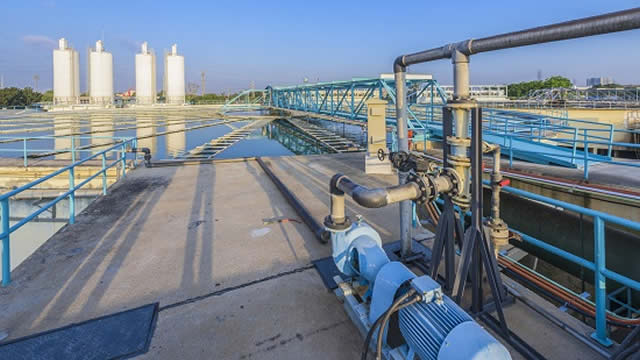
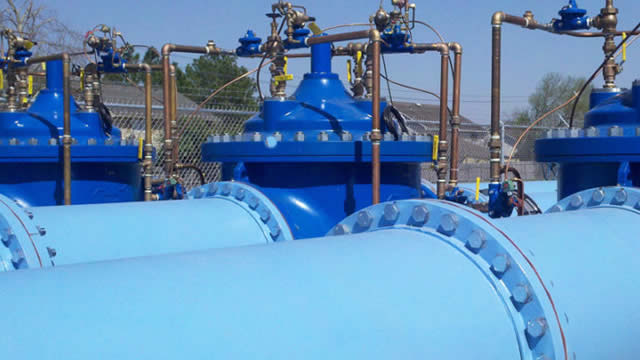
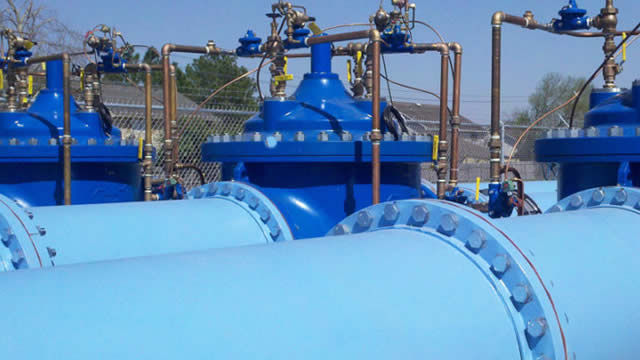
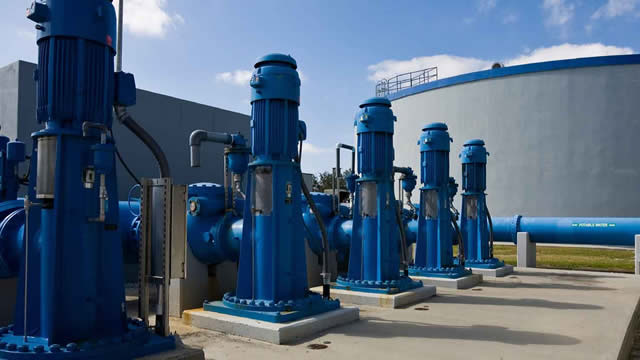
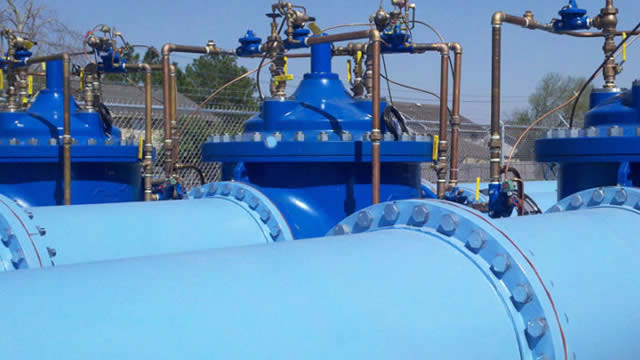
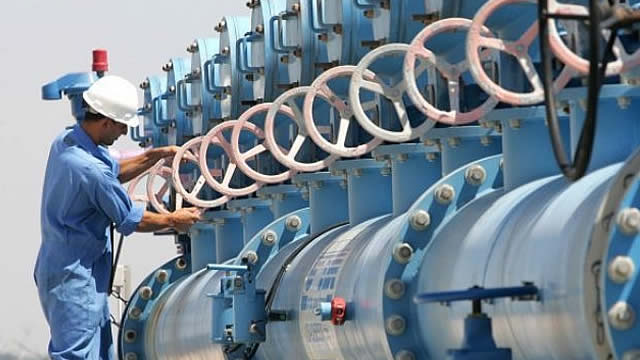
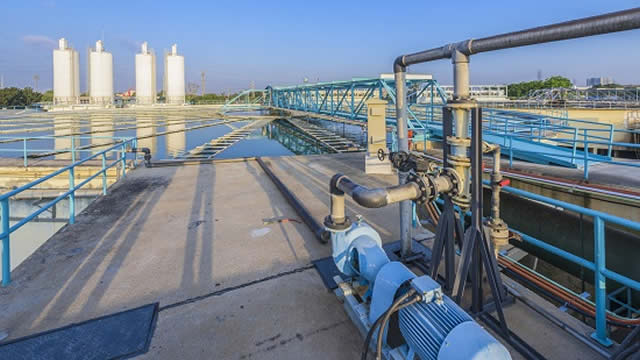
Consolidated Water Co. Ltd., together with its subsidiaries, designs, constructs, manages, and operates water production and water treatment plants primarily in the Cayman Islands, the Bahamas, and the United States. The company operates through four segments: Retail, Bulk, Services, and Manufacturing. It uses reverse osmosis technology to produce potable water from seawater. The company produces and supplies water to end-users, including residential, commercial, and government customers, as well as government-owned distributors. It also provides design, engineering, construction, procurement, and management services for desalination projects and water treatment plants, as well as management and engineering services relating to municipal water distribution and treatment. In addition, the company manufactures and services a range of water-related products, including reverse osmosis desalination equipment, membrane separation equipment, filtration equipment, piping systems, vessels, and custom fabricated components; and provides design, engineering, consulting, management, inspection, training, and equipment maintenance services for commercial, municipal, and industrial water production, supply, and treatment, as well as desalination and wastewater treatment. Consolidated Water Co. Ltd. was incorporated in 1973 and is headquartered in Grand Cayman, the Cayman Islands.
$24.45
Stock Price
$388.14M
Market Cap
307
Employees
Grand Cayman, None
Location
Financial Statements
Access annual & quarterly financial statements for Consolidated Water, including income statements, balance sheets, and cash flow statements..
Annual Income Statement
| Breakdown | December 31, 2024 | December 31, 2023 | December 31, 2022 | December 31, 2021 | December 31, 2020 |
|---|---|---|---|---|---|
| Revenue | $133.97T | $180.21M | $94.10M | $66.86M | $72.63M |
| Cost of Revenue | $88.34T | $118.28M | $63.75M | $43.36M | $45.86M |
| Gross Profit | $45.62T | $61.93M | $30.36M | $23.51M | $26.77M |
| Gross Profit Ratio | 34.06% | 34.40% | 32.26% | 35.20% | 36.86% |
| Research and Development Expenses | $- | $- | $395.66K | $- | $- |
| General and Administrative Expenses | $27.54T | $6.31M | $21.07M | $18.35M | $18.43M |
| Selling and Marketing Expenses | $- | $2.09M | $395.66K | $- | $- |
| Selling General and Administrative Expenses | $27.54T | $23.11M | $21.07M | $18.35M | $18.43M |
| Other Expenses | $- | $- | $89.94K | $52.77K | $71.83K |
| Operating Expenses | $27.54T | $24.76M | $21.07M | $18.35M | $18.43M |
| Cost and Expenses | $115.88T | $143.04M | $84.82M | $61.71M | $64.29M |
| Interest Income | $2.09M | $696.41K | $447.19K | $684.81K | $540.10K |
| Interest Expense | $101.85K | $145.28K | $46.55K | $10.25K | $9.67K |
| Depreciation and Amortization | $6.69M | $6.58M | $6.19M | $6.92M | $7.41M |
| EBITDA | $18.28T | $44.72M | $15.97M | $10.57M | $16.34M |
| EBITDA Ratio | 13.65% | 24.81% | 10.55% | 8.93% | 13.01% |
| Operating Income | $18.28T | $37.17M | $3.74M | $-948.56K | $2.05M |
| Operating Income Ratio | 13.65% | 20.62% | 3.97% | -1.42% | 2.82% |
| Total Other Income Expenses Net | $2.39T | $828.31K | $-392.29K | $-1.52M | $1.10M |
| Income Before Tax | $20.68T | $38.00M | $9.74M | $3.63M | $9.43M |
| Income Before Tax Ratio | 15.44% | 21.08% | 10.35% | 5.44% | 12.98% |
| Income Tax Expense | $2.22M | $6.75M | $396.74K | $-447.98K | $86.72K |
| Net Income | $28.24M | $29.59M | $9.34M | $4.08M | $9.34M |
| Net Income Ratio | 0.00% | 16.42% | 9.93% | 6.11% | 12.87% |
| EPS | $1.78 | $1.88 | $0.61 | $0.27 | $0.62 |
| EPS Diluted | $1.77 | $1.86 | $0.61 | $0.27 | $0.61 |
| Weighted Average Shares Outstanding | 15.83M | 15.74M | 15.29M | 15.29M | 15.12M |
| Weighted Average Shares Outstanding Diluted | 15.99M | 15.87M | 15.40M | 15.40M | 15.22M |
| SEC Filing | Source | Source | Source | Source | Source |
| Breakdown | December 31, 2024 | September 30, 2024 | June 30, 2024 | March 31, 2024 | December 31, 2023 | September 30, 2023 | June 30, 2023 | March 31, 2023 | December 31, 2022 | September 30, 2022 | June 30, 2022 | March 31, 2022 | December 31, 2021 | September 30, 2021 | June 30, 2021 | March 31, 2021 | December 31, 2020 | September 30, 2020 | June 30, 2020 | March 31, 2020 |
|---|---|---|---|---|---|---|---|---|---|---|---|---|---|---|---|---|---|---|---|---|
| Revenue | $133.97T | $33.39M | $32.48M | $39.69M | $53.25M | $49.85M | $44.24M | $32.87M | $28.43M | $25.05M | $21.07M | $19.56M | $16.65M | $16.41M | $16.70M | $17.10M | $15.15M | $17.67M | $19.09M | $20.73M |
| Cost of Revenue | $88.34T | $21.76M | $20.86M | $25.81M | $33.96M | $33.24M | $28.77M | $22.31M | $19.54M | $18.21M | $13.59M | $12.41M | $11.02M | $10.72M | $10.64M | $10.98M | $10.34M | $11.45M | $11.78M | $12.29M |
| Gross Profit | $45.62T | $11.63M | $11.62M | $13.88M | $19.29M | $16.61M | $15.46M | $10.56M | $8.89M | $6.84M | $7.48M | $7.15M | $5.63M | $5.69M | $6.06M | $6.13M | $4.81M | $6.22M | $7.30M | $8.44M |
| Gross Profit Ratio | 34.06% | 34.84% | 35.80% | 35.00% | 36.20% | 33.30% | 35.00% | 32.10% | 31.30% | 27.30% | 35.50% | 36.50% | 33.80% | 34.70% | 36.30% | 35.80% | 31.75% | 35.18% | 38.26% | 40.72% |
| Research and Development Expenses | $- | $- | $- | $- | $- | $- | $- | $- | $- | $- | $- | $- | $- | $- | $- | $- | $- | $- | $- | $- |
| General and Administrative Expenses | $27.54T | $6.96M | $6.61M | $6.56M | $4.77M | $5.87M | $5.98M | $6.04M | $4.92M | $5.61M | $4.93M | $4.87M | $3.62M | $4.36M | $4.72M | $4.76M | $3.35M | $4.81M | $4.86M | $5.15M |
| Selling and Marketing Expenses | $- | $- | $- | $- | $2.09M | $- | $- | $- | $395.66K | $- | $- | $- | $- | $- | $- | $- | $- | $- | $- | $- |
| Selling General and Administrative Expenses | $27.54T | $6.96M | $6.61M | $6.56M | $6.86M | $5.87M | $5.98M | $6.04M | $4.92M | $5.61M | $4.93M | $4.87M | $3.62M | $4.36M | $4.72M | $4.76M | $3.35M | $4.81M | $4.86M | $5.15M |
| Other Expenses | $-39.98K | $- | $- | $39.98K | $19.93K | $24.19K | $31.82K | $31.53K | $746.49K | $-2.63K | $61.14K | $26.23K | $17.48K | $15.71K | $15.33K | $4.25K | $12.48K | $15.31K | $-390.38K | $160.42K |
| Operating Expenses | $27.54T | $6.96M | $6.61M | $6.56M | $6.86M | $5.87M | $5.98M | $6.04M | $5.67M | $5.61M | $4.93M | $4.87M | $4.50M | $4.36M | $4.72M | $4.76M | $4.37M | $4.81M | $4.86M | $5.15M |
| Cost and Expenses | $115.88T | $28.71M | $27.47M | $32.38M | $40.82M | $39.11M | $34.76M | $28.35M | $25.20M | $23.82M | $18.52M | $17.28M | $15.52M | $15.08M | $15.36M | $15.74M | $14.71M | $16.26M | $16.65M | $17.44M |
| Interest Income | $752.39K | $626.80K | $380.85K | $334.14K | $300.06K | $196.57K | $86.14K | $113.64K | $98.88K | $56.70K | $110.92K | $180.69K | $180.92K | $168.88K | $174.65K | $160.36K | $129.08K | $164.76K | $109.82K | $136.44K |
| Interest Expense | $2.11K | $32.80K | $33.44K | $33.50K | $37.17K | $34.02K | $36.25K | $37.84K | $37.70K | $2.04K | $2.72K | $4.08K | $2.53K | $2.22K | $2.64K | $2.86K | $2.26K | $2.07K | $2.82K | $2.53K |
| Depreciation and Amortization | $1.67M | $1.68M | $1.67M | $1.67M | $1.71M | $1.59M | $1.68M | $1.59M | $1.54M | $1.52M | $1.58M | $1.55M | $1.58M | $1.66M | $1.81M | $1.86M | $1.66M | $1.89M | $1.80M | $1.88M |
| EBITDA | $3.59M | $7.32M | $7.13M | $9.44M | $14.47M | $12.60M | $11.32M | $6.32M | $4.68M | $2.59M | $4.54M | $4.16M | $3.63M | $3.15M | $478.26K | $3.27M | $2.45M | $3.47M | $3.01M | $5.63M |
| EBITDA Ratio | 0.00% | 21.91% | 21.95% | 22.65% | 26.56% | 21.55% | 21.80% | 14.35% | 11.73% | 5.24% | 13.05% | 12.93% | 8.04% | 9.38% | 9.25% | 9.05% | 6.42% | 9.14% | 11.58% | 17.46% |
| Operating Income | $18.28T | $4.88M | $5.01M | $7.31M | $12.43M | $10.74M | $9.48M | $4.53M | $-767.38K | $2.20M | $2.55M | $2.29M | $1.12M | $1.33M | $-1.56M | $1.11M | $447.39K | $1.40M | $-588.30K | $3.29M |
| Operating Income Ratio | 13.65% | 14.62% | 15.44% | 18.43% | 23.35% | 21.55% | 21.43% | 13.78% | -2.70% | 8.78% | 12.12% | 11.72% | 6.74% | 8.12% | -9.32% | 6.51% | 2.95% | 7.95% | -3.08% | 15.86% |
| Total Other Income Expenses Net | $-18.28T | $724.04K | $415.30K | $418.18K | $-584.21K | $236.07K | $129.13K | $157.06K | $-117.86K | $-168.98K | $397.98K | $319.73K | $923.71K | $152.17K | $233.11K | $314.61K | $549.24K | $245.49K | $-3.49M | $169.34K |
| Income Before Tax | $1.91M | $5.60M | $5.43M | $7.73M | $12.72M | $10.98M | $9.61M | $4.69M | $3.11M | $1.07M | $2.95M | $2.61M | $2.05M | $1.48M | $-1.32M | $1.43M | $996.63K | $1.65M | $-743.42K | $3.46M |
| Income Before Tax Ratio | 0.00% | 16.78% | 16.72% | 19.48% | 23.89% | 22.02% | 21.72% | 14.25% | 10.92% | 4.26% | 14.01% | 13.35% | 12.29% | 9.04% | -7.92% | 8.35% | 6.58% | 9.34% | -3.89% | 16.67% |
| Income Tax Expense | $42.68K | $490.21K | $1.06M | $621.70K | $2.38M | $1.98M | $1.94M | $449.49K | $313.70K | $26.62K | $10.15K | $46.27K | $-427.25K | $-11.23K | $-6.84K | $-2.66K | $-60.46K | $-263.17K | $204.27K | $206.08K |
| Net Income | $28.24T | $4.45M | $15.85M | $6.47M | $9.84M | $8.61M | $7.32M | $3.81M | $2.79M | $1.04M | $2.29M | $2.57M | $1.27M | $285.59K | $-1.66M | $988.77K | $515.93K | $1.43M | $-1.13M | $2.89M |
| Net Income Ratio | 21.08% | 13.34% | 48.80% | 16.31% | 18.48% | 17.26% | 16.56% | 11.60% | 9.82% | 4.16% | 10.87% | 13.12% | 7.60% | 1.74% | -9.97% | 5.78% | 3.41% | 8.12% | -5.91% | 13.94% |
| EPS | $-1.69 | $0.28 | $1.00 | $0.41 | $0.62 | $0.55 | $0.47 | $0.24 | $0.18 | $0.07 | $0.15 | $0.17 | $0.16 | $0.02 | $-0.11 | $0.06 | $0.41 | $0.09 | $-0.07 | $0.19 |
| EPS Diluted | $-1.67 | $0.28 | $0.99 | $0.40 | $0.62 | $0.54 | $0.46 | $0.24 | $0.18 | $0.07 | $0.15 | $0.17 | $0.16 | $0.02 | $-0.11 | $0.06 | $0.41 | $0.09 | $-0.07 | $0.19 |
| Weighted Average Shares Outstanding | 15.83M | 15.83M | 15.83M | 15.83M | 15.75M | 15.74M | 15.74M | 15.72M | 15.30M | 15.29M | 15.29M | 15.29M | 15.21M | 15.21M | 15.16M | 15.20M | 15.12M | 15.12M | 15.11M | 15.11M |
| Weighted Average Shares Outstanding Diluted | 15.99M | 15.99M | 15.98M | 15.98M | 15.75M | 15.93M | 15.91M | 15.89M | 15.30M | 15.45M | 15.44M | 15.44M | 15.35M | 15.35M | 15.20M | 15.36M | 15.27M | 15.27M | 15.27M | 15.27M |
| SEC Filing | Source | Source | Source | Source | Source | Source | Source | Source | Source | Source | Source | Source | Source | Source | Source | Source | Source | Source | Source | Source |
Annual Balance Sheet
| Breakdown | December 31, 2024 | December 31, 2023 | December 31, 2022 | December 31, 2021 | December 31, 2020 |
|---|---|---|---|---|---|
| Cash and Cash Equivalents | $99.35M | $42.62M | $50.71M | $40.36M | $43.79M |
| Short Term Investments | $99.35T | $- | $- | $2.50M | $- |
| Cash and Short Term Investments | $99.35T | $42.62M | $50.71M | $42.86M | $43.79M |
| Net Receivables | $39.58T | $59.78M | $29.96M | $27.84M | $22.00M |
| Inventory | $8.96T | $6.04M | $5.73M | $2.50M | $3.21M |
| Other Current Assets | $9.90T | $4.27M | $6.17M | $3.86M | $3.92M |
| Total Current Assets | $157.79T | $112.71M | $92.57M | $76.93M | $72.93M |
| Property Plant Equipment Net | $55.62T | $58.51M | $58.29M | $56.34M | $59.46M |
| Goodwill | $12.86M | $12.86M | $10.43M | $10.43M | $13.33M |
| Intangible Assets | $2.70M | $3.35M | $2.82M | $3.40M | $4.15M |
| Goodwill and Intangible Assets | $15.56T | $16.21M | $13.24M | $13.83M | $17.47M |
| Long Term Investments | $- | $1.41M | $1.55M | $1.72M | $2.09M |
| Tax Assets | $- | $- | $967.45K | $128.00K | $226.75K |
| Other Non-Current Assets | $14.34T | $29.58M | $26.38M | $28.08M | $27.37M |
| Total Non-Current Assets | $85.53T | $105.72M | $100.43M | $100.09M | $106.62M |
| Other Assets | $- | $- | $- | $- | $- |
| Total Assets | $243.31T | $218.44M | $193.01M | $177.03M | $179.56M |
| Account Payables | $9.06M | $11.60M | $8.44M | $2.83M | $2.74M |
| Short Term Debt | $761.26K | $648.90K | $661.82K | $654.83K | $498.00K |
| Tax Payables | $- | $- | $- | $- | $- |
| Deferred Revenue | $9.49M | $6.55M | $9.12M | $1.10M | $461.87K |
| Other Current Liabilities | $24.94T | $5.10M | $4.44M | $3.10M | $3.24M |
| Total Current Liabilities | $24.94T | $23.90M | $22.66M | $7.69M | $6.94M |
| Long Term Debt | $2.63M | $2.02M | $1.81M | $2.29M | $1.11M |
| Deferred Revenue Non-Current | $- | $- | $- | $7.82K | $692.50K |
| Deferred Tax Liabilities Non-Current | $210.89K | $530.78K | $560.31K | $1.24M | $1.44M |
| Other Non-Current Liabilities | $3.07T | $153.00K | $219.11K | $1.39M | $2.50M |
| Total Non-Current Liabilities | $3.07T | $2.70M | $2.59M | $3.67M | $3.60M |
| Other Liabilities | $- | $1 | $- | $- | $- |
| Total Liabilities | $28.00T | $26.61M | $25.24M | $11.36M | $10.54M |
| Preferred Stock | $26.40K | $26.58K | $20.63K | $17.18K | $18.64K |
| Common Stock | $9.51T | $9.46M | $9.19M | $9.15M | $9.09M |
| Retained Earnings | $106.88T | $85.15M | $61.25M | $60.60M | $64.91M |
| Accumulated Other Comprehensive Income Loss | $- | $- | $- | $-0 | $- |
| Other Total Stockholders Equity | $93.58T | $92.19M | $89.21M | $87.81M | $86.89M |
| Total Stockholders Equity | $209.96T | $186.83M | $159.67M | $157.58M | $160.91M |
| Total Equity | $209.96T | $191.83M | $167.76M | $165.67M | $169.01M |
| Total Liabilities and Stockholders Equity | $243.31T | $218.44M | $193.01M | $177.03M | $179.56M |
| Minority Interest | $5.35M | $5.00M | $8.10M | $8.09M | $8.10M |
| Total Liabilities and Total Equity | $243.31T | $218.44M | $193.01M | $177.03M | $179.56M |
| Total Investments | $1.50M | $1.41M | $1.55M | $4.22M | $2.09M |
| Total Debt | $3.46M | $2.67M | $2.47M | $2.94M | $1.61M |
| Net Debt | $-95.89M | $-39.95M | $-48.24M | $-37.41M | $-42.19M |
Balance Sheet Charts
| Breakdown | December 31, 2024 | September 30, 2024 | June 30, 2024 | March 31, 2024 | December 31, 2023 | September 30, 2023 | June 30, 2023 | March 31, 2023 | December 31, 2022 | September 30, 2022 | June 30, 2022 | March 31, 2022 | December 31, 2021 | September 30, 2021 | June 30, 2021 | March 31, 2021 | December 31, 2020 | September 30, 2020 | June 30, 2020 | March 31, 2020 |
|---|---|---|---|---|---|---|---|---|---|---|---|---|---|---|---|---|---|---|---|---|
| Cash and Cash Equivalents | $99.35M | $104.87M | $96.67M | $46.18M | $42.62M | $48.85M | $47.69M | $51.10M | $50.71M | $51.09M | $49.09M | $43.14M | $40.36M | $40.40M | $41.21M | $42.78M | $43.79M | $38.18M | $34.96M | $32.31M |
| Short Term Investments | $99.35T | $- | $- | $- | $- | $- | $- | $- | $- | $- | $2.52M | $2.52M | $2.50M | $2.50M | $- | $- | $- | $- | $- | $- |
| Cash and Short Term Investments | $99.35T | $104.87M | $96.67M | $46.18M | $42.62M | $48.85M | $47.69M | $51.10M | $50.71M | $51.09M | $51.61M | $45.66M | $42.86M | $42.90M | $41.21M | $42.78M | $43.79M | $38.18M | $34.96M | $32.31M |
| Net Receivables | $39.58T | $39.16M | $45.08M | $65.10M | $59.78M | $47.09M | $38.50M | $35.68M | $29.96M | $26.01M | $23.78M | $27.83M | $27.84M | $26.87M | $26.53M | $25.36M | $22.00M | $25.60M | $29.06M | $27.59M |
| Inventory | $8.96T | $3.93M | $4.56M | $4.18M | $6.04M | $7.92M | $9.84M | $9.09M | $5.73M | $4.05M | $3.57M | $3.10M | $2.50M | $2.55M | $2.50M | $2.32M | $3.21M | $3.77M | $5.07M | $6.28M |
| Other Current Assets | $9.90T | $5.99M | $4.45M | $3.31M | $4.27M | $5.73M | $7.19M | $5.61M | $6.17M | $5.35M | $4.40M | $2.67M | $3.86M | $4.07M | $4.86M | $3.35M | $3.92M | $4.02M | $1.74M | $2.35M |
| Total Current Assets | $157.79T | $153.95M | $150.76M | $118.77M | $112.71M | $109.58M | $103.23M | $101.48M | $92.57M | $86.50M | $83.36M | $79.26M | $76.93M | $76.38M | $75.10M | $73.81M | $72.93M | $71.57M | $70.82M | $68.54M |
| Property Plant Equipment Net | $55.62T | $59.33M | $59.15M | $57.72M | $58.51M | $58.23M | $58.41M | $58.28M | $58.29M | $55.03M | $55.27M | $55.62M | $56.34M | $57.34M | $58.35M | $59.57M | $59.46M | $60.95M | $61.46M | $65.61M |
| Goodwill | $12.86M | $12.86M | $12.86M | $12.86M | $12.86M | $10.43M | $10.43M | $10.43M | $10.43M | $10.43M | $10.43M | $10.43M | $10.43M | $10.43M | $10.43M | $13.33M | $13.33M | $13.33M | $13.33M | $13.33M |
| Intangible Assets | $2.70M | $2.86M | $3.02M | $3.19M | $3.35M | $2.41M | $2.55M | $2.68M | $2.82M | $2.96M | $3.11M | $3.25M | $3.40M | $3.56M | $3.76M | $3.95M | $4.15M | $4.36M | $4.57M | $4.79M |
| Goodwill and Intangible Assets | $15.56T | $15.72M | $15.89M | $16.05M | $16.21M | $12.83M | $12.97M | $13.11M | $13.24M | $13.38M | $13.53M | $13.68M | $13.83M | $13.99M | $14.18M | $17.27M | $17.47M | $17.69M | $17.90M | $18.11M |
| Long Term Investments | $- | $1.38M | $1.31M | $1.26M | $1.41M | $1.39M | $1.34M | $1.29M | $1.55M | $1.54M | $1.51M | $1.49M | $1.72M | $1.70M | $1.67M | $1.66M | $2.09M | $1.70M | $1.99M | $1.94M |
| Tax Assets | $- | $- | $- | $- | $1.13M | $- | $- | $- | $967.45K | $- | $404.00K | $- | $128.00K | $- | $- | $- | $- | $- | $21.13M | $24.16M |
| Other Non-Current Assets | $14.34T | $7.98M | $8.06M | $29.36M | $29.58M | $29.57M | $29.14M | $27.45M | $26.38M | $28.55M | $28.51M | $28.34M | $28.08M | $27.41M | $27.41M | $27.46M | $27.60M | $28.57M | $7.53M | $7.33M |
| Total Non-Current Assets | $85.53T | $84.42M | $84.40M | $104.39M | $106.86M | $102.02M | $101.85M | $100.13M | $100.43M | $98.51M | $99.22M | $99.13M | $100.09M | $100.43M | $101.61M | $105.97M | $106.62M | $108.90M | $110.00M | $117.15M |
| Other Assets | $- | $- | $1 | $- | $1 | $- | $- | $- | $- | $- | $- | $- | $- | $- | $- | $- | $- | $- | $- | $- |
| Total Assets | $243.31T | $238.37M | $235.16M | $223.17M | $219.57M | $211.60M | $205.08M | $201.61M | $193.01M | $185.01M | $182.58M | $178.39M | $177.03M | $176.81M | $176.71M | $179.77M | $179.56M | $180.47M | $180.82M | $185.69M |
| Account Payables | $9.06M | $7.11M | $8.10M | $11.15M | $11.60M | $11.44M | $10.16M | $9.80M | $8.44M | $6.33M | $4.05M | $3.42M | $2.83M | $3.15M | $2.65M | $2.97M | $2.74M | $3.08M | $3.61M | $4.36M |
| Short Term Debt | $761.26K | $1.42M | $1.41M | $946.23K | $648.90K | $1.06M | $1.21M | $1.19M | $661.82K | $1.20M | $1.21M | $1.17M | $654.83K | $1.18M | $1.17M | $979.63K | $498.00K | $1.13M | $1.30M | $1.57M |
| Tax Payables | $- | $- | $- | $- | $- | $- | $- | $- | $- | $- | $- | $- | $- | $- | $- | $- | $- | $- | $- | $- |
| Deferred Revenue | $9.49M | $6.19M | $5.93M | $5.72M | $6.55M | $9.92M | $13.34M | $15.81M | $9.12M | $4.16M | $3.57M | $998.17K | $1.10M | $45.23K | $14.58K | $45.55K | $461.87K | $818.76K | $899.94K | $903.69K |
| Other Current Liabilities | $24.94T | $5.37M | $4.09M | $5.99M | $5.10M | $4.06M | $3.01M | $4.08M | $4.44M | $3.69M | $2.96M | $2.82M | $3.10M | $2.75M | $2.50M | $2.46M | $3.24M | $2.69M | $2.19M | $1.61M |
| Total Current Liabilities | $24.94T | $20.09M | $19.53M | $23.80M | $23.90M | $26.47M | $27.72M | $30.87M | $22.66M | $15.38M | $11.79M | $8.41M | $7.69M | $7.08M | $6.33M | $6.41M | $6.94M | $7.72M | $8.00M | $8.45M |
| Long Term Debt | $2.63M | $2.88M | $3.06M | $1.89M | $2.02M | $1.61M | $3.27M | $1.65M | $1.81M | $3.59M | $3.87M | $4.13M | $2.29M | $4.78M | $5.08M | $5.20M | $1.11M | $2.28M | $2.01M | $6.49M |
| Deferred Revenue Non-Current | $- | $- | $29.46K | $1.74M | $1.83M | $- | $- | $- | $- | $- | $2.92K | $- | $7.82K | $582.00K | $528.00K | $559.00K | $692.50K | $714.84K | $745.00K | $825.00K |
| Deferred Tax Liabilities Non-Current | $210.89K | $227.25K | $383.07K | $83.93K | $1.66M | $466.29K | $485.01K | $522.65K | $560.31K | $1.11M | $1.16M | $1.20M | $1.24M | $1.28M | $1.33M | $1.39M | $1.44M | $1.36M | $1.38M | $1.45M |
| Other Non-Current Liabilities | $3.07T | $191.42K | $153.00K | $153.00K | $1.82M | $153.00K | $-1.40M | $147.07K | $219.11K | $-1.58M | $-1.71M | $-1.85M | $1.38M | $-1.60M | $-1.80M | $-1.57M | $1.80M | $-281.99K | $-110.07K | $-2.27M |
| Total Non-Current Liabilities | $3.07T | $3.29M | $3.63M | $2.12M | $3.84M | $2.23M | $2.35M | $2.32M | $2.59M | $3.12M | $3.32M | $3.48M | $3.67M | $4.46M | $4.62M | $5.01M | $3.60M | $3.36M | $3.28M | $5.67M |
| Other Liabilities | $- | $- | $- | $- | $- | $- | $- | $- | $- | $- | $- | $- | $- | $- | $- | $- | $- | $- | $- | $- |
| Total Liabilities | $28.00T | $23.38M | $23.16M | $25.93M | $27.74M | $28.70M | $30.07M | $33.19M | $25.24M | $18.50M | $15.11M | $11.88M | $11.36M | $11.54M | $10.95M | $11.42M | $10.54M | $11.09M | $11.28M | $14.12M |
| Preferred Stock | $26.40K | $26.79K | $29.43K | $26.41K | $26.58K | $27.12K | $28.85K | $20.63K | $20.63K | $20.64K | $22.94K | $17.18K | $17.18K | $18.55K | $22.41K | $18.06K | $18.64K | $19.84K | $24.14K | $20.25K |
| Common Stock | $9.51T | $9.50M | $9.50M | $9.50M | $9.46M | $9.45M | $9.44M | $9.44M | $9.19M | $9.18M | $9.17M | $9.17M | $9.15M | $9.13M | $9.12M | $9.12M | $9.09M | $9.07M | $9.07M | $9.07M |
| Retained Earnings | $106.88T | $107.16M | $104.46M | $90.11M | $85.15M | $76.81M | $69.70M | $63.72M | $61.25M | $61.02M | $62.00M | $61.02M | $60.60M | $60.63M | $61.64M | $64.60M | $64.91M | $65.68M | $65.54M | $67.95M |
| Accumulated Other Comprehensive Income Loss | $- | $- | $- | $-26.41K | $-9.46M | $-27.12K | $-28.85K | $0 | $- | $- | $- | $- | $-0 | $0 | $0 | $- | $- | $- | $-0 | $0 |
| Other Total Stockholders Equity | $93.58T | $93.07M | $92.72M | $92.43M | $92.19M | $91.72M | $91.11M | $90.65M | $89.21M | $88.61M | $88.18M | $87.98M | $87.81M | $87.59M | $87.20M | $87.03M | $86.89M | $86.59M | $86.23M | $86.03M |
| Total Stockholders Equity | $209.96T | $209.77M | $206.71M | $192.07M | $186.83M | $178.00M | $170.28M | $163.83M | $159.67M | $158.83M | $159.38M | $158.18M | $157.58M | $157.36M | $157.98M | $160.77M | $160.91M | $161.37M | $160.86M | $163.08M |
| Total Equity | $209.96T | $214.99M | $212.00M | $197.24M | $191.83M | $182.89M | $175.01M | $168.42M | $167.76M | $166.51M | $167.47M | $166.51M | $165.67M | $165.28M | $165.76M | $168.35M | $169.01M | $169.38M | $169.54M | $171.57M |
| Total Liabilities and Stockholders Equity | $243.31T | $238.37M | $235.16M | $223.17M | $219.57M | $211.60M | $205.08M | $201.61M | $193.01M | $185.01M | $182.58M | $178.39M | $177.03M | $176.81M | $176.71M | $179.77M | $179.56M | $180.47M | $180.82M | $185.69M |
| Minority Interest | $5.35M | $5.22M | $5.30M | $5.17M | $5.00M | $4.89M | $4.73M | $4.59M | $8.10M | $7.68M | $8.10M | $8.33M | $8.09M | $7.91M | $7.78M | $7.58M | $8.10M | $8.02M | $8.68M | $8.50M |
| Total Liabilities and Total Equity | $243.31T | $238.37M | $235.16M | $223.17M | $219.57M | $211.60M | $205.08M | $201.61M | $193.01M | $185.01M | $182.58M | $178.39M | $177.03M | $176.81M | $176.71M | $179.77M | $179.56M | $180.47M | $180.82M | $185.69M |
| Total Investments | $1.50M | $1.38M | $1.31M | $1.26M | $1.41M | $1.39M | $1.34M | $1.29M | $1.55M | $1.54M | $4.03M | $4.00M | $4.22M | $4.20M | $1.67M | $1.66M | $2.09M | $1.70M | $1.99M | $1.94M |
| Total Debt | $3.46M | $3.66M | $3.85M | $2.45M | $2.67M | $2.20M | $2.38M | $2.30M | $2.47M | $2.51M | $2.67M | $2.75M | $2.94M | $3.08M | $3.22M | $3.20M | $1.61M | $1.80M | $1.75M | $4.13M |
| Net Debt | $-95.89M | $-101.21M | $-92.82M | $-43.73M | $-39.95M | $-46.64M | $-45.32M | $-48.80M | $-48.24M | $-48.58M | $-46.43M | $-40.40M | $-37.41M | $-37.32M | $-37.99M | $-39.58M | $-42.19M | $-36.38M | $-33.21M | $-28.19M |
Annual Cash Flow
| Breakdown | December 31, 2024 | December 31, 2023 | December 31, 2022 | December 31, 2021 | December 31, 2020 |
|---|---|---|---|---|---|
| Net Income | $28.24T | $30.16M | $6.97M | $1.51M | $4.44M |
| Depreciation and Amortization | $6.69T | $6.58M | $6.19M | $6.92M | $7.41M |
| Deferred Income Tax | $-319.89B | $-525.00K | $-4.22K | $-204.09K | $-221.83K |
| Stock Based Compensation | $1.40T | $1.93M | $1.42M | $977.23K | $1.16M |
| Change in Working Capital | $- | $-30.67M | $5.90M | $-5.89M | $1.33M |
| Accounts Receivables | $-1.80T | $-10.97M | $-2.12M | $-6.54M | $2.54T |
| Inventory | $-3.75T | $-891.40K | $-3.39M | $293.25K | $-102.55K |
| Accounts Payables | $-2.37T | $3.16M | $6.76M | $-112.60K | $-482.16K |
| Other Working Capital | $- | $-21.97M | $4.65M | $467.71K | $-2.54T |
| Other Non Cash Items | $2.17T | $492.65K | $862.28K | $3.66M | $3.22M |
| Net Cash Provided by Operating Activities | $38.17T | $7.97M | $21.33M | $6.97M | $17.34M |
| Investments in Property Plant and Equipment | $-6.70T | $-5.05M | $-7.54M | $-1.49M | $-1.73M |
| Acquisitions Net | $- | $-5.86M | $61.73K | $45.56K | $-9.40M |
| Purchases of Investments | $- | $- | $-2.52M | $-2.50M | $- |
| Sales Maturities of Investments | $- | $- | $5.02M | $-45.56K | $- |
| Other Investing Activities | $33.66T | $20.81K | $2.50M | $45.56K | $8.64K |
| Net Cash Used for Investing Activities | $26.96T | $-10.89M | $-4.98M | $-3.94M | $-11.12M |
| Debt Repayment | $-186.59K | $-135.48K | $-72.09K | $-49.73K | $-32.64K |
| Common Stock Issued | $- | $99.76K | $26.74K | $17.06K | $10.16K |
| Common Stock Repurchased | $- | $-1.83K | $-226 | $-16.80K | $-1.73K |
| Dividends Paid | $-6.30M | $-5.49M | $-5.16M | $-5.80M | $-5.15M |
| Other Financing Activities | $-6.71T | $97.93K | $-1.08M | $-10.76K | $8.43K |
| Net Cash Used Provided by Financing Activities | $-6.71T | $-5.52M | $-6.30M | $-5.86M | $-5.17M |
| Effect of Forex Changes on Cash | $- | $- | $307.80K | $-595.92K | $677.46K |
| Net Change in Cash | $-42.75T | $-8.09M | $10.35M | $-3.44M | $1.72M |
| Cash at End of Period | $-127.86B | $42.62M | $50.71M | $40.36M | $43.79M |
| Cash at Beginning of Period | $42.62T | $50.71M | $40.36M | $43.79M | $42.07M |
| Operating Cash Flow | $38.17T | $7.97M | $21.33M | $6.97M | $17.34M |
| Capital Expenditure | $-6.70T | $-5.05M | $-7.54M | $-1.49M | $-1.73M |
| Free Cash Flow | $31.48T | $2.92M | $13.79M | $5.48M | $15.61M |
Cash Flow Charts
| Breakdown | December 31, 2024 | September 30, 2024 | June 30, 2024 | March 31, 2024 | December 31, 2023 | September 30, 2023 | June 30, 2023 | March 31, 2023 | December 31, 2022 | September 30, 2022 | June 30, 2022 | March 31, 2022 | December 31, 2021 | September 30, 2021 | June 30, 2021 | March 31, 2021 | December 31, 2020 | September 30, 2020 | June 30, 2020 | March 31, 2020 |
|---|---|---|---|---|---|---|---|---|---|---|---|---|---|---|---|---|---|---|---|---|
| Net Income | $28.24T | $4.45M | $4.24M | $6.94M | $10.23M | $8.84M | $7.53M | $3.81M | $5.86M | $1.04M | $2.29M | $2.57M | $2.47M | $285.59K | $-1.66M | $988.77K | $515.93K | $1.43M | $-1.13M | $2.89M |
| Depreciation and Amortization | $6.69T | $1.68M | $1.67M | $1.67M | $1.71M | $1.59M | $1.68M | $1.59M | $6.19M | $1.52M | $1.58M | $1.55M | $1.58M | $1.66M | $1.81M | $1.86M | $1.66M | $1.89M | $1.80M | $1.88M |
| Deferred Income Tax | $-319.89B | $-155.82K | $299.14K | $-446.85K | $-525.00K | $- | $-37.65K | $-37.65K | $-4.22K | $- | $- | $- | $-204.09K | $- | $- | $- | $- | $- | $- | $- |
| Stock Based Compensation | $1.40T | $333.41K | $297.37K | $279.88K | $1.93M | $- | $461.69K | $463.89K | $1.42M | $- | $- | $- | $977.23K | $- | $- | $- | $1.16M | $- | $- | $- |
| Change in Working Capital | $-16.25M | $3.94M | $14.90M | $-2.59M | $-31.26M | $- | $9.10M | $61.66K | $5.29M | $- | $- | $97.28K | $-5.80M | $- | $- | $75.43K | $1.81M | $5.11M | $-5.11M | $-71.72K |
| Accounts Receivables | $-1.80T | $2.31M | $2.04M | $-3.72M | $-29.61M | $- | $5.72M | $-5.72M | $-2.12M | $- | $- | $- | $-5.88M | $- | $- | $- | $2.54M | $4.76M | $-4.76M | $- |
| Inventory | $-3.75T | $374.88K | $-591.77K | $1.75M | $-891.40K | $- | $3.38M | $61.66K | $-3.39M | $- | $- | $97.28K | $293.25K | $- | $- | $75.43K | $-102.55K | $-714.11K | $714.11K | $-71.72K |
| Accounts Payables | $-2.37T | $-3.85K | $-4.63M | $721.63K | $3.16T | $- | $-625.08K | $5.78M | $6.76M | $- | $- | $- | $- | $- | $- | $- | $- | $- | $- | $- |
| Other Working Capital | $7.91T | $1.26M | $18.08M | $-1.35M | $-760.60K | $- | $-2.47M | $-61.66K | $4.04M | $- | $- | $-97.28K | $-217.58K | $- | $- | $-75.43K | $-629.73K | $1.06M | $-1.06M | $71.72K |
| Other Non Cash Items | $2.17T | $99.03K | $-455.41K | $4.97M | $17.48M | $-7.01M | $-18.68M | $-122.82K | $-13.21M | $26.70K | $4.72M | $1.96M | $28.86K | $3.12M | $1.64M | $21.93K | $6.30M | $5.24M | $5.26M | $-3.11M |
| Net Cash Provided by Operating Activities | $38.17T | $10.35M | $20.96M | $5.95M | $-424.86K | $3.42M | $-373.00K | $5.35M | $5.53M | $2.59M | $8.59M | $4.62M | $2.50M | $3.41M | $-26.56K | $1.09M | $6.82M | $6.68M | $4.13M | $-288.65K |
| Investments in Property Plant and Equipment | $-6.70T | $-2.02M | $-1.19M | $-531.45K | $-924.11K | $-1.01M | $-1.73M | $-1.38M | $-4.59M | $-1.15M | $-1.07M | $-727.92K | $-516.74K | $-475.97K | $-204.49K | $-292.80K | $-156.94K | $-860.63K | $-194.49K | $-516.33K |
| Acquisitions Net | $-50.00K | $- | $- | $- | $-3.42M | $- | $5.47K | $-2.44M | $30.54K | $6.82K | $13.32K | $11.04K | $- | $700 | $3.36K | $41.50K | $9.40M | $-900.00K | $- | $-8.50M |
| Purchases of Investments | $- | $- | $- | $- | $- | $- | $- | $- | $2.52M | $-6.82K | $- | $-2.52M | $- | $- | $- | $- | $- | $- | $- | $- |
| Sales Maturities of Investments | $- | $- | $- | $- | $- | $- | $- | $- | $-5.02M | $2.52M | $- | $2.50M | $- | $- | $- | $- | $- | $- | $- | $- |
| Other Investing Activities | $33.66T | $443.34K | $33.26M | $- | $-1 | $- | $-0 | $15.94K | $2.50M | $6.82K | $13.32K | $11.04K | $2.45M | $-2.50M | $3.36K | $41.50K | $-9.39M | $- | $- | $450 |
| Net Cash Used for Investing Activities | $26.96T | $-1.58M | $32.07M | $-531.45K | $-4.34M | $-1.01M | $-1.72M | $-3.81M | $-4.56M | $1.37M | $-1.05M | $-735.38K | $-516.74K | $-2.98M | $-201.13K | $-251.30K | $-148.75K | $-1.76M | $-194.49K | $-9.02M |
| Debt Repayment | $140.39K | $-43.06K | $-47.31K | $-50.02K | $-53.13K | $-27.64K | $-27.49K | $-27.22K | $-20.53K | $-20.42K | $-16.54K | $-14.61K | $-13.89K | $-12.64K | $-12.56K | $-10.63K | $-9.77K | $-9.72K | $-9.66K | $-3.50K |
| Common Stock Issued | $- | $23.75K | $- | $730.52K | $-721.58K | $92.51K | $7.25K | $621.81K | $- | $24.04K | $2.70K | $- | $- | $15.35K | $- | $- | $-7.75M | $- | $- | $- |
| Common Stock Repurchased | $5.17K | $- | $-2.28K | $-2.89K | $-5.27M | $- | $-1.83K | $5.36M | $-226 | $- | $- | $- | $-1.94K | $- | $- | $-7.51K | $-584 | $-1.14K | $- | $- |
| Dividends Paid | $-1.77M | $-1.50M | $-1.53M | $-1.50M | $-1.50M | $-1.34M | $-1.34M | $-1.31M | $-1.31M | $-1.25M | $-1.30M | $-1.30M | $-1.93M | $-1.28M | $-1.30M | $-1.29M | $-1.29M | $-1.29M | $-1.29M | $-1.28M |
| Other Financing Activities | $-6.71T | $-213.99K | $-2.28K | $-2.89K | $- | $92.51K | $5.42K | $- | $-226 | $-614.23K | $-461.50K | $- | $636.93K | $15.35K | $-7.35K | $-657.39K | $-584 | $4.60K | $4.42K | $- |
| Net Cash Used Provided by Financing Activities | $-6.71T | $-1.76M | $-1.58M | $-1.56M | $-1.55M | $-1.28M | $-1.36M | $-1.33M | $-1.33M | $-1.88M | $-1.78M | $-1.31M | $-1.31M | $-1.28M | $-1.32M | $-1.96M | $-1.30M | $-1.29M | $-1.29M | $-1.29M |
| Effect of Forex Changes on Cash | $- | $- | $- | $- | $98.33K | $21.66K | $45.02K | $185.97K | $-10.25K | $-87.28K | $- | $213.80K | $-713.72K | $32.83K | $-27.96K | $112.93K | $245.32K | $-399.45K | $- | $- |
| Net Change in Cash | $-127.96B | $8.20M | $50.49M | $3.56M | $-6.22M | $1.15M | $-3.41M | $392.52K | $-373.54K | $1.99M | $5.95M | $2.79M | $-39.53K | $-812.55K | $-1.57M | $-1.01M | $5.61M | $3.22M | $2.65M | $-10.59M |
| Cash at End of Period | $-127.86B | $104.87M | $96.67M | $46.18M | $42.62M | $48.85M | $47.69M | $51.10M | $50.71M | $51.09M | $49.09M | $43.14M | $40.36M | $40.40M | $41.21M | $42.78M | $43.79M | $38.18M | $34.96M | $32.31M |
| Cash at Beginning of Period | $104.87M | $96.67M | $46.18M | $42.62M | $48.85M | $47.69M | $51.10M | $50.71M | $51.09M | $49.09M | $43.14M | $40.36M | $40.40M | $41.21M | $42.78M | $43.79M | $38.18M | $34.96M | $32.31M | $42.90M |
| Operating Cash Flow | $38.17T | $10.35M | $20.96M | $5.95M | $-424.86K | $3.42M | $-373.00K | $5.35M | $5.53M | $2.59M | $8.59M | $4.62M | $2.50M | $3.41M | $-26.56K | $1.09M | $6.82M | $6.68M | $4.13M | $-288.65K |
| Capital Expenditure | $-6.70T | $-2.02M | $-1.19M | $-531.45K | $-924.11K | $-1.01M | $-1.73M | $-1.38M | $-4.59M | $-1.15M | $-1.07M | $-727.92K | $-516.74K | $-475.97K | $-204.49K | $-292.80K | $-156.94K | $-860.63K | $-194.49K | $-516.33K |
| Free Cash Flow | $31.48T | $8.33M | $19.76M | $5.42M | $-1.35M | $2.41M | $-2.10M | $3.96M | $933.75K | $1.44M | $7.52M | $3.89M | $1.98M | $2.93M | $-231.06K | $793.34K | $6.66M | $5.82M | $3.94M | $-804.98K |
Consolidated Water Dividends
Explore Consolidated Water's dividend history, including dividend yield, payout ratio, and historical payments.
Dividend Yield
1.54%
Dividend Payout Ratio
22.32%
Dividend Paid & Capex Coverage Ratio
5.70x
Consolidated Water Dividend History
| Dividend | Adjusted Dividend | Date | Record Date | Payment Date | Declaration Date |
|---|---|---|---|---|---|
| $0.11 | $0.11 | April 01, 2025 | April 01, 2025 | April 30, 2025 | February 26, 2025 |
| $0.11 | $0.11 | January 02, 2025 | January 02, 2025 | January 31, 2025 | November 25, 2024 |
| $0.11 | $0.11 | October 01, 2024 | October 01, 2024 | October 31, 2024 | August 20, 2024 |
| $0.095 | $0.095 | July 01, 2024 | July 01, 2024 | July 31, 2024 | June 05, 2024 |
| $0.095 | $0.095 | March 28, 2024 | April 01, 2024 | April 30, 2024 | February 20, 2024 |
| $0.095 | $0.095 | December 29, 2023 | January 02, 2024 | January 31, 2024 | November 28, 2023 |
| $0.095 | $0.095 | September 29, 2023 | October 02, 2023 | October 31, 2023 | August 22, 2023 |
| $0.085 | $0.085 | June 30, 2023 | July 03, 2023 | July 31, 2023 | May 30, 2023 |
| $0.085 | $0.085 | March 31, 2023 | April 03, 2023 | April 28, 2023 | February 27, 2023 |
| $0.085 | $0.085 | December 30, 2022 | January 03, 2023 | January 31, 2023 | November 22, 2022 |
| $0.085 | $0.085 | September 30, 2022 | October 03, 2022 | October 31, 2022 | September 09, 2022 |
| $0.085 | $0.085 | June 30, 2022 | July 01, 2022 | July 29, 2022 | June 03, 2022 |
| $0.085 | $0.085 | March 31, 2022 | April 01, 2022 | April 29, 2022 | March 09, 2022 |
| $0.085 | $0.085 | December 31, 2021 | January 03, 2022 | January 31, 2022 | December 09, 2021 |
| $0.085 | $0.085 | September 30, 2021 | October 01, 2021 | October 29, 2021 | August 30, 2021 |
| $0.085 | $0.085 | June 30, 2021 | July 01, 2021 | July 30, 2021 | June 02, 2021 |
| $0.085 | $0.085 | March 31, 2021 | April 01, 2021 | April 30, 2021 | March 02, 2021 |
| $0.085 | $0.085 | December 31, 2020 | January 04, 2021 | February 01, 2021 | December 03, 2020 |
| $0.085 | $0.085 | September 30, 2020 | October 01, 2020 | October 30, 2020 | August 24, 2020 |
| $0.085 | $0.085 | June 30, 2020 | July 01, 2020 | July 31, 2020 | May 20, 2020 |
Consolidated Water News
Read the latest news about Consolidated Water, including recent articles, headlines, and updates.
Consolidated Water: A Tiny Company With A Big Future
Consolidated Water is a microcap water company with a strong balance sheet, boasting $100 million in cash and negligible debt. CW operates in the Caribbean and US, with diversified segments including retail water, bulk water, services, and manufacturing. Key growth drivers include a $200 million Hawaii desalination project and increasing recurring O&M revenues, enhancing long-term revenue stability.

Consolidated Water Reports Full Year 2024 Results
GEORGE TOWN, Cayman Islands, March 17, 2025 (GLOBE NEWSWIRE) -- Consolidated Water Co. Ltd. (NASDAQ Global Select Market: CWCO), a leading designer, builder and operator of advanced water supply and treatment plants, reported results for the year ended December 31, 2024. All comparisons are to the prior year period unless otherwise noted.

Top 3 Utilities Stocks Powering Up as Recession Fears Rise
Utilities stocks—those companies providing essential water, gas, electricity, and similar services—are a haven for investors when other sectors become too risky. The reasoning behind this is that there will always be relatively consistent demand for utilities services, even when the broader market is struggling.
Consolidated Water Sets 2024 Full Year Investor Conference Call for Tuesday, March 18, 2025 at 11:00 a.m. ET
GEORGE TOWN, Cayman Islands, March 03, 2025 (GLOBE NEWSWIRE) -- Consolidated Water Co. Ltd. (NASDAQ Global Select Market: CWCO), a leading designer, builder and operator of advanced water supply and treatment plants, will hold a conference call on Tuesday, March 18, 2025 at 11:00 a.m. Eastern time to discuss its results for the year ended December 31, 2024.

Consolidated Water to Attend the 37th Annual ROTH Conference, March 17-18, 2025
GEORGE TOWN, Cayman Islands, March 03, 2025 (GLOBE NEWSWIRE) -- Consolidated Water Co. Ltd. (NASDAQ Global Select Market: CWCO), a leading designer, builder and operator of advanced water supply and treatment plants, has been invited to attend the 37th Annual ROTH Conference being held at The Laguna Cliffs Marriott in Dana Point, California, on March 16-18, 2025.

Consolidated Water Declares Second Quarter Cash Dividend
GEORGE TOWN, Cayman Islands, Feb. 26, 2025 (GLOBE NEWSWIRE) -- Consolidated Water Co. Ltd. (NASDAQ Global Select Market: CWCO), a leading designer, builder and operator of advanced water supply and treatment plants, today announced that its board of directors has approved a quarterly cash dividend of $0.11 per share for the second quarter of 2025.

Consolidated Water's Cayman Islands Water Utility Receives New Water Production and Supply Concession from Cayman Islands Government
GEORGE TOWN, Cayman Islands, Feb. 24, 2025 (GLOBE NEWSWIRE) -- Consolidated Water Co. Ltd. (NASDAQ Global Select Market: CWCO), a leading designer, builder and operator of advanced water supply and treatment plants, reported that its wholly owned subsidiary, Cayman Water Company, has received its new concession from the Cayman Islands government that grants it the continued exclusive rights to produce and supply potable water within its existing service area on Grand Cayman, the largest island of the Cayman Islands.

Consolidated Water Declares First Quarter Cash Dividend
GEORGE TOWN, Cayman Islands, Nov. 25, 2024 (GLOBE NEWSWIRE) -- Consolidated Water Co. Ltd. (NASDAQ Global Select Market: CWCO), a leading designer, builder and operator of advanced water supply and treatment plants, today announced that its board of directors has approved a quarterly cash dividend of $0.11 per share for the first quarter of 2025.

Consolidated Water Co. Ltd. (CWCO) Q3 2024 Earnings Call Transcript
Consolidated Water Co. Ltd. (NASDAQ:CWCO ) Q3 2024 Earnings Conference Call November 15, 2024 11:00 AM ET Company Participants Frederick McTaggart - CEO David Sasnett - CFO Conference Call Participants Gerard Sweeney - ROTH Capital Operator Good morning.

Consolidated Water (CWCO) Q3 Earnings: How Key Metrics Compare to Wall Street Estimates
While the top- and bottom-line numbers for Consolidated Water (CWCO) give a sense of how the business performed in the quarter ended September 2024, it could be worth looking at how some of its key metrics compare to Wall Street estimates and year-ago values.

Consolidated Water Reports Third Quarter 2024 Operating Results
GEORGE TOWN, Cayman Islands, Nov. 14, 2024 (GLOBE NEWSWIRE) -- Consolidated Water Co. Ltd. (NASDAQ Global Select Market: CWCO), a leading designer, builder and operator of advanced water supply and treatment plants, reported results for the third quarter ended September 30, 2024. All comparisons are to the same prior year period unless otherwise noted.

What Analyst Projections for Key Metrics Reveal About Consolidated Water (CWCO) Q3 Earnings
Looking beyond Wall Street's top -and-bottom-line estimate forecasts for Consolidated Water (CWCO), delve into some of its key metrics to gain a deeper insight into the company's potential performance for the quarter ended September 2024.
Consolidated Water Sets Third Quarter 2024 Investor Conference Call for Friday, November 15, 2024 at 11:00 a.m. ET
GEORGE TOWN, Cayman Islands, Nov. 05, 2024 (GLOBE NEWSWIRE) -- Consolidated Water Co. Ltd. (NASDAQ Global Select Market: CWCO), a leading designer, builder and operator of advanced water supply and treatment plants, will hold a conference call on Friday, November 15, 2024 at 11:00 a.m. Eastern time to discuss its results for the third quarter ended September 30, 2024.

Similar Companies
Related Metrics
Explore detailed financial metrics and analysis for CWCO.

