Casella Waste Systems Key Executives
This section highlights Casella Waste Systems's key executives, including their titles and compensation details.
Find Contacts at Casella Waste Systems
(Showing 0 of )
Casella Waste Systems Earnings
This section highlights Casella Waste Systems's earnings, including key dates, EPS, earnings reports, and earnings call transcripts.
Next Earnings Date
Last Earnings Results
Earnings Call Transcripts
| Transcript | Quarter | Year | Date | Estimated EPS | Actual EPS |
|---|---|---|---|---|---|
| Read Transcript | Q4 | 2024 | 2025-02-13 | N/A | N/A |
| Read Transcript | Q3 | 2024 | 2024-10-31 | N/A | N/A |
| Read Transcript | Q2 | 2024 | 2024-08-03 | N/A | N/A |
| Read Transcript | Q1 | 2024 | 2024-04-26 | N/A | N/A |
| Read Transcript | Q4 | 2023 | 2024-02-16 | N/A | N/A |
| Read Transcript | Q3 | 2023 | 2023-11-03 | N/A | N/A |
| Read Transcript | Q2 | 2023 | 2023-07-28 | N/A | N/A |
| Read Transcript | Q1 | 2023 | 2023-04-28 | N/A | N/A |

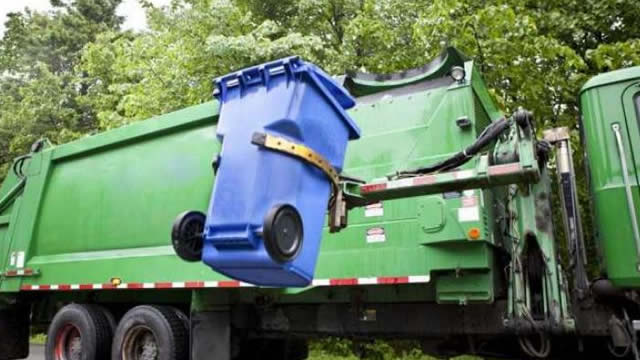
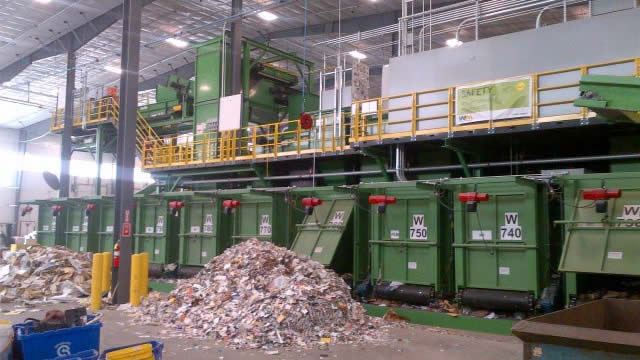
Casella Waste Systems, Inc., together with its subsidiaries, operates as a vertically integrated solid waste services company in the northeastern United States. It offers resource management services primarily in the areas of solid waste collection and disposal, transfer, recycling, and organics services to residential, commercial, municipal, institutional, and industrial customers. The company provides a range of non-hazardous solid waste services, including collections, transfer stations, and disposal facilities. It also markets recyclable metals, aluminum, plastics, and paper and corrugated cardboard that are processed at its facilities, as well as recyclables purchased from third parties. In addition, the company is involved in commodity brokerage operations. As of January 31, 2022, it owned and/or operated 50 solid waste collection operations, 65 transfer stations, 23 recycling facilities, 8 Subtitle D landfills, 3 landfill gas-to-energy facilities, and 1 landfill permitted to accept construction and demolition materials. Casella Waste Systems, Inc. was founded in 1975 and is headquartered in Rutland, Vermont.
$116.18
Stock Price
$7.26B
Market Cap
5.10K
Employees
Rutland, VT
Location
Financial Statements
Access annual & quarterly financial statements for Casella Waste Systems, including income statements, balance sheets, and cash flow statements..
Annual Income Statement
| Breakdown | December 31, 2024 | December 31, 2023 | December 31, 2022 | December 31, 2021 | December 31, 2020 |
|---|---|---|---|---|---|
| Revenue | $1.56B | $1.26B | $1.09B | $889.21M | $774.58M |
| Cost of Revenue | $1.03B | $1.00B | $723.12M | $582.40M | $515.65M |
| Gross Profit | $529.95M | $261.80M | $361.97M | $306.81M | $258.94M |
| Gross Profit Ratio | 34.03% | 20.70% | 33.36% | 34.50% | 33.43% |
| Research and Development Expenses | $- | $- | $- | $- | $- |
| General and Administrative Expenses | $190.75M | $155.85M | $133.42M | $118.83M | $102.41M |
| Selling and Marketing Expenses | $- | $- | $- | $- | $- |
| Selling General and Administrative Expenses | $190.75M | $155.85M | $133.42M | $118.83M | $102.41M |
| Other Expenses | $266.43M | $- | $127.11M | $104.51M | $90.78M |
| Operating Expenses | $457.19M | $351.11M | $260.53M | $223.35M | $193.19M |
| Cost and Expenses | $1.48B | $1.18B | $983.65M | $805.75M | $708.84M |
| Interest Income | $10.43M | $10.74M | $709.00K | $302.00K | $303.00K |
| Interest Expense | $62.41M | $47.58M | $23.01M | $20.93M | $22.07M |
| Depreciation and Amortization | $234.91M | $170.71M | $148.16M | $124.74M | $97.87M |
| EBITDA | $318.37M | $274.17M | $248.29M | $208.78M | $151.46M |
| EBITDA Ratio | 20.44% | 21.68% | 22.88% | 23.48% | 19.55% |
| Operating Income | $72.76M | $80.43M | $95.39M | $77.66M | $59.30M |
| Operating Income Ratio | 4.67% | 6.36% | 8.79% | 8.73% | 7.66% |
| Total Other Income Expenses Net | $-51.71M | $-43.38M | $-20.43M | $-19.61M | $-21.00M |
| Income Before Tax | $21.05M | $37.05M | $74.97M | $58.05M | $38.30M |
| Income Before Tax Ratio | 1.35% | 2.93% | 6.91% | 6.53% | 4.94% |
| Income Tax Expense | $7.51M | $11.65M | $21.89M | $16.95M | $-52.80M |
| Net Income | $13.54M | $25.40M | $53.08M | $41.10M | $91.11M |
| Net Income Ratio | 0.87% | 2.01% | 4.89% | 4.62% | 11.76% |
| EPS | $0.23 | $0.46 | $1.03 | $0.80 | $1.87 |
| EPS Diluted | $0.23 | $0.46 | $1.03 | $0.80 | $1.86 |
| Weighted Average Shares Outstanding | 59.58M | 55.17M | 51.62M | 51.31M | 48.79M |
| Weighted Average Shares Outstanding Diluted | 59.58M | 55.27M | 51.77M | 51.52M | 49.05M |
| SEC Filing | Source | Source | Source | Source | Source |
| Breakdown | December 31, 2024 | September 30, 2024 | June 30, 2024 | March 31, 2024 | December 31, 2023 | September 30, 2023 | June 30, 2023 | March 31, 2023 | December 31, 2022 | September 30, 2022 | June 30, 2022 | March 31, 2022 | December 31, 2021 | September 30, 2021 | June 30, 2021 | March 31, 2021 | December 31, 2020 | September 30, 2020 | June 30, 2020 | March 31, 2020 |
|---|---|---|---|---|---|---|---|---|---|---|---|---|---|---|---|---|---|---|---|---|
| Revenue | $427.49M | $411.63M | $377.16M | $341.01M | $359.57M | $352.74M | $289.64M | $262.60M | $272.13M | $295.27M | $283.67M | $234.03M | $241.84M | $241.97M | $215.88M | $189.53M | $200.24M | $202.67M | $188.77M | $182.91M |
| Cost of Revenue | $285.64M | $326.29M | $299.12M | $284.83M | $293.78M | $274.04M | $221.24M | $213.68M | $184.34M | $190.28M | $186.04M | $162.46M | $162.82M | $153.89M | $138.55M | $127.14M | $133.26M | $130.41M | $123.46M | $128.52M |
| Gross Profit | $141.85M | $85.34M | $78.04M | $56.18M | $65.78M | $78.70M | $68.40M | $48.92M | $87.79M | $104.98M | $97.63M | $71.57M | $79.02M | $88.08M | $77.32M | $62.39M | $66.98M | $72.26M | $65.31M | $54.39M |
| Gross Profit Ratio | 33.18% | 20.73% | 20.69% | 16.47% | 18.30% | 22.31% | 23.62% | 18.63% | 32.26% | 35.56% | 34.42% | 30.58% | 32.67% | 36.40% | 35.82% | 32.92% | 33.45% | 35.66% | 34.60% | 29.74% |
| Research and Development Expenses | $- | $- | $- | $- | $- | $- | $- | $- | $- | $- | $- | $- | $- | $- | $- | $- | $- | $- | $- | $- |
| General and Administrative Expenses | $53.65M | $45.60M | $47.60M | $44.00M | $44.85M | $40.50M | $35.87M | $34.70M | $35.72M | $33.50M | $33.56M | $29.79M | $31.50M | $30.99M | $29.21M | $27.13M | $28.17M | $25.01M | $24.87M | $24.35M |
| Selling and Marketing Expenses | $- | $- | $-416.00K | $334.00K | $-1.72M | $677.00K | $- | $979.00K | $- | $- | $- | $- | $- | $- | $- | $- | $- | $- | $- | $- |
| Selling General and Administrative Expenses | $53.65M | $45.60M | $47.18M | $44.33M | $43.13M | $41.18M | $35.87M | $35.68M | $35.72M | $33.50M | $33.56M | $29.79M | $31.50M | $30.99M | $29.21M | $27.13M | $28.17M | $25.01M | $24.87M | $24.35M |
| Other Expenses | $69.67M | $- | $477.00K | $352.00K | $627.00K | $225.00K | $452.00K | $349.00K | $33.24M | $34.09M | $31.15M | $29.43M | $488.00K | $178.00K | $510.00K | $138.00K | $466.00K | $157.00K | $492.00K | $-43.00K |
| Operating Expenses | $123.32M | $60.96M | $47.18M | $44.33M | $43.13M | $41.18M | $35.87M | $35.68M | $68.96M | $67.59M | $64.71M | $59.22M | $61.50M | $58.48M | $53.55M | $49.81M | $51.67M | $48.81M | $46.95M | $45.76M |
| Cost and Expenses | $408.96M | $373.32M | $346.31M | $329.16M | $336.91M | $315.22M | $257.11M | $249.36M | $253.30M | $257.87M | $250.75M | $221.68M | $224.32M | $212.38M | $192.10M | $176.95M | $184.93M | $179.22M | $170.41M | $174.28M |
| Interest Income | $- | $1.38M | $2.62M | $2.81M | $2.92M | $5.53M | $1.61M | $684.00K | $449.00K | $178.00K | $42.00K | $40.00K | $111.00K | $61.00K | $66.00K | $64.00K | $100.00K | $107.00K | $45.00K | $51.00K |
| Interest Expense | $11.85M | $15.75M | $15.32M | $15.88M | $13.69M | $13.94M | $7.73M | $5.85M | $6.20M | $6.18M | $5.70M | $5.16M | $5.19M | $5.10M | $5.30M | $5.47M | $5.40M | $5.30M | $5.51M | $5.90M |
| Depreciation and Amortization | $66.36M | $59.17M | $58.26M | $56.97M | $61.39M | $54.29M | $40.96M | $39.27M | $38.63M | $38.11M | $36.86M | $34.56M | $34.34M | $33.02M | $29.73M | $24.64M | $25.57M | $20.33M | $23.87M | $23.08M |
| EBITDA | $83.92M | $85.95M | $89.12M | $68.82M | $76.11M | $91.81M | $73.50M | $52.51M | $56.22M | $76.11M | $64.07M | $46.04M | $52.46M | $61.85M | $53.46M | $37.99M | $40.35M | $45.32M | $41.85M | $30.10M |
| EBITDA Ratio | 19.63% | 20.88% | 23.63% | 20.18% | 21.17% | 26.03% | 25.37% | 20.00% | 20.66% | 25.78% | 22.59% | 19.67% | 21.69% | 25.56% | 24.76% | 20.05% | 20.15% | 22.36% | 22.17% | 16.46% |
| Operating Income | $18.53M | $24.38M | $30.85M | $11.85M | $22.66M | $37.52M | $32.54M | $13.24M | $17.22M | $36.29M | $31.72M | $10.17M | $16.32M | $27.39M | $21.95M | $12.01M | $14.21M | $20.63M | $17.44M | $7.01M |
| Operating Income Ratio | 4.33% | 5.92% | 8.18% | 3.47% | 6.30% | 10.64% | 11.23% | 5.04% | 6.33% | 12.29% | 11.18% | 4.34% | 6.75% | 11.32% | 10.17% | 6.34% | 7.10% | 10.18% | 9.24% | 3.83% |
| Total Other Income Expenses Net | $-12.82M | $-13.96M | $-20.06M | $-17.73M | $-12.32M | $-10.00M | $-15.14M | $-8.90M | $-5.59M | $-4.48M | $-5.34M | $-5.02M | $-4.70M | $-4.92M | $-4.72M | $-5.27M | $-4.93M | $-5.14M | $-4.97M | $-5.94M |
| Income Before Tax | $5.71M | $10.42M | $10.80M | $-5.88M | $1.04M | $24.19M | $7.48M | $4.34M | $11.63M | $31.81M | $26.38M | $5.15M | $11.62M | $22.46M | $17.23M | $6.74M | $9.27M | $15.49M | $12.47M | $1.07M |
| Income Before Tax Ratio | 1.34% | 2.53% | 2.86% | -1.73% | 0.29% | 6.86% | 2.58% | 1.65% | 4.27% | 10.77% | 9.30% | 2.20% | 4.80% | 9.28% | 7.98% | 3.56% | 4.63% | 7.64% | 6.61% | 0.58% |
| Income Tax Expense | $835.00K | $4.65M | $3.79M | $-1.77M | $2.85M | $6.02M | $1.99M | $791.00K | $3.21M | $9.14M | $8.58M | $958.00K | $2.47M | $6.60M | $5.44M | $2.43M | $-53.64M | $374.00K | $357.00K | $109.00K |
| Net Income | $4.88M | $5.77M | $7.01M | $-4.12M | $-1.81M | $18.17M | $5.49M | $3.55M | $8.42M | $22.67M | $17.80M | $4.19M | $9.14M | $15.86M | $11.78M | $4.31M | $62.92M | $15.12M | $12.11M | $959.00K |
| Net Income Ratio | 1.14% | 1.40% | 1.86% | -1.21% | -0.50% | 5.15% | 1.90% | 1.35% | 3.09% | 7.68% | 6.27% | 1.79% | 3.78% | 6.55% | 5.46% | 2.27% | 31.42% | 7.46% | 6.42% | 0.52% |
| EPS | $0.08 | $0.10 | $0.12 | $-0.07 | $-0.03 | $0.31 | $0.10 | $0.07 | $0.16 | $0.44 | $0.34 | $0.08 | $0.18 | $0.31 | $0.23 | $0.08 | $1.25 | $0.31 | $0.25 | $0.02 |
| EPS Diluted | $0.08 | $0.10 | $0.12 | $-0.07 | $-0.03 | $0.31 | $0.10 | $0.07 | $0.16 | $0.44 | $0.34 | $0.08 | $0.18 | $0.31 | $0.23 | $0.08 | $1.24 | $0.31 | $0.25 | $0.02 |
| Weighted Average Shares Outstanding | 63.32M | 58.81M | 58.11M | 58.03M | 57.98M | 57.96M | 52.88M | 51.77M | 51.68M | 51.68M | 51.64M | 51.49M | 51.40M | 51.39M | 51.37M | 51.18M | 50.44M | 48.37M | 48.35M | 48.01M |
| Weighted Average Shares Outstanding Diluted | 63.45M | 58.41M | 58.20M | 58.03M | 57.98M | 58.06M | 52.98M | 51.87M | 51.83M | 51.81M | 51.78M | 51.66M | 51.62M | 51.59M | 51.55M | 51.39M | 50.72M | 48.62M | 48.56M | 48.26M |
| SEC Filing | Source | Source | Source | Source | Source | Source | Source | Source | Source | Source | Source | Source | Source | Source | Source | Source | Source | Source | Source | Source |
Annual Balance Sheet
| Breakdown | December 31, 2024 | December 31, 2023 | December 31, 2022 | December 31, 2021 | December 31, 2020 |
|---|---|---|---|---|---|
| Cash and Cash Equivalents | $383.30M | $220.91M | $71.15M | $33.81M | $154.34M |
| Short Term Investments | $- | $6.62M | $4.34M | $- | $- |
| Cash and Short Term Investments | $383.30M | $220.91M | $71.15M | $33.81M | $154.34M |
| Net Receivables | $- | $160.41M | $100.89M | $86.98M | $74.20M |
| Inventory | $- | $17.86M | $13.47M | $9.73M | $7.87M |
| Other Current Assets | $10.21M | $27.14M | $21.97M | $15.96M | $10.85M |
| Total Current Assets | $393.52M | $426.32M | $207.48M | $146.48M | $247.25M |
| Property Plant Equipment Net | $1.26B | $1.08B | $812.61M | $738.40M | $605.82M |
| Goodwill | $1.00B | $735.67M | $274.46M | $232.86M | $194.90M |
| Intangible Assets | $313.47M | $241.43M | $91.78M | $93.72M | $58.32M |
| Goodwill and Intangible Assets | $1.32B | $977.10M | $366.24M | $326.58M | $253.22M |
| Long Term Investments | $10.97M | $10.97M | $10.97M | $11.26M | $11.26M |
| Tax Assets | $- | $11.22M | $22.90M | $43.96M | $61.16M |
| Other Non-Current Assets | $27.20M | $28.46M | $29.01M | $16.89M | $15.17M |
| Total Non-Current Assets | $2.62B | $2.11B | $1.24B | $1.14B | $946.64M |
| Other Assets | $219.79M | $- | $- | $- | $- |
| Total Assets | $3.23B | $2.54B | $1.45B | $1.28B | $1.19B |
| Account Payables | $111.09M | $116.79M | $74.20M | $63.09M | $49.20M |
| Short Term Debt | $52.92B | $44.82M | $15.97M | $17.21M | $17.79M |
| Tax Payables | $- | $3.09B | $- | $- | $229.00K |
| Deferred Revenue | $- | $31.47M | $3.74M | $3.40M | $2.69M |
| Other Current Liabilities | $254.29B | $-3.00B | $143.82M | $114.78M | $105.56M |
| Total Current Liabilities | $307.32B | $278.86M | $177.60M | $152.19M | $131.21M |
| Long Term Debt | $1.16B | $1.09B | $642.36M | $598.88M | $591.39M |
| Deferred Revenue Non-Current | $- | $- | $- | $-868.00K | $-912.00K |
| Deferred Tax Liabilities Non-Current | $19.09B | $627.00K | $437.00K | $868.00K | $912.00K |
| Other Non-Current Liabilities | $1.35T | $148.70M | $130.92M | $109.18M | $108.25M |
| Total Non-Current Liabilities | $1.37T | $1.23B | $773.72M | $708.93M | $700.55M |
| Other Liabilities | $-1.68T | $- | $- | $- | $- |
| Total Liabilities | $1.68B | $1.51B | $951.32M | $861.12M | $831.76M |
| Preferred Stock | $- | $- | $- | $- | $- |
| Common Stock | $634.00K | $580.00K | $517.00K | $514.00K | $511.00K |
| Retained Earnings | $-132.99B | $-146.52M | $-171.92M | $-225.00M | $-266.10M |
| Accumulated Other Comprehensive Income Loss | $3.31M | $-1.08M | $7.54M | $-5.10M | $-11.52M |
| Other Total Stockholders Equity | $1.68T | $1.17B | $661.76M | $652.04M | $639.25M |
| Total Stockholders Equity | $1.55T | $1.02B | $497.90M | $422.46M | $362.14M |
| Total Equity | $1.55T | $1.02B | $497.90M | $422.46M | $362.14M |
| Total Liabilities and Stockholders Equity | $3.23B | $2.54B | $1.45B | $1.28B | $1.19B |
| Minority Interest | $- | $- | $- | $- | $- |
| Total Liabilities and Total Equity | $3.23B | $2.54B | $1.45B | $1.28B | $1.19B |
| Total Investments | $10.97M | $17.58M | $10.97M | $11.26M | $11.26M |
| Total Debt | $117.36B | $1.12B | $658.33M | $616.09M | $609.18M |
| Net Debt | $117.36B | $897.64M | $587.18M | $582.28M | $454.83M |
Balance Sheet Charts
| Breakdown | December 31, 2024 | September 30, 2024 | June 30, 2024 | March 31, 2024 | December 31, 2023 | September 30, 2023 | June 30, 2023 | March 31, 2023 | December 31, 2022 | September 30, 2022 | June 30, 2022 | March 31, 2022 | December 31, 2021 | September 30, 2021 | June 30, 2021 | March 31, 2021 | December 31, 2020 | September 30, 2020 | June 30, 2020 | March 31, 2020 |
|---|---|---|---|---|---|---|---|---|---|---|---|---|---|---|---|---|---|---|---|---|
| Cash and Cash Equivalents | $383.30M | $518.98M | $208.50M | $189.46M | $220.91M | $219.09M | $465.71M | $60.23M | $71.15M | $47.93M | $39.31M | $12.59M | $33.81M | $46.48M | $167.18M | $152.56M | $154.34M | $21.13M | $3.07M | $26.22M |
| Short Term Investments | $- | $- | $7.22M | $7.20M | $5.95M | $7.83M | $5.15M | $4.39M | $4.34M | $3.53M | $1.45M | $785.00K | $- | $- | $- | $- | $- | $- | $- | $- |
| Cash and Short Term Investments | $383.30M | $518.98M | $208.50M | $189.46M | $220.91M | $219.09M | $465.71M | $60.23M | $71.15M | $47.93M | $39.31M | $12.59M | $33.81M | $46.48M | $167.18M | $152.56M | $154.34M | $21.13M | $3.07M | $26.22M |
| Net Receivables | $165.92M | $173.10M | $167.64M | $150.90M | $160.41M | $144.06M | $117.68M | $95.19M | $100.89M | $108.01M | $108.31M | $93.24M | $86.98M | $90.50M | $78.93M | $66.66M | $74.20M | $73.60M | $75.93M | $73.51M |
| Inventory | $- | $20.24M | $18.91M | $18.54M | $17.86M | $17.52M | $16.78M | $14.18M | $13.47M | $13.43M | $13.07M | $11.77M | $9.73M | $9.80M | $7.99M | $7.97M | $7.87M | $8.06M | $7.94M | $7.82M |
| Other Current Assets | $64.08M | $30.74M | $30.75M | $26.50M | $27.14M | $32.67M | $29.21M | $18.23M | $21.97M | $22.11M | $20.46M | $16.38M | $15.96M | $20.38M | $15.16M | $12.31M | $10.85M | $12.96M | $11.14M | $12.01M |
| Total Current Assets | $613.30M | $743.05M | $425.80M | $385.40M | $426.32M | $413.34M | $629.39M | $187.83M | $207.48M | $191.48M | $181.16M | $133.99M | $146.48M | $167.16M | $269.25M | $239.51M | $247.25M | $115.75M | $98.08M | $119.55M |
| Property Plant Equipment Net | $1.26B | $1.16B | $1.09B | $1.08B | $1.08B | $1.04B | $923.16M | $806.85M | $812.61M | $778.41M | $761.63M | $740.65M | $738.40M | $714.06M | $623.53M | $615.85M | $605.82M | $593.46M | $585.15M | $561.93M |
| Goodwill | $1.00B | $907.88M | $737.25M | $736.51M | $735.67M | $737.15M | $619.68M | $274.46M | $274.46M | $272.44M | $262.51M | $258.41M | $232.86M | $227.93M | $196.69M | $196.32M | $194.90M | $192.38M | $190.97M | $186.63M |
| Intangible Assets | $313.47M | $273.31M | $216.96M | $228.87M | $241.43M | $256.69M | $187.15M | $87.71M | $91.78M | $94.79M | $96.76M | $100.86M | $93.72M | $92.91M | $55.93M | $57.58M | $58.32M | $59.39M | $60.41M | $57.94M |
| Goodwill and Intangible Assets | $1.32B | $1.18B | $954.21M | $965.38M | $977.10M | $993.84M | $806.83M | $362.17M | $366.24M | $367.23M | $359.27M | $359.28M | $326.58M | $320.84M | $252.61M | $253.90M | $253.22M | $251.77M | $251.37M | $244.57M |
| Long Term Investments | $10.97M | $10.97M | $19.14M | $18.51M | $17.58M | $24.15M | $19.73M | $18.65M | $10.97M | $10.97M | $11.26M | $11.26M | $11.26M | $11.26M | $11.26M | $11.26M | $11.26M | $11.26M | $11.26M | $11.26M |
| Tax Assets | $- | $- | $8.41M | $11.02M | $11.22M | $6.60M | $16.41M | $23.49M | $22.90M | $25.55M | $34.06M | $41.24M | $43.96M | $46.78M | $53.09M | $57.73M | $61.16M | $7.39M | $7.37M | $7.26M |
| Other Non-Current Assets | $27.20M | $25.86M | $18.76M | $18.65M | $21.84M | $21.57M | $21.77M | $20.90M | $29.01M | $25.70M | $23.34M | $20.55M | $16.89M | $20.30M | $18.08M | $15.99M | $15.17M | $14.63M | $13.74M | $13.06M |
| Total Non-Current Assets | $2.62B | $2.38B | $2.09B | $2.09B | $2.11B | $2.08B | $1.79B | $1.23B | $1.24B | $1.21B | $1.19B | $1.17B | $1.14B | $1.11B | $958.58M | $954.74M | $946.64M | $878.51M | $868.89M | $838.09M |
| Other Assets | $- | $- | $1 | $1 | $- | $- | $- | $- | $- | $- | $- | $- | $- | $- | $- | $-0 | $- | $- | $- | $- |
| Total Assets | $3.23B | $3.12B | $2.51B | $2.48B | $2.54B | $2.50B | $2.42B | $1.42B | $1.45B | $1.40B | $1.37B | $1.31B | $1.28B | $1.28B | $1.23B | $1.19B | $1.19B | $994.25M | $966.97M | $957.64M |
| Account Payables | $111.09M | $101.63M | $94.20M | $79.99M | $116.79M | $100.11M | $87.60M | $66.64M | $74.20M | $71.07M | $73.27M | $65.24M | $63.09M | $69.52M | $60.06M | $50.55M | $49.20M | $55.83M | $57.44M | $53.82M |
| Short Term Debt | $52.91M | $48.86M | $74.19M | $72.19M | $57.25M | $42.58M | $41.26M | $16.46M | $15.97M | $15.23M | $14.06M | $17.00M | $17.21M | $23.88M | $21.92M | $18.04M | $17.79M | $16.67M | $15.37M | $14.22M |
| Tax Payables | $- | $- | $- | $- | $3.09B | $3.73B | $3.73B | $- | $- | $- | $- | $- | $- | $- | $- | $336.00M | $229.00K | $274.00M | $2.23B | $2.19B |
| Deferred Revenue | $- | $47.80M | $30.66M | $29.71M | $31.47M | $18.85M | $16.26M | $4.15M | $3.74M | $3.89M | $3.73M | $5.50M | $3.40M | $3.42M | $3.13M | $3.08M | $2.69M | $2.75M | $3.06M | $2.86M |
| Other Current Liabilities | $143.32M | $160.88M | $124.68M | $112.32M | $-2.96B | $-3.56B | $-3.65B | $57.87M | $143.82M | $125.21M | $127.51M | $101.47M | $114.78M | $143.31M | $111.26M | $-241.54M | $105.56M | $-162.79M | $-2.17B | $-2.11B |
| Total Current Liabilities | $307.32M | $291.25M | $269.69M | $244.12M | $278.86M | $253.18M | $219.18M | $145.12M | $177.60M | $162.83M | $163.01M | $143.55M | $152.19M | $178.37M | $147.56M | $123.08M | $131.21M | $137.55M | $128.96M | $115.15M |
| Long Term Debt | $64.45M | $1.11B | $1.04B | $1.05B | $1.03B | $1.08B | $1.05B | $639.72M | $642.36M | $686.06M | $680.47M | $663.64M | $598.88M | $593.75M | $586.37M | $591.96M | $591.39M | $598.49M | $597.97M | $619.46M |
| Deferred Revenue Non-Current | $- | $- | $65.71M | $66.63M | $106.71M | $68.58M | $71.04M | $62.16M | $- | $- | $- | $- | $-868.00K | $-879.00K | $74.44M | $73.69M | $-912.00K | $-2.86M | $66.39M | $-2.18M |
| Deferred Tax Liabilities Non-Current | $19.09M | $15.38M | $1.19M | $908.00K | $627.00K | $516.00K | $479.00K | $438.00K | $437.00K | $522.00K | $902.00K | $885.00K | $868.00K | $879.00K | $933.00K | $922.00K | $912.00K | $2.86M | $2.58M | $2.18M |
| Other Non-Current Liabilities | $1.29B | $170.95M | $161.14M | $158.79M | $201.09M | $132.69M | $134.87M | $132.95M | $130.92M | $63.37M | $68.77M | $63.85M | $109.18M | $99.44M | $104.48M | $104.95M | $108.25M | $107.37M | $106.73M | $102.85M |
| Total Non-Current Liabilities | $1.37B | $1.30B | $1.20B | $1.21B | $1.23B | $1.21B | $1.19B | $773.11M | $773.72M | $749.96M | $750.14M | $728.37M | $708.93M | $694.08M | $691.78M | $697.84M | $700.55M | $708.72M | $707.27M | $724.49M |
| Other Liabilities | $- | $- | $- | $1 | $- | $- | $- | $- | $- | $- | $- | $- | $- | $- | $- | $- | $- | $- | $- | $- |
| Total Liabilities | $1.68B | $1.59B | $1.47B | $1.45B | $1.51B | $1.47B | $1.41B | $918.24M | $951.32M | $912.79M | $913.15M | $871.92M | $861.12M | $872.45M | $839.34M | $820.91M | $831.76M | $846.27M | $836.23M | $839.64M |
| Preferred Stock | $- | $- | $137.23B | $145.02B | $- | $- | $- | $- | $- | $- | $- | $- | $- | $- | $- | $- | $- | $- | $- | $- |
| Common Stock | $- | $633.00K | $581.00K | $581.00K | $580.00K | $580.00K | $580.00K | $519.00K | $517.00K | $517.00K | $517.00K | $516.00K | $514.00K | $514.00K | $514.00K | $514.00K | $511.00K | $484.00K | $484.00K | $483.00K |
| Retained Earnings | $- | $-137.86M | $-143.63M | $-150.64M | $-146.52M | $-144.71M | $-162.88M | $-168.37M | $-171.92M | $-180.34M | $-203.01M | $-220.81M | $-225.00M | $-234.14M | $-250.00M | $-261.79M | $-266.10M | $-329.02M | $-344.13M | $-356.25M |
| Accumulated Other Comprehensive Income Loss | $- | $-4.68M | $5.82M | $5.04M | $-1.08M | $9.48M | $7.61M | $5.77M | $7.54M | $7.93M | $4.02M | $1.04M | $-5.10M | $-7.03M | $-7.92M | $-7.69M | $-11.52M | $-14.64M | $-14.80M | $-13.23M |
| Other Total Stockholders Equity | $1.55B | $1.67B | $1.17B | $1.17B | $1.17B | $1.17B | $1.16B | $663.74M | $661.76M | $658.45M | $656.04M | $654.30M | $652.04M | $648.61M | $645.90M | $642.30M | $639.25M | $491.16M | $489.19M | $486.99M |
| Total Stockholders Equity | $1.55B | $1.53B | $1.04B | $1.03B | $1.02B | $1.03B | $1.01B | $501.65M | $497.90M | $486.56M | $457.57M | $435.05M | $422.46M | $407.95M | $388.49M | $373.34M | $362.14M | $147.99M | $130.75M | $118.00M |
| Total Equity | $1.55B | $1.53B | $1.04B | $1.03B | $1.02B | $1.03B | $1.01B | $501.65M | $497.90M | $486.56M | $457.57M | $435.05M | $422.46M | $407.95M | $388.49M | $373.34M | $362.14M | $147.99M | $130.75M | $118.00M |
| Total Liabilities and Stockholders Equity | $3.23B | $3.12B | $2.51B | $2.48B | $2.54B | $2.50B | $2.42B | $1.42B | $1.45B | $1.40B | $1.37B | $1.31B | $1.28B | $1.28B | $1.23B | $1.19B | $1.19B | $994.25M | $966.97M | $957.64M |
| Minority Interest | $- | $- | $- | $- | $- | $- | $- | $- | $- | $- | $- | $- | $- | $- | $- | $- | $- | $- | $- | $- |
| Total Liabilities and Total Equity | $3.23B | $3.12B | $2.51B | $2.48B | $2.54B | $2.50B | $2.42B | $1.42B | $1.45B | $1.40B | $1.37B | $1.31B | $1.28B | $1.28B | $1.23B | $1.19B | $1.19B | $994.25M | $966.97M | $957.64M |
| Total Investments | $10.97M | $10.97M | $19.14M | $18.51M | $17.58M | $24.15M | $19.73M | $18.65M | $10.97M | $10.97M | $11.26M | $11.26M | $11.26M | $11.26M | $11.26M | $11.26M | $11.26M | $11.26M | $11.26M | $11.26M |
| Total Debt | $117.36M | $1.16B | $1.12B | $1.12B | $1.12B | $1.12B | $1.10B | $656.19M | $658.33M | $652.23M | $648.64M | $635.85M | $616.09M | $617.63M | $608.29M | $610.00M | $609.18M | $615.16M | $613.33M | $633.68M |
| Net Debt | $-265.94M | $643.99M | $908.02M | $930.24M | $897.64M | $904.25M | $629.92M | $595.96M | $587.18M | $604.29M | $609.34M | $623.26M | $582.28M | $571.15M | $441.11M | $457.44M | $454.83M | $594.03M | $610.26M | $607.46M |
Annual Cash Flow
| Breakdown | December 31, 2024 | December 31, 2023 | December 31, 2022 | December 31, 2021 | December 31, 2020 |
|---|---|---|---|---|---|
| Net Income | $13.54M | $25.40M | $53.08M | $41.10M | $91.11M |
| Depreciation and Amortization | $234.91M | $170.71M | $126.35M | $103.59M | $90.78M |
| Deferred Income Tax | $6.89M | $7.39M | $16.53M | $15.07M | $-52.29M |
| Stock Based Compensation | $12.19M | $9.08M | $8.15M | $11.55M | $8.22M |
| Change in Working Capital | $-25.12M | $-61.16M | $-11.25M | $-13.07M | $-25.17M |
| Accounts Receivables | $1.25M | $-39.44M | $-7.10M | $-7.42M | $5.82M |
| Inventory | $- | $- | $- | $- | $- |
| Accounts Payables | $- | $41.59M | $11.07M | $13.89M | $-15.23M |
| Other Working Capital | $-26.37M | $-63.32M | $-15.22M | $-19.54M | $-15.76M |
| Other Non Cash Items | $38.95M | $81.68M | $24.45M | $24.49M | $27.27M |
| Net Cash Provided by Operating Activities | $281.36M | $233.09M | $217.31M | $182.74M | $139.92M |
| Investments in Property Plant and Equipment | $-203.23M | $-154.91M | $-130.96M | $-123.30M | $-108.11M |
| Acquisitions Net | $-468.63M | $-851.84M | $-78.20M | $-170.65M | $-32.46M |
| Purchases of Investments | $- | $- | $- | $- | $- |
| Sales Maturities of Investments | $- | $- | $1.64M | $- | $- |
| Other Investing Activities | $1.25M | $1.11M | $600.00K | $788.00K | $533.00K |
| Net Cash Used for Investing Activities | $-670.61M | $-1.01B | $-206.92M | $-293.15M | $-140.03M |
| Debt Repayment | $63.07M | $438.74M | $28.99M | $-6.60M | $7.62M |
| Common Stock Issued | $496.25M | $496.23M | $192.00K | $172.00K | $144.79M |
| Common Stock Repurchased | $- | $- | $- | $- | $- |
| Dividends Paid | $- | $- | $- | $- | $- |
| Other Financing Activities | $-7.67M | $-12.67M | $-2.04M | $-3.51M | $-1.43M |
| Net Cash Used Provided by Financing Activities | $551.64M | $922.30M | $26.95M | $-10.12M | $150.98M |
| Effect of Forex Changes on Cash | $- | $- | $- | $- | $- |
| Net Change in Cash | $162.39M | $149.76M | $37.34M | $-120.53M | $150.87M |
| Cash at End of Period | $383.30M | $220.91M | $71.15M | $33.81M | $154.34M |
| Cash at Beginning of Period | $220.91M | $71.15M | $33.81M | $154.34M | $3.47M |
| Operating Cash Flow | $281.36M | $233.09M | $217.31M | $182.74M | $139.92M |
| Capital Expenditure | $-203.51M | $-154.91M | $-130.96M | $-123.30M | $-108.11M |
| Free Cash Flow | $77.85M | $78.19M | $86.35M | $59.44M | $31.81M |
Cash Flow Charts
| Breakdown | December 31, 2024 | September 30, 2024 | June 30, 2024 | March 31, 2024 | December 31, 2023 | September 30, 2023 | June 30, 2023 | March 31, 2023 | December 31, 2022 | September 30, 2022 | June 30, 2022 | March 31, 2022 | December 31, 2021 | September 30, 2021 | June 30, 2021 | March 31, 2021 | December 31, 2020 | September 30, 2020 | June 30, 2020 | March 31, 2020 |
|---|---|---|---|---|---|---|---|---|---|---|---|---|---|---|---|---|---|---|---|---|
| Net Income | $4.88M | $5.77M | $7.01M | $-4.12M | $-1.81M | $18.17M | $5.49M | $3.55M | $8.42M | $22.67M | $17.80M | $4.19M | $9.14M | $15.86M | $11.78M | $4.31M | $62.92M | $15.12M | $12.11M | $959.00K |
| Depreciation and Amortization | $66.36M | $62.07M | $58.26M | $56.97M | $61.39M | $54.29M | $40.96M | $39.27M | $33.24M | $32.53M | $31.15M | $29.43M | $29.08M | $27.49M | $24.34M | $22.68M | $23.50M | $23.80M | $22.08M | $21.41M |
| Deferred Income Tax | $3.47M | $3.27M | $2.58M | $-2.42M | $2.16M | $3.28M | $1.87M | $86.00K | $2.71M | $6.66M | $6.62M | $534.00K | $2.10M | $5.93M | $4.74M | $2.30M | $-53.80M | $258.00K | $289.00K | $967.00K |
| Stock Based Compensation | $4.75M | $2.62M | $2.67M | $2.13M | $2.38M | $2.36M | $2.37M | $1.98M | $2.57M | $2.41M | $937.00K | $2.24M | $2.84M | $2.65M | $3.12M | $2.94M | $2.87M | $1.97M | $1.82M | $1.56M |
| Change in Working Capital | $24.43M | $3.46M | $-6.47M | $-50.02M | $6.96M | $-4.76M | $8.85M | $-30.62M | $13.20M | $-7.48M | $6.64M | $-18.12M | $-754.00K | $-524.00K | $-2.56M | $-5.59M | $-12.60M | $1.56M | $6.45M | $-17.23M |
| Accounts Receivables | $10.12M | $7.01M | $-17.54M | $10.53M | $-16.14M | $-19.34M | $-9.65M | $5.69M | $7.13M | $437.00K | $-15.07M | $402.00K | $3.52M | $-6.23M | $-12.58M | $7.87M | $-585.00K | $-48.00K | $-59.00K | $6.51M |
| Inventory | $- | $- | $- | $- | $-1 | $- | $1 | $- | $- | $- | $- | $- | $-2.01M | $- | $- | $- | $-6.74M | $- | $4.19M | $-13.10M |
| Accounts Payables | $6.90M | $1.76M | $14.22M | $-36.51M | $17.02M | $15.67M | $16.46M | $-7.56M | $3.13M | $-2.20M | $8.03M | $2.12M | $-6.43M | $9.45M | $9.52M | $1.35M | $-6.64M | $-1.62M | $3.62M | $-10.59M |
| Other Working Capital | $7.41M | $-5.31M | $-3.15M | $-24.04M | $6.07M | $-1.09M | $2.04M | $-28.75M | $2.94M | $-5.72M | $13.69M | $-20.64M | $4.16M | $-3.75M | $506.00K | $-14.81M | $1.36M | $3.23M | $-1.31M | $-50.00K |
| Other Non Cash Items | $5.88M | $14.62M | $130.57M | $147.19M | $4.19M | $1.29M | $7.87M | $1.53M | $4.75M | $3.39M | $4.39M | $6.45M | $6.24M | $3.66M | $5.45M | $5.50M | $5.12M | $6.72M | $4.96M | $7.13M |
| Net Cash Provided by Operating Activities | $109.76M | $91.81M | $72.10M | $7.68M | $75.27M | $74.63M | $67.40M | $15.80M | $64.88M | $60.18M | $67.54M | $24.71M | $48.65M | $55.08M | $46.87M | $32.15M | $28.01M | $49.42M | $47.70M | $14.79M |
| Investments in Property Plant and Equipment | $-76.87M | $-51.26M | $-44.85M | $-30.25M | $-64.54M | $-39.95M | $-32.54M | $-17.88M | $-43.29M | $-32.80M | $-41.96M | $-12.91M | $-41.72M | $-25.51M | $-29.24M | $-26.83M | $-30.84M | $-25.70M | $-31.72M | $-19.85M |
| Acquisitions Net | $-209.43M | $-257.68M | $-663.00K | $194.00K | $-3.94M | $-299.98M | $-546.96M | $152.00K | $-4.23M | $-17.71M | $-6.49M | $-49.76M | $-17.54M | $-147.63M | $-913.00K | $-4.57M | $-7.08M | $-5.29M | $-14.95M | $-5.14M |
| Purchases of Investments | $- | $- | $- | $- | $- | $- | $- | $- | $- | $- | $- | $- | $- | $- | $- | $- | $- | $- | $- | $- |
| Sales Maturities of Investments | $- | $- | $- | $- | $- | $- | $- | $- | $1.64M | $- | $- | $- | $- | $- | $- | $- | $- | $- | $- | $- |
| Other Investing Activities | $318.00K | $-2.71M | $140.00K | $488.00K | $-1 | $195.00K | $361.00K | $1 | $29.00K | $64.00K | $362.00K | $145.00K | $195.00K | $190.00K | $280.00K | $123.00K | $103.00K | $230.00K | $149.00K | $51.00K |
| Net Cash Used for Investing Activities | $-285.98M | $-311.65M | $-42.92M | $-30.06M | $-68.48M | $-339.93M | $-579.50M | $-17.73M | $-45.86M | $-50.45M | $-48.09M | $-62.52M | $-59.06M | $-172.95M | $-29.87M | $-31.28M | $-37.81M | $-30.76M | $-46.52M | $-24.94M |
| Debt Repayment | $42.09M | $39.25M | $-9.19M | $-9.08M | $-7.69M | $27.06M | $421.19M | $-9.00M | $4.20M | $-2.11M | $10.32M | $16.59M | $1.41M | $-2.87M | $-2.37M | $-2.77M | $-1.77M | $911.00K | $-24.33M | $32.81M |
| Common Stock Issued | $-324.00K | $496.57M | $- | $- | $495.73B | $-172.00K | $496.40M | $- | $- | $- | $173.00K | $19.00K | $9.00K | $51.00K | $- | $112.00K | $144.79M | $- | $- | $- |
| Common Stock Repurchased | $- | $- | $- | $- | $83.00K | $-83.00K | $- | $- | $- | $- | $- | $- | $- | $- | $- | $- | $- | $- | $- | $- |
| Dividends Paid | $- | $- | $- | $- | $- | $- | $- | $- | $- | $- | $- | $- | $- | $- | $- | $- | $- | $- | $- | $- |
| Other Financing Activities | $-1.22M | $-6.45M | $- | $- | $- | $-5.49M | $- | $-282.00K | $- | $-3.00K | $-2.04M | $7.00K | $-3.67M | $51.00K | $- | $112.00K | $144.79M | $-1.52M | $- | $89.00K |
| Net Cash Used Provided by Financing Activities | $40.55M | $529.37M | $-9.19M | $-9.08M | $-7.69M | $21.41M | $917.59M | $-9.00M | $4.20M | $-2.11M | $8.27M | $16.59M | $-2.26M | $-2.82M | $-2.37M | $-2.66M | $143.02M | $-609.00K | $-24.33M | $32.90M |
| Effect of Forex Changes on Cash | $- | $- | $- | $- | $53.71M | $309.80M | $- | $- | $- | $- | $- | $- | $- | $- | $- | $- | $- | $- | $- | $- |
| Net Change in Cash | $-135.67M | $309.53M | $19.05M | $-31.45M | $1.82M | $-246.63M | $405.49M | $-10.93M | $23.22M | $7.62M | $27.72M | $-21.21M | $-12.67M | $-120.70M | $14.62M | $-1.79M | $133.22M | $18.05M | $-23.15M | $22.75M |
| Cash at End of Period | $383.30M | $518.98M | $208.50M | $189.46M | $220.91M | $219.09M | $465.71M | $60.23M | $71.15M | $47.93M | $40.31M | $12.59M | $33.81M | $46.48M | $167.18M | $152.56M | $154.34M | $21.13M | $3.07M | $26.22M |
| Cash at Beginning of Period | $518.98M | $208.50M | $189.46M | $220.91M | $219.09M | $465.71M | $60.23M | $71.15M | $47.93M | $40.31M | $12.59M | $33.81M | $46.48M | $167.18M | $152.56M | $154.34M | $21.13M | $3.07M | $26.22M | $3.47M |
| Operating Cash Flow | $109.76M | $91.81M | $72.10M | $7.68M | $75.27M | $74.63M | $67.40M | $15.80M | $64.88M | $60.18M | $67.54M | $24.71M | $48.65M | $55.08M | $46.87M | $32.15M | $28.01M | $49.42M | $47.70M | $14.79M |
| Capital Expenditure | $-76.88M | $-51.53M | $-44.85M | $-30.25M | $-64.54M | $-39.95M | $-32.54M | $-17.88M | $-43.29M | $-32.80M | $-41.96M | $-12.91M | $-41.72M | $-25.51M | $-29.24M | $-26.83M | $-30.84M | $-25.70M | $-31.72M | $-19.85M |
| Free Cash Flow | $32.88M | $40.29M | $27.25M | $-22.57M | $10.72M | $34.68M | $34.86M | $-2.08M | $21.59M | $27.38M | $25.58M | $11.80M | $6.93M | $29.57M | $17.63M | $5.32M | $-2.83M | $23.72M | $15.98M | $-5.06M |
Casella Waste Systems Dividends
Explore Casella Waste Systems's dividend history, including dividend yield, payout ratio, and historical payments.
Casella Waste Systems News
Read the latest news about Casella Waste Systems, including recent articles, headlines, and updates.
Casella Waste Systems, Inc. to Host Conference Call on Its First Quarter 2025 Results and to Present at an Upcoming Investor Event
RUTLAND, Vt., April 09, 2025 (GLOBE NEWSWIRE) -- Casella Waste Systems, Inc. (Nasdaq: CWST), a regional solid waste, recycling, and resource management services company, will release its financial results for the three months ended March 31, 2025, after the market closes on Thursday, May 1, 2025.

Tariff-Resistant Investments: 3 Stocks For Trade Turbulence
Yesterday, President Trump imposed far-reaching new tariffs on U.S. trading partners, including a 10% levy on all imports and higher reciprocal tariffs for some countries. The announcement immediately triggered market volatility, with the S&P 500 ETF Trust (SPY) dropping nearly 3% in after-hours trading. Tariffs could hurt profits if companies absorb the costs, reduce sales if costs are passed to consumers, or strengthen the US dollar, impacting S&P 500 firms with foreign revenues.
Meet the Monster Stock That Continues to Crush the Market -- Even Outperforming Top Stocks Such as Tesla, MicroStrategy, and Amazon
Buying shares of Tesla, Strategy (formerly known as MicroStrategy), and Amazon at the beginning of 2015 would have been one of the greatest decisions any investor could have ever made. A $10,000 investment in each of these companies would now be worth over $150,000, $147,000, and $124,000, respectively.
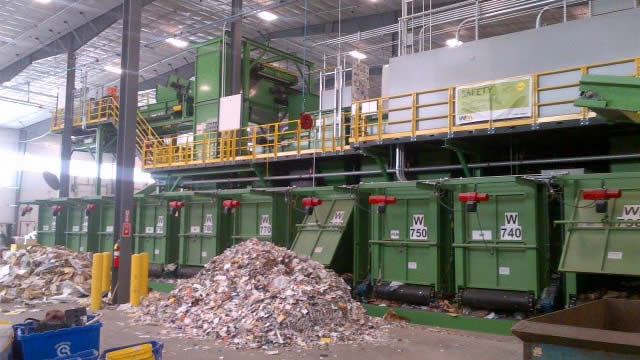
Casella Commits $1.5 Million to Launch UVM Center for Circular Economy
BURLINGTON, Vt., March 11, 2025 (GLOBE NEWSWIRE) -- Building on three decades of collaboration, Casella Waste Systems, Inc. (Casella) (Nasdaq: CWST), a regional solid waste, recycling, and resource management services company and the University of Vermont (UVM), an R1 research institution, announced that they are partnering to launch the Casella Center for Circular Economy and Sustainability at UVM.

Casella Waste Systems, Inc. Announces Pricing of Up to $25.0 Million of Vermont Economic Development Authority Solid Waste Disposal Revenue Bonds (Casella Waste Systems, Inc. Project) Series 2022A-2
RUTLAND, Vt., March 06, 2025 (GLOBE NEWSWIRE) -- Casella Waste Systems, Inc. (“Casella”) (NASDAQ:CWST), a regional solid waste, recycling and resource management services company, today announced that it has priced the previously announced offering of up to $25.0 million aggregate principal amount of Vermont Economic Development Authority (the “Issuer”) Solid Waste Disposal Revenue Bonds (Casella Waste Systems, Inc. Project) Series 2022A-2 (the “Bonds”) to be issued under an indenture between the Issuer and the bond trustee, dated as of June 1, 2022 (the “Indenture”). The Bonds represent the drawdown (which would no longer be available to the Company if not occurring by June 1, 2025) of the remainder of the Vermont Economic Development Authority Solid Waste Disposal Revenue Bonds (Casella Waste Systems, Inc. Project) Series 2022, the initial proceeds of which, in the amount of $35.0 million, were loaned to the Company in June 2022.

Casella Waste Systems, Inc. Announces Offering of the Vermont Economic Development Authority Solid Waste Disposal Revenue Bonds
RUTLAND, Vt., Feb. 28, 2025 (GLOBE NEWSWIRE) -- Casella Waste Systems, Inc. (“Casella”) (NASDAQ:CWST), a regional solid waste, recycling and resource management services company, today announced an offering of up to $25.0 million aggregate principal amount of Vermont Economic Development Authority (the “Issuer”) Solid Waste Disposal Revenue Bonds (Casella Waste Systems, Inc. Project) Series 2022A-2 (the “Bonds”) under an indenture between the Issuer and the bond trustee, dated as of June 1, 2022 (the “Indenture”). The Bonds represent the drawdown (which would no longer be available to the Company if not occurring by June 1, 2025) of the remainder of the Vermont Economic Development Authority Solid Waste Disposal Revenue Bonds (Casella Waste Systems, Inc. Project) Series 2022, the initial proceeds of which, in the amount of $35.0 million, were loaned to the Company in June 2022. The Bonds will be guaranteed under a guaranty (the “Guaranty”) by all or substantially all of Casella's subsidiaries (the “Guarantors”), as required by the terms of the loan agreement, dated as of June 1, 2022, between the Issuer and Casella (the “Loan Agreement”), pursuant to which the Issuer will loan the proceeds of the Bonds to Casella. Casella intends to use the net proceeds of the Bonds to finance and/or reimburse Casella for certain costs of certain capital projects in the State of Vermont.

Casella Recognized on Forbes America's Best Midsize Employers List
RUTLAND, Vt., Feb. 19, 2025 (GLOBE NEWSWIRE) -- Casella Waste Systems, Inc. (Nasdaq: CWST), a regional solid waste, recycling, and resource management services company, has been named to Forbes “America's Best Midsize Employers” list for 2025.

Casella Waste Systems, Inc. to Present at Upcoming Investor Conferences
RUTLAND, Vt., Feb. 18, 2025 (GLOBE NEWSWIRE) -- Casella Waste Systems, Inc. (Nasdaq: CWST), a regional solid waste, recycling, and resource management services company, announced today that the company's management will be participating at the following investor conferences: Raymond James 46 th Annual Institutional Investors Conference Monday, March 3, 2025 Gabelli 11 th Annual Waste & Sustainability Symposium Thursday, April 3, 2025 A copy of the presentation material will be available before the Company presents and may be accessed in the “Events & Presentations” section of the company's investor website at http://ir.casella.com.

Casella Waste Systems, Inc. (CWST) Q4 2024 Earnings Call Transcript
Casella Waste Systems, Inc. (NASDAQ:CWST ) Q4 2024 Earnings Conference Call February 13, 2025 10:00 AM ET Company Participants Jason Mead - SVP, Finance & Treasurer John Casella - Chairman & CEO Brad Helgeson - CFO Ned Coletta - President Sean Steves - SVP & COO, Solid Waste Operations Conference Call Participants Trevor Romeo - William Blair Tyler Brown - Raymond James Adam Bubes - Goldman Sachs Brian Butler - Stifel Tony Bancroft - GAMCO Investors Operator Hello, and welcome to Casella Waste Systems, Inc. Q4 2024 Conference Call. At this time, all participants are in a listen-only mode.

Casella Waste Systems, Inc. to Host Conference Call on Its Fourth Quarter 2024 Results
RUTLAND, Vt., Jan. 20, 2025 (GLOBE NEWSWIRE) -- Casella Waste Systems, Inc. (Nasdaq: CWST), a regional solid waste, recycling, and resource management services company, will release its financial results for the three months ended December 31, 2024 after the market closes on Wednesday, February 12, 2025.

Casella Waste Systems, Inc. Announces Pricing of Up to $45.0 Million of Finance Authority of Maine Solid Waste Disposal Revenue Bonds
RUTLAND, Vt., Dec. 17, 2024 (GLOBE NEWSWIRE) -- Casella Waste Systems, Inc. (“Casella”) (NASDAQ:CWST), a regional solid waste, recycling and resource management services company, today announced that it has priced the previously announced offering of up to $45.0 million aggregate principal amount of the Finance Authority of Maine (the “Authority”) Solid Waste Disposal Revenue Bonds (Casella Waste Systems, Inc. Project) Series 2024 (the “Bonds”) to be issued under an indenture between the Authority and the bond trustee, dated as of December 1, 2024.

Casella Waste Systems, Inc. Announces Offering of the Finance Authority of Maine Solid Waste Disposal Revenue Bonds
RUTLAND, Vt., Nov. 21, 2024 (GLOBE NEWSWIRE) -- Casella Waste Systems, Inc. (“Casella”) (NASDAQ:CWST), a regional solid waste, recycling and resource management services company, today announced an offering of up to $45.0 million aggregate principal amount of the Finance Authority of Maine (the “Authority”) Solid Waste Disposal Revenue Bonds (Casella Waste Systems, Inc. Project) Series 2024 (the “Bonds”) under an indenture between the Authority and the bond trustee. The Bonds will be guaranteed under a guaranty (the “Guaranty”) by substantially all of Casella's subsidiaries (the “Guarantors”), as required by the terms of the financing agreement between the Authority and Casella (the “Financing Agreement”), pursuant to which the Authority will loan the proceeds of the Bonds to Casella.

Casella Waste Systems, Inc. Announces Third Quarter 2024 Results and Recent Acquisition; Updates Fiscal Year 2024 Guidance
RUTLAND, Vt., Oct. 30, 2024 (GLOBE NEWSWIRE) -- Casella Waste Systems, Inc. (NASDAQ: CWST), a regional solid waste, recycling and resource management services company, today reported its financial results for the three and nine-month periods ended September 30, 2024.

Casella Waste Systems, Inc. to Host Conference Call on Its Third Quarter 2024 Results
RUTLAND, Vt., Oct. 14, 2024 (GLOBE NEWSWIRE) -- Casella Waste Systems, Inc. (Nasdaq: CWST), a regional solid waste, recycling, and resource management services company, will release its financial results for the three months ended September 30, 2024 after the market closes on Wednesday, October 30, 2024.

Casella Waste Systems, Inc. Announces Closing of $1.5 Billon Amended and Restated Credit Facility
RUTLAND, Vt., Sept. 30, 2024 (GLOBE NEWSWIRE) -- Casella Waste Systems, Inc. (Nasdaq: CWST), a regional solid waste, recycling, and resource management services company, today announced that it has entered into a $1.5 billion amended and restated credit agreement with Bank of America, N.A. as administrative agent and lender and a syndicate of other lenders (the “Credit Facility”). The Credit Facility matures on September 27, 2029 and replaces the Company's prior $1.08 billion credit facility.

Casella Waste Systems, Inc. Highlights Investments in its People, Recycling Infrastructure, and Communities in 2024 Sustainability Report (Updated)
RUTLAND, Vt., Sept. 24, 2024 (GLOBE NEWSWIRE) -- Casella Waste Systems, Inc. (Nasdaq: CWST) (“Casella,” the “Company”) published its 2024 Sustainability Report today, outlining its progress toward five key sustainability metrics, while highlighting significant achievements in several areas since its last report was issued in 2022.

Similar Companies
Related Metrics
Explore detailed financial metrics and analysis for CWST.


