Core Lithium Key Executives
This section highlights Core Lithium's key executives, including their titles and compensation details.
Find Contacts at Core Lithium
(Showing 0 of )
Core Lithium Earnings
This section highlights Core Lithium's earnings, including key dates, EPS, earnings reports, and earnings call transcripts.
Next Earnings Date
Last Earnings Results
Earnings Call Transcripts
| Transcript | Quarter | Year | Date | Estimated EPS | Actual EPS |
|---|
Financial Statements
Access annual & quarterly financial statements for Core Lithium, including income statements, balance sheets, and cash flow statements..
Annual Income Statement
| Breakdown | June 30, 2024 | June 30, 2023 | June 30, 2022 | June 30, 2021 | June 30, 2020 |
|---|---|---|---|---|---|
| Revenue | $189.49M | $50.60M | $- | $- | $- |
| Cost of Revenue | $158.60M | $19.99M | $116.13K | $136.81K | $141.48K |
| Gross Profit | $30.90M | $30.61M | $-116.13K | $-136.81K | $-141.48K |
| Gross Profit Ratio | 16.31% | 60.49% | - | - | - |
| Research and Development Expenses | $- | $- | $- | $- | $- |
| General and Administrative Expenses | $30.62M | $14.39M | $3.61M | $1.43M | $1.75M |
| Selling and Marketing Expenses | $- | $529.13K | $529.13K | $281.20K | $318.29K |
| Selling General and Administrative Expenses | $30.62M | $14.22M | $7.59M | $3.08M | $3.28M |
| Other Expenses | $71.21M | $-1.83M | $-14.43K | $244.31K | $161.29K |
| Operating Expenses | $101.83M | $14.22M | $7.59M | $3.08M | $3.28M |
| Cost and Expenses | $260.43M | $34.21M | $7.71M | $3.22M | $3.43M |
| Interest Income | $4.35M | $3.04M | $358.41K | $66.32K | $52.85K |
| Interest Expense | $1.14M | $2.10M | $99.83K | $1.68K | $4.45K |
| Depreciation and Amortization | $36.43M | $4.23M | $116.13K | $136.81K | $141.48K |
| EBITDA | $-163.06M | $15.56M | $-7.71M | $-2.77M | $-4.24M |
| EBITDA Ratio | -86.05% | 30.75% | - | - | - |
| Operating Income | $-70.94M | $16.39M | $-7.71M | $-3.22M | $-3.43M |
| Operating Income Ratio | -37.43% | 32.39% | - | - | - |
| Total Other Income Expenses Net | $-131.21M | $-1.06M | $253.33K | $-1.39M | $-960.07K |
| Income Before Tax | $-202.15M | $9.23M | $-7.47M | $-2.91M | $-4.39M |
| Income Before Tax Ratio | -106.68% | 18.24% | - | - | - |
| Income Tax Expense | $4.86M | $-1.58M | $2 | $-99.75K | $-1 |
| Net Income | $-207.01M | $10.81M | $-7.47M | $-2.91M | $-4.39M |
| Net Income Ratio | -109.25% | 21.36% | - | - | - |
| EPS | $-0.10 | $0.01 | $0.00 | $0.00 | $-0.01 |
| EPS Diluted | $-0.10 | $0.01 | $0.00 | $0.00 | $-0.01 |
| Weighted Average Shares Outstanding | 2.09B | 1.58B | 1.58B | 1.06B | 802.06M |
| Weighted Average Shares Outstanding Diluted | 2.09B | 1.58B | 1.58B | 1.06B | 802.06M |
| SEC Filing | Source | Source | Source | Source | Source |
| Breakdown | June 30, 2024 | December 31, 2023 | June 30, 2023 | December 31, 2022 | June 30, 2022 | December 31, 2021 | June 30, 2021 | December 31, 2020 | June 30, 2020 | December 31, 2019 | June 30, 2019 | December 31, 2018 | June 30, 2018 | December 31, 2017 | June 30, 2017 | December 31, 2016 | June 30, 2016 | December 31, 2015 | June 30, 2015 | December 31, 2014 |
|---|---|---|---|---|---|---|---|---|---|---|---|---|---|---|---|---|---|---|---|---|
| Revenue | $54.70M | $134.80M | $50.60M | $- | $- | $- | $- | $- | $- | $- | $- | $- | $- | $- | $- | $- | $- | $22.19K | $17.24K | $- |
| Cost of Revenue | $67.64M | $132.61M | $23.00M | $84.51K | $76.33K | $39.80K | $73.25K | $63.56K | $69.03K | $72.45K | $27.98K | $- | $- | $- | $- | $- | $- | $- | $- | $- |
| Gross Profit | $-12.95M | $2.18M | $27.60M | $-84.51K | $-76.33K | $-39.80K | $-73.25K | $-63.56K | $-69.03K | $-72.45K | $-27.98K | $- | $- | $- | $- | $- | $- | $22.19K | $17.24K | $- |
| Gross Profit Ratio | -23.67% | 1.62% | 54.54% | - | - | - | - | - | - | - | - | 0.00% | 0.00% | 0.00% | 0.00% | 0.00% | 0.00% | 100.00% | 100.00% | 0.00% |
| Research and Development Expenses | $- | $- | $- | $- | $- | $- | $- | $- | $- | $- | $- | $- | $- | $- | $- | $- | $- | $- | $- | $- |
| General and Administrative Expenses | $11.60M | $13.81M | $9.39M | $8.83M | $7.13M | $589.04K | $- | $- | $- | $- | $729.28K | $729.28K | $470.08K | $470.08K | $333.86K | $333.86K | $156.16K | $156.16K | $200.54K | $320.26K |
| Selling and Marketing Expenses | $17.32M | $-97.00K | $-7.04M | $4.82M | $-2.82M | $2.26M | $- | $- | $- | $- | $-472.25K | $315.16K | $-324.96K | $417.40K | $-324.41K | $258.88K | $10.95K | $110.68K | $128.15K | $64.69K |
| Selling General and Administrative Expenses | $28.92M | $19.56M | $2.35M | $9.82M | $4.31M | $2.85M | $1.96M | $1.13M | $1.63M | $1.66M | $1.21M | $1.04M | $145.12K | $887.49K | $9.45K | $592.74K | $167.10K | $266.84K | $328.69K | $384.95K |
| Other Expenses | $- | $-27.58M | $- | $- | $- | $- | $- | $- | $- | $- | $- | $- | $- | $- | $- | $- | $- | $- | $- | $- |
| Operating Expenses | $28.92M | $166.55M | $2.35M | $9.82M | $4.31M | $2.85M | $1.96M | $1.13M | $1.63M | $1.66M | $1.21M | $1.07M | $806.87K | $1.38M | $1.20M | $921.14K | $833.82K | $872.27K | $1.08M | $454.27K |
| Cost and Expenses | $96.56M | $299.16M | $25.35M | $9.91M | $4.38M | $2.89M | $2.04M | $1.19M | $1.70M | $1.73M | $1.24M | $1.07M | $806.87K | $1.38M | $1.20M | $921.14K | $833.82K | $872.27K | $1.08M | $454.27K |
| Interest Income | $1.29M | $3.06M | $2.03M | $1.00M | $204.71K | $153.70K | $40.93K | $25.39K | $9.99K | $38.41K | $77.70K | $- | $38.86K | $51.88K | $83.33K | $42.59K | $15.68K | $3.21K | $10.05K | $15.59K |
| Interest Expense | $1.20M | $1.45M | $1.78M | $328.61K | $- | $- | $- | $- | $- | $- | $- | $- | $- | $- | $- | $- | $- | $- | $- | $- |
| Depreciation and Amortization | $1.29M | $31.94M | $4.14M | $84.51K | $76.33K | $39.80K | $73.25K | $63.56K | $69.03K | $72.45K | $27.98K | $82.68K | $44.77K | $490.71K | $575.72K | $327.20K | $149.39K | $604.87K | $718.31K | $52.61K |
| EBITDA | $-38.64M | $-13.80M | $24.38M | $-8.82M | $-4.10M | $-3.40M | $-1.92M | $-851.41K | $-2.66M | $-1.62M | $-1.31M | $-1.05M | $-762.09K | $-887.49K | $-624.04K | $-593.93K | $-683.63K | $-245.21K | $-339.49K | $-401.66K |
| EBITDA Ratio | -70.65% | -10.24% | 48.18% | - | - | - | - | - | - | - | - | - | - | - | - | - | - | -1105.16% | -1969.65% | - |
| Operating Income | $-41.86M | $-45.75M | $25.25M | $-9.91M | $-4.38M | $-2.89M | $-2.04M | $-1.19M | $-1.70M | $-1.73M | $-1.24M | $-1.13M | $-806.87K | $-1.38M | $-1.20M | $-921.14K | $-833.03K | $-850.09K | $-1.06M | $-454.27K |
| Operating Income Ratio | -76.53% | -33.94% | 49.90% | - | - | - | - | - | - | - | - | - | - | - | - | - | - | -3831.29% | -6137.17% | - |
| Total Other Income Expenses Net | $2.47M | $-145.38M | $-324.38K | $675.63K | $204.71K | $-397.59K | $40.96K | $274.40K | $-1.03M | $75.86K | $-97.03K | $-22.81K | $-622.89K | $-438.84K | $-1.11M | $-285.80K | $-141.12K | $3.21K | $10.05K | $-53.73K |
| Income Before Tax | $-39.39M | $-162.76M | $18.46M | $-9.23M | $-4.18M | $-3.29M | $-2.00M | $-914.98K | $-2.73M | $-1.65M | $-1.34M | $-1.07M | $-768.00K | $-1.33M | $-1.12M | $-878.54K | $-818.13K | $-846.87K | $-1.05M | $-438.68K |
| Income Before Tax Ratio | -72.02% | -120.74% | 36.48% | - | - | - | - | - | - | - | - | - | - | - | - | - | - | -3816.80% | -6078.88% | - |
| Income Tax Expense | $- | $4.86M | $-1.58M | $- | $3 | $-2 | $2 | $-1 | $4 | $5 | $1 | $- | $- | $- | $63.82K | $- | $256.85K | $127.10K | $- | $212.03K |
| Net Income | $-39.39M | $-167.62M | $20.04M | $-9.23M | $-4.18M | $-3.29M | $-2.00M | $-914.98K | $-2.73M | $-1.65M | $-1.34M | $-1.07M | $-768.00K | $-1.33M | $-1.06M | $-878.54K | $-1.07M | $-719.77K | $-1.05M | $-226.65K |
| Net Income Ratio | -72.02% | -124.35% | 39.61% | - | - | - | - | - | - | - | - | - | - | - | - | - | - | -3243.96% | -6078.88% | - |
| EPS | $-0.02 | $-0.08 | $0.01 | $-0.01 | $0.00 | $0.00 | $0.00 | $0.00 | $0.00 | $0.00 | $0.00 | $0.00 | $0.00 | $0.00 | $0.00 | $0.00 | $0.00 | $0.00 | $-0.01 | $0.00 |
| EPS Diluted | $-0.02 | $-0.08 | $0.01 | $-0.01 | $0.00 | $0.00 | $0.00 | $0.00 | $0.00 | $0.00 | $0.00 | $0.00 | $0.00 | $0.00 | $0.00 | $0.00 | $0.00 | $0.00 | $-0.01 | $0.00 |
| Weighted Average Shares Outstanding | 2.14B | 2.05B | 1.86B | 1.78B | 1.73B | 1.49B | 1.10B | 988.46M | 810.26M | 788.88M | 690.87M | 627.79M | 534.08M | 437.44M | 372.45M | 312.09M | 222.75M | 166.42M | 150.30M | 125.91M |
| Weighted Average Shares Outstanding Diluted | 2.14B | 2.05B | 1.86B | 1.78B | 1.73B | 1.49B | 1.10B | 988.46M | 810.26M | 788.88M | 690.87M | 637.14M | 543.63M | 437.44M | 374.07M | 312.01M | 223.64M | 166.39M | 150.29M | 126.61M |
| SEC Filing | Source | Source | Source | Source | Source | Source | Source | Source | Source | Source | Source | Source | Source | Source | Source | Source | Source | Source | Source | Source |
Annual Balance Sheet
| Breakdown | June 30, 2024 | June 30, 2023 | June 30, 2022 | June 30, 2021 | June 30, 2020 |
|---|---|---|---|---|---|
| Cash and Cash Equivalents | $88.18M | $152.79M | $135.20M | $38.11M | $8.68M |
| Short Term Investments | $570.00K | $160.00K | $190.07K | $80.25K | $30.25K |
| Cash and Short Term Investments | $88.18M | $152.95M | $135.39M | $38.19M | $8.71M |
| Net Receivables | $1.46M | $6.75M | $2.55M | $114.99K | $37.68K |
| Inventory | $8.53M | $28.85M | $176.56K | $- | $- |
| Other Current Assets | $1.34M | $3.19M | $538.33K | $68.28K | $17.72K |
| Total Current Assets | $99.51M | $191.73M | $138.66M | $38.38M | $8.77M |
| Property Plant Equipment Net | $209.82M | $241.17M | $70.53M | $305.97K | $219.04K |
| Goodwill | $- | $- | $- | $- | $- |
| Intangible Assets | $- | $- | $- | $- | $- |
| Goodwill and Intangible Assets | $- | $-1 | $- | $- | $- |
| Long Term Investments | $11.92M | $11.80M | $12.51M | $793.03K | $421.04K |
| Tax Assets | $- | $4.86M | $- | $- | $- |
| Other Non-Current Assets | $2.71M | $53.57M | $40.15M | $33.72M | $26.38M |
| Total Non-Current Assets | $224.45M | $311.41M | $123.20M | $34.82M | $27.02M |
| Other Assets | $- | $1 | $- | $- | $1 |
| Total Assets | $323.96M | $503.14M | $261.85M | $73.19M | $35.79M |
| Account Payables | $3.84M | $3.41M | $2.24M | $626.79K | $155.85K |
| Short Term Debt | $477.00K | $3.46M | $1.19M | $57.43K | $109.83K |
| Tax Payables | $- | $- | $- | $- | $- |
| Deferred Revenue | $661.00K | $2.37M | $2.37M | $- | $- |
| Other Current Liabilities | $32.82M | $114.13M | $12.49M | $1.09M | $1.92M |
| Total Current Liabilities | $37.80M | $121.00M | $18.29M | $1.77M | $2.18M |
| Long Term Debt | $3.06M | $19.48M | $896.83K | $44.91K | $9.78K |
| Deferred Revenue Non-Current | $- | $- | $- | $- | $- |
| Deferred Tax Liabilities Non-Current | $- | $- | $- | $- | $- |
| Other Non-Current Liabilities | $26.23M | $7.74M | $3.94M | $65.08K | $32.11K |
| Total Non-Current Liabilities | $29.28M | $27.22M | $4.84M | $109.99K | $41.88K |
| Other Liabilities | $- | $- | $- | $1 | $- |
| Total Liabilities | $67.09M | $148.22M | $23.13M | $1.88M | $2.22M |
| Preferred Stock | $- | $- | $- | $- | $- |
| Common Stock | $478.63M | $370.94M | $265.67M | $90.61M | $49.86M |
| Retained Earnings | $-223.38M | $-16.55M | $-27.40M | $-19.94M | $-17.03M |
| Accumulated Other Comprehensive Income Loss | $1.62M | $532.00K | $453.89K | $652.52K | $746.54K |
| Other Total Stockholders Equity | $- | $- | $- | $- | $- |
| Total Stockholders Equity | $256.87M | $354.92M | $238.72M | $71.31M | $33.57M |
| Total Equity | $256.87M | $354.92M | $238.72M | $71.31M | $33.57M |
| Total Liabilities and Stockholders Equity | $323.96M | $503.14M | $261.85M | $73.19M | $35.79M |
| Minority Interest | $- | $- | $- | $- | $- |
| Total Liabilities and Total Equity | $323.96M | $503.14M | $261.85M | $73.19M | $35.79M |
| Total Investments | $12.49M | $11.96M | $12.70M | $873.28K | $451.29K |
| Total Debt | $3.53M | $22.94M | $2.09M | $102.34K | $119.61K |
| Net Debt | $-84.64M | $-129.84M | $-133.11M | $-38.01M | $-8.56M |
Balance Sheet Charts
| Breakdown | June 30, 2024 | December 31, 2023 | June 30, 2023 | December 31, 2022 | June 30, 2022 | December 31, 2021 | June 30, 2021 | December 31, 2020 | June 30, 2020 | December 31, 2019 | June 30, 2019 | December 31, 2018 | June 30, 2018 | December 31, 2017 | June 30, 2017 | December 31, 2016 | June 30, 2016 | December 31, 2015 | June 30, 2015 | December 31, 2014 |
|---|---|---|---|---|---|---|---|---|---|---|---|---|---|---|---|---|---|---|---|---|
| Cash and Cash Equivalents | $88.18M | $124.83M | $152.79M | $125.34M | $135.20M | $157.08M | $38.11M | $4.53M | $8.68M | $4.00M | $2.39M | $4.38M | $8.00M | $4.58M | $6.12M | $8.27M | $2.41M | $213.12K | $533.83K | $1.15M |
| Short Term Investments | $570.00K | $570.00K | $160.00K | $190.07K | $190.07K | $190.07K | $80.25K | $- | $30.25K | $- | $2.40K | $- | $- | $- | $- | $- | $- | $- | $- | $- |
| Cash and Short Term Investments | $88.18M | $125.40M | $152.95M | $125.53M | $135.39M | $157.27M | $38.19M | $4.53M | $8.71M | $4.00M | $2.39M | $4.38M | $8.00M | $4.58M | $6.12M | $8.27M | $2.41M | $213.12K | $533.83K | $1.15M |
| Net Receivables | $1.46M | $10.20M | $6.75M | $- | $2.55M | $- | $114.99K | $44.15K | $37.68K | $47.62K | $610.40K | $- | $585.75K | $544.00K | $368.51K | $- | $91.12K | $220.15K | $- | $- |
| Inventory | $8.53M | $33.59M | $28.85M | $8.96M | $176.56K | $69.90K | $- | $- | $- | $1 | $-610.40K | $- | $-585.75K | $- | $-368.51K | $- | $-91.12K | $- | $-56.20K | $- |
| Other Current Assets | $1.34M | $2.05M | $3.19M | $10.03M | $538.33K | $2.92M | $68.28K | $127.52K | $17.72K | $611.96K | $- | $515.84K | $- | $544.00K | $- | $257.92K | $- | $- | $- | $416.39K |
| Total Current Assets | $99.51M | $171.24M | $191.73M | $144.53M | $138.66M | $160.26M | $38.38M | $4.66M | $8.77M | $4.66M | $2.45M | $4.90M | $8.59M | $5.12M | $6.49M | $8.52M | $2.50M | $433.27K | $590.04K | $1.57M |
| Property Plant Equipment Net | $209.82M | $135.19M | $241.17M | $184.85M | $70.53M | $28.02M | $305.97K | $166.83K | $219.04K | $284.99K | $27.45M | $24.01M | $18.44M | $15.70M | $9.49M | $8.16M | $6.33M | $5.95M | $5.87M | $6.07M |
| Goodwill | $- | $- | $- | $- | $- | $- | $- | $- | $- | $- | $- | $- | $- | $- | $- | $- | $- | $- | $- | $- |
| Intangible Assets | $- | $- | $- | $- | $- | $- | $- | $- | $- | $- | $- | $- | $- | $- | $- | $- | $- | $- | $- | $- |
| Goodwill and Intangible Assets | $- | $- | $-1 | $- | $- | $- | $- | $- | $- | $- | $- | $- | $- | $- | $- | $- | $- | $- | $- | $- |
| Long Term Investments | $11.92M | $11.92M | $11.80M | $4.51M | $12.51M | $- | $793.03K | $- | $421.04K | $- | $- | $- | $- | $- | $- | $- | $- | $- | $- | $- |
| Tax Assets | $- | $- | $4.86M | $- | $- | $- | $- | $- | $- | $- | $- | $- | $- | $- | $- | $- | $- | $- | $- | $- |
| Other Non-Current Assets | $2.71M | $74.32M | $53.57M | $48.49M | $40.15M | $50.61M | $33.72M | $30.19M | $26.38M | $24.80M | $-27.45M | $-24.01M | $-18.44M | $-15.70M | $-9.49M | $1 | $-6.33M | $-5.95M | $-5.87M | $-6.07M |
| Total Non-Current Assets | $224.45M | $221.43M | $311.41M | $237.86M | $123.20M | $78.63M | $34.82M | $30.36M | $27.02M | $25.09M | $27.45M | $24.01M | $18.44M | $15.70M | $9.49M | $8.16M | $6.33M | $5.95M | $5.87M | $6.07M |
| Other Assets | $- | $1 | $1 | $1 | $- | $- | $- | $- | $1 | $- | $551.83K | $- | $- | $- | $- | $- | $- | $- | $- | $- |
| Total Assets | $323.96M | $392.67M | $503.14M | $382.39M | $261.85M | $238.89M | $73.19M | $35.02M | $35.79M | $29.75M | $30.44M | $28.91M | $27.03M | $20.82M | $15.98M | $16.68M | $8.83M | $6.38M | $6.46M | $7.64M |
| Account Payables | $3.84M | $31.97M | $3.41M | $22.23M | $3.57M | $504.91K | $626.79K | $854.74K | $155.85K | $749.77K | $235.60K | $1.51M | $540.04K | $734.40K | $458.42K | $718.97K | $546.97K | $181.84K | $114.54K | $284.73K |
| Short Term Debt | $477.00K | $2.27M | $3.46M | $3.05M | $1.19M | $10.87M | $57.43K | $- | $109.83K | $- | $- | $- | $- | $- | $- | $- | $- | $- | $- | $- |
| Tax Payables | $- | $- | $- | $- | $- | $- | $- | $- | $- | $- | $- | $- | $- | $- | $- | $- | $- | $- | $- | $- |
| Deferred Revenue | $661.00K | $- | $2.37M | $2.37M | $2.37M | $2.37M | $- | $- | $- | $- | $- | $- | $- | $- | $- | $- | $- | $- | $- | $- |
| Other Current Liabilities | $32.82M | $27.44M | $114.13M | $3.77M | $11.15M | $13.28M | $1.09M | $103.50K | $1.92M | $61.13K | $344.68K | $15.65K | $296.94K | $14.34K | $400.16K | $3.93K | $42.63K | $11.89K | $35.95K | $12.60K |
| Total Current Liabilities | $37.80M | $61.68M | $121.00M | $29.05M | $18.29M | $16.31M | $1.77M | $958.24K | $2.18M | $810.90K | $580.28K | $1.53M | $836.98K | $748.74K | $858.59K | $722.90K | $589.60K | $193.73K | $150.49K | $297.33K |
| Long Term Debt | $3.06M | $3.31M | $19.48M | $18.42M | $896.83K | $360.89K | $44.91K | $- | $9.78K | $- | $- | $- | $- | $- | $- | $- | $- | $- | $- | $- |
| Deferred Revenue Non-Current | $- | $- | $- | $- | $- | $- | $- | $- | $- | $- | $- | $- | $- | $- | $- | $- | $- | $- | $- | $- |
| Deferred Tax Liabilities Non-Current | $- | $- | $- | $- | $- | $- | $- | $- | $- | $- | $- | $- | $- | $- | $- | $- | $- | $- | $- | $- |
| Other Non-Current Liabilities | $26.23M | $32.07M | $7.74M | $7.68M | $3.94M | $1.71M | $65.08K | $50.54K | $32.11K | $65.56K | $- | $- | $- | $- | $- | $- | $- | $- | $- | $- |
| Total Non-Current Liabilities | $29.28M | $35.38M | $27.22M | $26.11M | $4.84M | $2.07M | $109.99K | $50.54K | $41.88K | $65.56K | $- | $- | $- | $- | $- | $- | $- | $- | $- | $- |
| Other Liabilities | $- | $1 | $- | $1 | $- | $1 | $1 | $- | $- | $- | $- | $- | $- | $- | $- | $- | $- | $- | $- | $- |
| Total Liabilities | $67.09M | $97.07M | $148.22M | $55.16M | $23.13M | $18.38M | $1.88M | $1.01M | $2.22M | $876.47K | $580.28K | $1.53M | $836.98K | $748.74K | $858.59K | $722.90K | $589.60K | $193.73K | $150.49K | $297.33K |
| Preferred Stock | $- | $- | $- | $- | $- | $- | $- | $- | $- | $- | $- | $- | $- | $- | $- | $- | $- | $- | $- | $- |
| Common Stock | $478.63M | $478.63M | $370.94M | $363.51M | $265.67M | $243.13M | $90.61M | $51.25M | $49.86M | $42.67M | $42.18M | $38.51M | $36.39M | $30.31M | $23.95M | $23.84M | $15.30M | $12.39M | $11.93M | $11.93M |
| Retained Earnings | $-223.38M | $-183.99M | $-16.55M | $-36.59M | $-27.40M | $-23.22M | $-19.94M | $-17.95M | $-17.03M | $-14.38M | $-12.81M | $-12.35M | $-11.28M | $-10.51M | $-9.45M | $-8.39M | $-7.52M | $-6.87M | $-6.15M | $-5.10M |
| Accumulated Other Comprehensive Income Loss | $1.62M | $958.00K | $532.00K | $312.45K | $453.89K | $605.51K | $652.52K | $704.77K | $746.54K | $584.19K | $487.34K | $1.22M | $1.09M | $281.78K | $627.38K | $518.56K | $461.72K | $671.27K | $527.08K | $519.09K |
| Other Total Stockholders Equity | $- | $- | $- | $- | $- | $- | $- | $- | $- | $- | $- | $- | $- | $- | $- | $- | $-1 | $1 | $- | $- |
| Total Stockholders Equity | $256.87M | $295.60M | $354.92M | $327.23M | $238.72M | $220.51M | $71.31M | $34.01M | $33.57M | $28.87M | $29.86M | $27.38M | $26.20M | $20.08M | $15.13M | $15.96M | $8.24M | $6.19M | $6.31M | $7.35M |
| Total Equity | $256.87M | $295.60M | $354.92M | $327.23M | $238.72M | $220.51M | $71.31M | $34.01M | $33.57M | $28.87M | $29.86M | $27.38M | $26.20M | $20.08M | $15.13M | $15.96M | $8.24M | $6.19M | $6.31M | $7.35M |
| Total Liabilities and Stockholders Equity | $323.96M | $392.67M | $503.14M | $382.39M | $261.85M | $238.89M | $73.19M | $35.02M | $35.79M | $29.75M | $30.44M | $28.91M | $27.03M | $20.82M | $15.98M | $16.68M | $8.83M | $6.38M | $6.46M | $7.64M |
| Minority Interest | $- | $- | $- | $- | $- | $- | $- | $- | $- | $- | $- | $- | $- | $- | $- | $- | $- | $- | $- | $- |
| Total Liabilities and Total Equity | $323.96M | $392.67M | $503.14M | $382.39M | $261.85M | $238.89M | $73.19M | $35.02M | $35.79M | $29.75M | $30.44M | $28.91M | $27.03M | $20.82M | $15.98M | $16.68M | $8.83M | $6.38M | $6.46M | $7.64M |
| Total Investments | $12.49M | $12.49M | $11.96M | $4.70M | $12.70M | $190.07K | $873.28K | $- | $451.29K | $- | $2.40K | $- | $- | $- | $- | $- | $- | $- | $- | $- |
| Total Debt | $3.53M | $5.59M | $22.94M | $21.47M | $2.09M | $524.93K | $102.34K | $- | $119.61K | $- | $- | $- | $- | $- | $- | $- | $- | $- | $- | $- |
| Net Debt | $-84.64M | $-119.24M | $-129.84M | $-103.86M | $-133.11M | $-156.55M | $-38.01M | $-4.53M | $-8.56M | $-4.00M | $-2.39M | $-4.38M | $-8.00M | $-4.58M | $-6.12M | $-8.27M | $-2.41M | $-213.12K | $-533.83K | $-1.15M |
Annual Cash Flow
| Breakdown | June 30, 2024 | June 30, 2023 | June 30, 2022 | June 30, 2021 | June 30, 2020 |
|---|---|---|---|---|---|
| Net Income | $-207.01M | $10.81M | $-7.47M | $-2.91M | $-4.39M |
| Depreciation and Amortization | $36.81M | $4.23M | $116.13K | $136.81K | $141.48K |
| Deferred Income Tax | $- | $-8.91M | $-391.26K | $-590.76K | $-761.01K |
| Stock Based Compensation | $- | $454.00K | $159.00K | $317.14K | $478.05K |
| Change in Working Capital | $- | $-10.65M | $875.47K | $109.67K | $116.94K |
| Accounts Receivables | $- | $- | $- | $- | $- |
| Inventory | $- | $- | $- | $- | $- |
| Accounts Payables | $- | $- | $- | $- | $- |
| Other Working Capital | $-66.45M | $-10.65M | $875.47K | $109.67K | $116.94K |
| Other Non Cash Items | $92.27M | $94.87M | $486.60K | $596.34K | $1.77M |
| Net Cash Provided by Operating Activities | $-77.94M | $90.81M | $-6.22M | $-2.34M | $-2.64M |
| Investments in Property Plant and Equipment | $-87.23M | $-165.61M | $-69.22M | $-8.00M | $-5.62M |
| Acquisitions Net | $42.00K | $- | $- | $- | $- |
| Purchases of Investments | $-530.00K | $-7.26M | $-109.82K | $- | $- |
| Sales Maturities of Investments | $- | $- | $- | $- | $- |
| Other Investing Activities | $-918.00K | $1.25M | $-1.23M | $-374.49K | $7.01M |
| Net Cash Used for Investing Activities | $-88.64M | $-171.62M | $-70.56M | $-8.37M | $1.38M |
| Debt Repayment | $- | $- | $- | $- | $- |
| Common Stock Issued | $107.69M | $101.65M | $174.72M | $40.32M | $7.52M |
| Common Stock Repurchased | $- | $-3.81M | $-6.81M | $-2.46M | $-361.03K |
| Dividends Paid | $- | $- | $- | $- | $- |
| Other Financing Activities | $-5.30M | $-3.86M | $-849.38K | $-125.84K | $59.16K |
| Net Cash Used Provided by Financing Activities | $102.39M | $97.79M | $173.87M | $40.20M | $7.58M |
| Effect of Forex Changes on Cash | $-997.00K | $609.00K | $361 | $-80.25K | $-1 |
| Net Change in Cash | $-65.18M | $17.59M | $97.09M | $29.43M | $6.29M |
| Cash at End of Period | $87.61M | $152.79M | $135.20M | $38.11M | $8.68M |
| Cash at Beginning of Period | $152.79M | $135.20M | $38.11M | $8.68M | $2.39M |
| Operating Cash Flow | $-77.94M | $90.81M | $-6.22M | $-2.34M | $-2.64M |
| Capital Expenditure | $-87.23M | $-165.61M | $-69.22M | $-8.00M | $-5.62M |
| Free Cash Flow | $-165.17M | $-74.80M | $-75.44M | $-10.34M | $-8.26M |
Cash Flow Charts
| Breakdown | June 30, 2024 | December 31, 2023 | June 30, 2023 | December 31, 2022 | June 30, 2022 | December 31, 2021 | June 30, 2021 | December 31, 2020 | June 30, 2020 | December 31, 2019 | June 30, 2019 | December 31, 2018 | June 30, 2018 | December 31, 2017 | June 30, 2017 | December 31, 2016 | June 30, 2016 | December 31, 2015 | June 30, 2015 | December 31, 2014 |
|---|---|---|---|---|---|---|---|---|---|---|---|---|---|---|---|---|---|---|---|---|
| Net Income | $-39.39M | $-167.62M | $20.04M | $-9.23M | $-4.18M | $-3.29M | $-2.00M | $-914.98K | $-2.73M | $-1.65M | $-1.34M | $-1.07M | $-768.00K | $-1.33M | $-1.06M | $-878.54K | $-1.07M | $-719.77K | $-1.05M | $-226.65K |
| Depreciation and Amortization | $2.46M | $34.43M | $4.14M | $84.51K | $76.33K | $39.80K | $73.25K | $63.56K | $69.03K | $72.45K | $27.98K | $82.68K | $44.77K | $490.71K | $575.72K | $327.20K | $149.39K | $604.87K | $718.31K | $52.61K |
| Deferred Income Tax | $- | $- | $2.01M | $- | $-1.06M | $- | $- | $- | $- | $- | $- | $- | $- | $- | $- | $- | $- | $- | $- | $- |
| Stock Based Compensation | $661.00K | $611.00K | $354.99K | $99.00K | $34.59K | $124.41K | $242.71K | $74.42K | $240.55K | $237.50K | $-14.95K | $- | $162.31K | $- | $187.83K | $- | $162.03K | $- | $19.86K | $- |
| Change in Working Capital | $7.75M | $- | $-10.65M | $- | $876.00K | $- | $109.67K | $- | $116.94K | $- | $96.49K | $- | $122.67K | $- | $-167.52K | $- | $521.39K | $- | $319.51K | $- |
| Accounts Receivables | $- | $- | $- | $- | $- | $- | $- | $- | $- | $- | $- | $- | $- | $- | $- | $- | $- | $- | $- | $- |
| Inventory | $- | $- | $- | $- | $- | $- | $- | $- | $- | $- | $- | $- | $- | $- | $- | $- | $- | $- | $- | $- |
| Accounts Payables | $- | $- | $- | $- | $- | $- | $- | $- | $- | $- | $- | $- | $- | $- | $- | $- | $- | $- | $- | $- |
| Other Working Capital | $7.75M | $- | $-10.65M | $- | $876.00K | $- | $109.67K | $- | $116.94K | $- | $96.49K | $- | $122.67K | $- | $-167.52K | $- | $521.39K | $- | $319.51K | $- |
| Other Non Cash Items | $5.37M | $77.80M | $87.31M | $-3.09M | $2.20M | $-836.31K | $736.21K | $-30.20K | $1.75M | $145.27K | $170.55K | $81.83K | $14.43K | $-21.37K | $162.54K | $-162.54K | $164.20K | $-164.20K | $-25.24K | $25.24K |
| Net Cash Provided by Operating Activities | $-23.15M | $-54.79M | $103.21M | $-12.40M | $-2.05M | $-4.16M | $-1.33M | $-1.01M | $-1.06M | $-1.58M | $-1.19M | $-902.75K | $-423.82K | $-856.98K | $-296.58K | $-713.88K | $-77.97K | $-279.10K | $-15.32K | $-148.80K |
| Investments in Property Plant and Equipment | $-10.90M | $-76.33M | $-71.48M | $-94.13M | $-41.44M | $-27.78M | $-3.62M | $-4.38M | $-1.65M | $-3.98M | $-4.33M | $-5.29M | $-2.95M | $-4.92M | $-1.95M | $-1.86M | $-588.65K | $-675.20K | $-601.66K | $-1.01M |
| Acquisitions Net | $- | $42.00K | $- | $- | $- | $- | $- | $- | $- | $- | $- | $- | $- | $- | $- | $- | $- | $- | $- | $- |
| Purchases of Investments | $- | $- | $- | $- | $- | $-109.82K | $- | $- | $- | $- | $- | $- | $- | $- | $- | $- | $- | $- | $- | $- |
| Sales Maturities of Investments | $- | $- | $- | $- | $- | $- | $- | $- | $- | $- | $- | $- | $- | $- | $- | $- | $- | $- | $- | $- |
| Other Investing Activities | $-918.00K | $-488.00K | $-6.09M | $86.22K | $65.74K | $-1.30M | $-374.49K | $- | $130.80K | $6.88M | $-57.63K | $882 | $14.05K | $- | $- | $- | $-470 | $470 | $- | $- |
| Net Cash Used for Investing Activities | $-11.81M | $-76.82M | $-77.57M | $-94.05M | $-41.38M | $-29.18M | $-4.00M | $-4.38M | $-1.52M | $2.90M | $-4.33M | $-5.29M | $-2.93M | $-4.92M | $-1.95M | $-1.86M | $-589.12K | $-674.73K | $-601.66K | $-1.01M |
| Debt Repayment | $- | $-2.67M | $- | $-1.36M | $- | $-53.38K | $- | $-56.36K | $- | $- | $- | $- | $- | $- | $- | $- | $- | $- | $- | $- |
| Common Stock Issued | $- | $107.69M | $3.70M | $97.96M | $22.35M | $152.37M | $39.06M | $1.26M | $7.21M | $310.61K | $3.83M | $- | $- | $- | $- | $- | $- | $- | $- | $- |
| Common Stock Repurchased | $- | $- | $- | $- | $- | $- | $- | $- | $- | $- | $- | $- | $- | $- | $- | $- | $- | $- | $- | $- |
| Dividends Paid | $- | $- | $- | $- | $- | $- | $- | $- | $- | $- | $- | $- | $- | $- | $- | $- | $- | $- | $- | $- |
| Other Financing Activities | $-2.63M | $107.69M | $1.20M | $97.96M | $21.55M | $152.37M | $38.99M | $1.26M | $74.81K | $-15.65K | $-298.64K | $2.57M | $6.78M | $4.23M | $100.18K | $8.43M | $2.87M | $633.12K | $-4.12K | $1.63M |
| Net Cash Used Provided by Financing Activities | $-2.63M | $105.02M | $1.20M | $96.59M | $21.55M | $152.32M | $38.99M | $1.21M | $7.28M | $294.95K | $3.53M | $2.57M | $6.78M | $4.23M | $100.18K | $8.43M | $2.87M | $633.12K | $-4.12K | $1.63M |
| Effect of Forex Changes on Cash | $377.00K | $-1.37M | $609.00K | $135.20M | $-135.20M | $38.11M | $-38.19M | $8.71M | $-8.71M | $2.39M | $-2.39M | $8.00M | $-8.00M | $6.12M | $-6.12M | $2.41M | $-2.41M | $533.83K | $-533.83K | $683.14K |
| Net Change in Cash | $-37.22M | $-27.96M | $27.45M | $-9.86M | $-21.88M | $118.97M | $33.58M | $-4.15M | $4.68M | $1.61M | $-1.99M | $4.38M | $-4.58M | $4.58M | $-8.27M | $8.27M | $-213.12K | $213.12K | $-1.15M | $1.15M |
| Cash at End of Period | $87.61M | $124.83M | $152.79M | $125.34M | $135.20M | $157.08M | $38.11M | $4.53M | $8.68M | $4.00M | $2.39M | $4.38M | $- | $4.58M | $- | $8.27M | $- | $213.12K | $- | $1.15M |
| Cash at Beginning of Period | $124.83M | $152.79M | $125.34M | $135.20M | $157.08M | $38.11M | $4.53M | $8.68M | $4.00M | $2.39M | $4.38M | $- | $4.58M | $- | $8.27M | $- | $213.12K | $- | $1.15M | $- |
| Operating Cash Flow | $-23.15M | $-54.79M | $103.21M | $-12.40M | $-2.05M | $-4.16M | $-1.33M | $-1.01M | $-1.06M | $-1.58M | $-1.19M | $-902.75K | $-423.82K | $-856.98K | $-296.58K | $-713.88K | $-77.97K | $-279.10K | $-15.32K | $-148.80K |
| Capital Expenditure | $-10.90M | $-76.33M | $-71.48M | $-94.13M | $-41.44M | $-27.78M | $-3.62M | $-4.38M | $-1.65M | $-3.98M | $-4.33M | $-5.29M | $-2.95M | $-4.92M | $-1.95M | $-1.86M | $-588.65K | $-675.20K | $-601.66K | $-1.01M |
| Free Cash Flow | $-34.05M | $-131.12M | $31.73M | $-106.54M | $-43.50M | $-31.94M | $-4.96M | $-5.39M | $-2.70M | $-5.56M | $-5.53M | $-6.19M | $-3.37M | $-5.77M | $-2.24M | $-2.57M | $-666.61K | $-954.30K | $-616.98K | $-1.16M |

Core Lithium Ltd engages in the development of lithium and various metal deposits in Northern Territory and South Australia. The company primarily explores for copper, gold, iron, silver, uranium, lead, and zinc deposits. Its flagship project is the Finniss Lithium project located to the south of Darwin port in the Northern Territory. Core Lithium Ltd was incorporated in 2010 and is based in Adelaide, Australia.
$0.05
Stock Price
$110.37M
Market Cap
-
Employees
Adelaide, SA
Location
Revenue (FY 2024)
$189.49M
274.5% YoY
Net Income (FY 2024)
$-207.01M
-2015.0% YoY
EPS (FY 2024)
$-0.10
-1552.9% YoY
Free Cash Flow (FY 2024)
$-165.17M
-120.8% YoY
Profitability
Gross Margin
16.3%
Net Margin
-109.2%
ROE
-80.6%
ROA
-63.9%
Valuation
P/E Ratio
-0.92
P/S Ratio
1.01
EV/EBITDA
-0.65
Market Cap
$110.37M
Revenue & Net Income
Profit Margins
Cash Flow Summary
Operating Cash Flow
$-77.94M
-185.8% YoY
Free Cash Flow
$-165.17M
-120.8% YoY
Balance Sheet Summary
Total Assets
$323.96M
-35.6% YoY
Total Debt
$3.53M
84.6% YoY
Shareholder Equity
$256.87M
-45.4% YoY
Dividend Overview
No Dividend Data
Core Lithium Ltd doesn't currently pay dividends.
Core Lithium Dividends
Explore Core Lithium's dividend history, including dividend yield, payout ratio, and historical payments.
Core Lithium News
Read the latest news about Core Lithium, including recent articles, headlines, and updates.
Lithium Miners News For The Month Of October 2024
Lithium prices were flat the past month. Lithium market news - The US government is reportedly examining price support mechanisms for domestic critical mineral projects. BloombergNEF forecasts lithium deficits may begin in 2025. Lithium company news - Arcadium Lithium confirms takeover offer from Rio Tinto. Bikita Minerals has shut down one of its production plants, citing weak global prices.

Lithium Miners News For The Month Of February 2024
Lithium carbonate spot prices were generally flat the past month. Lithium market news - Fastmarkets forecast a tentatively balanced lithium market in 2024. US moves to restore stockpiling ‘panic button' in EV metals fight with China. Lithium company news - Albemarle plans to reduce capital expenditures, costs to unlock >US$750M of cash flow. Tianqi Lithium issues large negative profit warning.
Lithium Miners News For The Month Of December 2023
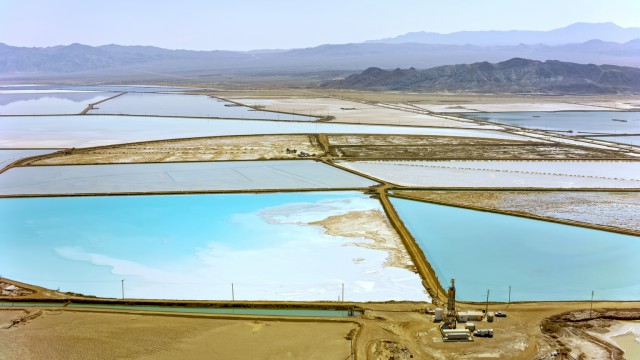
Lithium chemical spot prices and spodumene prices were lower the past month and are now below the marginal cost of production. Lithium market news - China Futures Co. analyst, Zhang Weixin, forecasts lithium carbonate to bottom out between CNY80-90,000/t. Milei looks to cut costs for Argentina's miners in broader deregulation push. Lithium company news - SQM and Hancock enter into implementation deed with Azure Minerals. Livent and Allkem shareholders approve merger of equals, new company name to be Arcadium Lithium.
Lithium Miners News For The Month Of November 2023
Lithium chemical spot prices and spodumene prices were significantly lower the past month. Lithium market news - Australia's largest lithium mine flags output cut on weak China demand. SQM announces acquisition offer for Azure Minerals for ~US$900m. Lithium company news - Allkem and Livent receive all required regulatory approvals globally to close merger of equals. Sayona Mining announces new high-grade zones encountered in NAL drilling.

Lithium Miners News For The Month Of October 2023
Lithium chemical spot prices and spodumene prices were slightly lower the past month. Citi short-term forecast is for lithium carbonate price to fall to US$18,000/t. Lithium market news - Argentina mulls charging lithium miners contribution. "Incredible lithium price spike" on way as new chemical capacity drives demand, says Brinsden. Lithium company news - Albemarle withdraws offer to acquire Liontown Resources. Ganfeng starts construction of US$250M lithium processing plant in Nigeria. Lithium Americas split finalizes to form LAC and LAAC.
Lithium Miners News For The Month Of September 2023
Lithium chemical spot prices and spodumene prices were significantly lower the past month. Lithium market news - BMI: "Battery capacity to increase 4-fold by 2030 to 4TWh." Argentina to reach top three spot among lithium players by 2027. Lithium company news - Albemarle raises offer to A$3.00 in takeover offer for Liontown Resources, receives $90m critical materials award from the DoD.
Lithium Miners News For The Month Of August 2023
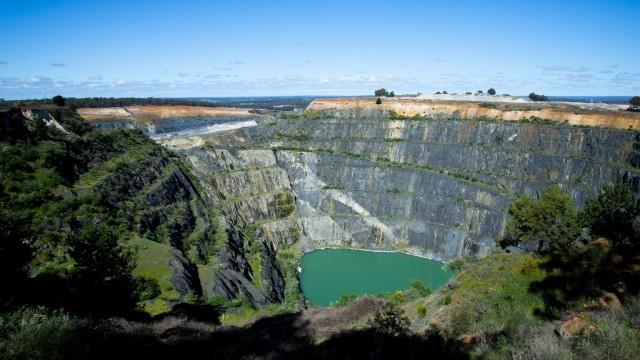
Lithium chemical spot prices and spodumene prices were significantly lower the past month. Lithium market news - BloombergNEF: EV battery sizes increasing may lead to battery supply chain shortages. BMI: 401 gigafactories planned to be in operation by 2030. Lithium company news - Albemarle invests C$109m Strategic Investment and MOU into Patriot Battery Metals. Pilbara Minerals announces 109Mt Mineral Resource increase to 414Mt.

Lithium Miners News For The Month Of July 2023
Lithium chemical spot prices and spodumene prices were lower the past month. Lithium market news - DoE: Lithium & nickel are the two 'high importance to energy' critical materials in the mid term (2025-2035). China lithium futures market begins trading. Lithium company news - Albemarle amends JV deal with Mineral Resources, to pay $380M-$400M, Albemarle will take 100% ownership of Kemerton LiOH facility.

Lithium Miners News For The Month Of June 2023
Lithium chemical spot prices and spodumene prices were very slightly higher in the past month. Fastmarkets - Lithium prices to remain elevated this year. Lithium market news - BNEF forecasts a 22x scale-up in annual lithium demand in 2022 and 2050 in the Net Zero Scenario. EU, Argentina sign raw materials MOU, lithium focus. Lithium company news - Ganfeng/LAC - First lithium produced as part of commissioning at Caucharí-Olaroz. Ganfeng/Leo Lithium - Goulamina total Resource increased by 48.2% to 211 Mt grading 1.37%.

Lithium Miners News For The Month Of March 2023
Lithium chemical spot prices were significantly lower and spodumene spot prices were lower the past month. "Surge in Chinese lithium prices has turned into rapid retreat". Lithium market news - Beijing probes illegal mining activities in Chinese lithium hub. EU Commission proposes 10% of their critical raw materials supply to be mined in Europe by 2030.
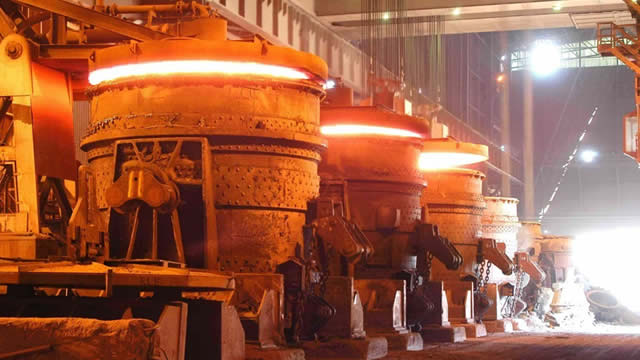
Core Lithium more than doubles mineral resources at BP33, key deposit for Finniss operation
(Kitco News) - Australian lithium developer Core Lithium (ASX: CXO) yesterday reported a significant upgrade to mineral resource estimate at BP33, a key deposit for the Finniss lithium operation in the Northern Territory.
Lithium Miners News For The Month Of February 2023
Lithium chemical prices were significantly lower and spodumene prices were roughly flat over the past month. Lithium market news - GM invests US$650m into Lithium Americas in return for Thacker Pass lithium off-take deal. Bloomberg: Tesla is considering a bid for battery metals miner (Sigma Lithium).

Tesla offtake deadline with Core Lithium lapses
(Kitco News) - >"With the recent official opening of the Finniss Lithium Mine and the underwritten share placement to fund accelerated resource definition, Core is well positioned to take advantage of strong global demand and constrained lithium supply," said the company in a news release.
A Brief Comparison Of The 6 Fully-Funded Lithium Juniors That Will Likely Be Producers In 2022-2024
Lithium demand and prices remain very strong. This supports the outlook for any lithium junior miners that can make it to production in the next 2 years. A comparison of the 6 lithium juniors including estimated production start up dates, market cap, target prices, upside/downside to price targets.

Core Lithium makes strong exploration progress at Finniss with further high-grade assays
Core Lithium Ltd (ASX:CXO) has made strong exploration progress from its Finniss Lithium Project near Darwin in the Northern Territory, laying the foundation for resource growth and potential expansion of future production. Promisingly, the lithium developer's recent exploration and mineral resource drilling has intersected lithium-rich spodumene pegmatite at a number of prospects.
Similar Companies
Related Metrics
Explore detailed financial metrics and analysis for CXOXF.
