Delek Logistics Partners, LP Key Executives
This section highlights Delek Logistics Partners, LP's key executives, including their titles and compensation details.
Find Contacts at Delek Logistics Partners, LP
(Showing 0 of )
Delek Logistics Partners, LP Earnings
This section highlights Delek Logistics Partners, LP's earnings, including key dates, EPS, earnings reports, and earnings call transcripts.
Next Earnings Date
Last Earnings Results
Earnings Call Transcripts
| Transcript | Quarter | Year | Date | Estimated EPS | Actual EPS |
|---|---|---|---|---|---|
| Read Transcript | Q4 | 2024 | 2025-02-25 | $0.74 | $0.68 |
| Read Transcript | Q3 | 2024 | 2024-11-06 | $0.84 | $0.71 |
| Read Transcript | Q2 | 2024 | 2024-08-06 | $0.82 | $0.87 |
| Read Transcript | Q1 | 2024 | 2024-05-07 | $0.79 | $0.73 |
| Read Transcript | Q4 | 2023 | 2024-02-27 | $0.85 | $0.85 |
| Read Transcript | Q3 | 2023 | 2023-11-07 | $0.79 | $0.80 |
| Read Transcript | Q2 | 2023 | 2023-08-07 | $0.83 | $0.73 |
| Read Transcript | Q1 | 2023 | 2023-05-08 | $1.01 | $0.86 |
Financial Statements
Access annual & quarterly financial statements for Delek Logistics Partners, LP, including income statements, balance sheets, and cash flow statements..
Annual Income Statement
| Breakdown | December 31, 2024 | December 31, 2023 | December 31, 2022 | December 31, 2021 | December 31, 2020 |
|---|---|---|---|---|---|
| Revenue | $940.64M | $1.02B | $1.04B | $700.90M | $563.42M |
| Cost of Revenue | $696.89M | $735.45M | $787.01M | $483.75M | $356.68M |
| Gross Profit | $243.75M | $284.96M | $249.40M | $217.15M | $206.74M |
| Gross Profit Ratio | 25.91% | 27.93% | 24.06% | 30.98% | 36.69% |
| Research and Development Expenses | $- | $- | $- | $- | $- |
| General and Administrative Expenses | $35.94M | $24.77M | $34.18M | $22.55M | $22.59M |
| Selling and Marketing Expenses | $- | $2.42M | $- | $- | $- |
| Selling General and Administrative Expenses | $35.94M | $27.18M | $34.18M | $22.55M | $22.59M |
| Other Expenses | $4.98M | $18.83M | $5.53M | $4.10M | $4.36M |
| Operating Expenses | $40.92M | $46.02M | $39.71M | $26.65M | $26.95M |
| Cost and Expenses | $737.81M | $781.46M | $826.73M | $510.40M | $383.62M |
| Interest Income | $47.79M | $- | $82.30M | $50.22M | $42.87M |
| Interest Expense | $150.96M | $143.24M | $82.30M | $50.22M | $42.87M |
| Depreciation and Amortization | $100.58M | $99.59M | $87.05M | $60.09M | $49.44M |
| EBITDA | $394.70M | $370.99M | $301.95M | $256.14M | $236.09M |
| EBITDA Ratio | 41.96% | 36.36% | 29.13% | 36.54% | 41.90% |
| Operating Income | $202.83M | $238.95M | $209.68M | $190.50M | $179.79M |
| Operating Income Ratio | 21.56% | 23.42% | 20.23% | 27.18% | 31.91% |
| Total Other Income Expenses Net | $-59.66M | $-111.51M | $-50.25M | $-25.53M | $-20.31M |
| Income Before Tax | $143.16M | $127.44M | $159.43M | $164.97M | $159.48M |
| Income Before Tax Ratio | 15.22% | 12.49% | 15.38% | 23.54% | 28.31% |
| Income Tax Expense | $479.00K | $1.21M | $382.00K | $153.00K | $223.00K |
| Net Income | $142.69M | $126.24M | $159.05M | $164.82M | $159.26M |
| Net Income Ratio | 15.17% | 12.37% | 15.35% | 23.52% | 28.27% |
| EPS | $3.05 | $2.90 | $3.66 | $3.79 | $4.18 |
| EPS Diluted | $3.02 | $2.89 | $3.66 | $3.79 | $4.18 |
| Weighted Average Shares Outstanding | 47.11M | 43.58M | 43.49M | 43.45M | 33.59M |
| Weighted Average Shares Outstanding Diluted | 47.48M | 43.61M | 43.51M | 43.46M | 33.60M |
| SEC Filing | Source | Source | Source | Source | Source |
| Breakdown | December 31, 2024 | September 30, 2024 | June 30, 2024 | March 31, 2024 | December 31, 2023 | September 30, 2023 | June 30, 2023 | March 31, 2023 | December 31, 2022 | September 30, 2022 | June 30, 2022 | March 31, 2022 | December 31, 2021 | September 30, 2021 | June 30, 2021 | March 31, 2021 | December 31, 2020 | September 30, 2020 | June 30, 2020 | March 31, 2020 |
|---|---|---|---|---|---|---|---|---|---|---|---|---|---|---|---|---|---|---|---|---|
| Revenue | $209.86M | $214.07M | $264.63M | $252.07M | $254.15M | $275.82M | $246.91M | $243.53M | $269.05M | $294.02M | $266.75M | $206.58M | $189.88M | $189.63M | $168.48M | $152.91M | $140.11M | $142.27M | $117.64M | $163.40M |
| Cost of Revenue | $160.85M | $165.22M | $191.72M | $181.88M | $182.15M | $206.89M | $179.07M | $170.07M | $201.95M | $221.87M | $209.59M | $153.60M | $134.16M | $131.62M | $113.05M | $104.91M | $88.57M | $83.32M | $63.74M | $121.05M |
| Gross Profit | $49.01M | $48.84M | $72.91M | $70.19M | $72.00M | $68.93M | $67.84M | $73.45M | $67.10M | $72.15M | $57.16M | $52.98M | $55.72M | $58.00M | $55.43M | $48.00M | $51.54M | $58.95M | $53.90M | $42.35M |
| Gross Profit Ratio | 23.35% | 22.82% | 27.55% | 27.85% | 28.33% | 24.99% | 27.48% | 30.16% | 24.94% | 24.54% | 21.43% | 25.65% | 29.34% | 30.59% | 32.90% | 31.39% | 36.78% | 41.44% | 45.82% | 25.92% |
| Research and Development Expenses | $- | $- | $- | $- | $- | $- | $- | $- | $- | $- | $- | $- | $- | $- | $- | $- | $- | $- | $- | $- |
| General and Administrative Expenses | $9.32M | $15.74M | $6.02M | $4.86M | $5.10M | $5.54M | $6.61M | $7.51M | $3.35M | $11.96M | $13.77M | $5.09M | $5.53M | $6.14M | $6.08M | $4.86M | $5.61M | $6.12M | $4.72M | $6.13M |
| Selling and Marketing Expenses | $- | $- | $174.00K | $221.00K | $-112.31M | $- | $- | $112.31M | $- | $- | $- | $- | $- | $- | $- | $- | $- | $- | $- | $- |
| Selling General and Administrative Expenses | $9.32M | $15.74M | $6.19M | $5.08M | $5.10M | $5.54M | $6.61M | $7.51M | $3.35M | $11.96M | $13.77M | $5.09M | $5.53M | $6.14M | $6.08M | $4.86M | $5.61M | $6.12M | $4.72M | $6.13M |
| Other Expenses | $1.68M | $1.29M | $1.74M | $171.00K | $25.28M | $27.07M | $19.00K | $1.87M | $2.13M | $1.18M | $2.00K | $1.05M | $1.00K | $115.00K | $34.00K | $-31.00K | $-30.00K | $-105.00K | $2.00K | $7.82M |
| Operating Expenses | $11.00M | $17.04M | $4.45M | $5.08M | $5.10M | $32.61M | $8.35M | $9.38M | $5.48M | $13.14M | $14.95M | $6.14M | $6.37M | $7.42M | $7.03M | $5.83M | $6.43M | $7.19M | $6.02M | $7.31M |
| Cost and Expenses | $171.85M | $182.38M | $196.17M | $186.97M | $187.25M | $239.50M | $187.42M | $179.45M | $207.43M | $235.01M | $224.54M | $159.74M | $140.53M | $139.04M | $120.08M | $110.74M | $95.01M | $90.50M | $69.76M | $128.36M |
| Interest Income | $24.29M | $23.47M | $- | $- | $- | $36.90M | $35.10M | $32.58M | $28.68M | $22.56M | $- | $- | $- | $- | $- | $- | $- | $- | $- | $- |
| Interest Expense | $38.41M | $37.02M | $35.27M | $40.23M | $38.66M | $36.90M | $35.10M | $32.58M | $28.68M | $22.56M | $16.81M | $14.25M | $14.30M | $14.53M | $11.66M | $9.74M | $10.02M | $10.36M | $10.67M | $11.82M |
| Depreciation and Amortization | $24.47M | $19.97M | $26.20M | $28.48M | $24.95M | $26.57M | $26.15M | $23.48M | $22.36M | $23.61M | $25.03M | $14.06M | $14.59M | $14.53M | $14.37M | $14.68M | $13.08M | $528.00K | $471.00K | $496.00K |
| EBITDA | $98.13M | $92.12M | $99.13M | $98.37M | $116.15M | $95.11M | $85.48M | $90.01M | $59.77M | $86.69M | $62.23M | $63.73M | $60.65M | $67.62M | $64.55M | $56.44M | $58.19M | $65.45M | $58.27M | $43.25M |
| EBITDA Ratio | 46.76% | 43.03% | 37.46% | 39.02% | 45.70% | 34.48% | 34.62% | 36.96% | 22.22% | 29.48% | 23.33% | 30.85% | 31.94% | 35.66% | 38.31% | 36.91% | 41.53% | 46.01% | 49.53% | 26.47% |
| Operating Income | $38.02M | $31.69M | $68.46M | $65.11M | $66.90M | $62.55M | $59.95M | $63.93M | $61.62M | $59.02M | $42.21M | $46.84M | $49.35M | $50.58M | $48.39M | $42.17M | $45.10M | $51.77M | $47.88M | $35.04M |
| Operating Income Ratio | 18.11% | 14.80% | 25.87% | 25.83% | 26.32% | 22.68% | 24.28% | 26.25% | 22.90% | 20.07% | 15.82% | 22.67% | 25.99% | 26.67% | 28.72% | 27.58% | 32.19% | 36.39% | 40.70% | 21.45% |
| Total Other Income Expenses Net | $-2.76M | $2.13M | $-27.35M | $-31.57M | $-29.85M | $-27.60M | $-27.80M | $-26.26M | $-19.33M | $-13.96M | $-9.74M | $-7.22M | $-7.67M | $-7.15M | $-4.98M | $-5.72M | $-4.23M | $-5.61M | $-4.21M | $-6.27M |
| Income Before Tax | $35.25M | $33.82M | $41.12M | $32.97M | $22.67M | $34.95M | $32.15M | $37.67M | $42.29M | $45.06M | $32.47M | $39.62M | $41.68M | $43.43M | $43.41M | $36.45M | $40.87M | $46.16M | $43.67M | $28.77M |
| Income Before Tax Ratio | 16.80% | 15.80% | 15.54% | 13.08% | 8.92% | 12.67% | 13.02% | 15.47% | 15.72% | 15.33% | 12.17% | 19.18% | 21.95% | 22.90% | 25.77% | 23.84% | 29.17% | 32.45% | 37.13% | 17.61% |
| Income Tax Expense | $-54.00K | $150.00K | $57.00K | $326.00K | $520.00K | $127.00K | $256.00K | $302.00K | $-411.00K | $387.00K | $305.00K | $101.00K | $-3.00K | $-194.00K | $166.00K | $184.00K | $156.00K | $-168.00K | $-740.00K | $975.00K |
| Net Income | $35.30M | $33.67M | $41.06M | $32.65M | $22.15M | $34.83M | $31.90M | $37.37M | $42.70M | $44.67M | $32.16M | $39.51M | $41.69M | $43.62M | $43.25M | $36.27M | $40.72M | $46.33M | $44.41M | $27.80M |
| Net Income Ratio | 16.82% | 15.73% | 15.52% | 12.95% | 8.71% | 12.63% | 12.92% | 15.34% | 15.87% | 15.19% | 12.06% | 19.13% | 21.95% | 23.01% | 25.67% | 23.72% | 29.06% | 32.56% | 37.76% | 17.01% |
| EPS | $-2.28 | $0.71 | $0.87 | $0.74 | $0.51 | $0.80 | $0.73 | $0.86 | $0.98 | $1.03 | $0.74 | $0.91 | $0.96 | $1.00 | $1.00 | $0.83 | $0.94 | $1.26 | $1.18 | $0.76 |
| EPS Diluted | $-2.26 | $0.71 | $0.87 | $0.73 | $0.51 | $0.80 | $0.73 | $0.86 | $0.98 | $1.03 | $0.74 | $0.91 | $0.96 | $1.00 | $1.00 | $0.83 | $0.94 | $1.26 | $1.18 | $0.76 |
| Weighted Average Shares Outstanding | 47.11M | 47.11M | 47.22M | 44.41M | 43.60M | 43.59M | 43.58M | 43.57M | 43.52M | 43.49M | 43.48M | 43.47M | 43.45M | 43.45M | 43.45M | 43.44M | 43.44M | 36.89M | 29.43M | 24.48M |
| Weighted Average Shares Outstanding Diluted | 47.48M | 47.14M | 47.23M | 44.42M | 43.63M | 43.60M | 43.60M | 43.59M | 43.54M | 43.52M | 43.48M | 43.48M | 43.47M | 43.47M | 43.46M | 43.45M | 43.44M | 36.89M | 29.43M | 24.49M |
| SEC Filing | Source | Source | Source | Source | Source | Source | Source | Source | Source | Source | Source | Source | Source | Source | Source | Source | Source | Source | Source | Source |
Annual Balance Sheet
| Breakdown | December 31, 2024 | December 31, 2023 | December 31, 2022 | December 31, 2021 | December 31, 2020 |
|---|---|---|---|---|---|
| Cash and Cash Equivalents | $5.38M | $3.75M | $7.97M | $4.29M | $4.24M |
| Short Term Investments | $- | $- | $- | $- | $- |
| Cash and Short Term Investments | $5.38M | $3.75M | $7.97M | $4.29M | $4.24M |
| Net Receivables | $54.73M | $69.57M | $53.31M | $15.38M | $21.61M |
| Inventory | $5.43M | $2.26M | $1.48M | $2.41M | $3.13M |
| Other Current Assets | $80.36M | $676.00K | $2.46M | $951.00K | $331.00K |
| Total Current Assets | $145.89M | $76.27M | $65.23M | $23.03M | $29.31M |
| Property Plant Equipment Net | $1.08B | $955.19M | $948.79M | $470.32M | $489.01M |
| Goodwill | $12.20M | $12.20M | $27.05M | $12.20M | $12.20M |
| Intangible Assets | $281.46M | $343.03M | $364.80M | $153.86M | $160.10M |
| Goodwill and Intangible Assets | $293.66M | $355.23M | $391.85M | $166.06M | $172.31M |
| Long Term Investments | $510.28M | $241.34M | $257.02M | $250.03M | $253.68M |
| Tax Assets | $- | $- | $- | $- | $- |
| Other Non-Current Assets | $10.75M | $14.22M | $16.41M | $25.63M | $12.12M |
| Total Non-Current Assets | $1.90B | $1.57B | $1.61B | $912.04M | $927.11M |
| Other Assets | $- | $- | $- | $- | $- |
| Total Assets | $2.04B | $1.64B | $1.68B | $935.07M | $956.42M |
| Account Payables | $41.38M | $26.29M | $63.46M | $72.58M | $6.66M |
| Short Term Debt | $10.68M | $36.70M | $31.04M | $13.62M | $17.38M |
| Tax Payables | $6.76M | $10.32M | $8.23M | $5.28M | $4.97M |
| Deferred Revenue | $- | $- | $- | $- | $- |
| Other Current Liabilities | $29.95M | $17.28M | $3.49M | $5.33M | $-710.00K |
| Total Current Liabilities | $88.78M | $90.59M | $106.22M | $96.81M | $28.30M |
| Long Term Debt | $12.01M | $1.68B | $1.66B | $913.04M | $1.01B |
| Deferred Revenue Non-Current | $- | $- | $-1.00M | $-1.00M | $6.01M |
| Deferred Tax Liabilities Non-Current | $- | $- | $1.00M | $1.00M | $616.00K |
| Other Non-Current Liabilities | $1.91B | $31.40M | $25.10M | $29.21M | $28.09M |
| Total Non-Current Liabilities | $1.92B | $1.71B | $1.68B | $942.25M | $1.04B |
| Other Liabilities | $- | $- | $- | $- | $- |
| Total Liabilities | $2.01B | $1.80B | $1.79B | $1.04B | $1.06B |
| Preferred Stock | $- | $- | $- | $- | $- |
| Common Stock | $- | $- | $- | $- | $- |
| Retained Earnings | $- | $- | $- | $- | $- |
| Accumulated Other Comprehensive Income Loss | $- | $- | $- | $- | $- |
| Other Total Stockholders Equity | $35.53M | $- | $- | $- | $- |
| Total Stockholders Equity | $35.53M | $-161.87M | $-110.70M | $-103.99M | $-108.30M |
| Total Equity | $35.53M | $-161.87M | $-110.70M | $-103.99M | $-108.30M |
| Total Liabilities and Stockholders Equity | $2.04B | $1.64B | $1.68B | $935.07M | $956.42M |
| Minority Interest | $- | $- | $- | $- | $- |
| Total Liabilities and Total Equity | $2.04B | $1.64B | $1.68B | $935.07M | $956.42M |
| Total Investments | $510.28M | $241.34M | $257.02M | $250.03M | $253.68M |
| Total Debt | $11.34M | $1.72B | $1.68B | $919.85M | $1.02B |
| Net Debt | $5.96M | $1.72B | $1.67B | $915.56M | $1.01B |
Balance Sheet Charts
| Breakdown | December 31, 2024 | September 30, 2024 | June 30, 2024 | March 31, 2024 | December 31, 2023 | September 30, 2023 | June 30, 2023 | March 31, 2023 | December 31, 2022 | September 30, 2022 | June 30, 2022 | March 31, 2022 | December 31, 2021 | September 30, 2021 | June 30, 2021 | March 31, 2021 | December 31, 2020 | September 30, 2020 | June 30, 2020 | March 31, 2020 |
|---|---|---|---|---|---|---|---|---|---|---|---|---|---|---|---|---|---|---|---|---|
| Cash and Cash Equivalents | $5.38M | $7.32M | $5.11M | $9.67M | $3.75M | $4.18M | $7.71M | $10.96M | $7.97M | $14.95M | $13.81M | $2.73M | $4.29M | $4.86M | $2.17M | $13.38M | $4.24M | $6.02M | $16.20M | $4.18M |
| Short Term Investments | $- | $- | $- | $- | $- | $- | $- | $- | $- | $- | $- | $- | $- | $- | $- | $- | $253.68M | $- | $- | $- |
| Cash and Short Term Investments | $5.38M | $7.32M | $5.11M | $9.67M | $3.75M | $4.18M | $7.71M | $10.96M | $7.97M | $14.95M | $13.81M | $2.73M | $4.29M | $4.86M | $2.17M | $13.38M | $4.24M | $6.02M | $16.20M | $4.18M |
| Net Receivables | $110.82M | $72.03M | $88.55M | $93.58M | $69.57M | $108.36M | $73.25M | $60.54M | $53.31M | $53.35M | $43.94M | $20.35M | $15.38M | $18.42M | $18.07M | $12.32M | $21.61M | $27.47M | $24.66M | $12.39M |
| Inventory | $5.43M | $4.63M | $1.76M | $1.66M | $2.26M | $4.14M | $3.08M | $2.66M | $1.48M | $2.49M | $3.65M | $1.78M | $2.41M | $2.22M | $1.99M | $1.87M | $3.13M | $1.70M | $2.14M | $5.13M |
| Other Current Assets | $24.26M | $1.97M | $1.15M | $615.00K | $676.00K | $962.00K | $1.40M | $2.77M | $2.46M | $2.42M | $2.26M | $1.47M | $951.00K | $1.08M | $900.00K | $525.00K | $331.00K | $410.00K | $499.00K | $926.00K |
| Total Current Assets | $145.89M | $85.94M | $96.57M | $105.52M | $76.27M | $117.64M | $85.43M | $76.93M | $65.23M | $73.21M | $63.66M | $26.32M | $23.03M | $26.59M | $23.13M | $28.09M | $29.31M | $35.60M | $43.50M | $22.63M |
| Property Plant Equipment Net | $1.08B | $1.06B | $935.65M | $947.68M | $955.19M | $957.68M | $964.37M | $966.01M | $948.79M | $899.93M | $879.15M | $467.47M | $470.32M | $471.12M | $479.80M | $486.86M | $489.01M | $485.65M | $492.63M | $482.94M |
| Goodwill | $12.20M | $12.20M | $12.20M | $12.20M | $12.20M | $27.05M | $27.05M | $27.05M | $27.05M | $26.61M | $22.82M | $12.20M | $12.20M | $12.20M | $12.20M | $12.20M | $12.20M | $12.20M | $12.20M | $12.20M |
| Intangible Assets | $281.46M | $287.19M | $331.25M | $337.30M | $343.03M | $347.87M | $353.15M | $358.87M | $364.80M | $370.37M | $376.18M | $154.48M | $153.86M | $155.44M | $157.17M | $158.78M | $160.10M | $161.77M | $163.09M | $166.53M |
| Goodwill and Intangible Assets | $293.66M | $299.40M | $343.45M | $349.51M | $355.23M | $374.92M | $380.20M | $385.93M | $391.85M | $396.97M | $399.00M | $166.68M | $166.06M | $167.65M | $169.38M | $170.98M | $172.31M | $173.97M | $175.29M | $178.73M |
| Long Term Investments | $510.28M | $322.75M | $235.91M | $238.19M | $241.34M | $241.94M | $242.75M | $243.27M | $257.02M | $248.00M | $248.68M | $249.89M | $250.03M | $251.92M | $252.05M | $251.45M | $253.68M | $255.37M | $255.32M | $255.74M |
| Tax Assets | $- | $1 | $98.55M | $160.49M | $161.69M | $- | $- | $- | $- | $- | $- | $- | $- | $- | $- | $- | $- | $- | $- | $- |
| Other Non-Current Assets | $10.75M | $197.42M | $-86.83M | $-147.02M | $-147.47M | $17.29M | $19.80M | $19.48M | $16.41M | $20.12M | $18.81M | $24.90M | $25.63M | $13.27M | $11.12M | $11.49M | $12.12M | $6.99M | $7.00M | $6.20M |
| Total Non-Current Assets | $1.90B | $1.87B | $1.53B | $1.55B | $1.57B | $1.59B | $1.61B | $1.61B | $1.61B | $1.57B | $1.55B | $908.95M | $912.04M | $903.96M | $912.35M | $920.78M | $927.11M | $921.98M | $930.24M | $923.61M |
| Other Assets | $- | $- | $- | $- | $- | $- | $- | $- | $- | $- | $- | $- | $- | $- | $- | $- | $- | $- | $- | $- |
| Total Assets | $2.04B | $1.96B | $1.62B | $1.65B | $1.64B | $1.71B | $1.69B | $1.69B | $1.68B | $1.64B | $1.61B | $935.27M | $935.07M | $930.54M | $935.48M | $948.87M | $956.42M | $957.59M | $973.74M | $946.24M |
| Account Payables | $41.38M | $36.12M | $26.24M | $26.31M | $26.29M | $27.99M | $14.51M | $27.57M | $63.46M | $226.22M | $135.89M | $62.91M | $72.58M | $52.02M | $41.68M | $8.70M | $6.66M | $4.74M | $1.79M | $6.46M |
| Short Term Debt | $5.34M | $10.74M | $12.07M | $12.88M | $43.39M | $31.10M | $23.17M | $31.26M | $23.02M | $15.55M | $15.34M | $13.38M | $6.81M | $14.73M | $8.01M | $16.89M | $8.69M | $11.09M | $11.59M | $2.91M |
| Tax Payables | $6.76M | $7.64M | $8.41M | $7.64M | $10.32M | $11.95M | $7.34M | $4.35M | $8.23M | $6.76M | $6.82M | $4.02M | $5.28M | $3.80M | $4.56M | $3.64M | $4.97M | $3.43M | $4.33M | $4.09M |
| Deferred Revenue | $- | $- | $8.41M | $7.64M | $10.32M | $11.95M | $- | $- | $- | $- | $-7.67M | $- | $- | $3.80M | $4.56M | $3.64M | $4.97M | $3.43M | $4.33M | $6.16M |
| Other Current Liabilities | $35.29M | $15.07M | $23.32M | $10.37M | $10.59M | $14.32M | $11.43M | $14.79M | $11.51M | $17.43M | $4.94M | $15.96M | $12.14M | $17.50M | $13.27M | $3.54M | $7.98M | $4.68M | $264.00K | $9.18M |
| Total Current Liabilities | $88.78M | $69.58M | $70.03M | $57.20M | $90.59M | $85.36M | $56.44M | $77.97M | $106.22M | $265.96M | $162.99M | $96.26M | $96.81M | $88.04M | $67.53M | $32.77M | $28.30M | $23.95M | $17.98M | $22.64M |
| Long Term Debt | $1.88B | $1.90B | $1.57B | $1.61B | $1.68B | $1.74B | $1.74B | $1.71B | $1.66B | $1.46B | $1.53B | $917.94M | $913.04M | $916.89M | $945.70M | $999.73M | $1.01B | $1.02B | $1.01B | $942.01M |
| Deferred Revenue Non-Current | $- | $- | $- | $- | $- | $- | $- | $- | $-1.00M | $- | $- | $- | $-1.00M | $- | $- | $6.13M | $6.01M | $5.91M | $5.80M | $5.70M |
| Deferred Tax Liabilities Non-Current | $- | $- | $- | $- | $- | $- | $- | $- | $1.00M | $- | $- | $- | $1.00M | $- | $- | $681.00K | $616.00K | $1.21M | $1.16M | $1.03M |
| Other Non-Current Liabilities | $35.85M | $36.17M | $31.58M | $31.04M | $31.40M | $27.59M | $25.80M | $25.69M | $25.10M | $25.97M | $27.80M | $27.59M | $29.21M | $30.36M | $30.09M | $27.09M | $28.09M | $25.14M | $24.63M | $24.95M |
| Total Non-Current Liabilities | $1.92B | $1.94B | $1.60B | $1.64B | $1.71B | $1.76B | $1.77B | $1.73B | $1.68B | $1.49B | $1.56B | $945.52M | $942.25M | $947.25M | $975.80M | $1.03B | $1.04B | $1.05B | $1.03B | $967.99M |
| Other Liabilities | $- | $- | $- | $- | $- | $- | $- | $- | $- | $- | $- | $- | $- | $- | $- | $- | $- | $- | $- | $- |
| Total Liabilities | $2.01B | $2.01B | $1.67B | $1.70B | $1.80B | $1.85B | $1.82B | $1.81B | $1.79B | $1.75B | $1.73B | $1.04B | $1.04B | $1.04B | $1.04B | $1.06B | $1.06B | $1.07B | $1.05B | $990.63M |
| Preferred Stock | $- | $- | $- | $- | $- | $- | $- | $- | $- | $- | $- | $- | $- | $- | $- | $- | $- | $- | $- | $- |
| Common Stock | $- | $- | $- | $- | $- | $- | $- | $- | $- | $- | $- | $- | $- | $- | $- | $- | $- | $- | $- | $- |
| Retained Earnings | $- | $- | $- | $- | $- | $- | $- | $- | $- | $- | $- | $- | $326.54M | $- | $- | $- | $- | $- | $- | $- |
| Accumulated Other Comprehensive Income Loss | $- | $- | $- | $- | $- | $- | $- | $- | $- | $- | $- | $- | $- | $- | $-247.07M | $-237.50M | $- | $-216.70M | $-207.22M | $-186.25M |
| Other Total Stockholders Equity | $- | $- | $- | $- | $- | $- | $- | $- | $- | $- | $- | $- | $- | $- | $- | $- | $- | $- | $- | $- |
| Total Stockholders Equity | $- | $-45.11M | $-51.31M | $-42.47M | $-161.87M | $-139.15M | $-129.50M | $-117.42M | $-110.70M | $-114.26M | $-116.46M | $-106.52M | $-103.99M | $-104.75M | $-107.85M | $-111.39M | $-108.30M | $-111.45M | $-78.31M | $-44.40M |
| Total Equity | $- | $-45.11M | $-51.31M | $-42.47M | $-161.87M | $-139.15M | $-129.50M | $-117.42M | $-110.70M | $-114.26M | $-116.46M | $-106.52M | $-103.99M | $-104.75M | $-107.85M | $-111.39M | $-108.30M | $-111.45M | $-81.54M | $-47.18M |
| Total Liabilities and Stockholders Equity | $2.01B | $1.96B | $1.62B | $1.65B | $1.64B | $1.85B | $1.69B | $1.69B | $1.68B | $1.64B | $1.73B | $935.27M | $935.07M | $930.54M | $935.48M | $948.87M | $956.42M | $957.59M | $973.74M | $946.24M |
| Minority Interest | $- | $- | $- | $- | $- | $- | $- | $- | $- | $- | $- | $- | $- | $- | $- | $- | $- | $- | $-3.22M | $-2.79M |
| Total Liabilities and Total Equity | $2.01B | $1.96B | $1.62B | $1.65B | $1.64B | $1.85B | $1.69B | $1.69B | $1.68B | $1.64B | $1.73B | $935.27M | $935.07M | $930.54M | $935.48M | $948.87M | $956.42M | $957.59M | $973.74M | $946.24M |
| Total Investments | $510.28M | $322.75M | $235.91M | $238.19M | $241.34M | $241.94M | $242.75M | $243.27M | $257.02M | $248.00M | $248.68M | $249.89M | $250.03M | $251.92M | $252.05M | $251.45M | $507.35M | $255.37M | $255.32M | $255.74M |
| Total Debt | $1.89B | $1.91B | $1.58B | $1.62B | $1.72B | $1.76B | $1.76B | $1.73B | $1.68B | $1.47B | $1.54B | $924.62M | $919.85M | $924.26M | $953.72M | $1.01B | $1.02B | $1.02B | $1.01B | $943.43M |
| Net Debt | $1.88B | $1.90B | $1.57B | $1.61B | $1.72B | $1.75B | $1.76B | $1.72B | $1.67B | $1.45B | $1.53B | $921.90M | $915.56M | $919.39M | $951.54M | $994.80M | $1.01B | $1.02B | $997.89M | $939.25M |
Annual Cash Flow
| Breakdown | December 31, 2024 | December 31, 2023 | December 31, 2022 | December 31, 2021 | December 31, 2020 |
|---|---|---|---|---|---|
| Net Income | $142.69M | $126.24M | $159.05M | $164.82M | $159.26M |
| Depreciation and Amortization | $100.58M | $99.59M | $70.20M | $49.98M | $42.94M |
| Deferred Income Tax | $- | $- | $- | $- | $401.00K |
| Stock Based Compensation | $- | $- | $- | $- | $- |
| Change in Working Capital | $-48.77M | $-29.47M | $-49.42M | $51.43M | $-19.78M |
| Accounts Receivables | $-6.95M | $21.57M | $-9.07M | $292.00K | $-2.47M |
| Inventory | $- | $- | $2.23M | $55.00K | $11.36M |
| Accounts Payables | $8.54M | $-20.73M | $18.56M | $-1.91M | $-13.48M |
| Other Working Capital | $-50.35M | $-30.32M | $-61.15M | $52.99M | $-15.19M |
| Other Non Cash Items | $11.84M | $28.96M | $12.34M | $8.93M | $7.52M |
| Net Cash Provided by Operating Activities | $206.34M | $225.32M | $192.17M | $275.16M | $193.02M |
| Investments in Property Plant and Equipment | $-129.04M | $-96.10M | $-146.69M | $-24.02M | $-13.28M |
| Acquisitions Net | $- | $- | $-625.62M | $-1.39M | $-12.18M |
| Purchases of Investments | $- | $- | $- | $-1.39M | $-12.18M |
| Sales Maturities of Investments | $- | $- | $- | $1.39M | $12.18M |
| Other Investing Activities | $-255.54M | $6.47M | $1.88M | $9.05M | $-97.68M |
| Net Cash Used for Investing Activities | $-384.58M | $-89.63M | $-770.44M | $-16.36M | $-123.14M |
| Debt Repayment | $182.65M | $38.37M | $758.14M | $-90.82M | $158.20M |
| Common Stock Issued | $297.86M | $- | $3.10M | $- | $10.00K |
| Common Stock Repurchased | $- | $- | $- | $- | $-10.00K |
| Dividends Paid | $-204.69M | $-180.03M | $-171.09M | $-161.72M | $-109.20M |
| Other Financing Activities | $-95.94M | $1.75M | $-8.21M | $-6.22M | $-73.58M |
| Net Cash Used Provided by Financing Activities | $179.87M | $-139.91M | $581.95M | $-258.75M | $-71.18M |
| Effect of Forex Changes on Cash | $- | $- | $- | $- | $- |
| Net Change in Cash | $1.63M | $-4.21M | $3.68M | $49.00K | $-1.30M |
| Cash at End of Period | $5.38M | $3.75M | $7.97M | $4.29M | $4.24M |
| Cash at Beginning of Period | $3.75M | $7.97M | $4.29M | $4.24M | $5.54M |
| Operating Cash Flow | $206.34M | $225.32M | $192.17M | $275.16M | $193.02M |
| Capital Expenditure | $-129.04M | $-96.10M | $-146.69M | $-24.02M | $-13.28M |
| Free Cash Flow | $77.30M | $124.97M | $45.47M | $251.15M | $179.73M |
Cash Flow Charts
| Breakdown | December 31, 2024 | September 30, 2024 | June 30, 2024 | March 31, 2024 | December 31, 2023 | September 30, 2023 | June 30, 2023 | March 31, 2023 | December 31, 2022 | September 30, 2022 | June 30, 2022 | March 31, 2022 | December 31, 2021 | September 30, 2021 | June 30, 2021 | March 31, 2021 | December 31, 2020 | September 30, 2020 | June 30, 2020 | March 31, 2020 |
|---|---|---|---|---|---|---|---|---|---|---|---|---|---|---|---|---|---|---|---|---|
| Net Income | $35.30M | $33.67M | $41.06M | $32.65M | $22.15M | $34.83M | $31.90M | $37.37M | $42.70M | $44.67M | $32.16M | $39.51M | $41.69M | $43.62M | $43.25M | $36.27M | $40.72M | $46.33M | $44.41M | $27.80M |
| Depreciation and Amortization | $24.47M | $21.43M | $26.20M | $28.48M | $24.95M | $26.39M | $25.53M | $22.91M | $21.49M | $21.34M | $15.22M | $12.14M | $13.71M | $11.96M | $11.77M | $12.54M | $13.08M | $11.26M | $10.50M | $8.10M |
| Deferred Income Tax | $- | $- | $-103.00K | $- | $594.00K | $-76.00K | $-518.00K | $- | $- | $387.00K | $- | $- | $-65.00K | $-194.00K | $-65.00K | $65.00K | $-589.00K | $47.00K | $-943.00K | $- |
| Stock Based Compensation | $- | $- | $- | $- | $- | $- | $- | $- | $- | $- | $- | $- | $-576.00K | $-529.00K | $- | $-402.00K | $2.09M | $212.00K | $3.01M | $- |
| Change in Working Capital | $-18.24M | $-29.05M | $24.30M | $-25.79M | $51.89M | $-16.44M | $-27.26M | $-37.67M | $-164.78M | $94.45M | $26.92M | $-6.01M | $-5.47M | $16.19M | $29.84M | $10.86M | $-1.24M | $2.46M | $-19.34M | $-1.65M |
| Accounts Receivables | $-6.55M | $7.84M | $8.03M | $-15.86M | $140.00K | $24.57M | $-5.31M | $2.17M | $37.00K | $-9.41M | $5.27M | $-4.97M | $3.04M | $-356.00K | $-5.74M | $3.35M | $1.80M | $-1.56M | $-3.52M | $812.00K |
| Inventory | $-288.00K | $-34.00K | $-636.00K | $670.00K | $2.16M | $-626.00K | $-182.00K | $-1.48M | $973.00K | $997.00K | $151.00K | $112.00K | $-54.00K | $-415.00K | $-496.00K | $1.02M | $-1.35M | $532.00K | $3.42M | $8.76M |
| Accounts Payables | $14.52M | $-14.01M | $16.37M | $-2.36M | $8.45M | $17.07M | $-9.81M | $-36.43M | $-311.00K | $21.02M | $-16.30M | $14.16M | $-14.24M | $12.03M | $685.00K | $-390.00K | $-5.84M | $4.25M | $-7.20M | $-4.69M |
| Other Working Capital | $-25.92M | $-22.84M | $-92.00K | $-7.57M | $41.14M | $-57.45M | $-11.95M | $-1.92M | $-165.48M | $81.84M | $37.80M | $-15.31M | $5.78M | $4.94M | $35.40M | $6.88M | $4.16M | $-762.00K | $-12.05M | $-6.54M |
| Other Non Cash Items | $8.36M | $-1.11M | $24.61M | $85.84M | $20.23M | $46.90M | $3.92M | $6.58M | $-4.73M | $3.57M | $10.80M | $2.28M | $3.60M | $3.70M | $934.00K | $2.40M | $4.30M | $1.97M | $-88.00K | $590.00K |
| Net Cash Provided by Operating Activities | $49.90M | $24.94M | $88.18M | $45.99M | $119.21M | $46.83M | $34.61M | $29.19M | $-105.31M | $164.43M | $85.14M | $47.92M | $52.89M | $74.75M | $85.79M | $61.73M | $58.36M | $62.27M | $37.55M | $34.83M |
| Investments in Property Plant and Equipment | $-46.03M | $-55.37M | $-15.60M | $-12.04M | $-39.20M | $-4.36M | $-28.37M | $-28.42M | $-65.14M | $-42.25M | $-26.27M | $-13.04M | $-10.92M | $-3.66M | $-2.84M | $-6.59M | $-6.37M | $-1.92M | $-833.00K | $-4.16M |
| Acquisitions Net | $-23.54M | $- | $9.50M | $42.00K | $681.00K | $581.00K | $455.00K | $- | $-209.00K | $-3.64M | $-621.77M | $12.00K | $1.39M | $56.00K | $-14.00K | $-1.38M | $-371.00K | $-1.29M | $97.71M | $-108.23M |
| Purchases of Investments | $- | $- | $- | $- | $- | $- | $- | $- | $- | $- | $- | $- | $- | $- | $-14.00K | $-1.38M | $- | $- | $- | $- |
| Sales Maturities of Investments | $- | $- | $- | $- | $- | $- | $- | $- | $- | $- | $- | $- | $- | $- | $- | $- | $- | $- | $- | $- |
| Other Investing Activities | $-479.00K | $-243.74M | $-5.56M | $-9.86M | $3.54M | $3.04M | $-330.00K | $1.44M | $-895.00K | $132.00K | $-186.00K | $562.00K | $1.14M | $901.00K | $1.61M | $4.01M | $18.00K | $1.03M | $-98.95M | $217.00K |
| Net Cash Used for Investing Activities | $-70.05M | $-299.11M | $-6.10M | $-11.99M | $-38.52M | $-741.00K | $-27.91M | $-26.98M | $-65.35M | $-45.76M | $-646.85M | $-12.48M | $-8.39M | $-2.76M | $-1.25M | $-3.96M | $-6.72M | $-2.18M | $-2.07M | $-112.18M |
| Debt Repayment | $-19.50M | $- | $-35.72M | $-96.55M | $-43.88M | $-3.55M | $36.65M | $46.35M | $211.16M | $-74.50M | $616.10M | $5.39M | $-3.75M | $-28.51M | $-49.46M | $-9.10M | $-14.10M | $10.70M | $55.00M | $106.60M |
| Common Stock Issued | $165.65M | $-132.20M | $-125.00K | $132.33M | $- | $- | $- | $- | $3.10M | $- | $- | $- | $- | $- | $400.00M | $- | $- | $- | $- | $- |
| Common Stock Repurchased | $- | $- | $- | $- | $- | $- | $- | $- | $-3.10M | $- | $- | $- | $- | $- | $- | $- | $- | $- | $- | $- |
| Dividends Paid | $-56.61M | $-96.82M | $-50.61M | $-46.21M | $-45.65M | $-45.27M | $-44.66M | $-44.44M | $-43.06M | $-43.03M | $-42.60M | $-42.40M | $-41.32M | $-40.90M | $-39.97M | $-39.53M | $-39.32M | $-26.49M | $-69.33M | $-21.62M |
| Other Financing Activities | $-71.32M | $373.19M | $-191.00K | $114.68M | $8.40M | $-800.00K | $-1.93M | $-1.13M | $-4.41M | $- | $-701.00K | $- | $400.00M | $110.00K | $-6.33M | $- | $- | $-54.48M | $-10.09M | $-9.01M |
| Net Cash Used Provided by Financing Activities | $18.22M | $276.37M | $-86.64M | $-28.08M | $-81.12M | $-49.62M | $-9.95M | $783.00K | $163.69M | $-117.53M | $572.80M | $-37.01M | $-45.07M | $-69.30M | $-95.75M | $-48.63M | $-53.42M | $-70.27M | $-23.46M | $75.97M |
| Effect of Forex Changes on Cash | $- | $- | $- | $- | $- | $- | $- | $- | $- | $- | $- | $- | $- | $- | $- | $- | $- | $- | $- | $- |
| Net Change in Cash | $-1.93M | $2.21M | $-4.56M | $5.92M | $-427.00K | $-3.53M | $-3.25M | $2.99M | $-6.97M | $1.14M | $11.08M | $-1.57M | $-572.00K | $2.69M | $-11.20M | $9.13M | $-1.78M | $-10.17M | $12.02M | $-1.37M |
| Cash at End of Period | $5.38M | $7.32M | $5.11M | $9.67M | $3.75M | $4.18M | $7.71M | $10.96M | $7.97M | $14.95M | $13.81M | $2.73M | $4.29M | $4.86M | $2.17M | $13.38M | $4.24M | $6.02M | $16.20M | $4.18M |
| Cash at Beginning of Period | $7.32M | $5.11M | $9.67M | $3.75M | $4.18M | $7.71M | $10.96M | $7.97M | $14.95M | $13.81M | $2.73M | $4.29M | $4.86M | $2.17M | $13.38M | $4.24M | $6.02M | $16.20M | $4.18M | $5.54M |
| Operating Cash Flow | $49.90M | $24.94M | $88.18M | $45.99M | $119.21M | $46.83M | $34.61M | $29.19M | $-105.31M | $164.43M | $85.14M | $47.92M | $52.89M | $74.75M | $85.79M | $61.73M | $58.36M | $62.27M | $37.55M | $34.83M |
| Capital Expenditure | $-47.09M | $-57.06M | $-15.60M | $-12.04M | $-39.20M | $-4.36M | $-28.37M | $-28.42M | $-65.14M | $-42.25M | $-26.27M | $-13.04M | $-10.92M | $-3.66M | $-2.84M | $-6.59M | $-6.37M | $-1.92M | $-833.00K | $-4.16M |
| Free Cash Flow | $2.80M | $-32.12M | $72.58M | $33.95M | $80.01M | $42.47M | $6.24M | $771.00K | $-170.46M | $122.17M | $58.87M | $34.88M | $41.97M | $71.09M | $82.95M | $55.14M | $52.00M | $60.35M | $36.71M | $30.67M |

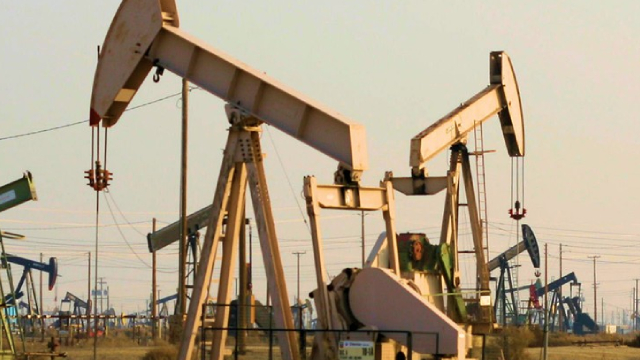
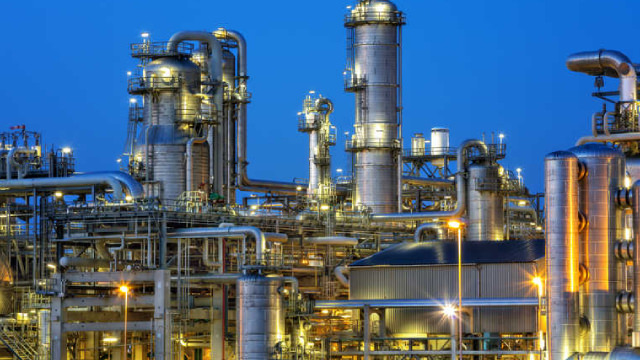
Delek Logistics Partners, LP owns and operates logistics and marketing assets for crude oil, and intermediate and refined products in the United States. It operates through three segments: Pipelines and Transportation, Wholesale Marketing and Terminalling, and Investment in Pipeline Joint Ventures. The Pipelines and Transportation segment includes pipelines, trucks, and ancillary assets that provide crude oil gathering, crude oil intermediate and refined products transportation, and storage services primarily in support of the Tyler, El Dorado, and Big Spring refineries, as well as offers crude oil and other products transportation services to third parties. This segment operates approximately 400 miles of crude oil transportation pipelines; 450 miles of refined product pipelines; and approximately 900 miles of crude oil gathering, and intermediate and refined products storage tanks with an aggregate of approximately 10.2 million barrels of active shell capacity. The Wholesale Marketing and Terminalling segment provides wholesale marketing, transporting, storage, and terminalling services related to refined products to independent third parties. The Investments in Pipeline Joint Ventures Segment owns a portion of three joint ventures that have constructed separate crude oil pipeline systems and related ancillary assets, which serves third parties and subsidiaries. Delek Logistics GP, LLC serves as the general partner of the company. Delek Logistics Partners, LP was incorporated in 2012 and is headquartered in Brentwood, Tennessee. Delek Logistics Partners, LP operates as a subsidiary of Delek US Holdings, Inc.
$40.08
Stock Price
$2.15B
Market Cap
-
Employees
Brentwood, TN
Location
Revenue (FY 2024)
$940.64M
-7.8% YoY
Net Income (FY 2024)
$142.69M
13.0% YoY
EPS (FY 2024)
$3.02
4.5% YoY
Free Cash Flow (FY 2024)
$77.30M
-38.1% YoY
Profitability
Gross Margin
25.9%
Net Margin
15.2%
ROE
401.6%
ROA
7.0%
Valuation
P/E Ratio
13.95
P/S Ratio
2.12
EV/EBITDA
5.06
Market Cap
$2.15B
Revenue & Net Income
Profit Margins
Cash Flow Summary
Operating Cash Flow
$206.34M
-8.4% YoY
Free Cash Flow
$77.30M
-38.1% YoY
Balance Sheet Summary
Total Assets
$2.04B
24.3% YoY
Total Debt
$11.34M
99.3% YoY
Shareholder Equity
$35.53M
120.3% YoY
Dividend Overview
$1.11
Latest Dividend
%
Dividend Yield
%
Payout Ratio
Recent Dividend History
| Date | Amount | Type |
|---|---|---|
| 2025-02-04 | $1.11 | February 04, 25 |
| 2024-11-08 | $1.10 | November 08, 24 |
| 2024-08-09 | $1.09 | August 09, 24 |
| 2024-05-07 | $1.07 | May 07, 24 |
| 2024-02-02 | $1.06 | February 02, 24 |
| 2023-11-03 | $1.05 | November 03, 23 |
| 2023-08-04 | $1.04 | August 04, 23 |
| 2023-05-05 | $1.03 | May 05, 23 |
| 2023-02-01 | $1.02 | February 01, 23 |
| 2022-11-03 | $0.99 | November 03, 22 |
Delek Logistics Partners, LP Dividends
Explore Delek Logistics Partners, LP's dividend history, including dividend yield, payout ratio, and historical payments.
Dividend Yield
10.28%
Dividend Payout Ratio
143.46%
Dividend Paid & Capex Coverage Ratio
0.62x
Delek Logistics Partners, LP Dividend History
| Dividend | Adjusted Dividend | Date | Record Date | Payment Date | Declaration Date |
|---|---|---|---|---|---|
| $1.105 | $1.105 | February 04, 2025 | February 04, 2025 | February 11, 2025 | January 24, 2025 |
| $1.1 | $1.1 | November 08, 2024 | November 08, 2024 | November 14, 2024 | October 29, 2024 |
| $1.09 | $1.09 | August 09, 2024 | August 09, 2024 | August 14, 2024 | July 30, 2024 |
| $1.07 | $1.07 | May 07, 2024 | May 08, 2024 | May 15, 2024 | April 25, 2024 |
| $1.055 | $1.055 | February 02, 2024 | February 05, 2024 | February 12, 2024 | January 24, 2024 |
| $1.045 | $1.045 | November 03, 2023 | November 06, 2023 | November 13, 2023 | October 25, 2023 |
| $1.035 | $1.035 | August 04, 2023 | August 07, 2023 | August 14, 2023 | July 26, 2023 |
| $1.025 | $1.025 | May 05, 2023 | May 08, 2023 | May 15, 2023 | April 28, 2023 |
| $1.02 | $1.02 | February 01, 2023 | February 02, 2023 | February 09, 2023 | January 23, 2023 |
| $0.99 | $0.99 | November 03, 2022 | November 04, 2022 | November 10, 2022 | October 25, 2022 |
| $0.985 | $0.985 | August 03, 2022 | August 04, 2022 | August 11, 2022 | July 25, 2022 |
| $0.98 | $0.98 | May 04, 2022 | May 05, 2022 | May 12, 2022 | April 25, 2022 |
| $0.975 | $0.975 | January 31, 2022 | February 01, 2022 | February 08, 2022 | January 21, 2022 |
| $0.95 | $0.95 | November 04, 2021 | November 05, 2021 | November 10, 2021 | October 26, 2021 |
| $0.94 | $0.94 | August 04, 2021 | August 05, 2021 | August 11, 2021 | July 26, 2021 |
| $0.92 | $0.92 | May 07, 2021 | May 10, 2021 | May 14, 2021 | April 30, 2021 |
| $0.91 | $0.91 | February 01, 2021 | February 02, 2021 | February 09, 2021 | January 25, 2021 |
| $0.905 | $0.905 | November 05, 2020 | November 06, 2020 | November 12, 2020 | October 27, 2020 |
| $0.9 | $0.9 | August 06, 2020 | August 07, 2020 | August 12, 2020 | July 27, 2020 |
| $0.89 | $0.89 | May 04, 2020 | May 05, 2020 | May 12, 2020 | April 21, 2020 |
Delek Logistics Partners, LP News
Read the latest news about Delek Logistics Partners, LP, including recent articles, headlines, and updates.
Delek Logistics Partners, LP Increases Quarterly Cash Distribution to $1.11 per Common Limited Partner Unit
BRENTWOOD, Tenn.--(BUSINESS WIRE)--Delek Logistics Partners, LP (NYSE: DKL) (“Delek Logistics”) today declared its quarterly cash distribution for the first quarter 2025 of $1.11 per common limited partner unit, or $4.44 per common limited partner unit on an annualized basis. The first quarter 2025 cash distribution is payable on May 15, 2025, to unitholders of record on May 8, 2025. About Delek Logistics Partners, LP Delek Logistics is a midstream energy master limited partnership headquartere.

A Rare Buying Opportunity: 11%+ Yields The Market Got Completely Wrong
One has grown its dividend for 48 consecutive quarters and just authorized a buyback of 7.5% of its outstanding shares. The other trades at a 17% discount to NAV and is backed by a legendary billionaire investor. Both yields are comfortably covered by cash flow and supported by strong balance sheets.
Delek Logistics Partners, LP to Host First Quarter 2025 Conference Call on May 7th
BRENTWOOD, Tenn.--(BUSINESS WIRE)--Delek Logistics Partners, LP (NYSE: DKL) (“Delek Logistics”) today announced that the Partnership intends to issue a press release summarizing first quarter 2025 results before the U.S. stock market opens on Wednesday, May 7, 2025. A conference call to discuss these results is scheduled to begin at 11:30 a.m. CT (12:30 a.m. ET) on Wednesday, May 7, 2025. The live broadcast of this conference call will be available online by going to www.DelekLogistics.com and.

Wall Street's Most Accurate Analysts Weigh In On 3 Energy Stocks With Over 8% Dividend Yields
During times of turbulence and uncertainty in the markets, many investors turn to dividend-yielding stocks. These are often companies that have high free cash flows and reward shareholders with a high dividend payout.

Undercovered Dozen: Delek Logistics, Perma-Fix, Consolidated Water, Rockwell Automation +
The 'Undercovered' Dozen series highlights 12 lesser-covered stocks weekly, offering diverse investment ideas and sparking discussions among investors. Investment opportunities range from common equities and preferred stocks to biotech firms and real estate trusts, each with unique risk-reward profiles. Key recommendations include strong buys for Regenxbio Inc. and Sila Realty Trust, and a sell rating for Fortescue Ltd. due to market sensitivity.
2 Dividend Stocks That Could Potentially Double Soon (26-33% Free Cash Flow Yields)
One stock is trading at just 44% of NAV, with a free cash flow yield over 30% — and a path to possibly doubling in the near future. Another has a publicly traded holding worth more than its market cap and trades at less than 33% of its estimated NAV. These two 6%-yielders could potentially deliver 100% upside in 1-3 years — without chasing hype or mega-cap tech.

Delek Logistics: 10% Dividend With Growth Potential
Delek Logistics is diversifying its customer base and sources of revenue, increasing the contribution of the water segment. Adjusted EBITDA is expected to grow by 20%, driven by the recent acquisitions in the water segment and the new gas facility. Cash distributions keep increasing, and if the recent acquisitions translate into higher income, they are sustainable.

Delek Logistics Partners, LP 2024 K-1 Tax Packages Available on Website
BRENTWOOD, Tenn.--(BUSINESS WIRE)--Delek Logistics Partners, LP (NYSE: DKL) today announced that 2024 K-1 tax packages are now available on our third-party provider's website, https://www.taxpackagesupport.com/DelekLogistics. Printing and mailing of these tax packages are currently underway. Questions regarding the 2024 Tax Reporting Package can be addressed by contacting 1-833-263-0144 between 8:00 a.m. and 5:00 p.m. CST, Monday through Friday. About Delek Logistics Partners, LP Delek Logistic.

Delek Logistics Partners, LP 2024 Form 10-K Available on Website
BRENTWOOD, Tenn.--(BUSINESS WIRE)--Delek Logistics Partners, LP (NYSE: DKL) (“Delek Logistics”) today announced that its Annual Report on Form 10-K for the fiscal year ended December 31, 2024 was filed with the U.S. Securities and Exchange Commission on February 26, 2025 and can be viewed on the Partnership's website at www.deleklogistics.com. The filing can be accessed by selecting the “SEC Filings” link. Also, upon written request, limited partners may receive, free of charge, a printed copy.

Dividend Income For Early Retirement: Well-Covered 7-11% Yields With Strong Growth
How to retire early with a portfolio built for passive income. 3 stocks that offer enticing dividends and strong long-term growth. Inflation-proof your retirement with dividend stocks that pay you to wait and grow your wealth over time.

Delek Logistics Partners, LP Common Units (DKL) Q4 2024 Earnings Call Transcript
Delek Logistics Partners, LP Common Units (NYSE:DKL ) Q4 2024 Earnings Conference Call February 25, 2025 12:30 PM ET Company Participants Robert Wright - Deputy CFO Avigal Soreq - President Reuven Spiegel - EVP Mark Cox - EVP Conference Call Participants Doug Irwin - Citi Neal Dingmann - Truist Securities Operator Thank you for standing by. My name is Joel, and I will be your conference operator today.

Delek Logistics Partners, LP Announces 2025 Financial Expectations
BRENTWOOD, Tenn.--(BUSINESS WIRE)--Delek Logistics Partners, LP (NYSE: DKL) (“Delek Logistics”) announced today its preliminary 2025 financial projections. “We expect to have approximately 20% year over year growth in Adjusted EBITDA(1) as a result of strong business fundamentals we are seeing in the Permian Basin,” said Avigal Soreq, President of Delek Logistics. “We expect to continue benefiting from the recent significant acquisitions, additional acreage dedications in the crude business, as.

Delek Logistics Reports Record Fourth Quarter 2024 Results
BRENTWOOD, Tenn.--(BUSINESS WIRE)--Delek Logistics Partners, LP (NYSE: DKL) ("Delek Logistics") today announced its financial results for the fourth quarter 2024. “Delek Logistics made great strides in 2024 in becoming a premier midstream provider in the Permian basin. It provides the best combination of yield and growth in the midstream sector with a long runway of growth driven by its advantageous position in the Midland and Delaware basins. We are proud of the 48th consecutive increase in ou.

10% Yields With Lower Risk: 3 Rare Buying Opportunities You Can't Ignore
These 3 high-yield stocks offer double-digit payouts while keeping risk in check—find out why the market is mispricing them. A government-backed REIT, a powerhouse midstream MLP, and a rock-solid BDC—all yielding 10%+ and primed for growth. Investors rarely get opportunities like this—here's how to lock in sustainable 10%+ yields before the market catches on.

Delek Logistics Partners, LP to Report Fourth-Quarter 2024 Financial Results on February 25, 2025
BRENTWOOD, Tenn.--(BUSINESS WIRE)--Delek Logistics Partners, LP (NYSE: DKL) (“Delek Logistics” or the “Partnership”) today announced that the Partnership intends to issue a press release summarizing fourth-quarter 2024 results before the U.S. stock market opens on Tuesday, February 25, 2025. A conference call to discuss these results is scheduled to begin at 11:30 a.m. CT on Tuesday, February 25, 2025. Interested parties may listen to the conference call by visiting Delek Logistics' website at.

Huge Yields And Big Buybacks: Stocks I Am Buying Hand-Over-Fist
Investing in high dividend yields and large buyback stocks reduces speculation, ensuring attractive total returns with minimal growth needed. Huge capital returns to shareholders via dividends and buybacks also typically imply a solid balance sheet and significant management confidence in the business. I share three deeply undervalued opportunities that offer high yields and are buying back a lot of stock.

Delek Logistics Partners, LP Increases Quarterly Cash Distribution to $1.105 per Common Limited Partner Unit
BRENTWOOD, Tenn.--(BUSINESS WIRE)--Delek Logistics Partners, LP (NYSE: DKL) (“Delek Logistics”) today declared its quarterly cash distribution for the fourth quarter 2024 of $1.105 per common limited partner unit, or $4.42 per common limited partner unit on an annualized basis. The fourth quarter 2024 cash distribution is payable on February 11, 2025, to unitholders of record on February 4, 2025. About Delek Logistics Partners, LP Delek Logistics is a midstream energy master limited partnership.

2 Very Overrated And 1 Very Underrated Big Dividend Growth Stocks
High dividend yield stocks with consistent growth are attractive ways to grow wealth and passive income over time. However, not all high-yield dividend growth stocks are good buys at all times. I share 2 that seem very overrated and 1 that seems very underrated by Mr. Market right now.

Delek Logistics Partners, LP Announces Closing of Gravity Water Midstream Acquisition
BRENTWOOD, Tenn.--(BUSINESS WIRE)--Delek Logistics Partners, LP (NYSE: DKL) (“Delek Logistics”) announced today the closing of the previously announced acquisition of Gravity Water Intermediate Holdings LLC (“Gravity”). “The Gravity acquisition represents another significant step in DKL's commitment of being a full suite crude, gas and water midstream services provider in the Permian Basin. Gravity's primary operations are in Howard County in the Midland Basin, and along with our recent H2O Mid.

Wolfe upgrades Delek US to Peer Perform, says value based on Logistics stake
Wolfe Research upgraded Delek US (DK) to Peer Perform from Underperform. At current levels, the entire value of Delek is its 66.3% interest in Delek Logistics (DKL), the analyst tells investors in a research note. Valued on an after tax basis with no debt is essentially where Delek trades, the analyst added, noting that a negative call on refining is priced in and options on a seasonal recovery or progress on its Enterprise Optimization Plan as upside. Delek US + Delek Logistics -0.27 (-0.64%)

11-14% Yields: Give Yourself The Gift Of Dividends For Christmas
Big dividend stocks are on a big holiday sale this Christmas season. Even in some of the most in-favor sectors of the high-yield space, bargains can still be found. I share some well-covered 11-14% dividend yields that can be found on the bargain rack.

Similar Companies
Related Metrics
Explore detailed financial metrics and analysis for DKL.
