Ørsted A/S Key Executives
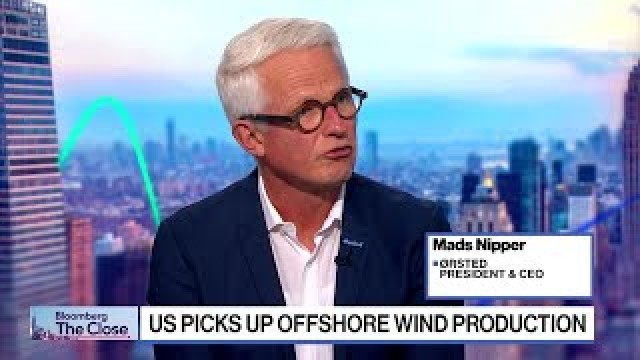
This section highlights Ørsted A/S's key executives, including their titles and compensation details.
Find Contacts at Ørsted A/S
(Showing 0 of )
Ørsted A/S Earnings
This section highlights Ørsted A/S's earnings, including key dates, EPS, earnings reports, and earnings call transcripts.
Next Earnings Date
Last Earnings Results
Earnings Call Transcripts
| Transcript | Quarter | Year | Date | Estimated EPS | Actual EPS |
|---|---|---|---|---|---|
| Read Transcript | Q4 | 2024 | 2025-02-06 | $0.45 | $-14.63 |
| Read Transcript | Q3 | 2024 | 2024-11-05 | $0.18 | $12.00 |
| Read Transcript | Q2 | 2024 | 2024-08-15 | $0.14 | $-4.09 |
| Read Transcript | Q1 | 2024 | 2024-05-02 | $0.43 | $6.10 |
| Read Transcript | Q4 | 2023 | 2024-02-07 | $-0.65 | $-0.76 |
| Read Transcript | Q3 | 2023 | 2023-11-01 | N/A | N/A |
| Read Transcript | Q2 | 2023 | 2023-08-10 | $0.02 | $-1.30 |
| Read Transcript | Q1 | 2023 | 2023-05-07 | N/A | N/A |

Ørsted A/S, together with its subsidiaries, develops, constructs, owns, and operates offshore and onshore wind farms, solar farms, energy storage facilities, and bioenergy plants. It operates through Offshore, Onshore, and Markets & Bioenergy segments. The Offshore segment develops, constructs, owns, and operates offshore wind farms in the United Kingdom, Germany, Denmark, the Netherlands, the United States, Taiwan, Japan, and South Korea. The Onshore segment develops, owns, and operates onshore wind and solar farms in the United States. The Markets & Bioenergy segment engages in the generation of heat and power from combined heat and power plants in Denmark; sells power and gas in the wholesale and B2B markets; and optimizes and hedges energy portfolio. The company was formerly known as DONG Energy A/S and changed its name to Ørsted A/S in November 2017. Ørsted A/S was founded in 1972 and is headquartered in Fredericia, Denmark.
$12.87
Stock Price
$16.23B
Market Cap
-
Employees
Fredericia, None
Location
Financial Statements
Access annual & quarterly financial statements for Ørsted A/S, including income statements, balance sheets, and cash flow statements..
Annual Income Statement
| Breakdown | December 31, 2024 | December 31, 2023 | December 31, 2022 | December 31, 2021 | December 31, 2020 |
|---|---|---|---|---|---|
| Revenue | $58.83B | $69.08B | $126.09B | $69.14B | $37.10B |
| Cost of Revenue | $35.96B | $46.62B | $97.16B | $53.11B | $25.78B |
| Gross Profit | $22.87B | $22.45B | $28.93B | $16.03B | $11.32B |
| Gross Profit Ratio | 38.87% | 32.50% | 22.94% | 23.18% | 30.50% |
| Research and Development Expenses | $- | $2.31B | $2.13B | $2.16B | $1.94B |
| General and Administrative Expenses | $- | $- | $7.05B | $5.76B | $5.77B |
| Selling and Marketing Expenses | $- | $- | $- | $- | $- |
| Selling General and Administrative Expenses | $- | $13.78B | $7.05B | $5.76B | $5.77B |
| Other Expenses | $16.70B | $34.40B | $8.49B | $1.98B | $-2.09B |
| Operating Expenses | $16.70B | $50.48B | $15.54B | $7.74B | $3.68B |
| Cost and Expenses | $52.66B | $86.93B | $112.70B | $60.85B | $29.47B |
| Interest Income | $1.55B | $1.64B | $368.00M | $335.00M | $823.00M |
| Interest Expense | $4.01B | $4.28B | $2.85B | $1.84B | $2.56B |
| Depreciation and Amortization | $10.22B | $9.79B | $9.75B | $7.97B | $7.59B |
| EBITDA | $16.84B | $-7.70B | $27.34B | $23.84B | $27.49B |
| EBITDA Ratio | 28.62% | -11.15% | 21.68% | 34.49% | 74.10% |
| Operating Income | $6.17B | $-17.85B | $13.37B | $8.04B | $9.01B |
| Operating Income Ratio | 10.49% | -25.85% | 10.60% | 11.63% | 24.29% |
| Total Other Income Expenses Net | $-3.56B | $-1.17B | $-2.17B | $-2.92B | $8.31B |
| Income Before Tax | $2.61B | $-19.03B | $17.61B | $13.28B | $17.32B |
| Income Before Tax Ratio | 4.43% | -27.54% | 13.97% | 19.20% | 46.69% |
| Income Tax Expense | $2.59B | $1.16B | $2.61B | $2.39B | $1.78B |
| Net Income | $-206.00M | $-20.51B | $15.13B | $10.96B | $15.60B |
| Net Income Ratio | -0.35% | -29.69% | 12.00% | 15.86% | 42.04% |
| EPS | $-0.73 | $-16.70 | $11.54 | $8.11 | $11.99 |
| EPS Diluted | $-0.73 | $-16.69 | $11.53 | $8.11 | $11.98 |
| Weighted Average Shares Outstanding | 1.26B | 1.26B | 1.26B | 1.26B | 1.26B |
| Weighted Average Shares Outstanding Diluted | 1.26B | 1.26B | 1.26B | 1.26B | 1.26B |
| SEC Filing | Source | Source | Source | Source | Source |
| Breakdown | December 31, 2024 | September 30, 2024 | June 30, 2024 | March 31, 2024 | December 31, 2023 | September 30, 2023 | June 30, 2023 | March 31, 2023 | December 31, 2022 | September 30, 2022 | June 30, 2022 | March 31, 2022 | December 31, 2021 | September 30, 2021 | June 30, 2021 | March 31, 2021 | December 31, 2020 | September 30, 2020 | June 30, 2020 | March 31, 2020 |
|---|---|---|---|---|---|---|---|---|---|---|---|---|---|---|---|---|---|---|---|---|
| Revenue | $17.68B | $13.16B | $12.44B | $15.56B | $4.21B | $19.02B | $14.45B | $26.92B | $29.49B | $36.54B | $24.82B | $32.08B | $28.57B | $13.13B | $11.72B | $15.72B | $10.89B | $6.64B | $8.09B | $11.49B |
| Cost of Revenue | $10.44B | $8.20B | $13.94B | $9.41B | $2.71B | $11.92B | $11.66B | $20.34B | $24.82B | $28.50B | $19.29B | $24.55B | $22.01B | $9.35B | $8.84B | $12.91B | $7.48B | $3.76B | $6.52B | $8.02B |
| Gross Profit | $7.24B | $4.96B | $-1.50B | $6.15B | $1.50B | $7.11B | $2.79B | $6.58B | $4.67B | $8.04B | $5.53B | $7.53B | $6.56B | $3.78B | $2.88B | $2.81B | $3.40B | $2.87B | $1.57B | $3.47B |
| Gross Profit Ratio | 40.97% | 37.70% | -12.08% | 39.52% | 35.69% | 37.36% | 19.33% | 24.43% | 15.83% | 22.00% | 22.28% | 23.48% | 22.97% | 28.82% | 24.55% | 17.85% | 31.26% | 43.28% | 19.42% | 30.20% |
| Research and Development Expenses | $- | $- | $- | $- | $2.31B | $- | $- | $- | $2.13B | $- | $- | $- | $2.16B | $- | $- | $- | $- | $- | $- | $- |
| General and Administrative Expenses | $- | $- | $- | $- | $- | $- | $- | $- | $2.42B | $1.78B | $1.67B | $1.18B | $2.06B | $1.59B | $1.18B | $931.00M | $1.53B | $1.77B | $1.21B | $1.26B |
| Selling and Marketing Expenses | $- | $- | $- | $- | $- | $- | $- | $- | $- | $- | $- | $- | $- | $- | $- | $- | $- | $- | $- | $- |
| Selling General and Administrative Expenses | $- | $- | $3.34B | $3.44B | $4.37B | $3.03B | $3.22B | $3.17B | $2.42B | $1.78B | $1.67B | $1.18B | $2.06B | $1.59B | $1.18B | $931.00M | $1.53B | $1.77B | $1.21B | $1.26B |
| Other Expenses | $13.59B | $-1.76B | $3.79B | $- | $- | $- | $- | $2.23B | $-279.00M | $3.33B | $2.57B | $974.00M | $743.00M | $1.09B | $945.00M | $-800.00M | $-1.13B | $347.00M | $208.00M | $-1.52B |
| Operating Expenses | $13.59B | $-1.76B | $880.00M | $1.15B | $4.98B | $4.41B | $2.73B | $2.23B | $2.15B | $5.11B | $4.24B | $2.15B | $2.80B | $2.68B | $2.12B | $131.00M | $408.00M | $2.12B | $1.42B | $-261.00M |
| Cost and Expenses | $24.03B | $6.44B | $13.94B | $10.56B | $7.69B | $16.32B | $14.39B | $22.57B | $26.97B | $33.61B | $23.53B | $26.70B | $24.82B | $12.03B | $10.96B | $13.04B | $7.89B | $5.88B | $7.93B | $7.76B |
| Interest Income | $1.11B | $1.54B | $2.85B | $810.00M | $1.59B | $13.00M | $26.00M | $3.09B | $361.00M | $4.68B | $24.00M | $- | $65.00M | $- | $16.00M | $- | $- | $- | $- | $- |
| Interest Expense | $1.95B | $2.78B | $669.00M | $810.00M | $2.24B | $677.00M | $715.00M | $645.00M | $951.00M | $863.00M | $684.00M | $352.00M | $685.00M | $445.00M | $291.00M | $420.00M | $1.10B | $255.00M | $669.00M | $535.00M |
| Depreciation and Amortization | $2.57B | $2.55B | $2.68B | $2.42B | $2.37B | $2.54B | $2.45B | $2.44B | $5.32B | $2.53B | $2.30B | $2.13B | $2.27B | $1.94B | $1.96B | $1.93B | $1.91B | $2.10B | $1.83B | $1.75B |
| EBITDA | $-2.24B | $8.64B | $6.53B | $7.34B | $7.50B | $-17.93B | $2.17B | $6.72B | $14.40B | $3.27B | $3.59B | $7.51B | $9.02B | $3.04B | $2.72B | $4.61B | $6.47B | $2.48B | $1.51B | $8.23B |
| EBITDA Ratio | -12.69% | 65.65% | 52.50% | 47.21% | 178.23% | -94.26% | 14.99% | 24.97% | 48.81% | 8.95% | 14.48% | 23.41% | 31.56% | 23.16% | 23.18% | 29.30% | 59.47% | 37.34% | 18.72% | 71.62% |
| Operating Income | $-6.34B | $6.72B | $-1.50B | $7.49B | $-1.41B | $-21.79B | $866.00M | $4.47B | $1.96B | $3.58B | $1.31B | $5.17B | $3.15B | $1.04B | $692.00M | $2.93B | $3.38B | $727.00M | $32.00M | $3.86B |
| Operating Income Ratio | -35.88% | 51.05% | -12.08% | 48.14% | -33.39% | -114.52% | 5.99% | 16.61% | 6.64% | 9.80% | 5.28% | 16.13% | 11.03% | 7.96% | 5.90% | 18.66% | 31.06% | 10.96% | 0.40% | 33.61% |
| Total Other Income Expenses Net | $-416.00M | $-1.18B | $-549.00M | $-1.39B | $1.96B | $-169.00M | $-1.63B | $-1.34B | $-915.00M | $-92.00M | $-418.00M | $-740.00M | $-1.62B | $-374.00M | $-539.00M | $-386.00M | $-748.00M | $10.86B | $-1.01B | $-787.00M |
| Income Before Tax | $-6.76B | $5.53B | $-559.00M | $4.43B | $557.00M | $-21.95B | $-763.00M | $3.13B | $460.00M | $9.70B | $893.00M | $6.56B | $4.36B | $671.00M | $5.70B | $2.55B | $442.00M | $11.22B | $-1.25B | $6.91B |
| Income Before Tax Ratio | -38.23% | 42.05% | -4.49% | 28.50% | 13.24% | -115.41% | -5.28% | 11.65% | 1.56% | 26.53% | 3.60% | 20.45% | 15.26% | 5.11% | 48.61% | 16.21% | 4.06% | 169.06% | -15.39% | 60.13% |
| Income Tax Expense | $-677.00M | $339.00M | $1.10B | $1.82B | $841.00M | $607.00M | $-225.00M | $-67.00M | $789.00M | $340.00M | $624.00M | $860.00M | $1.10B | $184.00M | $154.00M | $949.00M | $-258.00M | $-92.00M | $625.00M | $1.50B |
| Net Income | $-6.16B | $5.05B | $-1.72B | $2.56B | $-319.00M | $-22.60B | $-546.00M | $2.96B | $-329.00M | $9.33B | $280.00M | $5.70B | $3.31B | $490.00M | $5.57B | $1.59B | $763.00M | $11.33B | $-1.87B | $5.38B |
| Net Income Ratio | -34.85% | 38.42% | -13.81% | 16.45% | -7.58% | -118.78% | -3.78% | 10.98% | -1.12% | 25.54% | 1.13% | 17.77% | 11.59% | 3.73% | 47.52% | 10.11% | 7.01% | 170.75% | -23.12% | 46.82% |
| EPS | $-5.26 | $4.00 | $-1.36 | $1.90 | $-0.25 | $-17.92 | $-0.43 | $2.23 | $-0.26 | $7.42 | $0.22 | $4.52 | $2.44 | $0.37 | $4.30 | $0.93 | $0.60 | $8.97 | $-1.47 | $4.27 |
| EPS Diluted | $-5.26 | $4.00 | $-1.36 | $1.90 | $-0.25 | $-17.92 | $-0.43 | $2.23 | $-0.26 | $7.42 | $0.21 | $4.51 | $2.44 | $0.37 | $4.30 | $0.93 | $0.60 | $8.97 | $-1.47 | $4.27 |
| Weighted Average Shares Outstanding | 1.26B | 1.26B | 1.26B | 1.26B | 1.26B | 1.26B | 1.26B | 1.26B | 1.26B | 1.26B | 1.26B | 1.26B | 1.34B | 1.34B | 1.26B | 1.26B | 1.26B | 1.26B | 1.27B | 1.26B |
| Weighted Average Shares Outstanding Diluted | 1.26B | 1.26B | 1.26B | 1.26B | 1.26B | 1.26B | 1.26B | 1.26B | 1.26B | 1.26B | 1.32B | 1.26B | 1.34B | 1.34B | 1.26B | 1.26B | 1.26B | 1.26B | 1.27B | 1.26B |
| SEC Filing | Source | Source | Source | Source | Source | Source | Source | Source | Source | Source | Source | Source | Source | Source | Source | Source | Source | Source | Source | Source |
Annual Balance Sheet
| Breakdown | December 31, 2024 | December 31, 2023 | December 31, 2022 | December 31, 2021 | December 31, 2020 |
|---|---|---|---|---|---|
| Cash and Cash Equivalents | $22.81B | $9.66B | $13.71B | $8.62B | $5.44B |
| Short Term Investments | $10.13B | $29.52B | $24.43B | $6.21B | $24.42B |
| Cash and Short Term Investments | $32.94B | $39.18B | $38.13B | $14.83B | $29.87B |
| Net Receivables | $19.35B | $11.91B | $13.11B | $9.57B | $6.76B |
| Inventory | $17.45B | $10.54B | $14.10B | $16.00B | $14.74B |
| Other Current Assets | $9.91B | $22.43B | $44.91B | $47.77B | $12.89B |
| Total Current Assets | $79.64B | $84.06B | $112.73B | $88.16B | $65.00B |
| Property Plant Equipment Net | $201.69B | $179.77B | $177.66B | $161.40B | $121.61B |
| Goodwill | $- | $1.85B | $1.84B | $125.00M | $125.00M |
| Intangible Assets | $2.61B | $1.58B | $4.03B | $1.54B | $639.00M |
| Goodwill and Intangible Assets | $2.61B | $3.43B | $4.03B | $1.54B | $639.00M |
| Long Term Investments | $-8.91B | $-28.39B | $-23.47B | $-5.42B | $-23.66B |
| Tax Assets | $9.25B | $8.19B | $13.72B | $13.28B | $6.78B |
| Other Non-Current Assets | $14.51B | $34.08B | $29.48B | $11.42B | $26.35B |
| Total Non-Current Assets | $219.15B | $197.08B | $201.41B | $182.22B | $131.72B |
| Other Assets | $- | $- | $- | $- | $- |
| Total Assets | $298.79B | $281.14B | $314.14B | $270.38B | $196.72B |
| Account Payables | $20.83B | $14.91B | $20.64B | $20.23B | $9.74B |
| Short Term Debt | $4.93B | $1.19B | $3.40B | $20.21B | $2.99B |
| Tax Payables | $8.50B | $9.68B | $7.02B | $6.23B | $7.41B |
| Deferred Revenue | $- | $2.79B | $2.27B | $2.44B | $480.00M |
| Other Current Liabilities | $19.49B | $30.63B | $41.54B | $38.35B | $14.47B |
| Total Current Liabilities | $53.75B | $59.20B | $74.87B | $87.46B | $35.09B |
| Long Term Debt | $91.68B | $86.85B | $68.15B | $38.31B | $38.83B |
| Deferred Revenue Non-Current | $8.83B | $3.30B | $3.08B | $3.23B | $3.65B |
| Deferred Tax Liabilities Non-Current | $2.43B | $3.44B | $7.41B | $5.62B | $2.19B |
| Other Non-Current Liabilities | $48.60B | $50.55B | $65.09B | $50.63B | $19.63B |
| Total Non-Current Liabilities | $151.55B | $144.14B | $143.74B | $97.79B | $64.30B |
| Other Liabilities | $- | $- | $- | $- | $- |
| Total Liabilities | $205.30B | $203.34B | $218.61B | $185.25B | $99.39B |
| Preferred Stock | $- | $- | $26.47B | $24.78B | $1.96B |
| Common Stock | $4.20B | $4.20B | $4.20B | $4.20B | $4.20B |
| Retained Earnings | $63.10B | $62.83B | $88.33B | $79.39B | $74.29B |
| Accumulated Other Comprehensive Income Loss | $- | $- | $-26.47B | $-24.78B | $-1.96B |
| Other Total Stockholders Equity | $15.79B | $8.85B | $-26.47B | $-24.78B | $-1.96B |
| Total Stockholders Equity | $83.09B | $75.89B | $91.54B | $82.06B | $94.61B |
| Total Equity | $93.48B | $77.79B | $95.53B | $85.14B | $97.33B |
| Total Liabilities and Stockholders Equity | $298.79B | $281.14B | $314.14B | $270.38B | $196.72B |
| Minority Interest | $10.39B | $1.91B | $4.00B | $3.08B | $2.72B |
| Total Liabilities and Total Equity | $298.79B | $281.14B | $314.14B | $270.38B | $196.72B |
| Total Investments | $1.21B | $1.13B | $954.00M | $793.00M | $764.00M |
| Total Debt | $96.62B | $88.05B | $71.55B | $58.53B | $41.82B |
| Net Debt | $73.81B | $78.38B | $57.84B | $49.90B | $36.38B |
Balance Sheet Charts
| Breakdown | December 31, 2024 | September 30, 2024 | June 30, 2024 | March 31, 2024 | December 31, 2023 | September 30, 2023 | June 30, 2023 | March 31, 2023 | December 31, 2022 | September 30, 2022 | June 30, 2022 | March 31, 2022 | December 31, 2021 | September 30, 2021 | June 30, 2021 | March 31, 2021 | December 31, 2020 | September 30, 2020 | June 30, 2020 | March 31, 2020 |
|---|---|---|---|---|---|---|---|---|---|---|---|---|---|---|---|---|---|---|---|---|
| Cash and Cash Equivalents | $22.81B | $10.68B | $9.47B | $14.91B | $9.66B | $15.69B | $11.87B | $19.57B | $13.71B | $9.42B | $7.36B | $4.87B | $8.62B | $6.38B | $7.72B | $7.83B | $5.44B | $5.85B | $6.75B | $4.90B |
| Short Term Investments | $10.13B | $28.72B | $30.87B | $29.52B | $29.52B | $29.99B | $31.46B | $30.96B | $24.43B | $18.80B | $19.51B | $20.42B | $6.21B | $30.14B | $30.40B | $30.15B | $24.42B | $27.29B | $12.33B | $12.94B |
| Cash and Short Term Investments | $32.94B | $39.40B | $40.35B | $44.43B | $39.18B | $45.67B | $43.32B | $50.54B | $38.13B | $28.22B | $26.87B | $25.28B | $14.83B | $36.51B | $38.12B | $37.98B | $29.87B | $33.14B | $19.08B | $17.84B |
| Net Receivables | $19.35B | $- | $8.29B | $19.77B | $11.91B | $7.80B | $7.32B | $9.65B | $33.82B | $42.71B | $21.25B | $27.40B | $25.58B | $6.27B | $6.08B | $5.94B | $11.33B | $11.45B | $11.41B | $12.78B |
| Inventory | $17.45B | $14.75B | $13.18B | $12.88B | $10.54B | $9.92B | $12.50B | $13.04B | $14.10B | $17.13B | $18.72B | $16.43B | $16.00B | $14.91B | $10.09B | $11.58B | $14.74B | $13.21B | $11.42B | $14.96B |
| Other Current Assets | $9.91B | $23.36B | $18.86B | $8.99B | $21.95B | $27.75B | $27.17B | $30.88B | $23.43B | $52.70B | $43.25B | $27.33B | $31.75B | $32.88B | $21.30B | $14.56B | $8.32B | $7.62B | $24.49B | $28.94B |
| Total Current Assets | $79.64B | $77.51B | $80.68B | $86.08B | $84.06B | $91.15B | $90.31B | $104.10B | $112.73B | $140.76B | $110.09B | $96.44B | $88.16B | $90.57B | $75.59B | $70.06B | $65.00B | $65.43B | $66.40B | $74.52B |
| Property Plant Equipment Net | $201.69B | $195.74B | $189.95B | $187.89B | $179.77B | $177.96B | $187.20B | $182.50B | $177.66B | $176.15B | $174.30B | $164.90B | $161.40B | $148.62B | $137.42B | $130.22B | $121.61B | $116.06B | $113.99B | $107.72B |
| Goodwill | $- | $- | $- | $- | $1.85B | $- | $- | $- | $1.84B | $- | $- | $- | $125.00M | $- | $- | $- | $125.00M | $- | $- | $- |
| Intangible Assets | $2.61B | $2.52B | $2.39B | $3.43B | $3.43B | $3.34B | $3.16B | $4.30B | $4.03B | $3.51B | $1.41B | $1.83B | $1.54B | $1.33B | $1.04B | $787.00M | $639.00M | $581.00M | $504.00M | $657.00M |
| Goodwill and Intangible Assets | $2.61B | $2.52B | $2.39B | $3.43B | $3.43B | $3.34B | $3.16B | $4.30B | $4.03B | $3.51B | $1.41B | $1.83B | $1.54B | $1.33B | $1.04B | $787.00M | $639.00M | $581.00M | $504.00M | $657.00M |
| Long Term Investments | $-8.91B | $5.39B | $4.50B | $988.00M | $-28.39B | $-28.85B | $-30.32B | $-29.95B | $-23.47B | $-17.54B | $-18.52B | $-19.53B | $-5.42B | $-29.27B | $-29.51B | $-29.33B | $-23.66B | $-26.53B | $-11.56B | $-12.15B |
| Tax Assets | $9.25B | $9.18B | $8.48B | $8.07B | $8.19B | $8.80B | $9.88B | $10.11B | $13.72B | $21.72B | $20.87B | $14.73B | $13.28B | $12.82B | $6.44B | $7.03B | $6.78B | $8.43B | $8.44B | $7.06B |
| Other Non-Current Assets | $14.51B | $- | $- | $3.92B | $34.08B | $34.38B | $36.25B | $35.59B | $29.48B | $35.16B | $32.57B | $26.72B | $11.42B | $37.82B | $32.82B | $32.20B | $26.35B | $30.60B | $15.35B | $15.83B |
| Total Non-Current Assets | $219.15B | $212.83B | $205.32B | $204.31B | $197.08B | $195.64B | $206.16B | $202.54B | $201.41B | $219.00B | $210.63B | $188.65B | $182.22B | $171.32B | $148.20B | $140.91B | $131.72B | $129.14B | $126.72B | $119.12B |
| Other Assets | $- | $- | $- | $- | $- | $- | $- | $- | $- | $- | $- | $- | $- | $- | $- | $- | $- | $- | $- | $- |
| Total Assets | $298.79B | $290.34B | $286.00B | $290.38B | $281.14B | $286.78B | $296.47B | $306.64B | $314.14B | $359.76B | $320.72B | $285.09B | $270.38B | $261.89B | $223.79B | $210.97B | $196.72B | $194.57B | $193.12B | $193.64B |
| Account Payables | $20.83B | $15.29B | $14.15B | $14.48B | $14.91B | $13.81B | $12.01B | $14.45B | $20.64B | $20.22B | $20.41B | $19.52B | $20.23B | $15.18B | $10.94B | $10.33B | $9.74B | $9.80B | $12.93B | $8.85B |
| Short Term Debt | $4.93B | $15.55B | $2.96B | $9.87B | $1.19B | $4.92B | $3.31B | $2.92B | $3.40B | $2.71B | $12.76B | $14.82B | $20.21B | $23.84B | $10.54B | $10.70B | $2.99B | $3.47B | $2.71B | $4.49B |
| Tax Payables | $8.50B | $10.14B | $5.91B | $9.43B | $9.68B | $8.61B | $8.36B | $8.27B | $7.02B | $6.92B | $7.20B | $7.15B | $6.23B | $6.30B | $6.81B | $8.05B | $7.41B | $6.73B | $6.68B | $5.29B |
| Deferred Revenue | $- | $- | $3.33B | $-874.00M | $2.79B | $2.74B | $2.31B | $2.31B | $2.27B | $1.37B | $1.26B | $1.46B | $2.44B | $6.30B | $6.81B | $8.05B | $7.41B | $6.73B | $6.68B | $5.29B |
| Other Current Liabilities | $19.49B | $16.82B | $28.28B | $26.67B | $30.63B | $29.60B | $20.48B | $27.30B | $41.54B | $117.90B | $86.19B | $61.77B | $38.35B | $44.71B | $22.80B | $10.04B | $7.55B | $6.03B | $12.91B | $17.36B |
| Total Current Liabilities | $53.75B | $57.80B | $54.63B | $62.81B | $59.20B | $59.68B | $46.46B | $55.24B | $74.87B | $149.12B | $127.81B | $104.71B | $87.46B | $96.33B | $57.89B | $47.17B | $35.09B | $32.77B | $41.91B | $41.26B |
| Long Term Debt | $91.68B | $87.22B | $87.41B | $85.44B | $86.85B | $84.64B | $84.45B | $82.94B | $68.15B | $70.10B | $54.25B | $43.01B | $38.31B | $35.22B | $39.45B | $40.22B | $38.83B | $37.17B | $37.42B | $39.80B |
| Deferred Revenue Non-Current | $8.83B | $3.33B | $3.40B | $3.37B | $3.30B | $3.10B | $3.03B | $3.04B | $3.08B | $3.12B | $3.16B | $3.19B | $3.23B | $3.29B | $3.32B | $3.35B | $3.65B | $3.71B | $3.70B | $3.72B |
| Deferred Tax Liabilities Non-Current | $2.43B | $4.59B | $4.43B | $4.01B | $3.44B | $4.67B | $4.94B | $5.04B | $7.41B | $8.43B | $7.15B | $3.66B | $5.62B | $3.59B | $3.58B | $2.22B | $2.19B | $3.77B | $3.90B | $2.51B |
| Other Non-Current Liabilities | $48.60B | $46.28B | $75.56B | $51.42B | $50.55B | $56.33B | $54.03B | $57.55B | $65.09B | $75.21B | $67.07B | $53.80B | $50.63B | $44.31B | $22.64B | $21.46B | $19.63B | $20.68B | $20.26B | $17.34B |
| Total Non-Current Liabilities | $151.55B | $141.41B | $170.80B | $144.24B | $144.14B | $148.74B | $146.45B | $148.58B | $143.74B | $156.86B | $131.63B | $103.66B | $97.79B | $86.41B | $68.99B | $67.26B | $64.30B | $65.33B | $65.29B | $63.36B |
| Other Liabilities | $- | $- | $- | $- | $- | $- | $- | $- | $- | $- | $- | $- | $- | $- | $- | $- | $- | $- | $- | $- |
| Total Liabilities | $205.30B | $199.21B | $225.43B | $207.06B | $203.34B | $208.42B | $192.92B | $203.82B | $218.61B | $305.98B | $259.45B | $208.37B | $185.25B | $182.74B | $126.88B | $114.43B | $99.39B | $98.09B | $107.19B | $104.62B |
| Preferred Stock | $- | $- | $- | $- | $10.25B | $10.40B | $12.27B | $16.81B | $26.47B | $66.28B | $49.25B | $38.72B | $24.78B | $27.55B | $9.35B | $- | $- | $- | $- | $- |
| Common Stock | $4.20B | $4.20B | $4.20B | $4.20B | $4.20B | $4.20B | $4.20B | $4.20B | $4.20B | $4.20B | $4.20B | $4.20B | $4.20B | $4.20B | $4.20B | $4.20B | $4.20B | $4.20B | $4.20B | $4.20B |
| Retained Earnings | $63.10B | $67.98B | $62.58B | $65.23B | $62.83B | $63.50B | $90.44B | $91.15B | $88.33B | $94.49B | $85.13B | $84.96B | $79.39B | $81.48B | $80.99B | $75.49B | $74.29B | $78.53B | $67.17B | $69.43B |
| Accumulated Other Comprehensive Income Loss | $- | $- | $-10.34B | $12.07B | $-10.25B | $-10.40B | $-12.27B | $-16.81B | $-26.47B | $-66.28B | $-49.25B | $-38.72B | $-24.78B | $-27.55B | $-9.35B | $4.20B | $11.28B | $10.95B | $11.65B | $12.33B |
| Other Total Stockholders Equity | $15.79B | $14.76B | $- | $- | $-10.25B | $-10.40B | $-12.27B | $-16.81B | $-26.47B | $-114.57B | $-80.51B | $-59.45B | $-24.78B | $-27.55B | $-9.35B | $- | $- | $- | $- | $- |
| Total Stockholders Equity | $83.09B | $86.94B | $56.45B | $81.50B | $75.89B | $76.41B | $101.48B | $98.34B | $91.54B | $50.40B | $58.08B | $73.69B | $82.06B | $76.11B | $93.83B | $93.82B | $94.61B | $93.68B | $83.02B | $85.96B |
| Total Equity | $93.48B | $91.13B | $60.58B | $83.33B | $77.79B | $78.36B | $103.55B | $102.83B | $95.53B | $53.78B | $61.28B | $76.72B | $85.14B | $79.15B | $96.91B | $96.54B | $97.33B | $96.47B | $85.93B | $89.02B |
| Total Liabilities and Stockholders Equity | $298.79B | $290.34B | $286.00B | $290.38B | $281.14B | $286.78B | $296.47B | $306.64B | $314.14B | $359.76B | $320.72B | $285.09B | $270.38B | $261.89B | $223.79B | $210.97B | $196.72B | $194.57B | $193.12B | $193.64B |
| Minority Interest | $10.39B | $4.18B | $4.13B | $1.82B | $1.91B | $1.95B | $2.07B | $4.48B | $4.00B | $3.38B | $3.20B | $3.03B | $3.08B | $3.04B | $3.08B | $2.72B | $2.72B | $2.79B | $2.91B | $3.06B |
| Total Liabilities and Total Equity | $298.79B | $290.34B | $286.00B | $290.38B | $281.14B | $286.78B | $296.47B | $306.64B | $314.14B | $359.76B | $320.72B | $285.09B | $270.38B | $261.89B | $223.79B | $210.97B | $196.72B | $194.57B | $193.12B | $193.64B |
| Total Investments | $1.21B | $34.11B | $35.38B | $988.00M | $1.13B | $1.14B | $1.14B | $1.01B | $954.00M | $1.26B | $988.00M | $886.00M | $793.00M | $865.00M | $890.00M | $823.00M | $764.00M | $759.00M | $769.00M | $787.00M |
| Total Debt | $96.62B | $102.77B | $113.17B | $95.32B | $88.05B | $89.56B | $87.77B | $85.86B | $71.55B | $72.81B | $67.01B | $57.83B | $58.53B | $59.06B | $49.99B | $50.92B | $41.82B | $40.64B | $40.12B | $44.28B |
| Net Debt | $73.81B | $92.10B | $103.69B | $80.41B | $78.38B | $73.88B | $75.90B | $66.29B | $57.84B | $63.39B | $59.65B | $52.96B | $49.90B | $52.68B | $42.26B | $43.09B | $36.38B | $34.79B | $33.37B | $39.38B |
Annual Cash Flow
| Breakdown | December 31, 2024 | December 31, 2023 | December 31, 2022 | December 31, 2021 | December 31, 2020 |
|---|---|---|---|---|---|
| Net Income | $31.96B | $18.72B | $32.06B | $24.30B | $16.60B |
| Depreciation and Amortization | $- | $9.79B | $12.26B | $7.97B | $7.59B |
| Deferred Income Tax | $- | $- | $-6.46B | $- | $- |
| Stock Based Compensation | $- | $10.89B | $6.46B | $- | $- |
| Change in Working Capital | $-6.32B | $16.61B | $-7.14B | $-2.12B | $2.14B |
| Accounts Receivables | $3.15B | $5.36B | $-133.00M | $-10.79B | $1.49B |
| Inventory | $-6.53B | $3.66B | $1.42B | $-555.00M | $-1.61B |
| Accounts Payables | $- | $- | $3.89B | $5.14B | $-1.49B |
| Other Working Capital | $-2.94B | $7.59B | $-12.32B | $4.08B | $3.75B |
| Other Non Cash Items | $-7.28B | $-27.48B | $-25.25B | $-18.00B | $-9.86B |
| Net Cash Provided by Operating Activities | $18.36B | $28.53B | $11.92B | $12.15B | $16.47B |
| Investments in Property Plant and Equipment | $-42.65B | $-38.20B | $-33.00B | $-34.57B | $-26.96B |
| Acquisitions Net | $779.00M | $-127.00M | $-3.36B | $-2.55B | $18.89B |
| Purchases of Investments | $-11.59B | $-18.29B | $-9.41B | $-8.11B | $-19.87B |
| Sales Maturities of Investments | $27.32B | $13.94B | $3.80B | $11.66B | $11.21B |
| Other Investing Activities | $4.39B | $7.95B | $24.07B | $20.98B | $156.00M |
| Net Cash Used for Investing Activities | $-21.76B | $-34.73B | $-17.91B | $-12.59B | $-16.56B |
| Debt Repayment | $6.58B | $16.00B | $15.61B | $10.15B | $467.00M |
| Common Stock Issued | $- | $699.00M | $3.69B | $- | $- |
| Common Stock Repurchased | $- | $-699.00M | $-1.95B | $-2.97B | $-58.00M |
| Dividends Paid | $- | $-5.67B | $-5.25B | $-4.83B | $-4.41B |
| Other Financing Activities | $9.26B | $-10.07B | $3.43B | $-1.93B | $1.88B |
| Net Cash Used Provided by Financing Activities | $15.84B | $265.00M | $13.79B | $3.39B | $-2.12B |
| Effect of Forex Changes on Cash | $540.00M | $-96.00M | $-236.00M | $455.00M | $6.00M |
| Net Change in Cash | $12.98B | $-6.03B | $7.56B | $3.40B | $-1.25B |
| Cash at End of Period | $23.12B | $10.14B | $16.18B | $8.61B | $5.21B |
| Cash at Beginning of Period | $10.14B | $16.18B | $8.61B | $5.21B | $6.46B |
| Operating Cash Flow | $18.36B | $28.53B | $11.92B | $12.15B | $16.47B |
| Capital Expenditure | $-42.65B | $-38.20B | $-33.00B | $-34.57B | $-26.96B |
| Free Cash Flow | $-24.30B | $-9.67B | $-21.08B | $-22.42B | $-10.49B |
Cash Flow Charts
| Breakdown | December 31, 2024 | September 30, 2024 | June 30, 2024 | March 31, 2024 | December 31, 2023 | September 30, 2023 | June 30, 2023 | March 31, 2023 | December 31, 2022 | September 30, 2022 | June 30, 2022 | March 31, 2022 | December 31, 2021 | September 30, 2021 | June 30, 2021 | March 31, 2021 | December 31, 2020 | September 30, 2020 | June 30, 2020 | March 31, 2020 |
|---|---|---|---|---|---|---|---|---|---|---|---|---|---|---|---|---|---|---|---|---|
| Net Income | $8.35B | $5.05B | $-1.72B | $7.49B | $-686.00M | $9.17B | $3.32B | $6.91B | $6.70B | $12.32B | $3.62B | $9.43B | $8.25B | $2.98B | $8.20B | $4.86B | $3.10B | $2.46B | $1.59B | $9.45B |
| Depreciation and Amortization | $- | $- | $2.68B | $2.42B | $2.37B | $2.54B | $2.45B | $2.44B | $5.30B | $2.53B | $2.30B | $2.13B | $2.27B | $1.94B | $1.96B | $1.93B | $1.91B | $2.10B | $1.83B | $1.75B |
| Deferred Income Tax | $- | $- | $- | $- | $-10.89B | $- | $- | $- | $-6.46B | $- | $- | $- | $- | $- | $- | $- | $- | $- | $- | $- |
| Stock Based Compensation | $- | $- | $- | $- | $10.89B | $- | $- | $- | $6.46B | $- | $- | $- | $- | $- | $- | $- | $- | $- | $- | $- |
| Change in Working Capital | $5.08B | $-10.28B | $3.12B | $-2.23B | $5.52B | $5.24B | $1.25B | $4.60B | $14.34B | $-13.57B | $-825.00M | $-7.09B | $-5.19B | $-2.65B | $1.09B | $4.63B | $1.33B | $-1.01B | $6.08B | $-4.26B |
| Accounts Receivables | $-1.92B | $1.19B | $2.00B | $1.95B | $-1.74B | $-1.03B | $3.57B | $4.56B | $7.37B | $-11.72B | $5.85B | $-1.64B | $-1.27B | $-152.00M | $-68.00M | $686.00M | $- | $- | $- | $- |
| Inventory | $-2.55B | $-1.48B | $-233.00M | $-2.27B | $-618.00M | $2.42B | $716.00M | $1.14B | $2.99B | $1.41B | $-2.48B | $-498.00M | $-3.70B | $-610.00M | $-857.00M | $4.61B | $486.00M | $-84.00M | $-177.00M | $-1.84B |
| Accounts Payables | $- | $326.00M | $-527.00M | $-328.00M | $1.97B | $73.00M | $-1.75B | $-5.60B | $1.31B | $2.04B | $-554.00M | $1.09B | $- | $- | $- | $- | $- | $- | $- | $- |
| Other Working Capital | $9.55B | $-10.31B | $1.89B | $-140.00M | $5.92B | $3.78B | $-1.29B | $4.49B | $2.67B | $-5.29B | $-3.64B | $-6.59B | $-1.49B | $-2.04B | $1.95B | $21.00M | $845.00M | $-929.00M | $6.25B | $-2.42B |
| Other Non Cash Items | $-3.13B | $3.58B | $6.12B | $108.00M | $-1.03B | $-7.16B | $-4.57B | $-3.83B | $-5.42B | $-12.59B | $-2.74B | $-4.50B | $-2.40B | $-84.00M | $-6.14B | $-3.34B | $411.00M | $499.00M | $530.00M | $-5.62B |
| Net Cash Provided by Operating Activities | $10.31B | $-1.64B | $6.08B | $3.61B | $6.17B | $9.80B | $2.45B | $10.12B | $20.91B | $-11.31B | $2.35B | $-37.00M | $668.00M | $246.00M | $3.15B | $8.09B | $6.76B | $1.94B | $8.20B | $-428.00M |
| Investments in Property Plant and Equipment | $-16.34B | $-9.65B | $-8.21B | $-8.46B | $-12.93B | $-9.19B | $-7.30B | $-8.79B | $-9.84B | $-10.05B | $-6.31B | $-6.80B | $-11.70B | $-8.79B | $-7.48B | $-6.67B | $-8.64B | $-9.31B | $-3.77B | $-5.24B |
| Acquisitions Net | $- | $-156.00M | $2.92B | $-170.00M | $30.00M | $-3.00M | $-152.00M | $5.00M | $-49.00M | $-3.26B | $-6.00M | $-49.00M | $42.00M | $-58.00M | $-2.49B | $-42.00M | $-1.41B | $20.38B | $10.00M | $-78.00M |
| Purchases of Investments | $-565.00M | $-5.02B | $-4.26B | $-1.91B | $-407.00M | $-5.61B | $-4.36B | $-7.91B | $-7.58B | $-820.00M | $-206.00M | $-813.00M | $-583.00M | $-445.00M | $-1.04B | $-6.04B | $-251.00M | $-15.47B | $-595.00M | $-3.55B |
| Sales Maturities of Investments | $14.73B | $7.61B | $2.68B | $2.26B | $1.18B | $6.97B | $3.78B | $2.01B | $1.39B | $932.00M | $478.00M | $993.00M | $9.45B | $565.00M | $663.00M | $983.00M | $2.40B | $558.00M | $1.37B | $6.88B |
| Other Investing Activities | $4.25B | $207.00M | $43.00M | $46.00M | $1.84B | $6.10B | $20.00M | $1.00M | $133.00M | $22.05B | $31.00M | $1.86B | $10.77B | $30.00M | $10.23B | $23.00M | $60.00M | $25.00M | $57.00M | $23.00M |
| Net Cash Used for Investing Activities | $2.08B | $-7.01B | $-6.79B | $-8.06B | $-10.29B | $-1.74B | $-8.01B | $-14.68B | $-15.94B | $8.85B | $-6.01B | $-4.81B | $7.97B | $-8.70B | $-110.00M | $-11.75B | $-7.84B | $-3.83B | $-2.92B | $-1.97B |
| Debt Repayment | $-6.91B | $12.00B | $-5.06B | $6.55B | $-892.00M | $1.41B | $1.18B | $14.30B | $2.85B | $5.03B | $7.75B | $-537.00M | $-4.27B | $8.88B | $-2.67B | $8.20B | $373.00M | $1.28B | $-3.72B | $2.96B |
| Common Stock Issued | $- | $- | $- | $- | $- | $- | $- | $- | $- | $- | $- | $- | $- | $- | $- | $7.33B | $- | $- | $- | $- |
| Common Stock Repurchased | $- | $-1.87B | $- | $-1.84B | $- | $- | $-699.00M | $- | $-1.95B | $- | $- | $- | $- | $- | $- | $-2.97B | $- | $- | $-58.00M | $- |
| Dividends Paid | $- | $- | $- | $-161.00M | $-358.00M | $- | $-43.00M | $-5.67B | $-215.00M | $- | $-5.25B | $-150.00M | $-162.00M | $- | $-162.00M | $-4.83B | $-162.00M | $- | $-326.00M | $-4.41B |
| Other Financing Activities | $6.61B | $-166.00M | $2.12B | $2.57B | $-159.00M | $-5.73B | $-2.66B | $-773.00M | $1.30B | $-174.00M | $1.51B | $1.30B | $-2.19B | $-1.81B | $-305.00M | $2.39B | $599.00M | $-863.00M | $82.00M | $1.63B |
| Net Cash Used Provided by Financing Activities | $-295.00M | $9.97B | $-4.92B | $9.11B | $-1.05B | $-4.33B | $-2.22B | $7.86B | $4.15B | $4.86B | $4.01B | $766.00M | $-6.46B | $7.06B | $-2.97B | $5.76B | $972.00M | $421.00M | $-3.69B | $176.00M |
| Effect of Forex Changes on Cash | $357.00M | $-110.00M | $209.00M | $84.00M | $-365.00M | $93.00M | $74.00M | $102.00M | $-225.00M | $-97.00M | $71.00M | $15.00M | $229.00M | $44.00M | $6.00M | $176.00M | $57.00M | $-74.00M | $-25.00M | $48.00M |
| Net Change in Cash | $12.45B | $1.20B | $-5.44B | $4.74B | $-5.54B | $3.82B | $-7.71B | $3.40B | $8.90B | $2.30B | $428.00M | $-4.07B | $2.41B | $-1.34B | $73.00M | $2.27B | $-103.00M | $-566.00M | $1.66B | $-2.24B |
| Cash at End of Period | $23.12B | $10.68B | $9.47B | $14.89B | $10.14B | $15.68B | $11.86B | $19.57B | $16.18B | $7.28B | $4.98B | $4.55B | $8.61B | $6.21B | $7.55B | $7.48B | $5.21B | $5.31B | $5.88B | $4.22B |
| Cash at Beginning of Period | $10.68B | $9.47B | $14.91B | $10.14B | $15.68B | $11.86B | $19.57B | $16.18B | $7.28B | $4.98B | $4.55B | $8.61B | $6.21B | $7.55B | $7.48B | $5.21B | $5.31B | $5.88B | $4.22B | $6.46B |
| Operating Cash Flow | $10.31B | $-1.64B | $6.08B | $3.61B | $6.17B | $9.80B | $2.45B | $10.12B | $20.91B | $-11.31B | $2.35B | $-37.00M | $668.00M | $246.00M | $3.15B | $8.09B | $6.76B | $1.94B | $8.20B | $-428.00M |
| Capital Expenditure | $-16.34B | $-9.82B | $-8.21B | $-8.46B | $-12.93B | $-9.19B | $-7.30B | $-8.79B | $-9.84B | $-10.05B | $-6.31B | $-6.80B | $-11.70B | $-8.79B | $-7.48B | $-6.67B | $-8.64B | $-9.31B | $-3.77B | $-5.24B |
| Free Cash Flow | $-6.03B | $-11.46B | $-2.13B | $-4.85B | $-6.76B | $603.00M | $-4.86B | $1.33B | $11.07B | $-21.36B | $-3.95B | $-6.84B | $-11.04B | $-8.54B | $-4.33B | $1.41B | $-1.89B | $-7.37B | $4.43B | $-5.67B |
Ørsted A/S Dividends
Explore Ørsted A/S's dividend history, including dividend yield, payout ratio, and historical payments.
Dividend Yield
-
Dividend Payout Ratio
-
Dividend Paid & Capex Coverage Ratio
0.43x
Ørsted A/S Dividend History
| Dividend | Adjusted Dividend | Date | Record Date | Payment Date | Declaration Date |
|---|---|---|---|---|---|
| $0.09344173 | $0.09344173 | March 08, 2023 | March 09, 2023 | March 24, 2023 | March 03, 2023 |
| $0.08814703 | $0.08814703 | April 11, 2022 | April 12, 2022 | April 28, 2022 | April 02, 2022 |
| $0.10028 | $0.10028 | March 02, 2021 | March 03, 2021 | March 18, 2021 | February 19, 2021 |
| $0.0776939 | $0.0776939 | March 03, 2020 | March 04, 2020 | March 23, 2020 | |
| $0.07413046 | $0.07413046 | March 06, 2019 | March 07, 2019 | March 25, 2019 | |
| $0.08270426 | $0.08270426 | March 09, 2018 | March 12, 2018 | March 28, 2018 |
Ørsted A/S News
Read the latest news about Ørsted A/S, including recent articles, headlines, and updates.
Orsted Grows Into A Wind Giant
Ørsted is continuing to execute on a strong project pipeline while being financially intelligent. The company faces some threats from the Trump administration, but has global operations that are strong. We expect the company to be able to generate strong shareholder returns as it cleans up its profile of shareholder returns.

Ørsted A/S (DNNGY) Q4 2024 Earnings Call Transcript
Ørsted A/S (OTCPK:DNNGY) Q4 2024 Results Conference Call February 6, 2025 8:00 AM ET Company Participants Rasmus Errboe - President & CEO Trond Westlie - EVP & CFO Conference Call Participants Harry Wyburd - BNP Paribas Kristian Tornøe - SEB Peter Bisztyga - Bank of America Alberto Gandolfi - Goldman Sachs Casper Blom - Danske Bank Robert Pulleyn - Morgan Stanley Jenny Ping - Citigroup Deepa Venkateswaran - Bernstein Olly Jeffery - Deutsche Bank Mark Freshney - UBS Dominic Nash - Barclays Helene Brondbo - DNB Markets David Paz - Wolfe Research Operator Ladies and gentlemen, welcome to the Ørsted Q4 2024 Earnings Call. I would like to remind you that all participants will be in listen-only mode.

Wind power developer Orsted sees 2025 core profit in line with or higher than in 2024
Orsted , the world's biggest offshore wind power developer, said on Thursday it expected core profit this year to be equal to, or above 2024, a day after cutting investment plans for coming years, sending its shares higher.
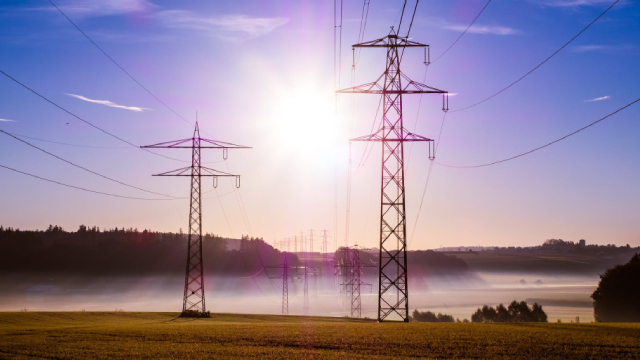
Ørsted plunges after write-down - dragging Vestas down with it
Danish energy company Ørsted plummets on the stock market, dragging Vestas down with it. Ørsted falls 16.6 percent, while Vestas drops 4.5 percent. The background is that Ørsted has announced that it will take write-downs of DKK 12.1 billion in the fourth quarter, equivalent to about SEK 18.6 billion. There are several reasons for the write-downs, with the company pointing to rising interest rates, a reduction in the valuation of the US portfolio and rising costs for delivering the Sunrise Wind project off the east coast to New York's Long Island.

Orsted price target lowered to DKK 365.41 from DKK 4,000 at Barclays
Barclays lowered the firm's price target on Orsted to DKK 365.41 from DKK 4,000 and keeps an Equal Weight rating on the shares. The firm says European utilities "remain in the foothills of a super-cycle." Regulated is now Barclays' preferred sub-sector and generators earnings "continue to unwind," the analyst tells investors in a research note. Barclays sees possible upside surprises from balance sheet clarity, low European expectations and capacity payments.
Scandinavia Backs Orsted As It Taps Hitachi For Grid Stabilisation On Big Offshore Wind Project
Orsted, the world's largest offshore wind developer, has faced significant stock declines but remains crucial for global decarbonization efforts amid climate urgency and political challenges. Scandinavian company Equinor has joined the Danish Government to bolster Orsted, emphasizing long-term commitment to offshore wind despite recent industry struggles. President Trump's antagonism towards the US wind industry faces substantial obstacles, given the industry's growth, state support, and significant employment, making his goals likely unattainable.

Ørsted A/S. (DNNGY) Q3 2024 Earnings Call Transcript
Ørsted A/S. (OTCPK:DNNGY) Q3 2024 Earnings Conference Call November 5, 2024 8:00 AM ET Company Participants Mads Nipper - President & CEO Trond Westlie - EVP & CFO Conference Call Participants Peter Bisztyga - Bank of America Jenny Ping - Citigroup Deepa Venkateswaran - Bernstein Casper Blom - Danske Bank Harry Wyburd - BNP Paribas Alberto Gandolfi - Goldman Sachs Robert Pulleyn - Morgan Stanley Mark Freshney - UBS Dominic Nash - Barclays Olly Jeffery - Deutsche Bank Helene Kvilhaug Brondbo - DNB Markets Meike Becker - HSBC Ingo Becker - Kepler David Paz - Wolfe Research Mark Freshney - UBS Mads Nipper Good morning, good afternoon, everyone, and thank you for joining our earnings call.

Swedish defence concerns over Baltic Sea wind farms can be addressed, says Orsted CEO
The offshore wind industry has solutions that would address Swedish defence concerns, CEO of renewable energy group Orsted said on Tuesday after Sweden rejected applications to build 13 offshore wind farms in the Baltic Sea.

Ørsted: Seeing Some Stability And Upside From The Speculative 'Buy'
Ørsted has faced significant profitability issues in wind projects, but recent developments, including Equinor's 10% stake acquisition, suggest the stock is undervalued. Equinor's investment indicates confidence in Ørsted's potential and a belief that the company won't need to dilute equity with a rights issuance. DNNGY could benefit from a decline in interest rates, especially with the derisked Hornsea 3 project resubmitted to UK renewable auctions.
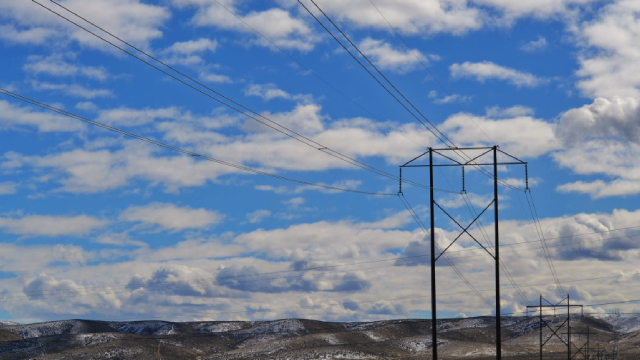
SSE, Orsted, ScottishPower win contracts in latest offshore wind auction
SSE PLC (LSE:SSE), Orsted and Scottish are among firms to have secured contracts under the UK's latest offshore energy allocation round. After no bids were submitted in last year's auction, nine offshore wind contracts were awarded in the UK's sixth allocation round, the government announced on Tuesday.
Orsted A/S. (DNNGY) Q2 2024 Earnings Call Transcript
Orsted A/S. (OTCPK:DNNGY) Q2 2024 Earnings Conference Call August 15, 2024 8:00 AM ET Company Participants Mads Nipper - Group President and Chief Executive Officer Trond Westlie - Executive Vice President and Group Chief Financial Officer Conference Call Participants Kristian Tornoe - SEB Harry Wyburd - BNP Paribas Exane Alberto Gandolfi - Goldman Sachs Jenny Ping - Citi Casper Blom - Danske Bank Deepa Venkateswaran - Bernstein Mark Freshney - UBS Helene Kvilhaug Brondbo - DNB Markets Lars Heindorff - Nordea Ahmed Farman - Jefferies Olly Jeffery - Deutsche Bank Dominic Nash - Barclays Ide Kearney - Pictet David Paz - Wolfe Research Operator Ladies and gentlemen, welcome to this Orsted Q2 2024 earnings call.

Similar Companies
Related Metrics
Explore detailed financial metrics and analysis for DNNGY.
