Doré Copper Mining Key Executives
This section highlights Doré Copper Mining's key executives, including their titles and compensation details.
Find Contacts at Doré Copper Mining
(Showing 0 of )
Doré Copper Mining Earnings
This section highlights Doré Copper Mining's earnings, including key dates, EPS, earnings reports, and earnings call transcripts.
Next Earnings Date
Last Earnings Results
Earnings Call Transcripts
| Transcript | Quarter | Year | Date | Estimated EPS | Actual EPS |
|---|

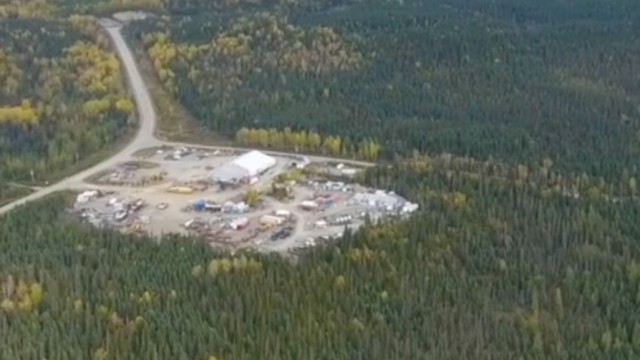
Doré Copper Mining Corp. engages in the acquisition, exploration, evaluation, and development of mineral properties in Canada. The company primarily explores for copper and gold deposits. Its primary assets are the Corner Bay project, the Cedar Bay project, the Copper Rand mine, the Devlin deposit, and the Copper Rand tailings management facility located in Chibougamau, Québec, as well as the Joe Mann mine in Chibougamau, Québec. The company was formerly known as AmAuCu Mining Corporation. Doré Copper Mining Corp. was incorporated in 2017 and is based in Toronto, Canada.
$0.11
Stock Price
$18.62M
Market Cap
-
Employees
Toronto, ON
Location
Financial Statements
Access annual & quarterly financial statements for Doré Copper Mining, including income statements, balance sheets, and cash flow statements..
Annual Income Statement
| Breakdown | December 31, 2023 | December 31, 2022 | December 31, 2021 | December 31, 2020 | December 31, 2019 |
|---|---|---|---|---|---|
| Revenue | $- | $- | $- | $- | $- |
| Cost of Revenue | $83.39K | $80.59K | $2.30K | $1.15K | $- |
| Gross Profit | $-83.39K | $-80.59K | $-2.30K | $-1.15K | $- |
| Gross Profit Ratio | 0.00% | 0.00% | 0.00% | 0.00% | 0.00% |
| Research and Development Expenses | $- | $- | $- | $- | $- |
| General and Administrative Expenses | $748.54K | $3.01M | $2.89M | $1.93M | $3.19M |
| Selling and Marketing Expenses | $5.16M | $- | $- | $- | $- |
| Selling General and Administrative Expenses | $5.90M | $3.01M | $2.89M | $1.93M | $3.19M |
| Other Expenses | $- | $-25.42K | $- | $1.08M | $- |
| Operating Expenses | $5.90M | $20.83M | $14.60M | $10.21M | $4.44M |
| Cost and Expenses | $5.90M | $20.91M | $14.60M | $10.22M | $4.44M |
| Interest Income | $107 | $81.26K | $69.80K | $19.58K | $- |
| Interest Expense | $- | $- | $- | $- | $132.64K |
| Depreciation and Amortization | $83.39K | $80.59K | $2.30K | $1.15K | $2.81M |
| EBITDA | $-5.90M | $-20.83M | $-14.60M | $-9.10M | $- |
| EBITDA Ratio | 0.00% | 0.00% | 0.00% | 0.00% | 0.00% |
| Operating Income | $-5.90M | $-20.91M | $-14.60M | $-9.10M | $-4.44M |
| Operating Income Ratio | 0.00% | 0.00% | 0.00% | 0.00% | 0.00% |
| Total Other Income Expenses Net | $-596.72K | $-717.88K | $-723.62K | $380.20K | $-1.77M |
| Income Before Tax | $-6.50M | $-20.86M | $-14.53M | $-9.10M | $-4.58M |
| Income Before Tax Ratio | 0.00% | 0.00% | 0.00% | 0.00% | 0.00% |
| Income Tax Expense | $680.37K | $-2.83M | $-614.06K | $1.08M | $-2.81K |
| Net Income | $-5.82M | $-18.03M | $-13.91M | $-9.10M | $-4.58M |
| Net Income Ratio | 0.00% | 0.00% | 0.00% | 0.00% | 0.00% |
| EPS | $-0.06 | $-0.25 | $-0.23 | $-0.29 | $-0.25 |
| EPS Diluted | $-0.06 | $-0.25 | $-0.23 | $-0.29 | $-0.25 |
| Weighted Average Shares Outstanding | 93.52M | 72.76M | 60.78M | 31.15M | 18.30M |
| Weighted Average Shares Outstanding Diluted | 93.52M | 72.76M | 60.78M | 31.15M | 18.30M |
| SEC Filing | Source | Source | Source | Source | Source |
| Breakdown | September 30, 2024 | June 30, 2024 | March 31, 2024 | December 31, 2023 | September 30, 2023 | June 30, 2023 | March 31, 2023 | December 31, 2022 | September 30, 2022 | June 30, 2022 | March 31, 2022 | December 31, 2021 | September 30, 2021 | June 30, 2021 | March 31, 2021 | December 31, 2020 | September 30, 2020 | June 30, 2020 | March 31, 2020 | December 31, 2019 |
|---|---|---|---|---|---|---|---|---|---|---|---|---|---|---|---|---|---|---|---|---|
| Revenue | $- | $- | $- | $- | $- | $- | $- | $- | $- | $- | $- | $- | $- | $- | $- | $- | $- | $- | $- | $- |
| Cost of Revenue | $20.85K | $20.85K | $20.85K | $20.85K | $20.85K | $20.85K | $20.85K | $35.72K | $40.30K | $4.58K | $4.58K | $575 | $575 | $575 | $575 | $- | $575 | $575 | $- | $- |
| Gross Profit | $-20.85K | $-20.85K | $-20.85K | $-20.85K | $-20.85K | $-20.85K | $-20.85K | $-35.72K | $-40.30K | $-4.58K | $-4.58K | $-575 | $-575 | $-575 | $-575 | $- | $-575 | $-575 | $- | $- |
| Gross Profit Ratio | 0.00% | 0.00% | 0.00% | 0.00% | 0.00% | 0.00% | 0.00% | 0.00% | 0.00% | 0.00% | 0.00% | 0.00% | 0.00% | 0.00% | 0.00% | 0.00% | 0.00% | 0.00% | 0.00% | 0.00% |
| Research and Development Expenses | $- | $- | $- | $- | $- | $- | $- | $- | $- | $- | $- | $- | $- | $- | $- | $- | $- | $- | $- | $- |
| General and Administrative Expenses | $203.70K | $224.08K | $317.78K | $336.10K | $229.99K | $341.52K | $296.01K | $783.73K | $1.63M | $886.46K | $597.28K | $710.05K | $637.10K | $844.21K | $693.79K | $750.04K | $426.38K | $282.01K | $510.31K | $3.19M |
| Selling and Marketing Expenses | $- | $856.14K | $1.74M | $839 | $- | $- | $- | $- | $- | $- | $- | $- | $- | $- | $- | $- | $- | $- | $- | $- |
| Selling General and Administrative Expenses | $203.70K | $1.08M | $2.06M | $1.25M | $229.99K | $341.52K | $296.01K | $783.73K | $1.63M | $886.46K | $597.28K | $710.05K | $637.10K | $844.21K | $693.79K | $750.04K | $426.38K | $282.01K | $510.31K | $3.19M |
| Other Expenses | $-224.54K | $- | $-10.69K | $-21.38K | $- | $213.79K | $-15.37K | $-2.28M | $2.03M | $1.56M | $-12.73K | $- | $261.45K | $279.90K | $149.74K | $1.43M | $-72.25K | $-120.40K | $-148.56K | $- |
| Operating Expenses | $-20.85K | $933.43K | $2.06M | $1.25M | $1.23M | $1.58M | $2.37M | $5.13M | $8.80M | $6.40M | $6.90M | $2.05M | $4.86M | $3.99M | $3.70M | $2.31M | $2.38M | $1.77M | $3.80M | $4.45M |
| Cost and Expenses | $896.79K | $933.43K | $2.08M | $1.27M | $1.25M | $1.61M | $2.39M | $5.17M | $8.84M | $6.40M | $6.90M | $2.05M | $4.86M | $3.99M | $3.70M | $2.31M | $2.38M | $1.77M | $3.80M | $4.45M |
| Interest Income | $- | $- | $27.09K | $67 | $34.38K | $- | $5.12K | $3.41K | $44.19K | $- | $33.65K | $- | $- | $- | $1.89K | $- | $- | $- | $- | $- |
| Interest Expense | $- | $- | $- | $- | $- | $- | $- | $- | $- | $- | $- | $- | $- | $- | $- | $- | $- | $- | $- | $- |
| Depreciation and Amortization | $20.85K | $20.85K | $20.85K | $20.85K | $20.85K | $20.85K | $20.85K | $35.72K | $40.30K | $4.58K | $4.58K | $575 | $575 | $575 | $575 | $55.13K | $575 | $575 | $3.58M | $1.71M |
| EBITDA | $-875.95K | $-1.08M | $-2.06M | $-1.25M | $-1.23M | $-1.58M | $-2.37M | $-5.13M | $-8.85M | $-6.39M | $-6.90M | $-2.05M | $-4.86M | $-3.99M | $-3.70M | $-878.96K | $-2.38M | $-1.77M | $- | $-4.45M |
| EBITDA Ratio | 0.00% | 0.00% | 0.00% | 0.00% | 0.00% | 0.00% | 0.00% | 0.00% | 0.00% | 0.00% | 0.00% | 0.00% | 0.00% | 0.00% | 0.00% | 0.00% | 0.00% | 0.00% | 0.00% | 0.00% |
| Operating Income | $- | $-933.43K | $-2.08M | $-1.27M | $-1.25M | $-1.61M | $-2.39M | $-5.17M | $-8.88M | $-6.42M | $-6.90M | $-2.05M | $-4.91M | $-3.99M | $-3.70M | $-878.96K | $-2.45M | $-1.89M | $-3.94M | $-4.45M |
| Operating Income Ratio | 0.00% | 0.00% | 0.00% | 0.00% | 0.00% | 0.00% | 0.00% | 0.00% | 0.00% | 0.00% | 0.00% | 0.00% | 0.00% | 0.00% | 0.00% | 0.00% | 0.00% | 0.00% | 0.00% | 0.00% |
| Total Other Income Expenses Net | $-857.67K | $-170.13K | $16.40K | $46.67K | $34.38K | $-8.73K | $-10.24K | $-2.27M | $2.05M | $1.58M | $20.92K | $-666.98K | $305.78K | $280.55K | $151.63K | $- | $-67.32K | $-107.94K | $-137.79K | $-132.64K |
| Income Before Tax | $-857.67K | $-1.10M | $-2.06M | $-1.23M | $-1.25M | $-1.39M | $-2.40M | $-7.44M | $-6.77M | $-4.82M | $-6.88M | $-2.71M | $-4.56M | $-3.71M | $-3.55M | $-878.96K | $-2.44M | $-1.88M | $-3.93M | $-4.58M |
| Income Before Tax Ratio | 0.00% | 0.00% | 0.00% | 0.00% | 0.00% | 0.00% | 0.00% | 0.00% | 0.00% | 0.00% | 0.00% | 0.00% | 0.00% | 0.00% | 0.00% | 0.00% | 0.00% | 0.00% | 0.00% | 0.00% |
| Income Tax Expense | $-38.07K | $-126.45K | $-273.26K | $-233.16K | $34.38K | $-101.24K | $-224.68K | $-2.91M | $-44.19K | $-21.26K | $-233.12K | $-614.06K | $-44.33K | $-644 | $-1.89K | $1.10M | $-72.25K | $-120.98K | $-3.72M | $-161.64K |
| Net Income | $-819.60K | $-977.11K | $-1.79M | $-992.49K | $-1.25M | $-1.39M | $-2.17M | $-4.62M | $-6.77M | $-4.82M | $-6.65M | $-2.10M | $-4.56M | $-3.71M | $-3.55M | $-878.96K | $-2.44M | $-1.88M | $-3.93M | $-4.42M |
| Net Income Ratio | 0.00% | 0.00% | 0.00% | 0.00% | 0.00% | 0.00% | 0.00% | 0.00% | 0.00% | 0.00% | 0.00% | 0.00% | 0.00% | 0.00% | 0.00% | 0.00% | 0.00% | 0.00% | 0.00% | 0.00% |
| EPS | $-0.01 | $-0.01 | $-0.01 | $-0.01 | $-0.01 | $-0.02 | $-0.02 | $-0.05 | $-0.10 | $-0.07 | $-0.10 | $-0.03 | $-0.09 | $-0.07 | $-0.08 | $-0.03 | $-0.08 | $-0.06 | $-0.14 | $-0.07 |
| EPS Diluted | $-0.01 | $-0.01 | $-0.01 | $-0.01 | $-0.01 | $-0.02 | $-0.02 | $-0.05 | $-0.10 | $-0.07 | $-0.10 | $-0.03 | $-0.09 | $-0.07 | $-0.08 | $-0.03 | $-0.08 | $-0.06 | $-0.14 | $-0.07 |
| Weighted Average Shares Outstanding | 134.00M | 134.00M | 133.77M | 99.25M | 89.93M | 89.93M | 90.60M | 90.60M | 66.55M | 66.55M | 66.47M | 68.59M | 51.68M | 51.68M | 45.83M | 32.16M | 29.32M | 28.97M | 28.97M | 65.92M |
| Weighted Average Shares Outstanding Diluted | 133.99M | 133.99M | 133.77M | 99.25M | 89.93M | 89.93M | 90.60M | 90.60M | 66.55M | 66.55M | 66.47M | 68.59M | 51.68M | 51.68M | 45.83M | 32.16M | 29.32M | 28.97M | 28.97M | 65.92M |
| SEC Filing | Source | Source | Source | Source | Source | Source | Source | Source | Source | Source | Source | Source | Source | Source | Source | Source | Source | Source | Source | Source |
Annual Balance Sheet
| Breakdown | December 31, 2023 | December 31, 2022 | December 31, 2021 | December 31, 2020 | December 31, 2019 |
|---|---|---|---|---|---|
| Cash and Cash Equivalents | $3.05M | $397.64K | $13.23M | $4.33M | $8.15M |
| Short Term Investments | $1.09M | $- | $815.09K | $792.03K | $- |
| Cash and Short Term Investments | $3.05M | $397.64K | $14.04M | $5.13M | $8.15M |
| Net Receivables | $- | $- | $- | $- | $- |
| Inventory | $- | $- | $- | $- | $- |
| Other Current Assets | $1.32M | $19.49K | $139.97K | $39.38K | $156.57K |
| Total Current Assets | $4.38M | $5.44M | $18.35M | $5.65M | $8.56M |
| Property Plant Equipment Net | $7.13M | $7.21M | $5.99M | $5.94M | $5.93M |
| Goodwill | $- | $- | $- | $- | $- |
| Intangible Assets | $- | $- | $- | $- | $- |
| Goodwill and Intangible Assets | $- | $- | $- | $- | $- |
| Long Term Investments | $- | $- | $- | $- | $- |
| Tax Assets | $- | $- | $- | $- | $- |
| Other Non-Current Assets | $- | $-0 | $- | $- | $0 |
| Total Non-Current Assets | $7.13M | $7.21M | $5.99M | $5.94M | $5.93M |
| Other Assets | $- | $-0 | $- | $-0 | $0 |
| Total Assets | $11.51M | $12.65M | $24.33M | $11.59M | $14.49M |
| Account Payables | $1.53M | $3.43K | $1.56K | $1.33K | $1.41M |
| Short Term Debt | $250.71K | $- | $- | $- | $- |
| Tax Payables | $- | $- | $- | $- | $- |
| Deferred Revenue | $- | $- | $- | $- | $- |
| Other Current Liabilities | $421.20K | $3.84M | $4.26M | $1.41M | $769.24K |
| Total Current Liabilities | $2.20M | $3.84M | $4.27M | $1.41M | $2.18M |
| Long Term Debt | $- | $- | $- | $- | $- |
| Deferred Revenue Non-Current | $- | $- | $- | $- | $- |
| Deferred Tax Liabilities Non-Current | $- | $- | $- | $- | $- |
| Other Non-Current Liabilities | $- | $- | $- | $- | $- |
| Total Non-Current Liabilities | $- | $- | $- | $- | $- |
| Other Liabilities | $- | $- | $- | $- | $- |
| Total Liabilities | $2.20M | $3.84M | $4.27M | $1.41M | $2.18M |
| Preferred Stock | $- | $- | $- | $- | $- |
| Common Stock | $62.46M | $56.71M | $50.64M | $27.60M | $21.25M |
| Retained Earnings | $-56.87M | $-51.05M | $-33.02M | $-19.11M | $-10.01M |
| Accumulated Other Comprehensive Income Loss | $3.72M | $2.68M | $1.97M | $1.23M | $850.69K |
| Other Total Stockholders Equity | $-0 | $475.37K | $0 | $464.48K | $0 |
| Total Stockholders Equity | $9.31M | $8.81M | $20.07M | $10.18M | $12.31M |
| Total Equity | $9.31M | $8.81M | $20.07M | $10.18M | $12.31M |
| Total Liabilities and Stockholders Equity | $11.51M | $12.65M | $24.33M | $11.59M | $14.49M |
| Minority Interest | $- | $- | $- | $- | $- |
| Total Liabilities and Total Equity | $11.51M | $12.65M | $24.33M | $11.59M | $14.49M |
| Total Investments | $1.09M | $- | $815.09K | $792.03K | $- |
| Total Debt | $250.71K | $- | $- | $- | $- |
| Net Debt | $-2.80M | $-397.64K | $-13.23M | $-4.33M | $-8.15M |
Balance Sheet Charts
| Breakdown | September 30, 2024 | June 30, 2024 | March 31, 2024 | December 31, 2023 | September 30, 2023 | June 30, 2023 | March 31, 2023 | December 31, 2022 | September 30, 2022 | June 30, 2022 | March 31, 2022 | December 31, 2021 | September 30, 2021 | June 30, 2021 | March 31, 2021 | December 31, 2020 | September 30, 2020 | June 30, 2020 | March 31, 2020 | December 31, 2019 |
|---|---|---|---|---|---|---|---|---|---|---|---|---|---|---|---|---|---|---|---|---|
| Cash and Cash Equivalents | $4.82M | $490.53K | $1.24M | $4.14M | $403.36K | $1.17M | $878.84K | $397.64K | $1.04M | $1.91M | $7.34M | $13.23M | $17.66M | $22.52M | $12.95M | $4.33M | $2.03M | $371.73K | $1.91M | $8.15M |
| Short Term Investments | $- | $- | $- | $1.09M | $- | $- | $- | $- | $840.42K | $817.01K | $815.96K | $815.09K | $804.44K | $803.79K | $803.14K | $792.03K | $788.58K | $2.12M | $3.27M | $- |
| Cash and Short Term Investments | $4.82M | $490.53K | $1.24M | $4.14M | $403.36K | $1.17M | $878.84K | $397.64K | $1.88M | $2.72M | $8.15M | $14.04M | $18.46M | $23.33M | $13.75M | $5.13M | $2.82M | $2.50M | $5.18M | $8.15M |
| Net Receivables | $108.05K | $- | $123.71K | $- | $- | $- | $320.94K | $- | $- | $3.17M | $- | $- | $1.04M | $837.82K | $493.62K | $- | $- | $- | $- | $- |
| Inventory | $- | $- | $- | $- | $- | $- | $- | $- | $- | $- | $-9.31K | $- | $- | $- | $- | $-483.08K | $-614.64K | $-453.80K | $-506.07K | $-254.20K |
| Other Current Assets | $99.04K | $120.51K | $29.50K | $73.25K | $168.53K | $168.93K | $17.23K | $19.49K | $123.56K | $109.64K | $131.57K | $139.97K | $39.52K | $21.36K | $25.51K | $39.38K | $38.66K | $111.33K | $111.33K | $156.57K |
| Total Current Assets | $5.03M | $611.04K | $1.39M | $4.38M | $757.73K | $1.60M | $1.22M | $5.44M | $5.23M | $6.00M | $12.58M | $18.35M | $19.55M | $24.19M | $14.27M | $5.65M | $3.47M | $3.06M | $5.79M | $8.56M |
| Property Plant Equipment Net | $7.08M | $7.10M | $7.12M | $7.13M | $7.15M | $7.17M | $7.19M | $7.21M | $7.25M | $6.04M | $6.04M | $5.99M | $5.94M | $5.94M | $5.94M | $5.94M | $5.94M | $5.94M | $5.93M | $5.93M |
| Goodwill | $- | $- | $- | $- | $- | $- | $- | $- | $- | $- | $- | $- | $- | $- | $- | $- | $- | $- | $- | $- |
| Intangible Assets | $- | $- | $- | $- | $- | $- | $- | $- | $- | $- | $- | $- | $- | $- | $- | $- | $- | $- | $- | $- |
| Goodwill and Intangible Assets | $- | $- | $- | $- | $- | $- | $- | $- | $- | $- | $- | $- | $- | $- | $- | $- | $- | $- | $- | $- |
| Long Term Investments | $- | $- | $- | $- | $- | $- | $- | $- | $- | $- | $- | $- | $- | $- | $- | $- | $- | $- | $- | $- |
| Tax Assets | $- | $- | $- | $- | $- | $- | $- | $- | $- | $- | $- | $- | $- | $- | $- | $- | $- | $- | $- | $- |
| Other Non-Current Assets | $- | $- | $- | $-1 | $0 | $0 | $-0 | $-0 | $- | $0 | $- | $- | $- | $- | $- | $- | $- | $- | $- | $- |
| Total Non-Current Assets | $7.08M | $7.10M | $7.12M | $7.13M | $7.15M | $7.17M | $7.19M | $7.21M | $7.25M | $6.04M | $6.04M | $5.99M | $5.94M | $5.94M | $5.94M | $5.94M | $5.94M | $5.94M | $5.93M | $5.93M |
| Other Assets | $- | $- | $- | $1 | $0 | $6.95K | $6.96K | $-0 | $-2.65K | $-2.65K | $9.31K | $- | $- | $-5.38K | $- | $- | $- | $- | $10.94K | $- |
| Total Assets | $12.11M | $7.71M | $8.51M | $11.51M | $7.91M | $8.77M | $8.42M | $12.65M | $12.48M | $12.04M | $18.63M | $24.33M | $25.49M | $30.12M | $20.21M | $11.59M | $9.41M | $9.00M | $11.73M | $14.49M |
| Account Payables | $- | $525.01K | $367.44K | $1.53K | $942 | $686 | $1.45K | $3.43K | $4.40K | $1.71K | $2.06M | $1.56M | $879.73K | $868.12K | $723.51K | $1.33M | $741.87K | $881.83K | $1.89M | $1.41M |
| Short Term Debt | $- | $- | $- | $250.71K | $- | $- | $- | $- | $- | $- | $- | $- | $- | $- | $- | $- | $- | $- | $- | $- |
| Tax Payables | $- | $- | $- | $- | $- | $- | $- | $- | $- | $- | $- | $- | $- | $- | $- | $- | $- | $- | $- | $- |
| Deferred Revenue | $- | $- | $- | $-1.53K | $- | $- | $- | $- | $- | $- | $- | $- | $- | $- | $- | $- | $- | $- | $- | $- |
| Other Current Liabilities | $2.15M | $21.49K | $147.95K | $1.95M | $1.60M | $1.34M | $1.63M | $3.84M | $4.81M | $2.60M | $2.47M | $2.71M | $2.63M | $2.89M | $903.09K | $75.15K | $300.18K | $229.84K | $471.30K | $769.24K |
| Total Current Liabilities | $2.15M | $546.50K | $515.39K | $2.20M | $1.60M | $1.34M | $1.63M | $3.84M | $4.81M | $2.60M | $4.53M | $4.27M | $3.51M | $3.76M | $1.63M | $1.41M | $1.04M | $1.11M | $2.36M | $2.18M |
| Long Term Debt | $- | $- | $- | $- | $- | $- | $- | $- | $- | $- | $- | $- | $- | $- | $- | $- | $- | $- | $- | $- |
| Deferred Revenue Non-Current | $- | $- | $- | $- | $- | $- | $- | $- | $- | $- | $- | $- | $- | $- | $- | $- | $- | $- | $- | $- |
| Deferred Tax Liabilities Non-Current | $- | $- | $- | $- | $- | $- | $- | $- | $- | $- | $- | $- | $- | $- | $- | $- | $1.22M | $808.37K | $446.50K | $- |
| Other Non-Current Liabilities | $- | $- | $- | $- | $- | $- | $- | $- | $- | $- | $- | $- | $- | $- | $- | $- | $- | $- | $- | $- |
| Total Non-Current Liabilities | $- | $0 | $- | $- | $- | $- | $- | $- | $- | $- | $- | $- | $- | $- | $-4.57K | $- | $1.22M | $808.37K | $446.50K | $- |
| Other Liabilities | $- | $-0 | $- | $- | $- | $- | $- | $- | $- | $- | $- | $- | $- | $- | $- | $- | $- | $- | $- | $- |
| Total Liabilities | $2.15M | $546.50K | $515.39K | $2.20M | $1.60M | $1.34M | $1.63M | $3.84M | $4.81M | $2.60M | $4.53M | $4.27M | $3.51M | $3.76M | $1.62M | $1.41M | $2.26M | $1.92M | $2.81M | $2.18M |
| Preferred Stock | $- | $- | $- | $0 | $- | $- | $- | $- | $- | $- | $- | $- | $- | $- | $- | $- | $- | $- | $- | $- |
| Common Stock | $66.41M | $62.86M | $62.86M | $62.46M | $58.64M | $58.65M | $56.71M | $56.71M | $51.14M | $51.14M | $51.14M | $50.64M | $50.64M | $50.66M | $39.35M | $27.60M | $24.09M | $21.75M | $21.75M | $21.25M |
| Retained Earnings | $-60.46M | $-59.64M | $-58.66M | $-56.87M | $-55.88M | $-54.69M | $-53.23M | $-51.05M | $-46.43M | $-44.49M | $-39.67M | $-33.02M | $-30.92M | $-26.37M | $-22.66M | $-19.11M | $-18.23M | $-15.82M | $-13.94M | $-10.01M |
| Accumulated Other Comprehensive Income Loss | $- | $- | $3.80M | $3.72M | $3.55M | $2.98M | $2.83M | $2.68M | $2.48M | $2.31M | $2.15M | $1.97M | $1.78M | $1.59M | $1.41M | $1.23M | $1.01M | $939.43K | $895.13K | $850.69K |
| Other Total Stockholders Equity | $4.00M | $3.94M | $- | $-0 | $- | $482.60K | $475.37K | $475.37K | $475.37K | $475.37K | $475.37K | $0 | $0 | $0 | $481.01K | $464.48K | $0 | $-0 | $212.69K | $0 |
| Total Stockholders Equity | $9.96M | $7.16M | $8.00M | $9.31M | $6.31M | $7.43M | $6.78M | $8.81M | $7.67M | $9.43M | $14.10M | $20.07M | $21.98M | $26.36M | $18.59M | $10.18M | $7.15M | $7.08M | $8.92M | $12.31M |
| Total Equity | $9.96M | $7.16M | $8.00M | $9.31M | $6.31M | $7.43M | $6.78M | $8.81M | $7.67M | $9.43M | $14.10M | $20.07M | $21.98M | $26.36M | $18.59M | $10.18M | $7.15M | $7.08M | $8.92M | $12.31M |
| Total Liabilities and Stockholders Equity | $12.11M | $7.71M | $8.51M | $11.51M | $7.91M | $8.77M | $8.42M | $12.65M | $12.48M | $12.04M | $18.63M | $24.33M | $25.49M | $30.12M | $20.21M | $11.59M | $9.41M | $9.00M | $11.73M | $14.49M |
| Minority Interest | $- | $- | $- | $- | $- | $- | $- | $- | $- | $- | $- | $- | $- | $- | $- | $- | $- | $- | $- | $- |
| Total Liabilities and Total Equity | $12.11M | $7.71M | $8.51M | $11.51M | $7.91M | $8.77M | $8.42M | $12.65M | $12.48M | $12.04M | $18.63M | $24.33M | $25.49M | $30.12M | $20.21M | $11.59M | $9.41M | $9.00M | $11.73M | $14.49M |
| Total Investments | $- | $- | $- | $1.09M | $- | $- | $- | $- | $840.42K | $817.01K | $815.96K | $815.09K | $804.44K | $803.79K | $803.14K | $792.03K | $788.58K | $2.12M | $3.27M | $- |
| Total Debt | $- | $- | $- | $250.71K | $- | $- | $- | $- | $- | $- | $- | $- | $- | $- | $- | $- | $- | $- | $- | $- |
| Net Debt | $-4.82M | $-490.53K | $-1.24M | $-3.89M | $-403.36K | $-1.17M | $-878.84K | $-397.64K | $-1.04M | $-1.91M | $-7.34M | $-13.23M | $-17.66M | $-22.52M | $-12.95M | $-4.33M | $-2.03M | $-371.73K | $-1.91M | $-8.15M |
Annual Cash Flow
| Breakdown | December 31, 2023 | December 31, 2022 | December 31, 2021 | December 31, 2020 | December 31, 2019 |
|---|---|---|---|---|---|
| Net Income | $-5.82K | $-18.03M | $-13.91M | $-9.10M | $-4.58M |
| Depreciation and Amortization | $83.39K | $80.59K | $2.30K | $1.15K | $- |
| Deferred Income Tax | $-680.37K | $-2.83M | $-614.06K | $-1.10M | $- |
| Stock Based Compensation | $551.42K | $711.47K | $738.29K | $377.01K | $493.31K |
| Change in Working Capital | $2.90M | $1.14M | $-3.55M | $-192.79K | $976.32K |
| Accounts Receivables | $4.86M | $-322.77K | $-768.13K | $-228.88K | $-189.04K |
| Inventory | $- | $- | $- | $- | $- |
| Accounts Payables | $- | $- | $- | $- | $- |
| Other Working Capital | $-1.96M | $1.46M | $-2.79M | $36.09K | $1.17M |
| Other Non Cash Items | $-5.82M | $-1.33M | $136.50K | $-612.28K | $1.31M |
| Net Cash Provided by Operating Activities | $-2.97M | $-17.43M | $-16.59M | $-9.53M | $-1.80M |
| Investments in Property Plant and Equipment | $- | $-60.00K | $-50.00K | $-11.50K | $- |
| Acquisitions Net | $- | $-815 | $- | $- | $302.19K |
| Purchases of Investments | $- | $-1.25M | $-23.06K | $-780.00K | $- |
| Sales Maturities of Investments | $- | $815.11K | $- | $- | $- |
| Other Investing Activities | $- | $815 | $- | $-780 | $-114.53K |
| Net Cash Used for Investing Activities | $- | $-490.66K | $-73.06K | $-791.50K | $302.19K |
| Debt Repayment | $250.71K | $- | $- | $- | $1.07M |
| Common Stock Issued | $6.76M | $5.75M | $27.67M | $7.07M | $9.49M |
| Common Stock Repurchased | $- | $- | $- | $- | $- |
| Dividends Paid | $- | $- | $- | $- | $- |
| Other Financing Activities | $-303.15K | $-5.75M | $-2.12M | $-565.57K | $-1.04M |
| Net Cash Used Provided by Financing Activities | $6.71M | $5.09M | $25.56M | $6.50M | $9.52M |
| Effect of Forex Changes on Cash | $- | $- | $- | $- | $- |
| Net Change in Cash | $3.74M | $-12.83M | $8.89M | $-3.82M | $8.03M |
| Cash at End of Period | $4.14M | $397.64K | $13.23M | $4.33M | $8.15M |
| Cash at Beginning of Period | $397.64K | $13.23M | $4.33M | $8.15M | $126.74K |
| Operating Cash Flow | $-2.97M | $-17.43M | $-16.59M | $-9.53M | $-1.80M |
| Capital Expenditure | $- | $-60.00K | $-50.00K | $-11.50K | $- |
| Free Cash Flow | $-2.97M | $-17.49M | $-16.64M | $-9.54M | $-1.80M |
Cash Flow Charts
| Breakdown | September 30, 2024 | June 30, 2024 | March 31, 2024 | December 31, 2023 | September 30, 2023 | June 30, 2023 | March 31, 2023 | December 31, 2022 | September 30, 2022 | June 30, 2022 | March 31, 2022 | December 31, 2021 | September 30, 2021 | June 30, 2021 | March 31, 2021 | December 31, 2020 | September 30, 2020 | June 30, 2020 | March 31, 2020 | December 31, 2019 |
|---|---|---|---|---|---|---|---|---|---|---|---|---|---|---|---|---|---|---|---|---|
| Net Income | $-819.60K | $-977.11K | $-1.79M | $-992.49K | $-1.19M | $-1.46M | $-2.17M | $-4.62M | $-1.94M | $-4.82M | $-6.65M | $-2.10M | $-4.56M | $-3.71M | $-3.55M | $-878.96K | $-2.41M | $-1.88M | $-3.93M | $-4.42M |
| Depreciation and Amortization | $20.85K | $20.85K | $20.85K | $20.85K | $20.85K | $20.85K | $20.85K | $35.72K | $35.72K | $4.58K | $4.58K | $575 | $575 | $575 | $575 | $- | $575 | $575 | $- | $- |
| Deferred Income Tax | $-38.07K | $-126.45K | $-273.26K | $-233.16K | $-73.90K | $-222.53K | $-224.68K | $-527.28K | $- | $- | $- | $- | $- | $- | $- | $- | $- | $- | $- | $- |
| Stock Based Compensation | $56.45K | $145 | $81.13K | $163.68K | $86.06K | $155.89K | $145.79K | $200.16K | $328.11K | $336.24K | $183.19K | $187.86K | $193.86K | $172.68K | $183.88K | $222.38K | $65.89K | $44.30K | $44.44K | $412.49K |
| Change in Working Capital | $431.85K | $35.97K | $-1.08M | $705.05K | $335.23K | $-853.42K | $2.71M | $-2.66M | $2.62M | $813.14K | $364.15K | $-2.54M | $-217.86K | $-185.50K | $-611.62K | $722.86K | $-228.13K | $-957.51K | $270.00K | $958.43K |
| Accounts Receivables | $-1.11K | $16.77K | $38.01K | $24.12K | $78.51K | $63.55K | $1.25M | $-698.66K | $-61.48K | $1.14M | $-139.14K | $-207.46K | $-211.32K | $-334.25K | $-15.11K | $131.55K | $-160.84K | $52.27K | $-251.86K | $151.85K |
| Inventory | $- | $- | $- | $- | $- | $- | $- | $- | $- | $- | $- | $- | $- | $- | $- | $- | $- | $- | $- | $- |
| Accounts Payables | $- | $- | $- | $- | $- | $- | $- | $- | $- | $- | $- | $- | $- | $- | $- | $- | $- | $- | $- | $- |
| Other Working Capital | $432.97K | $19.20K | $-1.12M | $680.93K | $256.72K | $-916.96K | $1.47M | $-1.96M | $2.68M | $-325.50K | $503.29K | $-2.33M | $-6.54K | $148.75K | $-596.51K | $-712 | $-67.29K | $- | $45.24K | $-151.57K |
| Other Non Cash Items | $125.00K | $302.45K | $484.81K | $-52.72K | $73.90K | $-222.53K | $-224.68K | $472.72K | $-488.92K | $-1.58M | $266.88K | $75.86K | $-210.89K | $-278.73K | $550.26K | $-1.45M | $72.25K | $120.98K | $648.56K | $1.31M |
| Net Cash Provided by Operating Activities | $-223.52K | $-744.15K | $-2.64M | $-336.89K | $-751.83K | $-2.36M | $481.20K | $-6.57M | $400.81K | $-5.43M | $-5.83M | $-4.37M | $-4.79M | $-4.00M | $-3.42M | $-1.39M | $-2.49M | $-2.67M | $-2.97M | $-1.74M |
| Investments in Property Plant and Equipment | $- | $- | $-10.60K | $- | $- | $- | $- | $-1.28M | $-1.25M | $-60.00K | $-60.00K | $-50.00K | $- | $- | $- | $- | $- | $-11.50K | $- | $- |
| Acquisitions Net | $- | $- | $- | $- | $- | $- | $- | $- | $- | $- | $- | $- | $- | $- | $- | $- | $- | $- | $- | $302.19K |
| Purchases of Investments | $- | $- | $- | $- | $- | $- | $- | $-1.22M | $-23.41K | $-1.05K | $-871 | $-10.65K | $-652 | $-642 | $-11.11K | $8.58K | $1.34M | $1.14M | $-3.27M | $- |
| Sales Maturities of Investments | $- | $- | $- | $- | $- | $- | $- | $815.11K | $- | $- | $- | $- | $- | $- | $- | $- | $- | $- | $- | $- |
| Other Investing Activities | $- | $- | $- | $- | $- | $- | $- | $1.25M | $-23 | $60.00K | $-871 | $-50.00K | $-652 | $-642 | $-11.11K | $8.58K | $1.34M | $-11.50K | $-3.27M | $- |
| Net Cash Used for Investing Activities | $- | $- | $-10.60K | $- | $- | $- | $- | $840.44K | $-1.27M | $-1.05K | $-60.87K | $-60.65K | $-652 | $-642 | $-11.11K | $8.58K | $1.34M | $1.13M | $-3.27M | $302.19K |
| Debt Repayment | $- | $- | $- | $- | $- | $- | $- | $- | $- | $- | $- | $- | $- | $- | $- | $- | $- | $- | $- | $- |
| Common Stock Issued | $4.68M | $-3.28K | $- | $3.96M | $-14.36K | $2.65M | $- | $5.75M | $- | $- | $- | $3.73K | $-75.68K | $14.64M | $13.04M | $3.94M | $- | $- | $- | $9.19M |
| Common Stock Repurchased | $- | $- | $- | $- | $- | $- | $- | $- | $- | $- | $- | $- | $- | $- | $- | $- | $- | $- | $- | $- |
| Dividends Paid | $- | $- | $- | $- | $- | $- | $- | $- | $- | $- | $- | $- | $- | $- | $- | $- | $- | $- | $- | $- |
| Other Financing Activities | $-123.48K | $-3.28K | $-250.71K | $114.19K | $-14.36K | $2.65M | $- | $-660.61K | $- | $- | $- | $3.73K | $-75.68K | $-1.06M | $-987.45K | $-257.86K | $2.81M | $- | $- | $75.41K |
| Net Cash Used Provided by Financing Activities | $4.55M | $-3.28K | $-250.71K | $4.07M | $-14.36K | $2.65M | $- | $5.09M | $- | $- | $- | $3.73K | $-75.68K | $13.58M | $12.05M | $3.69M | $2.81M | $- | $- | $9.27M |
| Effect of Forex Changes on Cash | $- | $- | $- | $- | $- | $- | $- | $- | $- | $- | $- | $- | $- | $- | $- | $- | $- | $- | $- | $- |
| Net Change in Cash | $4.33M | $-747.42K | $-2.90M | $3.74M | $-766.18K | $290.70K | $481.20K | $-640.53K | $-868.37K | $-5.43M | $-5.89M | $-4.43M | $-4.87M | $9.57M | $8.62M | $2.31M | $1.65M | $-1.54M | $-6.24M | $7.70M |
| Cash at End of Period | $4.82M | $490.53K | $1.24M | $4.14M | $403.36K | $1.17M | $878.84K | $397.64K | $1.04M | $1.91M | $7.34M | $13.23M | $17.66M | $22.52M | $12.95M | $4.33M | $2.03M | $371.73K | $1.91M | $8.15M |
| Cash at Beginning of Period | $490.53K | $1.24M | $4.14M | $403.36K | $1.17M | $878.84K | $397.64K | $1.04M | $1.91M | $7.34M | $13.23M | $17.66M | $22.52M | $12.95M | $4.33M | $2.03M | $371.73K | $1.91M | $8.15M | $456.91K |
| Operating Cash Flow | $-223.52K | $-744.15K | $-2.64M | $-336.89K | $-751.83K | $-2.36M | $481.20K | $-6.57M | $400.81K | $-5.43M | $-5.83M | $-4.37M | $-4.79M | $-4.00M | $-3.42M | $-1.39M | $-2.49M | $-2.67M | $-2.97M | $-1.74M |
| Capital Expenditure | $- | $- | $-10.60K | $- | $- | $- | $- | $-1.28M | $-1.25M | $-60.00K | $-60.00K | $-50.00K | $- | $- | $- | $- | $- | $-11.50K | $- | $- |
| Free Cash Flow | $-223.52K | $-744.15K | $-2.65M | $-336.89K | $-751.83K | $-2.36M | $481.20K | $-7.85M | $-844.96K | $-5.49M | $-5.89M | $-4.42M | $-4.79M | $-4.00M | $-3.42M | $-1.39M | $-2.49M | $-2.68M | $-2.97M | $-1.74M |
Doré Copper Mining Dividends
Explore Doré Copper Mining's dividend history, including dividend yield, payout ratio, and historical payments.
Doré Copper Mining News
Read the latest news about Doré Copper Mining, including recent articles, headlines, and updates.

Dore Copper Announces Shareholder Approval of Plan of Arrangement with Cygnus Metals
TORONTO, Dec. 16, 2024 (GLOBE NEWSWIRE) -- Doré Copper Mining Corp. (“Doré Copper”) (TSXV: DCMC; OTCQB: DRCMF; FRA: DCM) is pleased to announce that, at the special meeting (the "Meeting") of shareholders of Doré Copper ("Doré Copper Shareholders") held earlier today, Doré Copper Shareholders overwhelmingly voted in favour of approving the special resolution (the "Arrangement Resolution") authorizing the previously announced plan of arrangement (the "Arrangement") (news release October 15, 2024) whereby Cygnus Metals Limited ("Cygnus"), through its wholly-owned subsidiary, 1505901 B.C. Ltd., will acquire all of the issued and outstanding common shares in the capital of Doré Copper (the "Doré Copper Shares") and, in exchange, Doré Copper Shareholders will receive 1.8297 ordinary shares in the capital of Cygnus (the "Cygnus Shares") for each Doré Copper Share held.

Dore Copper Announces Filing and Mailing of Management Information Circular in Connection with Special Meeting and Encourages Shareholders to Access Meeting Materials Electronically
TORONTO, Nov. 21, 2024 (GLOBE NEWSWIRE) -- Doré Copper Mining Corp. ("Doré Copper") (TSXV: DCMC; OTCQB: DRCMF; FRA: DCM) today announced that it has filed and is in the process of mailing the management information circular (the "Circular") and related materials for the special meeting (the "Meeting") of shareholders of Doré Copper ("Doré Copper Shareholders") to be held December 16, 2024. At the Meeting, Doré Copper Shareholders will be asked to consider and vote on a special resolution (the "Arrangement Resolution") approving a statutory plan of arrangement (the "Plan of Arrangement") pursuant to Section 192 of the Canada Business Corporations Act (the "Arrangement"), subject to the terms and conditions of an arrangement agreement dated October 14, 2024 (the "Arrangement Agreement") entered into among Doré Copper, Cygnus Metals Limited ("Cygnus") and 1505901 B.C. Ltd., a wholly owned subsidiary of Cygnus, all as more particularly described in the Circular.

Doré Copper Provides Update on Arrangement Agreement With Cygnus Metals
Not for distribution to United States news wire services or for dissemination in the United States TORONTO, Nov. 05, 2024 (GLOBE NEWSWIRE) -- Doré Copper Mining Corp. (“Doré Copper”) (TSXV: DCMC; OTCQB: DRCMF; FRA: DCM) is pleased to announce, further to its news release dated October 15, 2024, an update on the definitive arrangement agreement (the “Agreement”) with Cygnus Metals Limited (ASX: CY5) (“Cygnus”) pursuant to which Cygnus has agreed to acquire 100% of the issued and outstanding common shares of Doré Copper (the “Doré Copper Shares”) by way of a court approved plan of arrangement under the Canada Business Corporation Act (the “Transaction”). A key obligation in the Agreement has been met with Cygnus having successfully raised a minimum of A$5.0 million as part of a first tranche (see ASX Announcement dated October 17, 2024).


Dore Copper Mining Corporation to Present at the Battery and Precious Metals Virtual Investor Conference October 1st
Company invites individual and institutional investors, as well as advisors and analysts, to attend online at VirtualInvestorConferences.com Company invites individual and institutional investors, as well as advisors and analysts, to attend online at VirtualInvestorConferences.com

Doré Copper Announces Closing of $4.676 Million Non-Brokered Private Placement of Common Shares and Flow-Through Shares
Not for distribution to United States news wire services or for dissemination in the United States TORONTO, Sept. 26, 2024 (GLOBE NEWSWIRE) -- Doré Copper Mining Corp. (the "Corporation" or "Doré Copper") (TSXV:DCMC; OTCQB:DRCMF; FRA:DCM) is pleased to announce that it has closed its previously announced non-brokered private placement offering, pursuant to which the Corporation sold an aggregate of: (i) 20,960,955 common shares in the capital of the Corporation (the "Common Shares") at a price of $0.105 per Common Share for gross proceeds of approximately $2,200,900; (ii) 1,400,000 common shares in the capital of the Corporation that will qualify as "flow-through shares" within the meaning of subsection 66(15) of the Income Tax Act (Canada) and section 359.1 of the Taxation Act (Québec) (the "Traditional Flow-Through Shares") at a price of $0.125 per Traditional Flow-Through Share for gross proceeds of $175,000; and (iii) 11,500,000 common shares in the capital of the Corporation that will qualify as "flow-through shares" within the meaning of subsection 66(15) of the Income Tax Act (Canada) and section 359.1 of the Taxation Act (Québec) (the "Charitable Flow-Through Shares" and together with the Traditional Flow-Through Shares, the "Flow-Through Shares") at a price of $0.20 per Charitable Flow-Through Share for gross proceeds of $2,300,000, for aggregate gross proceeds to the Corporation of approximately $4,675,900 (collectively, the "Offering").


Dore Copper Confirms Copper Mineralization on its Cedar Bay Southwest Extension
TORONTO, July 24, 2024 (GLOBE NEWSWIRE) -- Doré Copper Mining Corp. (the "Company" or "Doré Copper") (TSXV: DCMC; OTCQB: DRCMF; FRA: DCM) completed two drill holes totaling 1,392 meters which successfully extended the Southwest Zone of the former Cedar Bay copper-gold mine located in the Chibougamau mining camp, approximately 5 kilometers by road from its Copper Rand mill.

Dore Copper Enters Into an Agreement to Acquire Claims Next to Its Flagship Corner Bay High-Grade Copper Deposit
TORONTO, July 03, 2024 (GLOBE NEWSWIRE) -- Doré Copper Mining Corp. (the "Company" or "Doré Copper") (TSXV: DCMC; OTCQB: DRCMF; FRA: DCM) is pleased to announce it has entered into an agreement with SOQUEM to acquire a 56.41% interest in a group of contiguous claims (the “Claim Group”) located immediately north and east of its flagship high-grade Corner Bay copper project in the Chibougamau mining camp, approximately 55 kilometers by road from Chibougamau, Québec.

Dore Copper Announces 2024 Annual and Special Meeting Results
TORONTO, June 20, 2024 (GLOBE NEWSWIRE) -- Doré Copper Mining Corp. (the "Company" or "Doré Copper") (TSXV: DCMC; OTCQB: DRCMF; FRA: DCM) reports that all matters submitted to the shareholders for approval as set out in the Corporation's Notice of Meeting and Information Circular, which were mailed to shareholders in connection with the meeting, were approved at the Corporation's Annual and Special Meeting held in Thunder Bay, Ontario, on June 20, 2024.

Doré Copper Announces Grant of Stock Options and Deferred Share Units
TORONTO, April 19, 2024 (GLOBE NEWSWIRE) -- Doré Copper Mining Corp. (the "Corporation" or "Doré Copper") (TSXV: DCMC; OTCQX: DRCMF; FRA: DCM) has granted 4,215,000 stock options to management, consultants and advisors. The stock options have an exercise price of $0.10 per share and a term of five years. The Company has also granted an aggregate total of 400,000 deferred share units (“DSU's”) to the independent directors of the Company. The DSUs are payable in common shares of the Company upon the holder ceasing to be a director of the Company. Both issuances were granted in accordance with the Company's omnibus share incentive plan.

Dore Copper Identifies Gold Exploration Potential at Norhart Zone, Just North of the Former Joe Mann Mine
TORONTO, March 27, 2024 (GLOBE NEWSWIRE) -- Doré Copper Mining Corp. (the "Company" or "Doré Copper") (TSXV: DCMC; OTCQX: DRCMF; FRA: DCM) reports that it has completed its first review of the Norhart mineralized zone, one of the priority gold targets identified on the recently acquired 65% interest in claims surrounding the Company's 100% owned Joe Mann property. SOQUEM holds the remaining 35% interest in the joint venture (the “Joe Mann SOQUEM JV Property”) (refer to news release dated January 22, 2024).

Doré Copper Announces Management Changes
TORONTO, Feb. 26, 2024 (GLOBE NEWSWIRE) -- Doré Copper Mining Corp. (the "Company" or "Doré Copper") (TSXV: DCMC; OTCQX: DRCMF; FRA: DCM) announces the resignation of Vice-President, Exploration Sylvain Lépine, effective March 1, 2024. Mr. Lépine has been appointed General Manager of Nord du Québec Investissement Minier (NQIM), a new regional institutional fund sponsored by SDBJ (Société de développement de la Baie-James) and ARBJ (Administration régionale Baie-James) that will mainly invest in mining exploration companies in the administrative region of Nord-du-Québec. Mr. Lépine will remain a Technical Advisor to the Company to ensure a smooth transition during the search for a new Vice President Exploration.

Doré Copper Increases Size of its Joe Mann Property by Acquiring a 65% Interest in 3,030 Hectares
TORONTO, Jan. 22, 2024 (GLOBE NEWSWIRE) -- Doré Copper Mining Corp. (the "Company" or "Doré Copper") (TSXV: DCMC; OTCQX: DRCMF; FRA: DCM) is pleased to announce that it has exercised its right to acquire a 65% interest in certain claims subject to a joint venture with SOQUEM (the "SOQUEM JV Property"), which surround and are adjacent to the Company's 100% owned Joe Mann Property, pursuant to an earn-in option agreement (the "Option Agreement") dated January 2, 2020, as amended October 28, 2022, between the Company and Ressources Jessie Inc. ("Ressources Jessie"). SOQUEM holds the remaining 35% interest in the SOQUEM JV Property.


Doré Copper Reports Excellent Concentrate Grades and Recoveries With Low Impurity Element Concentrations From Flotation Tests at Its Corner Bay Project
TORONTO, Oct. 30, 2023 (GLOBE NEWSWIRE) -- Doré Copper Mining Corp. (the "Company" or "Doré Copper") (TSXV: DCMC; OTCQX: DRCMF; FRA: DCM) is pleased to announce positive flotation test results at its flagship Corner Bay high-grade copper-gold project located approximately 55 kilometers by road from the Corporation's Copper Rand mill, near Chibougamau, Québec. This metallurgical test program is part of the work that is designed to support completion of a feasibility study for the implementation of a hub-and spoke operation model.

Doré Copper Reports Exploration Drill Results – Intersects Shallow Mineralization Grading 4.4 g/t Au Over 9.8 Metres at Gwillim
TORONTO, Oct. 17, 2023 (GLOBE NEWSWIRE) -- Doré Copper Mining Corp. (the "Corporation" or "Doré Copper") (TSXV: DCMC; OTCQX: DRCMF; FRA: DCM) announces results from its drilling campaign of 1,557 meters completed in July 2023 at the Gwillim and Jaculet projects, both located near Chibougamau, Québec.


THE Mining Investment Event of the North - Quebec City, June 2023 Announces THE Global Private Streaming Platform
Special Sponsor: Government of Québec Premier Sponsor: Laurentian Bank Securities Critical Metals Day Platinum Sponsor: National Bank Financial Markets Gold Sponsors: BMO, IBK Capital, O3 Mining, Troilus Gold, Maple Gold Mines, JDS Group of Companies Silver Sponsors: PearTree Financial, Stifel GMP, TMX Group, Invest Yukon, Mi3 Financial ESG Sponsor: Socialsuite Copper Sponsors: Cassels, Crux Investor, CDPQ, Amex Exploration, Out of the Box Capital, Amvest Capital, INFOR Financial, Global Business Reports, Generation IACP, Brooks & Nelson, Alliance Advisors, VRIFY Technology Partners: BTV, Kitco, Mining Network, The Northern Miner, Newsfile, Resource World, LFG EquitiesSimply Better Marketing, Quebec City Business Destination, EBL Consultants, The Prospector Toronto, Ontario--(Newsfile Corp. - June 6, 2023) - THE Mining Investment Event of the North ("THE Event"), Québec City, June 19-21, 2023 is pleased to announce the launch of THE Global Private Streaming Platform dedicated to virtual attendance – limited availability through registration only. Once you have registered you will be able to log on daily with your unique code to THE Event as a virtual global audience member and view live presentations from C-suite members of participating companies, and the world's foremost thought leaders, panelists and keynotes delivered at THE Event from 8:00 am ET to 5:00 pm ET, Monday June 19-Wednesday June 21, 2023.

Doré Copper Mining welcomes last remaining hole results from this year's infill drilling at Corner Bay project
Doré Copper Mining Corp. (TSX-V:DCMC, OTCQX:DRCMF) has unveiled assays for the last remaining 12 holes from its 2022 drilling program at the flagship Corner Bay project in Quebec, which continue to show the asset's potential. "We have completed nearly 40,000 meters of drilling at Corner Bay in 2022, mostly infill drilling required for the feasibility study," noted Ernest Mast, the CEO of Doré Copper, in a statement.

Doré Copper Mining amends agreement to buy Joe Mann mine from Ressources Jessie
Doré Copper Mining Corp. (TSX-V:DCMC, OTCQX:DRCMF) said it has agreed to amend the earn-in option agreement between itself and Ressources Jessie Inc to acquire the Joe Mann property in Quebec. According to the terms of the amending agreement, Doré Copper said it has agreed to accelerate the final scheduled cash and share payments under the option agreement.
Doré Copper Mining closes private placement to juice its gold-copper exploration in Quebec
Doré Copper Mining Corp. (TSX-V:DCMC, OTCQX:DRCMF) has closed a previously announced private placement for gross proceeds of more than $5.7 million. The Toronto-based company sold 7.6 million common shares at a price of $0.30 each, for proceeds of $2.3 million, along with 9.5 million flow-through shares at a price of $0.36 each, for proceeds of $3.4 million.

Doré Copper Mining reveals drilling plans for Joe Mann gold mine and Doré Ramp gold-copper deposit in Quebec
Doré Copper Mining Corp has announced plans to begin drilling at Joe Mann gold mine and at the Doré Ramp gold-copper deposit in the fourth quarter. At the Joe Man project in Quebec, the company said its drilling plan for the Fall is to extend the plunge of a mineralized shoot in the Main Zone at depths between 1,100 and 1,300 metres (m).
Doré Copper Mining announces second set of results from its 2022 drilling program at its flagship Corner Bay property
Doré Copper Mining Corp. (TSX-V:DCMC, OTCQX:DRCMF) has announced the second set of results from its 2022 drilling program of 45,000 meters at its flagship Corner Bay property, located in the Chibougamau mining camp, approximately 40 kilometers by road from Chibougamau, Quebec. As of August 10, 2022, Doré Copper said it has completed 37 holes totaling 36,135 meters and was reporting the assay results from 14 holes.
Doré Copper Mining reports results from 2022 infill drilling program at its Corner Bay copper-gold project in Quebec
Doré Copper Mining Corp. (TSX-V:DCMC, OTCQX:DRCMF) said it has received the first results from its 45,000-metre (m) drilling program at its flagship Corner Bay copper-gold deposit in Quebec, as the company works toward updating the site's Inferred Mineral Resource to the Indicated category. The company said as of July 4, it has completed 32 drill holes totalling 33,900m and it is reporting the results from 13 holes.

Doré Copper Mining announces 2022 drilling program at flagship Corner Bay and Devlin projects
Doré Copper Mining Corp. (TSX-V:DCMC, OTCQX:DRCMF) announced the approval of a fully funded 50,000 meter (m) drilling program at the Corner Bay and Devlin projects that will mainly focus on resource category conversion and test a number of exploration targets on the property. The projects are located in the Chibougamau mining camp, less than 55 kilometers (km) by road from the company's Copper Rand mill, near Chibougamau, Québec.
Doré Copper is quickly advancing some choice brownfield projects in a key Quebec mining jurisdiction
Doré Copper Mining Corp, which listed on the TSX Venture Exchange in December 2019, is quickly establishing itself as a copper-gold explorer and developer in the Chibougamau area of Québec, Canada. The company has consolidated a large land package in the prolific Lac Dore/Chibougamau and Joe Mann mining camps that has produced 1.6 billion pounds of copper and 4.4 million ounces of gold.
Doré Copper Announces Significant Mineral Resource Increase for Corner Bay – Preliminary Economic Assessment Underway
TORONTO, Oct. 06, 2021 (GLOBE NEWSWIRE) -- Doré Copper Mining Corp. (the "Corporation" or "Doré Copper") (TSXV: DCMC; OTCQX: DRCMF; FRA: DCM) is pleased to announce an updated and significantly expanded Mineral Resource Estimate (“MRE”) for its flagship Corner Bay high-grade copper-gold project located approximately 55 kilometers by road from the Corporation's Copper Rand mill, near Chibougamau, Québec.

Similar Companies
Related Metrics
Explore detailed financial metrics and analysis for DRCMF.