Enterprise Products Partners L.P Key Executives
This section highlights Enterprise Products Partners L.P's key executives, including their titles and compensation details.
Find Contacts at Enterprise Products Partners L.P
(Showing 0 of )
Enterprise Products Partners L.P Earnings
This section highlights Enterprise Products Partners L.P's earnings, including key dates, EPS, earnings reports, and earnings call transcripts.
Next Earnings Date
Last Earnings Results
Earnings Call Transcripts
| Transcript | Quarter | Year | Date | Estimated EPS | Actual EPS |
|---|---|---|---|---|---|
| Read Transcript | Q4 | 2024 | 2025-02-04 | $0.70 | $0.74 |
| Read Transcript | Q3 | 2024 | 2024-10-29 | $0.66 | $0.65 |
| Read Transcript | Q2 | 2024 | 2024-07-30 | $0.66 | $0.64 |
| Read Transcript | Q1 | 2024 | 2024-04-30 | $0.67 | $0.66 |
| Read Transcript | Q4 | 2023 | 2024-02-01 | $0.68 | $0.72 |
| Read Transcript | Q3 | 2023 | 2023-10-31 | $0.63 | $0.60 |
| Read Transcript | Q2 | 2023 | 2023-08-01 | $0.58 | $0.57 |
| Read Transcript | Q1 | 2023 | 2023-05-02 | $0.62 | $0.63 |

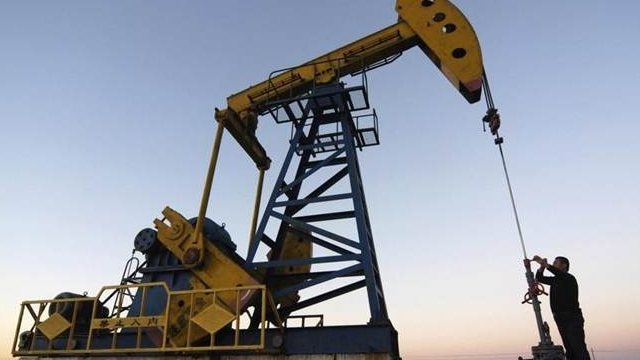
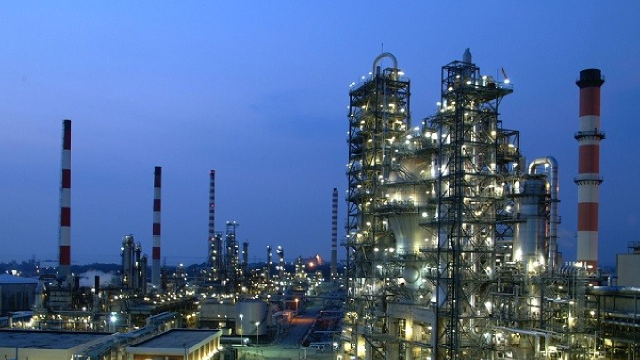
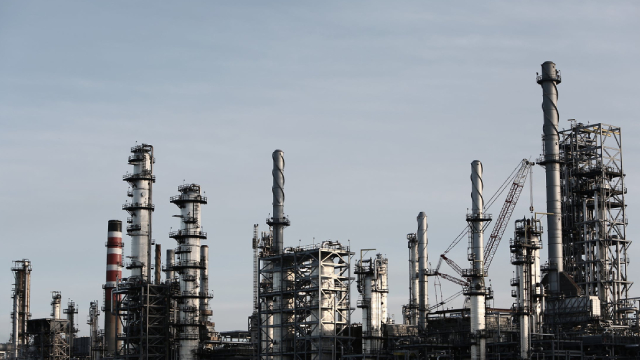
Enterprise Products Partners L.P. provides midstream energy services to producers and consumers of natural gas, natural gas liquids (NGLs), crude oil, petrochemicals, and refined products. The company operates through four segments: NGL Pipelines & Services, Crude Oil Pipelines & Services, Natural Gas Pipelines & Services, and Petrochemical & Refined Products Services. The NGL Pipelines & Services segment offers natural gas processing and related NGL marketing services. It operates 19 natural gas processing facilities located in Colorado, Louisiana, Mississippi, New Mexico, Texas, and Wyoming; NGL pipelines; NGL fractionation facilities; NGL and related product storage facilities; and NGL marine terminals. The Crude Oil Pipelines & Services segment operates crude oil pipelines; and crude oil storage and marine terminals, which include a fleet of 255 tractor-trailer tank trucks that are used to transport crude oil. It also engages in crude oil marketing activities. The Natural Gas Pipelines & Services segment operates natural gas pipeline systems to gather, treat, and transport natural gas. It leases underground salt dome natural gas storage facilities in Napoleonville, Louisiana; owns an underground salt dome storage cavern in Wharton County, Texas; and markets natural gas. The Petrochemical & Refined Products Services segment operates propylene fractionation and related marketing activities; butane isomerization complex and related deisobutanizer operations; and octane enhancement and high purity isobutylene production facilities. It also operates refined products pipelines and terminals; and ethylene export terminals, as well as provides refined products marketing and marine transportation services. The company was founded in 1968 and is headquartered in Houston, Texas.
$31.25
Stock Price
$67.67B
Market Cap
7.80K
Employees
Houston, TX
Location
Financial Statements
Access annual & quarterly financial statements for Enterprise Products Partners L.P, including income statements, balance sheets, and cash flow statements..
Annual Income Statement
| Breakdown | December 31, 2024 | December 31, 2023 | December 31, 2022 | December 31, 2021 | December 31, 2020 |
|---|---|---|---|---|---|
| Revenue | $56.22B | $49.72B | $58.19B | $40.81B | $27.20B |
| Cost of Revenue | $49.05B | $43.02B | $51.50B | $35.08B | $22.37B |
| Gross Profit | $7.17B | $6.70B | $6.68B | $5.73B | $4.83B |
| Gross Profit Ratio | 12.76% | 13.47% | 11.49% | 14.04% | 17.75% |
| Research and Development Expenses | $- | $- | $- | $- | $- |
| General and Administrative Expenses | $244.00M | $231.00M | $241.00M | $209.30M | $219.60M |
| Selling and Marketing Expenses | $- | $- | $- | $- | $- |
| Selling General and Administrative Expenses | $244.00M | $231.00M | $241.00M | $209.30M | $219.60M |
| Other Expenses | $- | $-444.00M | $34.00M | $4.60M | $13.70M |
| Operating Expenses | $244.00M | $-213.00M | $241.00M | $209.30M | $219.60M |
| Cost and Expenses | $48.88B | $42.79B | $51.74B | $35.29B | $22.59B |
| Interest Income | $47.00M | $27.00M | $11.00M | $4.70M | $13.40M |
| Interest Expense | $1.35B | $1.27B | $1.24B | $1.28B | $1.29B |
| Depreciation and Amortization | $2.19B | $2.14B | $2.03B | $1.92B | $2.11B |
| EBITDA | $9.59B | $9.05B | $8.96B | $7.99B | $7.12B |
| EBITDA Ratio | 17.05% | 18.20% | 15.39% | 19.57% | 26.18% |
| Operating Income | $7.34B | $6.93B | $4.97B | $4.23B | $2.98B |
| Operating Income Ratio | 13.05% | 13.94% | 8.54% | 10.38% | 10.94% |
| Total Other Income Expenses Net | $-1.30B | $-1.23B | $-1.21B | $-1.28B | $-1.27B |
| Income Before Tax | $6.04B | $5.70B | $5.70B | $4.83B | $3.76B |
| Income Before Tax Ratio | 10.73% | 11.47% | 9.79% | 11.82% | 13.83% |
| Income Tax Expense | $65.00M | $44.00M | $82.00M | $70.00M | $-124.30M |
| Net Income | $5.90B | $5.53B | $5.49B | $4.64B | $3.78B |
| Net Income Ratio | 10.50% | 11.13% | 9.44% | 11.37% | 13.88% |
| EPS | $2.69 | $2.53 | $2.53 | $2.11 | $1.71 |
| EPS Diluted | $2.66 | $2.50 | $2.50 | $2.10 | $1.71 |
| Weighted Average Shares Outstanding | 2.17B | 2.17B | 2.18B | 2.18B | 2.19B |
| Weighted Average Shares Outstanding Diluted | 2.19B | 2.19B | 2.20B | 2.20B | 2.20B |
| SEC Filing | Source | Source | Source | Source | Source |
| Breakdown | December 31, 2024 | September 30, 2024 | June 30, 2024 | March 31, 2024 | December 31, 2023 | September 30, 2023 | June 30, 2023 | March 31, 2023 | December 31, 2022 | September 30, 2022 | June 30, 2022 | March 31, 2022 | December 31, 2021 | September 30, 2021 | June 30, 2021 | March 31, 2021 | December 31, 2020 | September 30, 2020 | June 30, 2020 | March 31, 2020 |
|---|---|---|---|---|---|---|---|---|---|---|---|---|---|---|---|---|---|---|---|---|
| Revenue | $14.20B | $13.78B | $13.39B | $14.72B | $14.62B | $12.00B | $10.65B | $12.44B | $13.65B | $15.47B | $16.06B | $13.01B | $11.37B | $10.83B | $9.45B | $9.16B | $7.04B | $6.92B | $5.75B | $7.48B |
| Cost of Revenue | $12.28B | $12.03B | $11.74B | $12.94B | $12.76B | $10.37B | $9.14B | $10.76B | $11.95B | $13.81B | $14.34B | $11.40B | $10.05B | $9.41B | $8.07B | $7.55B | $6.37B | $5.57B | $4.37B | $6.06B |
| Gross Profit | $1.93B | $1.74B | $1.66B | $1.79B | $1.86B | $1.63B | $1.51B | $1.69B | $1.70B | $1.66B | $1.72B | $1.61B | $1.32B | $1.42B | $1.38B | $1.60B | $675.00M | $1.35B | $1.38B | $1.42B |
| Gross Profit Ratio | 13.56% | 12.65% | 12.36% | 12.14% | 12.75% | 13.60% | 14.21% | 13.56% | 12.44% | 10.71% | 10.70% | 12.38% | 11.62% | 13.14% | 14.64% | 17.50% | 9.58% | 19.51% | 24.01% | 19.01% |
| Research and Development Expenses | $- | $- | $- | $- | $- | $- | $- | $- | $- | $- | $- | $- | $- | $- | $- | $- | $- | $- | $- | $- |
| General and Administrative Expenses | $60.00M | $61.00M | $57.00M | $66.00M | $59.00M | $59.00M | $56.00M | $57.00M | $62.00M | $55.00M | $62.00M | $62.00M | $54.20M | $47.30M | $51.50M | $56.30M | $56.80M | $50.30M | $57.00M | $55.50M |
| Selling and Marketing Expenses | $- | $- | $- | $- | $- | $- | $- | $- | $- | $- | $- | $- | $- | $- | $- | $- | $- | $- | $- | $- |
| Selling General and Administrative Expenses | $60.00M | $61.00M | $57.00M | $66.00M | $59.00M | $59.00M | $56.00M | $57.00M | $62.00M | $55.00M | $62.00M | $62.00M | $54.20M | $47.30M | $51.50M | $56.30M | $56.80M | $50.30M | $57.00M | $55.50M |
| Other Expenses | $-106.00M | $- | $-97.00M | $- | $-36.00M | $5.00M | $19.00M | $-104.00M | $22.00M | $7.00M | $2.00M | $3.00M | $2.00M | $1.00M | $700.00K | $900.00K | $1.20M | $2.90M | $3.80M | $5.80M |
| Operating Expenses | $-47.00M | $61.00M | $57.00M | $66.00M | $59.00M | $59.00M | $56.00M | $-47.00M | $62.00M | $55.00M | $62.00M | $62.00M | $54.20M | $47.30M | $51.50M | $56.30M | $56.80M | $50.30M | $57.00M | $55.50M |
| Cost and Expenses | $12.23B | $11.99B | $11.79B | $13.00B | $12.82B | $10.43B | $9.19B | $10.71B | $12.01B | $13.87B | $14.40B | $11.46B | $10.10B | $9.46B | $8.12B | $7.61B | $6.43B | $5.62B | $4.43B | $6.12B |
| Interest Income | $17.00M | $14.00M | $5.00M | $13.00M | $7.00M | $5.00M | $8.00M | $12.00M | $5.00M | $3.00M | $2.00M | $1.00M | $2.00M | $900.00K | $700.00K | $1.10M | $1.10M | $2.20M | $2.90M | $7.20M |
| Interest Expense | $347.00M | $343.00M | $333.00M | $333.00M | $325.00M | $328.00M | $302.00M | $314.00M | $307.00M | $309.00M | $309.00M | $319.00M | $328.20M | $315.90M | $316.10M | $322.80M | $329.20M | $320.50M | $320.20M | $317.50M |
| Depreciation and Amortization | $628.00M | $631.00M | $622.00M | $626.00M | $548.00M | $602.00M | $579.00M | $500.00M | $522.00M | $574.00M | $580.00M | $564.00M | $491.20M | $537.20M | $535.30M | $461.50M | $526.80M | $513.40M | $522.70M | $509.00M |
| EBITDA | $2.49B | $2.41B | $2.39B | $2.46B | $2.48B | $2.30B | $2.18B | $2.25B | $2.31B | $2.29B | $2.34B | $2.23B | $1.89B | $2.04B | $1.49B | $2.16B | $1.94B | $1.89B | $1.86B | $1.88B |
| EBITDA Ratio | 17.55% | 17.51% | 17.86% | 16.73% | 16.93% | 19.20% | 20.47% | 18.05% | 16.89% | 14.82% | 14.57% | 17.10% | 16.60% | 18.84% | 15.80% | 23.57% | 27.55% | 27.32% | 32.31% | 25.09% |
| Operating Income | $1.97B | $1.78B | $1.60B | $1.72B | $1.81B | $1.70B | $1.58B | $1.73B | $1.28B | $1.22B | $1.76B | $1.19B | $1.40B | $1.51B | $1.49B | $1.69B | $708.20M | $1.38B | $1.44B | $1.51B |
| Operating Income Ratio | 13.88% | 12.92% | 11.93% | 11.69% | 12.35% | 14.13% | 14.82% | 13.93% | 9.38% | 7.89% | 10.98% | 9.13% | 12.34% | 13.97% | 15.79% | 18.51% | 10.05% | 19.97% | 24.99% | 20.15% |
| Total Other Income Expenses Net | $-325.00M | $-329.00M | $-328.00M | $-318.00M | $-320.00M | $-323.00M | $-283.00M | $-302.00M | $-285.00M | $-302.00M | $-307.00M | $-316.00M | $-326.20M | $-314.80M | $-314.80M | $-322.40M | $-328.00M | $-317.60M | $-316.40M | $-311.70M |
| Income Before Tax | $1.65B | $1.45B | $1.44B | $1.50B | $1.60B | $1.37B | $1.30B | $1.43B | $1.48B | $1.41B | $1.46B | $1.35B | $1.08B | $1.20B | $1.18B | $1.37B | $380.20M | $1.06B | $1.12B | $1.20B |
| Income Before Tax Ratio | 11.59% | 10.53% | 10.73% | 10.22% | 10.95% | 11.44% | 12.17% | 11.51% | 10.84% | 9.12% | 9.07% | 10.38% | 9.47% | 11.06% | 12.46% | 14.99% | 5.40% | 15.38% | 19.48% | 15.98% |
| Income Tax Expense | $10.00M | $19.00M | $15.00M | $21.00M | $-1.00M | $22.00M | $13.00M | $10.00M | $28.00M | $18.00M | $17.00M | $19.00M | $12.70M | $16.10M | $31.20M | $10.00M | $14.30M | $-19.10M | $59.70M | $-179.20M |
| Net Income | $1.62B | $1.42B | $1.41B | $1.46B | $1.57B | $1.32B | $1.25B | $1.39B | $1.42B | $1.36B | $1.41B | $1.30B | $1.03B | $1.15B | $1.11B | $1.34B | $338.20M | $1.05B | $1.03B | $1.35B |
| Net Income Ratio | 11.43% | 10.29% | 10.50% | 9.90% | 10.72% | 10.99% | 11.77% | 11.18% | 10.40% | 8.80% | 8.79% | 9.97% | 9.05% | 10.65% | 11.78% | 14.65% | 4.80% | 15.21% | 17.99% | 18.04% |
| EPS | $0.75 | $0.65 | $0.64 | $0.66 | $0.72 | $0.61 | $0.58 | $0.64 | $0.65 | $0.63 | $0.64 | $0.59 | $0.47 | $0.52 | $0.50 | $0.61 | $0.15 | $0.48 | $0.47 | $0.61 |
| EPS Diluted | $0.74 | $0.65 | $0.64 | $0.66 | $0.72 | $0.60 | $0.57 | $0.63 | $0.65 | $0.62 | $0.64 | $0.59 | $0.47 | $0.52 | $0.50 | $0.61 | $0.15 | $0.48 | $0.47 | $0.61 |
| Weighted Average Shares Outstanding | 2.17B | 2.19B | 2.17B | 2.17B | 2.17B | 2.17B | 2.17B | 2.17B | 2.17B | 2.18B | 2.18B | 2.18B | 2.18B | 2.18B | 2.19B | 2.18B | 2.18B | 2.19B | 2.19B | 2.19B |
| Weighted Average Shares Outstanding Diluted | 2.19B | 2.19B | 2.19B | 2.19B | 2.19B | 2.19B | 2.20B | 2.19B | 2.19B | 2.20B | 2.20B | 2.20B | 2.20B | 2.20B | 2.21B | 2.20B | 2.20B | 2.20B | 2.20B | 2.20B |
| SEC Filing | Source | Source | Source | Source | Source | Source | Source | Source | Source | Source | Source | Source | Source | Source | Source | Source | Source | Source | Source | Source |
Annual Balance Sheet
| Breakdown | December 31, 2024 | December 31, 2023 | December 31, 2022 | December 31, 2021 | December 31, 2020 |
|---|---|---|---|---|---|
| Cash and Cash Equivalents | $583.00M | $180.00M | $76.00M | $2.82B | $1.06B |
| Short Term Investments | $- | $- | $469.00M | $236.50M | $228.60M |
| Cash and Short Term Investments | $583.00M | $180.00M | $76.00M | $2.82B | $1.06B |
| Net Receivables | $9.24B | $7.78B | $6.96B | $7.00B | $4.83B |
| Inventory | $3.96B | $3.35B | $2.55B | $2.68B | $3.30B |
| Other Current Assets | $1.35B | $933.00M | $1.00B | $781.40M | $737.80M |
| Total Current Assets | $15.13B | $12.25B | $10.60B | $13.27B | $9.91B |
| Property Plant Equipment Net | $49.06B | $45.80B | $44.40B | $42.09B | $41.91B |
| Goodwill | $5.71B | $5.61B | $5.61B | $5.45B | $5.45B |
| Intangible Assets | $4.00B | $3.77B | $3.96B | $3.15B | $3.31B |
| Goodwill and Intangible Assets | $9.72B | $9.38B | $9.57B | $8.60B | $8.76B |
| Long Term Investments | $2.26B | $2.33B | $2.35B | $2.43B | $2.43B |
| Tax Assets | $- | $- | $4.00M | $2.90M | $2.40M |
| Other Non-Current Assets | $997.00M | $1.22B | $1.18B | $1.14B | $1.09B |
| Total Non-Current Assets | $62.03B | $58.73B | $57.51B | $54.26B | $54.20B |
| Other Assets | $- | $- | $- | $- | $- |
| Total Assets | $77.17B | $70.98B | $68.11B | $67.53B | $64.11B |
| Account Payables | $1.23B | $1.20B | $743.00M | $632.00M | $704.60M |
| Short Term Debt | $1.15B | $1.30B | $1.74B | $1.40B | $1.32B |
| Tax Payables | $- | $- | $- | $- | $- |
| Deferred Revenue | $- | $- | $181.00M | $8.55B | $5.85B |
| Other Current Liabilities | $12.80B | $10.64B | $9.78B | $9.59B | $6.96B |
| Total Current Liabilities | $15.18B | $13.13B | $12.27B | $11.62B | $8.99B |
| Long Term Debt | $31.11B | $27.77B | $26.89B | $28.52B | $28.86B |
| Deferred Revenue Non-Current | $284.00M | $326.00M | $320.00M | $249.50M | $49.30M |
| Deferred Tax Liabilities Non-Current | $656.00M | $611.00M | $600.00M | $518.00M | $464.70M |
| Other Non-Current Liabilities | $300.00M | $384.00M | $329.00M | $171.70M | $216.90M |
| Total Non-Current Liabilities | $32.35B | $29.09B | $28.14B | $29.46B | $29.74B |
| Other Liabilities | $50.00M | $- | $- | $- | $- |
| Total Liabilities | $47.58B | $42.22B | $40.41B | $41.09B | $38.73B |
| Preferred Stock | $- | $- | $49.00M | $49.00M | $49.30M |
| Common Stock | $- | $28.66B | $27.55B | $26.34B | $25.77B |
| Retained Earnings | $- | $- | $-27.60B | $-26.10B | $-25.98B |
| Accumulated Other Comprehensive Income Loss | $236.00M | $307.00M | $365.00M | $285.90M | $-165.20M |
| Other Total Stockholders Equity | $28.50B | $-1.30B | $-1.30B | $25.04B | $-1.30B |
| Total Stockholders Equity | $28.73B | $27.67B | $26.62B | $285.90M | $-165.20M |
| Total Equity | $29.59B | $28.76B | $27.70B | $1.40B | $908.10M |
| Total Liabilities and Stockholders Equity | $47.58B | $42.22B | $68.11B | $42.20B | $39.80B |
| Minority Interest | $857.00M | $1.09B | $1.08B | $1.11B | $1.07B |
| Total Liabilities and Total Equity | $47.58B | $42.22B | $68.11B | $42.20B | $39.80B |
| Total Investments | $2.26B | $2.33B | $2.35B | $2.43B | $2.43B |
| Total Debt | $32.26B | $29.07B | $28.64B | $29.87B | $29.87B |
| Net Debt | $31.68B | $28.89B | $28.56B | $27.05B | $28.81B |
Balance Sheet Charts
| Breakdown | December 31, 2024 | September 30, 2024 | June 30, 2024 | March 31, 2024 | December 31, 2023 | September 30, 2023 | June 30, 2023 | March 31, 2023 | December 31, 2022 | September 30, 2022 | June 30, 2022 | March 31, 2022 | December 31, 2021 | September 30, 2021 | June 30, 2021 | March 31, 2021 | December 31, 2020 | September 30, 2020 | June 30, 2020 | March 31, 2020 |
|---|---|---|---|---|---|---|---|---|---|---|---|---|---|---|---|---|---|---|---|---|
| Cash and Cash Equivalents | $583.00M | $1.43B | $434.00M | $384.00M | $180.00M | $314.00M | $183.00M | $76.00M | $76.00M | $167.00M | $231.00M | $231.00M | $2.82B | $2.21B | $404.50M | $229.40M | $1.06B | $1.03B | $1.30B | $2.03B |
| Short Term Investments | $- | $- | $465.00M | $323.00M | $347.00M | $409.00M | $333.00M | $- | $469.00M | $486.00M | $332.00M | $443.00M | $236.50M | $694.90M | $552.30M | $- | $2.43B | $- | $- | $- |
| Cash and Short Term Investments | $583.00M | $1.43B | $899.00M | $707.00M | $180.00M | $723.00M | $183.00M | $76.00M | $76.00M | $167.00M | $231.00M | $231.00M | $2.82B | $2.21B | $404.50M | $229.40M | $1.06B | $1.03B | $1.30B | $2.03B |
| Net Receivables | $9.25B | $8.20B | $8.66B | $7.61B | $7.76B | $6.94B | $6.14B | $6.64B | $6.96B | $6.74B | $8.56B | $9.07B | $7.00B | $6.29B | $5.40B | $5.85B | $4.83B | $3.95B | $3.06B | $3.37B |
| Inventory | $3.96B | $3.32B | $3.36B | $3.26B | $3.35B | $3.35B | $2.50B | $2.19B | $2.55B | $3.17B | $3.23B | $2.65B | $2.68B | $3.10B | $3.35B | $3.70B | $3.30B | $3.19B | $2.02B | $1.54B |
| Other Current Assets | $1.35B | $1.44B | $1.30B | $947.00M | $1.40B | $976.00M | $886.00M | $774.00M | $1.00B | $1.01B | $1.05B | $1.08B | $781.40M | $1.40B | $1.30B | $798.00M | $737.80M | $788.20M | $883.40M | $858.90M |
| Total Current Assets | $15.13B | $14.38B | $13.45B | $12.09B | $12.25B | $11.43B | $9.70B | $9.69B | $10.60B | $11.08B | $12.96B | $12.98B | $13.27B | $12.83B | $10.31B | $10.58B | $9.91B | $8.79B | $7.12B | $7.72B |
| Property Plant Equipment Net | $49.50B | $48.10B | $47.86B | $46.81B | $45.80B | $45.72B | $45.05B | $44.60B | $44.40B | $44.17B | $44.13B | $44.03B | $42.09B | $42.25B | $42.23B | $42.10B | $41.91B | $42.36B | $42.54B | $42.16B |
| Goodwill | $5.71B | $5.61B | $5.61B | $5.61B | $5.61B | $5.61B | $5.61B | $5.61B | $5.61B | $5.61B | $5.61B | $5.61B | $5.45B | $5.45B | $5.45B | $5.45B | $5.45B | $5.75B | $5.75B | $5.75B |
| Intangible Assets | $4.00B | $3.62B | $3.67B | $3.72B | $3.77B | $9.43B | $3.87B | $3.92B | $3.96B | $4.01B | $4.06B | $4.10B | $3.15B | $3.19B | $3.23B | $3.26B | $3.31B | $3.35B | $3.38B | $3.41B |
| Goodwill and Intangible Assets | $9.72B | $9.23B | $9.28B | $9.33B | $9.38B | $15.04B | $9.48B | $9.53B | $9.57B | $9.62B | $9.66B | $9.71B | $8.60B | $8.64B | $8.68B | $8.71B | $8.76B | $9.09B | $9.12B | $9.15B |
| Long Term Investments | $2.26B | $2.27B | $2.39B | $3.08B | $2.33B | $2.46B | $2.33B | $2.34B | $2.35B | $2.36B | $2.37B | $2.43B | $2.43B | $2.43B | $2.44B | $2.45B | $2.43B | $2.49B | $2.55B | $2.61B |
| Tax Assets | $- | $- | $56.00M | $52.00M | $50.00M | $28.00M | $24.00M | $- | $4.00M | $4.00M | $4.00M | $3.00M | $2.90M | $- | $- | $- | $- | $- | $- | $- |
| Other Non-Current Assets | $562.00M | $1.08B | $577.00M | $55.00M | $1.17B | $-4.84B | $1.14B | $1.18B | $1.18B | $1.21B | $1.22B | $1.17B | $1.14B | $1.17B | $1.14B | $1.14B | $1.10B | $1.00B | $617.80M | $624.00M |
| Total Non-Current Assets | $62.03B | $60.68B | $60.16B | $59.33B | $58.73B | $58.40B | $58.02B | $57.64B | $57.51B | $57.35B | $57.39B | $57.34B | $54.26B | $54.49B | $54.49B | $54.40B | $54.20B | $54.94B | $54.83B | $54.55B |
| Other Assets | $- | $- | $- | $- | $- | $- | $- | $- | $- | $- | $- | $- | $- | $- | $- | $- | $- | $- | $- | $- |
| Total Assets | $77.17B | $75.06B | $73.62B | $71.42B | $70.98B | $69.83B | $67.73B | $67.33B | $68.11B | $68.44B | $70.35B | $70.32B | $67.53B | $67.32B | $64.81B | $64.98B | $64.11B | $63.74B | $61.94B | $62.27B |
| Account Payables | $1.23B | $1.20B | $1.15B | $1.37B | $1.20B | $962.00M | $999.00M | $750.00M | $743.00M | $754.00M | $803.00M | $868.00M | $632.00M | $708.10M | $853.40M | $830.70M | $704.60M | $896.00M | $902.50M | $915.80M |
| Short Term Debt | $1.15B | $1.15B | $2.14B | $1.31B | $1.30B | $1.54B | $1.27B | $1.15B | $1.74B | $2.71B | $1.94B | $2.68B | $1.40B | $1.43B | $1.43B | $1.54B | $1.43B | $1.35B | $2.36B | $1.78B |
| Tax Payables | $- | $- | $- | $- | $- | $- | $- | $- | $- | $- | $- | $- | $- | $- | $- | $- | $25.10M | $- | $- | $- |
| Deferred Revenue | $- | $- | $191.00M | $156.00M | $9.56B | $159.00M | $7.54B | $- | $181.00M | $203.00M | $11.25B | $179.00M | $8.55B | $8.22B | $7.13B | $7.28B | $5.85B | $4.55B | $3.27B | $3.40B |
| Other Current Liabilities | $12.80B | $11.05B | $11.52B | $10.34B | $10.64B | $9.97B | $8.44B | $8.51B | $9.78B | $9.43B | $12.23B | $11.83B | $9.59B | $9.73B | $8.25B | $8.17B | $6.82B | $5.60B | $4.22B | $4.22B |
| Total Current Liabilities | $15.18B | $13.40B | $14.81B | $13.03B | $13.13B | $12.47B | $10.71B | $10.41B | $12.27B | $12.90B | $14.98B | $15.37B | $11.62B | $11.87B | $10.53B | $10.54B | $8.99B | $7.85B | $7.48B | $6.92B |
| Long Term Debt | $31.11B | $30.76B | $28.66B | $28.67B | $27.77B | $27.78B | $27.78B | $27.44B | $26.89B | $26.89B | $27.24B | $27.24B | $28.52B | $28.48B | $27.46B | $27.46B | $28.86B | $28.86B | $27.61B | $28.19B |
| Deferred Revenue Non-Current | $- | $- | $285.00M | $294.00M | $326.00M | $315.00M | $49.00M | $- | $320.00M | $294.00M | $49.00M | $252.00M | $249.50M | $49.30M | $49.30M | $49.30M | $49.30M | $49.10M | $- | $- |
| Deferred Tax Liabilities Non-Current | $- | $634.00M | $681.00M | $672.00M | $611.00M | $633.00M | $591.00M | $603.00M | $600.00M | $565.00M | $556.00M | $549.00M | $518.00M | $511.30M | $502.30M | $482.80M | $464.70M | $463.30M | $481.60M | $428.20M |
| Other Non-Current Liabilities | $1.24B | $1.17B | $731.00M | $856.00M | $384.00M | $746.00M | $1.12B | $1.01B | $329.00M | $643.00M | $553.00M | $500.00M | $171.70M | $476.90M | $465.00M | $428.40M | $216.90M | $458.70M | $425.00M | $619.00M |
| Total Non-Current Liabilities | $32.35B | $32.56B | $30.01B | $29.92B | $29.09B | $29.14B | $29.00B | $29.06B | $28.14B | $28.10B | $28.39B | $28.29B | $29.46B | $29.46B | $28.43B | $28.37B | $29.74B | $29.78B | $28.52B | $29.24B |
| Other Liabilities | $- | $-58.00M | $- | $- | $- | $- | $- | $- | $- | $- | $- | $- | $- | $- | $- | $- | $- | $- | $- | $- |
| Total Liabilities | $47.53B | $45.90B | $44.82B | $42.95B | $42.22B | $41.61B | $39.71B | $39.47B | $40.41B | $41.00B | $43.37B | $43.66B | $41.09B | $41.34B | $38.96B | $38.91B | $38.73B | $37.63B | $36.00B | $36.15B |
| Preferred Stock | $50.00M | $- | $49.00M | $49.00M | $49.00M | $49.00M | $49.00M | $- | $49.00M | $49.00M | $49.00M | $49.00M | $49.00M | $49.30M | $49.30M | $49.30M | $49.30M | $49.10M | $- | $- |
| Common Stock | $29.79B | $- | $29.11B | $28.83B | $28.66B | $28.24B | $27.98B | $- | $27.55B | $27.27B | $27.00B | $26.61B | $26.34B | $26.39B | $26.27B | $26.11B | $25.77B | $26.38B | $26.32B | $26.23B |
| Retained Earnings | $- | $- | $-29.16B | $-28.88B | $-49.00M | $-28.29B | $-28.03B | $- | $-27.60B | $2.40B | $- | $-26.42B | $-26.39B | $-26.44B | $-26.32B | $-26.16B | $-389.40M | $-26.43B | $- | $- |
| Accumulated Other Comprehensive Income Loss | $236.00M | $303.00M | $176.00M | $143.00M | $307.00M | $203.00M | $268.00M | $241.00M | $365.00M | $373.00M | $177.00M | $240.00M | $285.90M | $-171.80M | $-198.70M | $181.00M | $-165.20M | $-49.30M | $-147.10M | $122.30M |
| Other Total Stockholders Equity | $-1.30B | $28.05B | $-1.30B | $-1.30B | $-1.30B | $-1.30B | $-1.30B | $-241.00M | $-1.30B | $-1.30B | $-1.30B | $-1.25B | $-26.63B | $-1.30B | $-1.30B | $-1.30B | $-224.20M | $-1.30B | $-1.30B | $-1.30B |
| Total Stockholders Equity | $28.78B | $28.35B | $27.99B | $27.68B | $307.00M | $27.15B | $26.95B | $- | $26.62B | $26.35B | $25.93B | $240.00M | $26.44B | $24.92B | $24.77B | $24.99B | $25.43B | $25.04B | $24.88B | $25.05B |
| Total Equity | $29.64B | $29.16B | $28.80B | $28.48B | $1.39B | $28.22B | $28.02B | $1.07B | $27.70B | $27.44B | $27.03B | $1.34B | $27.55B | $25.98B | $25.85B | $26.07B | $26.50B | $26.10B | $25.94B | $26.11B |
| Total Liabilities and Stockholders Equity | $77.17B | $45.90B | $73.62B | $71.42B | $42.22B | $69.83B | $67.73B | $39.47B | $68.11B | $68.44B | $43.37B | $44.77B | $42.20B | $67.32B | $64.81B | $64.98B | $39.80B | $63.74B | $61.94B | $62.27B |
| Minority Interest | $857.00M | $809.00M | $808.00M | $800.00M | $1.09B | $1.07B | $1.07B | $1.07B | $1.08B | $1.09B | $1.09B | $1.10B | $1.11B | $1.06B | $1.07B | $1.08B | $1.07B | $1.07B | $1.06B | $1.06B |
| Total Liabilities and Total Equity | $77.17B | $45.90B | $73.62B | $71.42B | $42.22B | $69.83B | $67.73B | $39.47B | $68.11B | $68.44B | $43.37B | $44.77B | $42.20B | $67.32B | $64.81B | $64.98B | $39.80B | $63.74B | $61.94B | $62.27B |
| Total Investments | $2.26B | $2.27B | $2.85B | $3.41B | $2.33B | $2.87B | $2.33B | $2.34B | $2.35B | $2.36B | $2.37B | $2.43B | $2.43B | $2.43B | $2.44B | $2.45B | $4.86B | $2.49B | $2.55B | $2.61B |
| Total Debt | $32.26B | $31.91B | $30.85B | $29.90B | $29.07B | $29.38B | $28.65B | $28.59B | $28.64B | $29.20B | $28.78B | $29.52B | $29.87B | $29.53B | $28.55B | $28.66B | $29.87B | $29.86B | $29.61B | $29.61B |
| Net Debt | $31.68B | $30.47B | $30.41B | $29.52B | $28.89B | $29.06B | $28.46B | $28.51B | $28.56B | $29.04B | $28.55B | $29.29B | $27.05B | $27.32B | $28.14B | $28.43B | $28.81B | $28.83B | $28.31B | $27.58B |
Annual Cash Flow
| Breakdown | December 31, 2024 | December 31, 2023 | December 31, 2022 | December 31, 2021 | December 31, 2020 |
|---|---|---|---|---|---|
| Net Income | $5.97B | $5.66B | $5.62B | $4.76B | $3.89B |
| Depreciation and Amortization | $2.19B | $2.07B | $1.97B | $1.87B | $2.07B |
| Deferred Income Tax | $45.00M | $12.00M | $60.00M | $39.80M | $-147.60M |
| Stock Based Compensation | $- | $- | $157.00M | $152.00M | $159.00M |
| Change in Working Capital | $-323.00M | $-555.00M | $-54.00M | $1.37B | $-767.50M |
| Accounts Receivables | $- | $- | $118.00M | $-2.42B | $299.40M |
| Inventory | $- | $- | $131.00M | $867.30M | $-1.42B |
| Accounts Payables | $- | $276.00M | $-109.00M | $-3.80M | $-1.50M |
| Other Working Capital | $-323.00M | $-831.00M | $-194.00M | $2.93B | $355.00M |
| Other Non Cash Items | $229.00M | $383.00M | $287.00M | $305.00M | $39.30M |
| Net Cash Provided by Operating Activities | $8.12B | $7.57B | $8.04B | $8.51B | $5.89B |
| Investments in Property Plant and Equipment | $-4.54B | $-3.27B | $-1.96B | $-2.22B | $-3.29B |
| Acquisitions Net | $-949.00M | $-2.00M | $-3.21B | $-2.10M | $-15.60M |
| Purchases of Investments | $- | $- | $-1.00M | $-2.10M | $-15.60M |
| Sales Maturities of Investments | $- | $- | $1.00M | $2.10M | $15.60M |
| Other Investing Activities | $60.00M | $71.00M | $215.00M | $90.70M | $182.80M |
| Net Cash Used for Investing Activities | $-5.43B | $-3.20B | $-4.95B | $-2.13B | $-3.12B |
| Debt Repayment | $3.17B | $452.00M | $-1.26B | $-348.90M | $2.27B |
| Common Stock Issued | $- | $- | $- | $- | $- |
| Common Stock Repurchased | $-219.00M | $-188.00M | $-250.00M | $-214.00M | $-186.00M |
| Dividends Paid | $-4.51B | $-4.30B | $-4.09B | $-3.93B | $-3.89B |
| Other Financing Activities | $-602.00M | $-221.00M | $-243.00M | $-78.40M | $-242.70M |
| Net Cash Used Provided by Financing Activities | $-2.16B | $-4.26B | $-5.84B | $-4.57B | $-2.02B |
| Effect of Forex Changes on Cash | $- | $- | $- | $- | $- |
| Net Change in Cash | $518.00M | $114.00M | $-2.76B | $1.81B | $748.10M |
| Cash at End of Period | $838.00M | $320.00M | $206.00M | $2.96B | $1.16B |
| Cash at Beginning of Period | $320.00M | $206.00M | $2.96B | $1.16B | $410.00M |
| Operating Cash Flow | $8.12B | $7.57B | $8.04B | $8.51B | $5.89B |
| Capital Expenditure | $-4.54B | $-3.27B | $-1.96B | $-2.22B | $-3.29B |
| Free Cash Flow | $3.57B | $4.30B | $6.08B | $6.29B | $2.60B |
Cash Flow Charts
| Breakdown | December 31, 2024 | September 30, 2024 | June 30, 2024 | March 31, 2024 | December 31, 2023 | September 30, 2023 | June 30, 2023 | March 31, 2023 | December 31, 2022 | September 30, 2022 | June 30, 2022 | March 31, 2022 | December 31, 2021 | September 30, 2021 | June 30, 2021 | March 31, 2021 | December 31, 2020 | September 30, 2020 | June 30, 2020 | March 31, 2020 |
|---|---|---|---|---|---|---|---|---|---|---|---|---|---|---|---|---|---|---|---|---|
| Net Income | $1.62B | $1.42B | $1.39B | $1.44B | $1.60B | $1.31B | $1.28B | $1.42B | $1.45B | $1.39B | $1.44B | $1.33B | $1.06B | $1.18B | $1.15B | $1.36B | $365.90M | $1.08B | $1.06B | $1.38B |
| Depreciation and Amortization | $655.00M | $552.00M | $622.00M | $626.00M | $536.00M | $602.00M | $510.00M | $500.00M | $506.00M | $499.00M | $488.00M | $481.00M | $480.10M | $469.20M | $463.60M | $461.50M | $526.80M | $513.40M | $522.70M | $509.00M |
| Deferred Income Tax | $- | $9.00M | $5.00M | $9.00M | $7.00M | $13.00M | $-11.00M | $3.00M | $36.00M | $8.00M | $7.00M | $9.00M | $6.70M | $9.00M | $19.50M | $4.60M | $1.40M | $-18.30M | $53.40M | $-184.10M |
| Stock Based Compensation | $- | $- | $45.00M | $56.00M | $43.00M | $43.00M | $45.00M | $- | $37.00M | $40.00M | $41.00M | $39.00M | $36.00M | $36.00M | $41.00M | $39.00M | $38.80M | $39.50M | $41.70M | $39.10M |
| Change in Working Capital | $31.00M | $-36.00M | $-491.00M | $-36.00M | $151.00M | $-303.00M | $36.00M | $-439.00M | $628.00M | $-900.00M | $27.00M | $191.00M | $319.60M | $647.90M | $300.20M | $99.00M | $-75.50M | $-603.00M | $-430.70M | $341.70M |
| Accounts Receivables | $-1.03B | $446.00M | $-1.14B | $274.00M | $-846.00M | $-797.00M | $478.00M | $359.00M | $-238.00M | $1.72B | $574.00M | $-1.94B | $-883.60M | $-848.30M | $525.60M | $-1.22B | $-821.10M | $-956.40M | $374.00M | $1.70B |
| Inventory | $-630.00M | $43.00M | $-12.00M | $1.00M | $52.00M | $-828.00M | $-300.00M | $362.00M | $606.00M | $-8.00M | $-532.00M | $65.00M | $347.10M | $276.70M | $339.20M | $-95.70M | $-357.20M | $-1.22B | $-346.30M | $507.70M |
| Accounts Payables | $- | $291.00M | $-226.00M | $-65.00M | $293.00M | $38.00M | $134.00M | $-189.00M | $37.00M | $-73.00M | $-184.00M | $111.00M | $-14.60M | $-87.00M | $78.70M | $19.10M | $-107.50M | $97.20M | $79.40M | $-70.60M |
| Other Working Capital | $1.69B | $-816.00M | $891.00M | $-246.00M | $652.00M | $1.28B | $-276.00M | $-971.00M | $223.00M | $-2.54B | $169.00M | $1.95B | $870.70M | $1.31B | $-643.30M | $1.39B | $1.21B | $1.48B | $-537.80M | $-1.80B |
| Other Non Cash Items | $52.00M | $91.00M | $2.69B | $1.13B | $86.00M | $63.00M | $39.00M | $97.00M | $66.00M | $11.00M | $92.00M | $133.00M | $76.60M | $77.10M | $79.80M | $71.50M | $9.80M | $9.80M | $9.70M | $10.00M |
| Net Cash Provided by Operating Activities | $2.36B | $2.03B | $1.60B | $2.13B | $2.37B | $1.73B | $1.90B | $1.58B | $2.73B | $1.05B | $2.12B | $2.15B | $2.13B | $2.37B | $1.99B | $2.02B | $1.60B | $1.10B | $1.18B | $2.01B |
| Investments in Property Plant and Equipment | $-1.06B | $-1.17B | $-1.26B | $-1.05B | $-1.01B | $-821.00M | $-780.00M | $-653.00M | $-761.00M | $-472.00M | $-382.00M | $-349.00M | $-417.50M | $-504.50M | $-622.20M | $-679.00M | $-616.30M | $-695.70M | $-896.40M | $-1.08B |
| Acquisitions Net | $-949.00M | $5.00M | $4.00M | $-398.00M | $35.00M | $1.00M | $4.00M | $- | $1.00M | $-1.00M | $3.00M | $-3.20B | $-800.00K | $7.80M | $44.10M | $-1.30M | $-5.70M | $-2.60M | $-4.00M | $-3.30M |
| Purchases of Investments | $- | $- | $- | $- | $2.00M | $-2.00M | $- | $- | $- | $-1.00M | $- | $- | $-800.00K | $- | $- | $- | $- | $- | $- | $- |
| Sales Maturities of Investments | $- | $- | $- | $- | $- | $- | $- | $- | $- | $1.00M | $- | $- | $- | $- | $- | $- | $- | $- | $- | $- |
| Other Investing Activities | $8.00M | $17.00M | $-7.00M | $-8.00M | $-5.00M | $-3.00M | $1.54B | $16.00M | $115.00M | $32.00M | $2.00M | $21.00M | $5.20M | $11.70M | $50.50M | $23.30M | $65.50M | $64.60M | $41.60M | $11.10M |
| Net Cash Used for Investing Activities | $-2.00B | $-1.15B | $-1.27B | $-1.45B | $-977.00M | $-825.00M | $765.00M | $-637.00M | $-645.00M | $-441.00M | $-336.00M | $-3.53B | $-413.10M | $-492.80M | $-571.70M | $-657.00M | $-556.50M | $-633.70M | $-858.80M | $-1.07B |
| Debt Repayment | $-16.00M | $1.59B | $900.00M | $696.00M | $-171.00M | $- | $54.00M | $303.00M | $-909.00M | $414.00M | $-740.00M | $-20.00M | $- | $992.00M | $-115.00M | $-1.21B | $-500.00K | $260.30M | $- | $2.01B |
| Common Stock Issued | $- | $- | $- | $- | $- | $- | $- | $- | $- | $- | $- | $- | $- | $- | $- | $- | $-1.00M | $- | $- | $- |
| Common Stock Repurchased | $-63.00M | $-76.00M | $-40.00M | $-40.00M | $-96.00M | $- | $-75.00M | $-17.00M | $-143.00M | $-72.00M | $-35.00M | $- | $-125.10M | $-75.00M | $- | $-14.00M | $-12.50M | $-33.70M | $- | $-140.10M |
| Dividends Paid | $-1.14B | $-1.14B | $-1.12B | $-1.12B | $-1.09B | $-1.09B | $-1.06B | $-1.06B | $-1.03B | $-1.03B | $-1.01B | $-1.01B | $-981.90M | $-983.50M | $-983.30M | $-981.70M | $-971.40M | $-972.70M | $-972.70M | $-974.20M |
| Other Financing Activities | $24.00M | $-55.00M | $-23.00M | $-548.00M | $-30.00M | $223.00M | $-50.00M | $-98.00M | $-43.00M | $-58.00M | $-50.00M | $-93.00M | $1.50M | $-65.00M | $-47.00M | $15.90M | $-31.00M | $-56.00M | $-29.10M | $-125.80M |
| Net Cash Used Provided by Financing Activities | $-1.19B | $319.00M | $-281.00M | $-609.00M | $-1.38B | $-863.00M | $1.14B | $-876.00M | $-2.13B | $-751.00M | $-1.84B | $-1.12B | $-1.11B | $-130.40M | $-1.15B | $-2.19B | $-1.02B | $-769.60M | $-1.00B | $765.10M |
| Effect of Forex Changes on Cash | $- | $- | $- | $- | $14.91B | $- | $- | $- | $- | $- | $- | $- | $400.00K | $- | $- | $- | $- | $- | $- | $- |
| Net Change in Cash | $-835.00M | $1.24B | $50.00M | $64.00M | $6.00M | $37.00M | $3.80B | $70.00M | $-49.00M | $-142.00M | $-56.00M | $-2.51B | $606.60M | $1.75B | $276.60M | $-823.70M | $27.00M | $-305.50M | $-679.00M | $1.71B |
| Cash at End of Period | $838.00M | $1.67B | $434.00M | $384.00M | $320.00M | $314.00M | $28.93B | $276.00M | $206.00M | $255.00M | $397.00M | $453.00M | $2.96B | $2.36B | $611.00M | $334.40M | $1.16B | $1.13B | $1.44B | $2.12B |
| Cash at Beginning of Period | $1.67B | $434.00M | $384.00M | $320.00M | $314.00M | $277.00M | $25.12B | $206.00M | $255.00M | $397.00M | $453.00M | $2.96B | $2.36B | $611.00M | $334.40M | $1.16B | $1.13B | $1.44B | $2.12B | $410.00M |
| Operating Cash Flow | $2.36B | $2.07B | $1.60B | $2.13B | $2.37B | $1.73B | $1.90B | $1.58B | $2.73B | $1.05B | $2.12B | $2.15B | $2.13B | $2.37B | $1.99B | $2.02B | $1.60B | $1.10B | $1.18B | $2.01B |
| Capital Expenditure | $-1.06B | $-1.17B | $-1.26B | $-1.05B | $-1.01B | $-821.00M | $-780.00M | $-653.00M | $-761.00M | $-472.00M | $-382.00M | $-349.00M | $-417.50M | $-504.50M | $-622.20M | $-679.00M | $-616.30M | $-695.70M | $-896.40M | $-1.08B |
| Free Cash Flow | $1.30B | $898.00M | $334.00M | $1.08B | $1.35B | $904.00M | $1.12B | $930.00M | $1.96B | $578.00M | $1.74B | $1.80B | $1.71B | $1.87B | $1.37B | $1.34B | $983.60M | $402.10M | $285.20M | $932.70M |
Enterprise Products Partners L.P Dividends
Explore Enterprise Products Partners L.P's dividend history, including dividend yield, payout ratio, and historical payments.
Dividend Yield
6.63%
Dividend Payout Ratio
76.46%
Dividend Paid & Capex Coverage Ratio
0.90x
Enterprise Products Partners L.P Dividend History
| Dividend | Adjusted Dividend | Date | Record Date | Payment Date | Declaration Date |
|---|---|---|---|---|---|
| $0.535 | $0.535 | April 30, 2025 | April 30, 2025 | May 14, 2025 | April 07, 2025 |
| $0.535 | $0.535 | January 31, 2025 | January 31, 2025 | February 14, 2025 | January 08, 2025 |
| $0.525 | $0.525 | October 31, 2024 | October 31, 2024 | November 14, 2024 | October 02, 2024 |
| $0.525 | $0.525 | July 31, 2024 | July 31, 2024 | August 14, 2024 | July 10, 2024 |
| $0.515 | $0.515 | April 29, 2024 | April 30, 2024 | May 14, 2024 | April 05, 2024 |
| $0.515 | $0.515 | January 30, 2024 | January 31, 2024 | February 14, 2024 | January 08, 2024 |
| $0.5 | $0.5 | October 30, 2023 | October 31, 2023 | November 14, 2023 | October 05, 2023 |
| $0.5 | $0.5 | July 28, 2023 | July 31, 2023 | August 14, 2023 | July 10, 2023 |
| $0.49 | $0.49 | April 27, 2023 | April 28, 2023 | May 12, 2023 | April 05, 2023 |
| $0.49 | $0.49 | January 30, 2023 | January 31, 2023 | February 14, 2023 | January 05, 2023 |
| $0.475 | $0.475 | October 28, 2022 | October 31, 2022 | November 14, 2022 | October 04, 2022 |
| $0.475 | $0.475 | July 28, 2022 | July 29, 2022 | August 12, 2022 | July 07, 2022 |
| $0.465 | $0.465 | April 28, 2022 | April 29, 2022 | May 12, 2022 | April 07, 2022 |
| $0.465 | $0.465 | January 28, 2022 | January 31, 2022 | February 11, 2022 | January 06, 2022 |
| $0.45 | $0.45 | October 28, 2021 | October 29, 2021 | November 12, 2021 | October 12, 2021 |
| $0.45 | $0.45 | July 29, 2021 | July 30, 2021 | August 12, 2021 | July 09, 2021 |
| $0.45 | $0.45 | April 29, 2021 | April 30, 2021 | May 12, 2021 | April 08, 2021 |
| $0.45 | $0.45 | January 28, 2021 | January 29, 2021 | February 11, 2021 | January 07, 2021 |
| $0.445 | $0.445 | October 29, 2020 | October 30, 2020 | November 12, 2020 | October 07, 2020 |
| $0.445 | $0.445 | July 30, 2020 | July 31, 2020 | August 12, 2020 | July 07, 2020 |
Enterprise Products Partners L.P News
Read the latest news about Enterprise Products Partners L.P, including recent articles, headlines, and updates.
Enterprise Products (EPD) Q1 Earnings on the Horizon: Analysts' Insights on Key Performance Measures
Besides Wall Street's top -and-bottom-line estimates for Enterprise Products (EPD), review projections for some of its key metrics to gain a deeper understanding of how the company might have fared during the quarter ended March 2025.
Forget Gold, Buy Dividends - 3 Great Places To Buy Income
Gold is experiencing a strong rally, with rising demand due to economic uncertainty and market volatility. However, despite its appeal as a safe haven, I prefer dividend stocks over gold. Gold has a long history of preserving wealth, but it lacks the consistent returns and cash flow that dividend stocks provide. I believe high-quality dividend stocks are better investments. Real estate, energy, and utilities offer the highest yields, and I particularly favor midstream energy companies and safe net lease REITs. These stocks offer steady income and growth potential.

3 No-Brainer Energy Stocks to Buy With $500 Right Now
With the rise of artificial intelligence (AI) algorithms and a push for investment in domestic production and manufacturing, the United States could see a surge in energy demand. As the appetite for energy grows, there are excellent investment opportunities for some of the energy sector's largest players.

3 Megatrends Are Creating A Once-In-A-Generation Boom For Infrastructure Stocks
Three major macro factors are causing a lot of turmoil in markets right now. Infrastructure is positioned to benefit from these three major macro factors. I share some specific picks for turning today's market chaos into long-term dividend growth and real wealth.
Seeking Clues to Enterprise Products (EPD) Q1 Earnings? A Peek Into Wall Street Projections for Key Metrics
Looking beyond Wall Street's top -and-bottom-line estimate forecasts for Enterprise Products (EPD), delve into some of its key metrics to gain a deeper insight into the company's potential performance for the quarter ended March 2025.
Is Enterprise Products Partners (EPD) Stock Undervalued Right Now?
Here at Zacks, our focus is on the proven Zacks Rank system, which emphasizes earnings estimates and estimate revisions to find great stocks. Nevertheless, we are always paying attention to the latest value, growth, and momentum trends to underscore strong picks.

Prediction: 1 High-Yield Stock That Will Be Worth More Than UPS 2 Years From Now
UPS (UPS 0.59%), one of the world's top shipping couriers, was once considered a stable long-term investment. It operates in over 200 countries, delivers an average of 22.4 million packages daily, and employs nearly half a million people worldwide.

If I Had To Retire With 2 MLPs, It Would Be These
Risk management has become important once again. It is the right moment for investors, who plan to retire or live off of portfolio income streams to revisit and properly calibrate their holdings. One commonly deemed safe and reliable income-producing asset class is the midstream or MLP segment.
Time to Rethink Occidental Petroleum; Here Are 2 High-Yield Energy Alternatives
Occidental Petroleum (OXY 2.41%) has a big-name shareholder in the form of Warren Buffett's Berkshire Hathaway. That has put the company onto the radar of investors that follow the so-called Oracle of Omaha's every move (which includes most of Wall Street).

Here's Why Enterprise Products Partners Stock Is a Buy Before April 29
Enterprise Products Partners (EPD 2.02%), one of the largest midstream natural gas and crude oil pipeline companies in America, is usually considered a slow-growth stock. But over the past five years, this boring but reliable income stock rallied about 93%.
Enough With 60/40, Consider 100% Dividend Strategy For Retirement
The 60/40 portfolio, with 60% in equities and 40% in bonds, has long been the gold standard in the investment game. Yet, it has failed to deliver on its promise. In my view, a durable income strategy is a better approach, especially for funding retirement and becoming financially independent.

Wall Street Bulls Look Optimistic About Enterprise Products (EPD): Should You Buy?
Investors often turn to recommendations made by Wall Street analysts before making a Buy, Sell, or Hold decision about a stock. While media reports about rating changes by these brokerage-firm employed (or sell-side) analysts often affect a stock's price, do they really matter?

Why Most Dividend Retirement Strategies Fail: How To Retire With Dividends
Most high-yield strategies are ticking time bombs. Don't get wiped out when the next downturn hits. Discover the only portfolio blend that can deliver sustainable and rising dividends through inflation, recessions, and even currency collapse.

If I Retired Today, These 3 Dividend Stocks Would Be My Paycheck
The 60/40 portfolio used to be a rock-solid strategy. But persistent inflation and bond market volatility have turned the "safe" 40% into a real risk. I'm not a fan of bonds—and with good reason. I'd rather own high-quality businesses with dependable dividends and stronger long-term return potential. In this article, I highlight three stable, income-focused stocks I'd buy without hesitation to reduce portfolio risk and potentially outperform the 60/40 crowd.

Trump Tariff Plunge: 3 Phenomenal Stocks to Buy at Bargain Prices Right Now
Just because Wall Street has proved to be a superior wealth creator over the long run doesn't mean stocks are impervious to bouts of volatility. Since President Donald Trump announced his "Liberation Day" tariffs on April 2, we've witnessed some of the wildest swings in the Dow Jones Industrial Average (^DJI -1.73%), S&P 500 (^GSPC -2.24%), and Nasdaq Composite (^IXIC -3.07%) since their respective inceptions.

2 High-Yield Dividend Aristocrats That Are On Sale
Synchronized drawdowns create opportunities to buy stocks that have been unfairly punished. While many stocks are, in my view, fairly discounted, there are some high-quality gems that are now offering very compelling entry points. In this article, I discuss two dividend aristocrats that are simply on sale.

Similar Companies
Related Metrics
Explore detailed financial metrics and analysis for EPD.


