Euronav NV Key Executives
This section highlights Euronav NV's key executives, including their titles and compensation details.
Find Contacts at Euronav NV
(Showing 0 of )
Euronav NV Earnings
This section highlights Euronav NV's earnings, including key dates, EPS, earnings reports, and earnings call transcripts.
Next Earnings Date
Last Earnings Results
Earnings Call Transcripts
| Transcript | Quarter | Year | Date | Estimated EPS | Actual EPS |
|---|---|---|---|---|---|
| Read Transcript | Q4 | 2024 | 2025-02-27 | N/A | N/A |
| Read Transcript | Q3 | 2024 | 2024-11-07 | N/A | N/A |
| Read Transcript | Q1 | 2024 | 2024-05-08 | $0.49 | $0.44 |
| Read Transcript | Q4 | 2023 | 2024-02-02 | N/A | N/A |
| Read Transcript | Q2 | 2023 | 2023-08-03 | $0.81 | $0.80 |
| Read Transcript | Q1 | 2023 | 2023-05-11 | $0.72 | $0.87 |
Financial Statements
Access annual & quarterly financial statements for Euronav NV, including income statements, balance sheets, and cash flow statements..
Annual Income Statement
| Breakdown | December 31, 2023 | December 31, 2022 | December 31, 2021 | December 31, 2020 | December 31, 2019 |
|---|---|---|---|---|---|
| Revenue | $1.26B | $854.67M | $419.77M | $1.23B | $932.38M |
| Cost of Revenue | $611.19M | $619.65M | $694.26M | $663.77M | $694.78M |
| Gross Profit | $649.78M | $235.02M | $-274.49M | $566.98M | $237.59M |
| Gross Profit Ratio | 51.50% | 27.50% | -65.40% | 46.07% | 25.48% |
| Research and Development Expenses | $- | $- | $- | $- | $- |
| General and Administrative Expenses | $59.24M | $51.70M | $32.41M | $65.50M | $66.89M |
| Selling and Marketing Expenses | $1.31M | $- | $- | $- | $- |
| Selling General and Administrative Expenses | $60.48M | $51.70M | $32.41M | $65.50M | $66.89M |
| Other Expenses | $-3.36M | $-15.14M | $-10.26M | $-10.11M | $-10.09M |
| Operating Expenses | $63.84M | $36.56M | $22.15M | $55.39M | $56.80M |
| Cost and Expenses | $675.03M | $656.21M | $716.41M | $719.15M | $751.58M |
| Interest Income | $20.62M | $27.14M | $14.93M | $21.50M | $20.57M |
| Interest Expense | $132.90M | $133.01M | $95.54M | $91.55M | $119.80M |
| Depreciation and Amortization | $225.67M | $171.84M | $344.99M | $318.52M | $343.47M |
| EBITDA | $811.61M | $465.85M | $86.26M | $852.84M | $539.07M |
| EBITDA Ratio | 64.36% | 54.51% | 20.55% | 69.29% | 57.82% |
| Operating Income | $585.94M | $294.01M | $-258.73M | $534.32M | $195.60M |
| Operating Income Ratio | 46.47% | 34.40% | -61.64% | 43.41% | 20.98% |
| Total Other Income Expenses Net | $266.79M | $7.59M | $-57.63M | $-13.29M | $-99.23M |
| Income Before Tax | $883.06M | $206.06M | $-339.20M | $464.26M | $96.37M |
| Income Before Tax Ratio | 70.03% | 24.11% | -80.81% | 37.72% | 10.34% |
| Income Tax Expense | $6.13M | $2.80M | $-427.00K | $1.94M | $602.00K |
| Net Income | $858.03M | $203.25M | $-338.78M | $473.24M | $112.23M |
| Net Income Ratio | 68.04% | 23.78% | -80.71% | 38.45% | 12.04% |
| EPS | $4.34 | $1.03 | $-1.68 | $2.42 | $0.52 |
| EPS Diluted | $4.34 | $1.02 | $-1.68 | $2.42 | $0.52 |
| Weighted Average Shares Outstanding | 201.90M | 201.75M | 201.68M | 210.19M | 216.03M |
| Weighted Average Shares Outstanding Diluted | 201.90M | 201.99M | 201.68M | 210.21M | 216.03M |
| SEC Filing | Source | Source | Source | Source | Source |
| Breakdown | March 31, 2024 | December 31, 2023 | September 30, 2023 | June 30, 2023 | March 31, 2023 | December 31, 2022 | September 30, 2022 | June 30, 2022 | March 31, 2022 | December 31, 2021 | September 30, 2021 | June 30, 2021 | March 31, 2021 | December 31, 2020 | September 30, 2020 | June 30, 2020 | March 31, 2020 | December 31, 2019 | September 30, 2019 | June 30, 2019 |
|---|---|---|---|---|---|---|---|---|---|---|---|---|---|---|---|---|---|---|---|---|
| Revenue | $240.38M | $278.02M | $278.38M | $348.16M | $339.95M | $368.07M | $223.54M | $148.69M | $114.37M | $102.97M | $99.14M | $104.23M | $113.42M | $138.44M | $240.95M | $434.69M | $416.67M | $355.15M | $175.29M | $169.35M |
| Cost of Revenue | $127.89M | $150.14M | $148.21M | $155.05M | $147.95M | $162.17M | $170.80M | $147.89M | $138.79M | $179.74M | $176.06M | $174.52M | $163.94M | $158.19M | $169.84M | $166.09M | $169.64M | $173.51M | $170.85M | $174.53M |
| Gross Profit | $112.49M | $127.88M | $130.17M | $193.11M | $192.00M | $205.90M | $52.74M | $800.00K | $-24.42M | $-76.77M | $-76.92M | $-70.28M | $-50.51M | $-19.75M | $71.11M | $268.60M | $247.02M | $181.64M | $4.43M | $-5.19M |
| Gross Profit Ratio | 46.80% | 46.00% | 46.80% | 55.50% | 56.50% | 55.90% | 23.60% | 0.50% | -21.40% | -74.60% | -77.60% | -67.40% | -44.50% | -14.27% | 29.51% | 61.79% | 59.29% | 51.14% | 2.53% | -3.06% |
| Research and Development Expenses | $- | $- | $- | $- | $- | $- | $- | $- | $- | $- | $- | $- | $- | $- | $- | $- | $- | $- | $- | $- |
| General and Administrative Expenses | $17.71M | $18.69M | $13.80M | $10.22M | $16.52M | $13.60M | $16.53M | $10.92M | $10.66M | $-11.94M | $14.33M | $15.72M | $14.30M | $18.41M | $15.20M | $15.48M | $16.40M | $15.54M | $14.89M | $16.78M |
| Selling and Marketing Expenses | $- | $578.90K | $- | $- | $- | $- | $- | $- | $- | $- | $- | $- | $- | $- | $- | $- | $- | $- | $- | $- |
| Selling General and Administrative Expenses | $17.71M | $22.56M | $13.80M | $10.22M | $16.52M | $13.60M | $16.53M | $10.92M | $10.66M | $-11.94M | $14.33M | $15.72M | $14.30M | $18.41M | $15.20M | $15.48M | $16.40M | $15.54M | $14.89M | $16.78M |
| Other Expenses | $- | $- | $- | $- | $-4.69M | $-4.63M | $-4.48M | $-3.52M | $-2.52M | $-24.00K | $-2.44M | $-2.30M | $-2.37M | $811.00K | $-1.86M | $-2.72M | $-3.28M | $-4.65M | $-1.34M | $-1.20M |
| Operating Expenses | $10.11M | $22.56M | $9.06M | $151.00K | $11.83M | $8.97M | $12.05M | $7.40M | $8.13M | $-15.08M | $11.89M | $13.42M | $11.93M | $16.15M | $13.35M | $12.76M | $13.12M | $10.03M | $13.55M | $15.58M |
| Cost and Expenses | $138.00M | $172.70M | $157.28M | $155.20M | $159.78M | $171.15M | $182.85M | $155.29M | $146.92M | $164.66M | $187.95M | $187.93M | $175.86M | $174.35M | $183.19M | $178.85M | $182.77M | $183.54M | $184.41M | $190.12M |
| Interest Income | $15.33M | $24.72M | $12.43M | $16.82M | $6.69M | $12.67M | $13.32M | $387.00K | $5.32M | $4.53M | $1.77M | $1.70M | $6.93M | $6.31M | $6.14M | $2.14M | $6.91M | $6.31M | $10.03M | $20.32M |
| Interest Expense | $30.77M | $- | $39.01M | $46.50M | $37.15M | $36.45M | $61.91M | $- | $38.97M | $24.62M | $24.48M | $23.13M | $23.31M | $23.45M | $21.86M | $18.15M | $28.10M | $27.21M | $47.22M | $- |
| Depreciation and Amortization | $40.24M | $50.72M | $59.72M | $55.62M | $40.90M | $25.57M | $58.79M | $53.65M | $52.60M | $85.98M | $87.79M | $87.37M | $83.86M | $77.85M | $80.11M | $79.47M | $82.31M | $84.56M | $84.60M | $84.69M |
| EBITDA | $158.48M | $156.04M | $193.25M | $265.41M | $243.14M | $284.80M | $117.44M | $38.25M | $25.36M | $51.80M | $748.00K | $5.37M | $28.35M | $48.25M | $144.01M | $337.45M | $323.12M | $267.12M | $88.48M | $58.01M |
| EBITDA Ratio | 65.93% | 56.13% | 69.42% | 76.23% | 71.52% | 77.38% | 52.53% | 25.72% | 22.18% | 50.31% | 0.75% | 5.15% | 24.99% | 34.86% | 59.77% | 77.63% | 77.55% | 75.21% | 50.48% | 34.25% |
| Operating Income | $509.94M | $105.32M | $148.16M | $192.96M | $202.24M | $259.22M | $58.64M | $-15.40M | $-27.24M | $-57.19M | $-88.81M | $-74.30M | $-61.28M | $-35.91M | $57.76M | $270.27M | $242.20M | $171.63M | $5.29M | $-20.31M |
| Operating Income Ratio | 212.14% | 37.88% | 53.22% | 55.42% | 59.49% | 70.43% | 26.23% | -10.36% | -23.81% | -55.54% | -89.58% | -71.28% | -54.03% | -25.94% | 23.97% | 62.17% | 58.13% | 48.33% | 3.02% | -11.99% |
| Total Other Income Expenses Net | $400.81M | $317.31M | $471.00K | $-29.68M | $-8.40M | $56.44M | $-20.23M | $-3.53M | $-10.78M | $7.39M | $-20.75M | $-21.43M | $-10.45M | $-17.14M | $-15.72M | $4.50M | $-12.89M | $-16.27M | $-30.95M | $-23.54M |
| Income Before Tax | $495.04M | $422.63M | $121.57M | $163.29M | $171.77M | $253.36M | $20.46M | $-15.07M | $-52.71M | $-54.30M | $-111.52M | $-95.73M | $-77.66M | $-53.04M | $42.05M | $254.26M | $221.01M | $155.36M | $-25.66M | $-43.85M |
| Income Before Tax Ratio | 205.94% | 152.02% | 43.67% | 46.90% | 50.53% | 68.84% | 9.15% | -10.13% | -46.09% | -52.73% | -112.48% | -91.84% | -68.47% | -38.32% | 17.45% | 58.49% | 53.04% | 43.75% | -14.64% | -25.90% |
| Income Tax Expense | $-208.00K | $909.33K | $6.99M | $1.46M | $-3.28M | $729.00K | $7.00M | $-4.96M | $37.00K | $797.00K | $294.00K | $-807.00K | $-711.00K | $419.00K | $207.00K | $704.00K | $614.00K | $1.20M | $1.40M | $-1.55M |
| Net Income | $495.25M | $406.58M | $114.58M | $161.82M | $175.05M | $235.08M | $16.45M | $-10.11M | $-52.74M | $-72.18M | $-105.91M | $-89.68M | $-71.01M | $-58.67M | $46.20M | $259.63M | $225.61M | $154.16M | $-22.90M | $-38.56M |
| Net Income Ratio | 206.03% | 146.24% | 41.16% | 46.48% | 51.49% | 63.87% | 7.36% | -6.80% | -46.12% | -70.10% | -106.82% | -86.04% | -62.61% | -42.38% | 19.17% | 59.73% | 54.15% | 43.41% | -13.07% | -22.77% |
| EPS | $2.46 | $2.09 | $0.55 | $0.80 | $0.88 | $1.22 | $0.08 | $-0.05 | $-0.26 | $-0.36 | $-0.53 | $-0.44 | $-0.35 | $-0.29 | $0.23 | $1.29 | $1.05 | $0.72 | $-0.11 | $-0.18 |
| EPS Diluted | $2.46 | $2.09 | $0.55 | $0.80 | $0.88 | $1.22 | $0.08 | $-0.05 | $-0.26 | $-0.36 | $-0.52 | $-0.44 | $-0.35 | $-0.29 | $0.23 | $1.29 | $1.05 | $0.72 | $-0.11 | $-0.18 |
| Weighted Average Shares Outstanding | 201.52M | 202.04M | 201.91M | 201.87M | 201.78M | 201.78M | 201.77M | 201.75M | 201.68M | 201.68M | 201.68M | 201.68M | 201.68M | 201.68M | 201.68M | 201.68M | 215.08M | 215.07M | 215.06M | 213.44M |
| Weighted Average Shares Outstanding Diluted | 201.52M | 202.04M | 201.91M | 201.87M | 201.97M | 201.96M | 201.77M | 201.77M | 201.77M | 201.77M | 201.77M | 201.77M | 201.69M | 201.69M | 201.69M | 201.69M | 215.08M | 215.08M | 215.08M | 215.08M |
| SEC Filing | Source | Source | Source | Source | Source | Source | Source | Source | Source | Source | Source | Source | Source | Source | Source | Source | Source | Source | Source | Source |
Annual Balance Sheet
| Breakdown | December 31, 2023 | December 31, 2022 | December 31, 2021 | December 31, 2020 | December 31, 2019 |
|---|---|---|---|---|---|
| Cash and Cash Equivalents | $429.02M | $179.93M | $152.53M | $161.48M | $296.95M |
| Short Term Investments | $- | $-92.00K | $- | $- | $- |
| Cash and Short Term Investments | $429.02M | $179.93M | $152.53M | $161.48M | $296.95M |
| Net Receivables | $287.86M | $367.03M | $237.84M | $214.62M | $309.21M |
| Inventory | $22.49M | $41.64M | $69.03M | $75.78M | $183.38M |
| Other Current Assets | $892.36M | $18.46M | $- | $- | $12.71M |
| Total Current Assets | $739.37M | $607.06M | $459.41M | $451.87M | $802.25M |
| Property Plant Equipment Net | $1.77B | $3.31B | $3.18B | $3.13B | $3.24B |
| Goodwill | $11.69K | $- | $92 | $- | $- |
| Intangible Assets | $14.19M | $15.75M | $185.91K | $162.00K | $39.00K |
| Goodwill and Intangible Assets | $14.19M | $15.75M | $186.00K | $162.00K | $39.00K |
| Long Term Investments | $3.40M | $1.42M | $72.45M | $49.23M | $50.32M |
| Tax Assets | $279.77K | $1.40M | $1.55M | $1.36M | $2.71M |
| Other Non-Current Assets | $891.01M | $34.83M | $55.64M | $57.05M | $71.08M |
| Total Non-Current Assets | $2.68B | $3.36B | $3.31B | $3.23B | $3.36B |
| Other Assets | $1 | $- | $- | $- | $- |
| Total Assets | $3.42B | $3.97B | $3.77B | $3.69B | $4.16B |
| Account Payables | $42.00M | $90.47M | $83.91M | $85.15M | $94.41M |
| Short Term Debt | $295.40M | $157.65M | $236.49M | $117.59M | $221.21M |
| Tax Payables | $4.76M | $5.93M | $366.00K | $629.00K | $49.00K |
| Deferred Revenue | $17.34M | $17.54M | $7.54M | $13.14M | $17.78M |
| Other Current Liabilities | $65.25M | $-17.25M | $-7.28M | $-12.91M | $-17.39M |
| Total Current Liabilities | $424.40M | $254.34M | $321.03M | $203.59M | $316.05M |
| Long Term Debt | $631.18M | $1.54B | $1.48B | $1.16B | $1.52B |
| Deferred Revenue Non-Current | $- | $- | $503.00K | $508.00K | $414.00K |
| Deferred Tax Liabilities Non-Current | $- | $- | $- | $- | $- |
| Other Non-Current Liabilities | $5.97M | $2.64M | $10.72M | $15.53M | $12.87M |
| Total Non-Current Liabilities | $636.63M | $1.54B | $1.49B | $1.17B | $1.54B |
| Other Liabilities | $1 | $- | $- | $- | $- |
| Total Liabilities | $1.06B | $1.80B | $1.81B | $1.38B | $1.85B |
| Preferred Stock | $- | $- | $- | $- | $- |
| Common Stock | $238.95M | $239.15M | $239.15M | $239.15M | $239.15M |
| Retained Earnings | $807.25M | $385.98M | $180.14M | $540.25M | $420.06M |
| Accumulated Other Comprehensive Income Loss | $1.37M | $33.03M | $2.85M | $-6.52M | $-4.28M |
| Other Total Stockholders Equity | $1.31B | $1.52B | $1.54B | $1.54B | $1.66B |
| Total Stockholders Equity | $2.36B | $2.17B | $1.96B | $2.31B | $2.31B |
| Total Equity | $2.36B | $2.17B | $1.96B | $2.31B | $2.31B |
| Total Liabilities and Stockholders Equity | $3.42B | $3.97B | $3.77B | $3.69B | $4.16B |
| Minority Interest | $- | $- | $- | $- | $- |
| Total Liabilities and Total Equity | $3.42B | $3.97B | $3.77B | $3.69B | $4.16B |
| Total Investments | $3.40M | $1.33M | $72.45M | $49.23M | $50.32M |
| Total Debt | $929.95M | $1.70B | $1.71B | $1.27B | $1.74B |
| Net Debt | $500.93M | $1.52B | $1.56B | $1.11B | $1.45B |
Balance Sheet Charts
| Breakdown | March 31, 2024 | December 31, 2023 | September 30, 2023 | June 30, 2023 | March 31, 2023 | December 31, 2022 | September 30, 2022 | June 30, 2022 | March 31, 2022 | December 31, 2021 | September 30, 2021 | June 30, 2021 | March 31, 2021 | December 31, 2020 | September 30, 2020 | June 30, 2020 | March 31, 2020 | December 31, 2019 | September 30, 2019 | June 30, 2019 |
|---|---|---|---|---|---|---|---|---|---|---|---|---|---|---|---|---|---|---|---|---|
| Cash and Cash Equivalents | $508.85M | $429.02M | $160.40M | $164.53M | $209.25M | $179.93M | $203.67M | $277.22M | $169.58M | $152.53M | $162.20M | $182.68M | $149.70M | $161.48M | $161.60M | $280.31M | $312.16M | $296.95M | $183.73M | $203.64M |
| Short Term Investments | $- | $- | $- | $- | $- | $-92.00K | $- | $- | $- | $- | $- | $- | $- | $- | $- | $- | $- | $- | $- | $- |
| Cash and Short Term Investments | $508.85M | $429.02M | $160.40M | $164.53M | $209.25M | $179.93M | $203.67M | $277.22M | $169.58M | $152.53M | $162.20M | $182.68M | $149.70M | $161.48M | $161.60M | $280.31M | $312.16M | $296.95M | $183.73M | $203.64M |
| Net Receivables | $305.77M | $287.86M | $386.46M | $412.50M | $388.08M | $367.03M | $309.41M | $235.10M | $269.36M | $237.84M | $436.18M | $229.22M | $233.37M | $214.62M | $278.02M | $437.57M | $348.46M | $309.21M | $245.54M | $221.51M |
| Inventory | $30.34M | $22.49M | $33.90M | $43.26M | $44.69M | $41.64M | $68.88M | $47.65M | $93.97M | $69.03M | $26.58M | $73.18M | $33.83M | $75.78M | $92.99M | $130.90M | $144.10M | $183.38M | $222.21M | $146.18M |
| Other Current Assets | $80.25M | $892.36M | $- | $27.11M | $- | $18.46M | $94.14M | $78.73M | $194.89M | $- | $- | $- | $- | $- | $- | $- | $7.24M | $12.71M | $- | $45.29M |
| Total Current Assets | $925.22M | $739.37M | $580.76M | $647.40M | $642.01M | $607.06M | $676.10M | $638.70M | $727.80M | $459.41M | $624.96M | $485.08M | $416.90M | $451.87M | $532.61M | $848.78M | $811.96M | $802.25M | $651.48M | $616.61M |
| Property Plant Equipment Net | $2.72B | $1.77B | $3.38B | $3.38B | $3.38B | $3.31B | $3.31B | $3.39B | $2.99B | $3.18B | $3.20B | $3.20B | $3.26B | $3.13B | $3.09B | $3.16B | $3.25B | $3.24B | $3.33B | $3.42B |
| Goodwill | $- | $11.69K | $22.86K | $3.57K | $37.36K | $-44.26K | $-6.27K | $-40.42K | $- | $- | $- | $- | $- | $- | $- | $- | $- | $- | $- | $- |
| Intangible Assets | $17.24M | $14.19M | $14.56M | $14.99M | $15.34M | $15.79M | $16.16M | $16.61M | $- | $- | $- | $- | $- | $162.00K | $- | $- | $204.00K | $39.00K | $48.00K | $49.00K |
| Goodwill and Intangible Assets | $17.24M | $14.19M | $14.58M | $14.99M | $15.37M | $15.75M | $16.15M | $16.57M | $158.00K | $186.00K | $138.00K | $160.00K | $182.00K | $162.00K | $184.00K | $190.00K | $204.00K | $39.00K | $48.00K | $49.00K |
| Long Term Investments | $13.28M | $3.40M | $1.42M | $1.42M | $1.42M | $1.42M | $3.20M | $2.13M | $81.69M | $72.45M | $66.52M | $62.04M | $56.56M | $49.23M | $61.51M | $58.54M | $53.23M | $50.32M | $42.91M | $40.46M |
| Tax Assets | $5.76M | $279.77K | $295.00K | $4.94M | $5.56M | $1.40M | $1.41M | $1.52M | $1.54M | $1.55M | $2.23M | $2.48M | $2.08M | $1.36M | $1.77M | $1.96M | $2.37M | $2.71M | $2.85M | $4.26M |
| Other Non-Current Assets | $67.09M | $891.01M | $29.52M | $30.37M | $28.60M | $34.83M | $38.77M | $40.30M | $63.94M | $111.28M | $108.67M | $112.38M | $116.99M | $114.11M | $120.94M | $126.77M | $140.85M | $142.17M | $71.43M | $76.55M |
| Total Non-Current Assets | $2.82B | $2.68B | $3.42B | $3.43B | $3.44B | $3.36B | $3.37B | $3.45B | $3.14B | $3.31B | $3.33B | $3.32B | $3.38B | $3.23B | $3.21B | $3.28B | $3.38B | $3.36B | $3.41B | $3.50B |
| Other Assets | $- | $1 | $- | $- | $- | $- | $- | $- | $- | $- | $- | $- | $- | $- | $- | $- | $- | $- | $- | $- |
| Total Assets | $3.74B | $3.42B | $4.00B | $4.08B | $4.08B | $3.97B | $4.05B | $4.09B | $3.87B | $3.77B | $3.95B | $3.81B | $3.79B | $3.69B | $3.75B | $4.13B | $4.19B | $4.16B | $4.07B | $4.12B |
| Account Payables | $211.54M | $123.91M | $113.22M | $155.05M | $105.14M | $90.47M | $128.15M | $40.79M | $103.16M | $83.91M | $99.04M | $91.88M | $100.61M | $85.15M | $77.15M | $144.52M | $99.46M | $94.41M | $102.34M | $30.59M |
| Short Term Debt | $415.65M | $295.40M | $210.12M | $233.06M | $178.42M | $157.65M | $195.39M | $180.04M | $275.52M | $236.49M | $493.68M | $356.69M | $170.12M | $117.59M | $193.20M | $179.61M | $247.42M | $221.21M | $243.83M | $299.38M |
| Tax Payables | $5.87M | $4.76M | $2.50M | $1.58M | $6.85M | $5.93M | $5.66M | $4.15M | $528.00K | $366.00K | $936.00K | $959.00K | $930.00K | $629.00K | $739.00K | $729.00K | $485.00K | $49.00K | $122.00K | $172.00K |
| Deferred Revenue | $6.19M | $17.36M | $- | $- | $- | $17.54M | $- | $7.42M | $- | $7.54M | $- | $- | $- | $13.14M | $- | $- | $- | $17.78M | $- | $14.89M |
| Other Current Liabilities | $-5.26M | $-16.68M | $316.00K | $308.00K | $301.00K | $-17.25M | $287.00K | $72.50M | $270.00K | $-7.28M | $253.00K | $244.00K | $236.00K | $-12.91M | $318.00K | $325.00K | $333.00K | $-17.39M | $302.00K | $58.03M |
| Total Current Liabilities | $633.99M | $424.40M | $326.16M | $390.00M | $290.71M | $254.34M | $329.49M | $304.90M | $379.47M | $321.03M | $593.90M | $449.77M | $271.90M | $203.59M | $271.41M | $325.18M | $347.69M | $316.05M | $346.59M | $403.05M |
| Long Term Debt | $1.17B | $631.18M | $1.58B | $1.55B | $1.45B | $1.54B | $1.77B | $1.85B | $1.55B | $1.48B | $1.32B | $1.20B | $1.27B | $1.16B | $1.05B | $1.24B | $1.29B | $1.52B | $1.55B | $1.51B |
| Deferred Revenue Non-Current | $-110.00K | $- | $- | $- | $- | $- | $- | $451.00K | $- | $503.00K | $- | $- | $- | $508.00K | $- | $- | $- | $414.00K | $- | $399.00K |
| Deferred Tax Liabilities Non-Current | $110.00K | $- | $- | $- | $- | $- | $- | $- | $- | $- | $- | $- | $- | $- | $- | $- | $- | $- | $- | $- |
| Other Non-Current Liabilities | $1.97M | $5.97M | $1.99M | $2.39M | $4.12M | $2.64M | $4.36M | $11.02M | $9.71M | $10.72M | $14.39M | $15.35M | $14.61M | $15.53M | $15.32M | $15.10M | $14.88M | $12.87M | $11.28M | $9.94M |
| Total Non-Current Liabilities | $1.17B | $636.63M | $1.59B | $1.55B | $1.45B | $1.54B | $1.77B | $1.86B | $1.56B | $1.49B | $1.33B | $1.22B | $1.28B | $1.17B | $1.07B | $1.26B | $1.31B | $1.54B | $1.56B | $1.52B |
| Other Liabilities | $- | $1 | $- | $- | $- | $- | $- | $- | $- | $- | $- | $- | $- | $- | $- | $- | $- | $- | $- | $- |
| Total Liabilities | $1.80B | $1.06B | $1.91B | $1.94B | $1.74B | $1.80B | $2.10B | $2.17B | $1.94B | $1.81B | $1.93B | $1.67B | $1.55B | $1.38B | $1.34B | $1.58B | $1.65B | $1.85B | $1.91B | $1.92B |
| Preferred Stock | $- | $- | $- | $- | $- | $- | $- | $- | $- | $- | $- | $- | $- | $- | $- | $- | $- | $- | $- | $- |
| Common Stock | $239.15M | $238.95M | $239.15M | $239.15M | $239.15M | $239.15M | $239.15M | $239.15M | $239.15M | $239.15M | $239.15M | $239.15M | $239.15M | $239.15M | $239.15M | $239.15M | $239.15M | $239.15M | $239.15M | $239.15M |
| Retained Earnings | $506.19M | $807.25M | $518.55M | $564.31M | $556.53M | $385.98M | $151.43M | $132.02M | $136.93M | $180.14M | $250.67M | $368.46M | $463.95M | $540.25M | $617.05M | $667.60M | $644.86M | $420.06M | $266.64M | $302.70M |
| Accumulated Other Comprehensive Income Loss | $2.15M | $1.37M | $30.03M | $31.53M | $26.23M | $33.03M | $32.66M | $21.42M | $17.71M | $2.85M | $-1.62M | $-2.16M | $-1.57M | $-6.52M | $-6.98M | $-7.56M | $-7.53M | $-4.28M | $-5.18M | $-7.42M |
| Other Total Stockholders Equity | $1.19B | $1.31B | $1.31B | $1.31B | $1.52B | $1.52B | $1.52B | $1.53B | $1.54B | $1.54B | $1.54B | $1.54B | $1.54B | $1.54B | $1.56B | $1.65B | $1.66B | $1.66B | $1.66B | $1.66B |
| Total Stockholders Equity | $1.94B | $2.36B | $2.09B | $2.14B | $2.34B | $2.17B | $1.94B | $1.92B | $1.93B | $1.96B | $2.03B | $2.14B | $2.24B | $2.31B | $2.41B | $2.55B | $2.53B | $2.31B | $2.16B | $2.20B |
| Total Equity | $1.94B | $2.36B | $2.09B | $2.14B | $2.34B | $2.17B | $1.94B | $1.92B | $1.93B | $1.96B | $2.03B | $2.14B | $2.24B | $2.31B | $2.41B | $2.55B | $2.53B | $2.31B | $2.16B | $2.20B |
| Total Liabilities and Stockholders Equity | $3.74B | $3.42B | $4.00B | $4.08B | $4.08B | $3.97B | $4.05B | $4.09B | $3.87B | $3.77B | $3.95B | $3.81B | $3.79B | $3.69B | $3.75B | $4.13B | $4.19B | $4.16B | $4.07B | $4.12B |
| Minority Interest | $- | $- | $- | $- | $- | $- | $- | $- | $- | $- | $- | $- | $- | $- | $- | $- | $- | $- | $- | $- |
| Total Liabilities and Total Equity | $3.74B | $3.42B | $4.00B | $4.08B | $4.08B | $3.97B | $4.05B | $4.09B | $3.87B | $3.77B | $3.95B | $3.81B | $3.79B | $3.69B | $3.75B | $4.13B | $4.19B | $4.16B | $4.07B | $4.12B |
| Total Investments | $13.28M | $3.40M | $1.42M | $1.42M | $1.42M | $1.33M | $3.20M | $2.13M | $81.69M | $72.45M | $66.52M | $62.04M | $56.56M | $49.23M | $61.51M | $58.54M | $53.23M | $50.32M | $42.91M | $40.46M |
| Total Debt | $1.58B | $929.95M | $1.79B | $1.78B | $1.62B | $1.70B | $1.96B | $2.03B | $1.82B | $1.71B | $1.81B | $1.56B | $1.44B | $1.27B | $1.25B | $1.42B | $1.54B | $1.74B | $1.79B | $1.81B |
| Net Debt | $1.07B | $500.93M | $1.63B | $1.61B | $1.41B | $1.52B | $1.76B | $1.75B | $1.65B | $1.56B | $1.65B | $1.37B | $1.29B | $1.11B | $1.09B | $1.14B | $1.23B | $1.45B | $1.61B | $1.60B |
Annual Cash Flow
| Breakdown | December 31, 2023 | December 31, 2022 | December 31, 2021 | December 31, 2020 | December 31, 2019 |
|---|---|---|---|---|---|
| Net Income | $875.98M | $203.25M | $-338.78M | $472.77M | $112.23M |
| Depreciation and Amortization | $225.67M | $222.60M | $344.99M | $319.75M | $337.70M |
| Deferred Income Tax | $1.15M | $2.80M | $-427.00K | $1.94M | $602.00K |
| Stock Based Compensation | $3.94M | $-562.00K | $1.31M | $-1.20M | $2.46M |
| Change in Working Capital | $108.10M | $-82.73M | $-20.50M | $180.58M | $-165.42M |
| Accounts Receivables | $42.79M | $-105.54M | $-25.48M | $85.83M | $-41.00M |
| Inventory | $19.53M | $27.39M | $6.75M | $107.60M | $-161.12M |
| Accounts Payables | $17.70M | $-1.32M | $-1.22M | $4.49M | $6.47M |
| Other Working Capital | $28.08M | $-3.26M | $-549.00K | $-17.35M | $30.23M |
| Other Non Cash Items | $15.32M | $-89.81M | $80.61M | $70.06M | $99.23M |
| Net Cash Provided by Operating Activities | $854.90M | $255.55M | $-25.30M | $955.37M | $271.99M |
| Investments in Property Plant and Equipment | $-345.75M | $-540.24M | $-413.32M | $-225.41M | $-8.05M |
| Acquisitions Net | $1.23B | $363.27M | $53.70M | $4.00M | $-4.00M |
| Purchases of Investments | $- | $-396.72M | $-55.86M | $-28.38M | $-31.81M |
| Sales Maturities of Investments | $- | $33.45M | $2.16M | $28.38M | $31.81M |
| Other Investing Activities | $1.74M | $381.39M | $60.07M | $104.30M | $55.80M |
| Net Cash Used for Investing Activities | $887.88M | $-158.84M | $-353.25M | $-117.11M | $43.75M |
| Debt Repayment | $- | $- | $- | $- | $- |
| Common Stock Issued | $- | $1.10M | $- | $893.83M | $1.22B |
| Common Stock Repurchased | $- | $-1.10M | $- | $-118.49M | $-30.96M |
| Dividends Paid | $-630.54M | $-24.22M | $-24.21M | $-352.04M | $-26.02M |
| Other Financing Activities | $-830.35M | $-38.67M | $398.11M | $-647.66M | $-165.17M |
| Net Cash Used Provided by Financing Activities | $-1.46B | $-62.90M | $373.89M | $-985.29M | $-191.19M |
| Effect of Forex Changes on Cash | $3.27M | $-6.41M | $-4.29M | $11.55M | $-733.00K |
| Net Change in Cash | $248.58M | $27.40M | $-8.95M | $-135.48M | $123.82M |
| Cash at End of Period | $429.02M | $179.93M | $152.53M | $161.48M | $296.95M |
| Cash at Beginning of Period | $180.43M | $152.53M | $161.48M | $296.95M | $173.13M |
| Operating Cash Flow | $854.90M | $255.55M | $-25.30M | $955.37M | $271.99M |
| Capital Expenditure | $-345.75M | $-540.24M | $-413.32M | $-225.41M | $-8.05M |
| Free Cash Flow | $509.15M | $-284.69M | $-438.62M | $729.96M | $263.94M |
Cash Flow Charts
| Breakdown | March 31, 2024 | December 31, 2023 | September 30, 2023 | June 30, 2023 | March 31, 2023 | December 31, 2022 | September 30, 2022 | June 30, 2022 | March 31, 2022 | December 31, 2021 | September 30, 2021 | June 30, 2021 | March 31, 2021 | December 31, 2020 | September 30, 2020 | June 30, 2020 | March 31, 2020 | December 31, 2019 | September 30, 2019 | June 30, 2019 |
|---|---|---|---|---|---|---|---|---|---|---|---|---|---|---|---|---|---|---|---|---|
| Net Income | $495.25M | $421.71M | $114.58M | $161.82M | $175.05M | $235.08M | $16.45M | $-4.90M | $-43.37M | $-72.18M | $-105.91M | $-89.68M | $-71.01M | $-58.67M | $46.20M | $259.63M | $225.61M | $154.16M | $-22.90M | $-38.56M |
| Depreciation and Amortization | $40.24M | $50.72M | $59.72M | $55.62M | $56.28M | $57.55M | $58.79M | $53.65M | $52.60M | $85.98M | $87.79M | $87.37M | $83.86M | $77.85M | $80.11M | $79.47M | $82.31M | $84.56M | $84.60M | $84.69M |
| Deferred Income Tax | $-208.00K | $1.15M | $6.99M | $1.46M | $-3.28M | $729.00K | $7.00M | $-4.96M | $37.00K | $797.00K | $294.00K | $-807.00K | $-711.00K | $419.00K | $207.00K | $704.00K | $614.00K | $1.20M | $1.40M | $-1.55M |
| Stock Based Compensation | $- | $3.94M | $- | $-851.00K | $- | $-562.00K | $- | $3.46M | $-54.85M | $-21.65M | $-22.78M | $-32.13M | $-14.64M | $-9.24M | $-17.76M | $-35.09M | $-27.64M | $-27.83M | $-43.42M | $-24.20M |
| Change in Working Capital | $91.55M | $112.30M | $2.27M | $-3.23M | $-3.15M | $-70.76M | $-47.18M | $67.50M | $-32.28M | $-56.77M | $40.69M | $-41.17M | $36.75M | $79.33M | $182.38M | $-80.79M | $-348.00K | $-13.94M | $-83.23M | $-45.18M |
| Accounts Receivables | $52.12M | $54.96M | $27.98M | $-29.95M | $4.10M | $-62.28M | $-28.57M | $-2.77M | $-11.93M | $-8.51M | $-11.09M | $-52.00K | $-5.83M | $63.95M | $128.47M | $-116.37M | $9.78M | $-33.51M | $-8.74M | $1.96M |
| Inventory | $3.20M | $11.62M | $9.36M | $1.43M | $-3.05M | $27.23M | $-21.23M | $46.32M | $-24.93M | $-42.45M | $46.60M | $-39.34M | $41.95M | $17.21M | $37.90M | $13.20M | $39.28M | $61.09M | $-76.03M | $-104.61M |
| Accounts Payables | $-2.56M | $11.09M | $-38.06M | $23.93M | $20.61M | $-50.58M | $34.49M | $527.00K | $14.25M | $-7.61M | $57.00K | $-416.00K | $6.76M | $2.47M | $-483.00K | $-4.73M | $7.24M | $1.07M | $-8.92M | $-2.33M |
| Other Working Capital | $-43.28M | $34.62M | $3.00M | $1.36M | $-24.81M | $14.87M | $-31.88M | $23.42M | $-9.68M | $1.80M | $5.13M | $-1.36M | $-6.12M | $-4.30M | $16.50M | $27.11M | $-56.65M | $-42.58M | $10.46M | $59.79M |
| Other Non Cash Items | $15.44M | $-297.58M | $26.58M | $29.68M | $-21.82M | $-53.73M | $-9.20M | $28.21M | $33.66M | $-1.56M | $-69.00K | $-10.70M | $1.74M | $7.89M | $-2.04M | $-19.08M | $-6.45M | $-6.92M | $-12.48M | $-665.00K |
| Net Cash Provided by Operating Activities | $226.15M | $264.53M | $148.90M | $226.00M | $203.08M | $168.31M | $25.86M | $105.59M | $-44.21M | $-43.74M | $22.80M | $-54.98M | $50.62M | $106.82M | $306.86M | $239.94M | $301.75M | $219.06M | $-32.60M | $-1.27M |
| Investments in Property Plant and Equipment | $-140.07M | $-72.88M | $-57.96M | $-77.55M | $-131.63M | $-74.25M | $-21.37M | $-382.06M | $-62.56M | $-60.67M | $-87.61M | $-37.73M | $-227.31M | $-90.03M | $-10.75M | $-23.80M | $-100.84M | $-3.47M | $-163.00K | $-1.16M |
| Acquisitions Net | $128.82M | $1.14B | $52.73M | $-291.43K | $40.93M | $164.93M | $3.96M | $177.37M | $- | $- | $- | $- | $- | $- | $- | $- | $- | $- | $- | $- |
| Purchases of Investments | $- | $- | $- | $- | $- | $10.23M | $-204.38K | $-9.80M | $- | $- | $- | $- | $- | $- | $- | $- | $- | $- | $- | $- |
| Sales Maturities of Investments | $- | $- | $- | $- | $- | $597.45K | $656.14K | $28.89M | $- | $- | $- | $- | $- | $- | $- | $- | $- | $- | $- | $- |
| Other Investing Activities | $-1.15B | $389.31K | $1.55M | $716.43K | $108.56K | $-16.48M | $-3.90M | $8.38M | $16.76M | $4.88M | $2.00M | $17.39M | $35.68M | $19.72M | $2.94M | $64.12M | $21.31M | $-39.33M | $39.42M | $9.38M |
| Net Cash Used for Investing Activities | $-10.05M | $1.06B | $-3.68M | $-77.13M | $-90.59M | $85.03M | $-20.86M | $-177.21M | $-45.80M | $-55.72M | $-85.60M | $-20.34M | $-191.59M | $-70.30M | $-7.79M | $40.32M | $-79.34M | $-42.80M | $39.27M | $8.23M |
| Debt Repayment | $- | $- | $- | $- | $- | $- | $- | $- | $- | $- | $- | $- | $- | $- | $- | $- | $- | $- | $- | $- |
| Common Stock Issued | $- | $- | $-1.47M | $1.52M | $- | $18.00K | $21.61K | $1.04M | $- | $- | $- | $- | $- | $- | $- | $- | $- | $- | $671.27M | $- |
| Common Stock Repurchased | $-114.89M | $- | $-1.50M | $- | $- | $-18.00K | $-21.61K | $- | $- | $- | $- | $- | $- | $-18.49M | $-94.80M | $- | $- | $- | $-11.36M | $-2.97M |
| Dividends Paid | $-15.76M | $-120.99M | $-162.88M | $-340.97M | $-5.70M | $-6.04M | $-6.06M | $-12.12M | $-2.00K | $-6.05M | $-6.05M | $-6.05M | $-6.06M | $-18.35M | $-148.81M | $-184.87M | $-3.00K | $-12.99M | $-6.00K | $-13.00M |
| Other Financing Activities | $-119.45M | $-914.35M | $16.71M | $146.33M | $-79.04M | $-274.26M | $-68.04M | $195.92M | $107.71M | $96.96M | $49.69M | $114.03M | $137.42M | $-39.16M | $-275.91M | $-125.67M | $-206.92M | $-50.34M | $-25.83M | $31.36M |
| Net Cash Used Provided by Financing Activities | $-135.21M | $-1.04B | $-146.17M | $-194.64M | $-84.74M | $-280.30M | $-74.10M | $183.80M | $107.71M | $90.91M | $43.64M | $107.98M | $131.37M | $-43.09M | $-424.73M | $-310.55M | $-206.92M | $-63.34M | $-25.83M | $18.36M |
| Effect of Forex Changes on Cash | $-1.42M | $3.83M | $-3.18M | $1.05M | $1.57M | $3.22M | $-4.44M | $-4.54M | $-646.00K | $-1.12M | $-1.31M | $317.00K | $-2.18M | $6.45M | $6.95M | $-1.57M | $-282.00K | $295.00K | $-741.00K | $-147.00K |
| Net Change in Cash | $79.48M | $268.87M | $-4.13M | $-44.72M | $29.32M | $-23.74M | $-73.55M | $107.64M | $17.05M | $-9.67M | $-20.48M | $32.98M | $-11.78M | $-122.00K | $-118.71M | $-31.85M | $15.21M | $113.22M | $-19.91M | $25.18M |
| Cash at End of Period | $508.85M | $429.02M | $160.40M | $164.53M | $209.25M | $179.93M | $203.67M | $277.22M | $169.58M | $152.53M | $162.20M | $182.68M | $149.70M | $161.48M | $161.60M | $280.31M | $312.16M | $296.95M | $183.73M | $203.64M |
| Cash at Beginning of Period | $429.37M | $160.15M | $164.53M | $209.25M | $179.93M | $203.67M | $277.22M | $169.58M | $152.53M | $162.20M | $182.68M | $149.70M | $161.48M | $161.60M | $280.31M | $312.16M | $296.95M | $183.73M | $203.64M | $178.46M |
| Operating Cash Flow | $226.15M | $264.53M | $148.90M | $226.00M | $203.08M | $168.31M | $25.86M | $105.59M | $-44.21M | $-43.74M | $22.80M | $-54.98M | $50.62M | $106.82M | $306.86M | $239.94M | $301.75M | $219.06M | $-32.60M | $-1.27M |
| Capital Expenditure | $-140.07M | $-72.88M | $-57.96M | $-77.55M | $-131.63M | $-74.25M | $-21.37M | $-382.06M | $-62.56M | $-60.67M | $-87.61M | $-37.73M | $-227.31M | $-90.03M | $-10.75M | $-23.80M | $-100.84M | $-3.47M | $-163.00K | $-1.16M |
| Free Cash Flow | $86.09M | $191.65M | $90.94M | $148.45M | $71.45M | $94.06M | $4.49M | $-276.47M | $-106.77M | $-104.41M | $-64.81M | $-92.71M | $-176.69M | $16.79M | $296.11M | $216.14M | $200.91M | $215.59M | $-32.77M | $-2.42M |

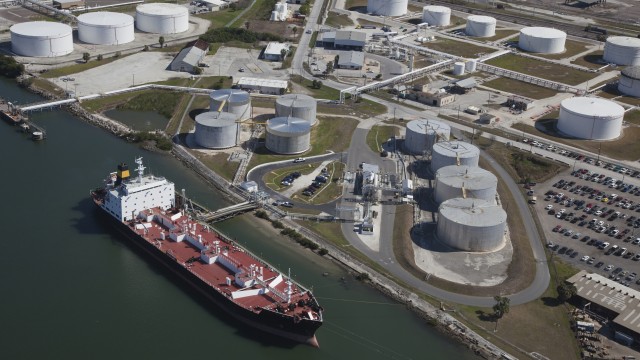
Euronav NV, together with its subsidiaries, engages in the transportation and storage of crude oil worldwide. The company also offers floating, storage, and offloading (FSO) services. As of April 1, 2022, it owned and operated a fleet of 72 vessels, including 6 chartered-in vessels with an aggregate carrying capacity of approximately 18.5 million deadweight tons consisting of 41 very large crude carriers, 2 V-plus, 27 Suezmax vessels, and 2 FSO vessels. The company was incorporated in 2003 and is headquartered in Antwerp, Belgium.
$16.74
Stock Price
$3.25B
Market Cap
500
Employees
Antwerp, None
Location
Revenue (FY 2023)
$1.26B
47.5% YoY
Net Income (FY 2023)
$858.03M
322.2% YoY
EPS (FY 2023)
$4.34
325.5% YoY
Free Cash Flow (FY 2023)
$509.15M
278.8% YoY
Profitability
Gross Margin
51.5%
Net Margin
68.0%
ROE
36.4%
ROA
25.1%
Valuation
P/E Ratio
4.14
P/S Ratio
2.82
EV/EBITDA
4.99
Market Cap
$3.25B
Revenue & Net Income
Profit Margins
Cash Flow Summary
Operating Cash Flow
$854.90M
234.5% YoY
Free Cash Flow
$509.15M
278.8% YoY
Balance Sheet Summary
Total Assets
$3.42B
-13.9% YoY
Total Debt
$929.95M
45.2% YoY
Shareholder Equity
$2.36B
8.3% YoY
Dividend Overview
$0.07
Latest Dividend
%
Dividend Yield
%
Payout Ratio
Recent Dividend History
| Date | Amount | Type |
|---|---|---|
| 2024-07-09 | $0.07 | July 09, 24 |
| 2024-05-22 | $4.57 | May 22, 24 |
| 2023-12-12 | $0.57 | December 12, 23 |
| 2023-09-06 | $0.80 | September 06, 23 |
| 2023-06-08 | $0.70 | June 08, 23 |
| 2023-06-01 | $1.09 | June 01, 23 |
| 2023-02-21 | $0.03 | February 21, 23 |
| 2022-11-21 | $0.03 | November 21, 22 |
| 2022-08-30 | $0.03 | August 30, 22 |
| 2022-06-01 | $0.06 | June 01, 22 |
Euronav NV Dividends
Explore Euronav NV's dividend history, including dividend yield, payout ratio, and historical payments.
Dividend Yield
17.75%
Dividend Payout Ratio
73.49%
Dividend Paid & Capex Coverage Ratio
0.88x
Euronav NV Dividend History
| Dividend | Adjusted Dividend | Date | Record Date | Payment Date | Declaration Date |
|---|---|---|---|---|---|
| $0.07 | $0.07 | July 09, 2024 | July 10, 2024 | July 18, 2024 | July 04, 2024 |
| $4.57 | $4.57 | May 22, 2024 | May 23, 2024 | May 31, 2024 | April 04, 2024 |
| $0.57 | $0.57 | December 12, 2023 | December 13, 2023 | December 20, 2023 | November 29, 2023 |
| $0.8 | $0.8 | September 06, 2023 | September 07, 2023 | September 19, 2023 | August 03, 2023 |
| $0.7 | $0.7 | June 08, 2023 | June 09, 2023 | June 20, 2023 | May 30, 2023 |
| $1.08759 | $1.08759 | June 01, 2023 | June 02, 2023 | June 13, 2023 | May 25, 2023 |
| $0.02989385 | $0.02989385 | February 21, 2023 | February 22, 2023 | March 02, 2023 | February 16, 2023 |
| $0.03 | $0.03000205 | November 21, 2022 | November 22, 2022 | November 29, 2022 | November 17, 2022 |
| $0.03 | $0.03008109 | August 30, 2022 | August 31, 2022 | September 09, 2022 | August 09, 2022 |
| $0.06 | $0.05990607 | June 01, 2022 | June 02, 2022 | June 08, 2022 | |
| $0.06 | $0.06 | May 27, 2022 | May 31, 2022 | June 08, 2022 | May 23, 2022 |
| $0.03 | $0.03 | November 22, 2021 | November 23, 2021 | November 30, 2021 | November 04, 2021 |
| $0.03 | $0.03 | August 30, 2021 | August 31, 2021 | September 08, 2021 | August 12, 2021 |
| $0.03 | $0.03 | May 20, 2021 | May 21, 2021 | June 03, 2021 | May 06, 2021 |
| $0.03 | $0.03 | February 24, 2021 | February 25, 2021 | March 05, 2021 | February 04, 2021 |
| $0.09 | $0.09 | November 19, 2020 | November 20, 2020 | November 30, 2020 | November 10, 2020 |
| $0.47 | $0.47 | August 18, 2020 | August 19, 2020 | August 28, 2020 | January 01, 1900 |
| $0.81 | $0.81 | June 15, 2020 | June 16, 2020 | June 26, 2020 | May 14, 2020 |
| $0.29 | $0.29 | May 28, 2020 | May 29, 2020 | June 09, 2020 | April 06, 2020 |
| $0.06 | $0.06 | September 26, 2019 | September 27, 2019 | October 08, 2019 | September 18, 2019 |
Euronav NV News
Read the latest news about Euronav NV, including recent articles, headlines, and updates.
Euronav flags US politics, China economy as risks to shipping momentum
Euronav expects a rise global sea trade this year driven by the rerouting of Red Sea shipping though a change in the U.S. presidency and a slowdown in China's economy are risk factors, the Belgian oil tanker company said on Thursday.


Euronav NV (EURN) Q1 2024 Earnings Call Transcript
Euronav NV [EURN] Q1 2024 Earnings Conference Call May 8, 2024 8:00 AM ET Company Participants Alexander Saverys - CEO Ludovic Saverys - CFO Conference Call Participants Luuk van Beek - Degroof Petercam Kristof Samoy - KBC Securities Quirijn Mulder - ING Alexander Saverys Welcome to the earnings call of Euronav and CMB.TECH. My name is Alexander Saverys.

65 Graham Value Stocks: 54 Fit To Buy For April
Large Cap Value is a value ranking for large cap stocks that looks at the price of a stock relative to measurements of intrinsic firm value. The Ben Graham Formula strategy selects ultra-stable stocks based on criteria such as sales, earnings, and dividend payments. 54 out of 65 All-Star-Value Dividend stocks offer annual dividends that exceed their price per share.

68 Graham Value Stocks, 57 Fit To Buy In March
Large Cap Value ranking from YCharts identifies stocks with low prices relative to their assets and profits. Ben Graham Formula strategy selects stable stocks with strong earnings and dividends based on Graham's book "The Intelligent Investor". 57 out of 68 All-Star-Value Dividend stocks offer annual dividends exceeding their price per share.


54 Ideal Value Dogs For February
Large Cap Value is a value ranking strategy that looks at the price of a stock relative to measurements of intrinsic firm value. The Ben Graham Formula strategy selects ultra-stable stocks based on a screen in Graham's book, "The Intelligent Investor." 54 out of 69 All-Star-Value Dividend stocks offer annual dividends exceeding their price per share.

11 Stocks Michael Burry Was Buying and Selling in Q4
Michael Burry, the infamous investor known for being one of the first to bet against the housing market ahead of the 2008 financial crisis, made some big moves in Q4 2023. Indeed, Burry made hundreds of millions for his firm, Scion Asset Management, as subprime mortgage bonds started failing in the mid-2000s.


Frontline Is A Solid Buy Despite Canceled Merger With Euronav
Frontline plc is a global leader in seaborne transportation of crude oil and refined products, demonstrating adaptability and resilience in a volatile sector. The company has a solid financial base, with $715 million in cash reserves, and has shown prudence in not fully hedging its positions, allowing for potential market recoveries. The recent acquisition of Euronav tankers and the sale of old tankers demonstrate Frontline's strategic vision and position the company for long-term growth.

71 Ben Graham January Value Stocks, 56 Jazzed Buys
Large Cap Value is a value ranking strategy that looks at the price of a stock relative to measurements of intrinsic firm value. The Ben Graham Formula strategy selects ultra-stable stocks based on a screen in Graham's book, "The Intelligent Investor." 56 out of 71 All-Star-Value Dividend stocks offer annual dividends exceeding their price per share.


Euronav And Frontline: Lessons From The Shipping Industry
The Tanker industry has seen a resurgence in recent months due to geopolitical events and rising oil prices. Euronav NV has a takeover bid from its largest shareholder, CMB. Frontline plc is acquiring 24 VLCCs from Euronav NV and is poised to benefit from the transaction.
68 Ben Graham November Value Stocks: 58 Notorious Buys
“Value ranking, looks at the price of a stock relative to intrinsic firm value. Graham Value Stocks match the criteria Benjamin Graham followed. “—YCharts Value Screener. 68 November Value large caps and Graham formula-derived results reflect established value-stock detection-criteria. Of those, 58 met the dogcatcher-Notorious-ideal of dividends from $1K invested exceeding their single-share-stock-prices. Representing eight-of-eleven Morningstar Sectors, all 58 ideal value-picks pay regular-dividends. Broker-target-top-ten net-gains ranged 38.29%-81.03%, topped by SBSW & SQM, as-of 10/23/23.

FRO – Investor Presentation – Fully funded acquisition of 24 modern VLCCs from Euronav NV
Frontline plc. will host an investor presentation in relation with the announcement «Fully funded acquisition of 24 modern VLCCs from Euronav NV» today, Monday October 9, 2023. A webcast and conference call will be held today at 3:00 p.m. CET (9:00 a.m. U.S. Eastern Time). The presentation will be available for download from the Investor Relations section at www.frontlineplc.cy ahead of the conference call.

FRO – Fully funded acquisition of 24 modern VLCCs from Euronav NV
Frontline plc (“Frontline”) (NYSE and OSE: FRO), today announced that as an integrated solution to the strategic and structural deadlock in Euronav NV (“Euronav”), Frontline has entered into agreements with Euronav to acquire a high-quality ECO fleet of 24 VLCCs with an average age of 5.3 years, for an aggregate purchase price of USD 2,350 million (the “Acquisition”). The Acquisition is fully funded through the sale of Frontline's shares in Euronav to CMB NV (“CMB”) and an attractive debt package as described below.

FRO – Reference to stock announcement by Euronav BV
With reference to the stock announcement by Euronav BV (“Euronav”) on 5 October 2023, Frontline plc (“Frontline” or the “Company”) confirms that Frontline, CMB NV (“CMB”) and Euronav, are in discussions on an integrated solution to the strategic and structural deadlock in Euronav. The potential transaction, which is subject to board approval and documentation, comprises the following interdependent elements: Frontline would acquire a modern fleet of 24 VLCC tankers from the Euronav fleet for $2.35 billion, subject to completion of the below-mentioned share purchase and to approval by shareholders voting at a Special General Meeting of Euronav.


66 Ben Graham October Value Stocks: 56 Outrageous Buys
“Value ranking, looks at the price of a stock relative to. intrinsic firm value. Graham Value Stocks match the criteria . Benjamin Graham followed. “—YCharts Value Screener. 66 August Value large caps and Graham formula-derived results reflect established value-stock detection-criteria. Of those, 56 met the dogcatcher-outrageous-ideal of dividends from $1K invested exceeding single-share-stock-prices. Representing nine-of-eleven Morningstar Sectors, all 56 ideal value-picks pay regular-dividends. Broker-target-top-ten net-gains ranged 33.15%-84.12%, topped by PDM & SQM, as-of 9/22/23.

Euronav: The Modern Fleet Advantage In A Competitive Landscape
Euronav is a leading shipping company with a modern fleet and is expected to maintain its generous dividend payout approach. The aging global fleet and lack of new vessels in the petro-shipping industry give companies like Euronav a favorable position and the ability to command premium rates. Euronav's recent performance shows robust financial stability, with high dividends and low debt, allowing for maximum return to investors.

Euronav's Solid Financials Coupled With Upside Potential Market Outlook Lead To A Bright Future
Euronav is a leading company in the transportation of crude oil market with 100% payout ratio and 17% dividend yield. The company's financial outlook is robust, with a solid balance sheet and strong liquidity. The tanker market shows upside potential, with positive outlook for the short to medium term.

69 Ben Graham September Value Stocks: 55 Ridiculous Buys
“Value ranking looks at the price of a stock relative to intrinsic firm value. Graham Value Stocks match the criteria Benjamin Graham followed." —YCharts Value Screener. 69 August Value large caps and Graham formula-derived results reflect established value stock detection criteria. Of those, 55 met the dogcatcher ridiculous ideal of dividends from $1K invested exceeding single share stock prices. Representing nine of eleven Morningstar Sectors, all 55 ideal value picks pay regular dividends. Broker target top ten net gains ranged 31.64%-73.39%, topped by PDM & PANL, as of 8/24/23.

Euronav NV (EURN) Q2 2023 Earnings Call Transcript
Euronav NV (NYSE:EURN ) Q2 2023 Earnings Call Transcript August 3, 2023 8:00 AM ET Company Participants Brian Gallagher - Head of Investor Relations Lieve Logghe - Interim CEO, CFO and Member of the Management Board Conference Call Participants Jon Chappell - Evercore ISI Chris Robertson - Deutsche Bank Chris Tsung - Webber Research Omar Nokta - Jefferies Frode Morkedal - Clarksons Securities Ben Nolan - Stifel Thijs Berkelder - ABN AMRO ODDO BHF Sherif Elmaghrabi - BTIG Operator Good day, and welcome to the Euronav Second Quarter 2023 Earnings Call. [Operator Instructions] Please note, this event is being recorded.

70 Ben Graham August Value Stocks, 59 Absurd Buys
“Value ranking, looks at the price of a stock relative to intrinsic firm value. Graham Value Stocks match the criteria Benjamin Graham followed. “—YCharts Value Screener. 70 August Value large caps and Graham formula-derived results reflect established value stock detection criteria. Of those, 59 met our absurd ideal of dividends from $1K invested exceeding single share stock prices. Representing nine-of-eleven Morningstar Sectors, all 59 ideal value picks pay regular dividends. Broker-target-top-ten net gains ranged 27.38%-55.94%, topped by PDM & TRMD, as of 8/1/23.

51 Ideal July Value Buys From Ben Graham
“Value ranking looks at the price of a stock relative to intrinsic firm value. Graham Value Stocks match the criteria Benjamin Graham followed.“—YCharts Value Screener. Here are 64 July value large caps and Graham formula-derived results that reflect established value-stock detection-criteria. Of those, 51 met the dogcatcher-ideal of dividends from $1K invested exceeding single-share-stock-prices. Representing nine-of-eleven Morningstar Sectors, all 51 ideal value-picks pay regular-dividends. Broker-target-top-ten net-gains ranged 38.26%-104.37%, topped by SBSW & PDM, as-of 6/23/23.

54 Ideal June Value Buys From Benjamin Graham's Work
"Value ranking looks at the price of a stock relative to intrinsic firm value. Graham Value Stocks match the criteria Benjamin Graham followed." — YCharts Value Screener. 67 June value large caps and Graham formula-derived results reflect established value stock detection criteria. Of those, 54 met the dogcatcher-ideal of dividends from $1K invested exceeding single-share stock prices. Representing eight of eleven Morningstar Sectors, all 54 ideal value picks pay regular dividends. Broker-target top-ten net gains ranged 34.55%-81.13%, topped by SBSW and PDM, as of 6/8/23.

Euronav NV (EURN) Q1 2023 Earnings Call Transcript
Euronav NV (NYSE:EURN ) Q1 2023 Results Conference Call May 11, 2023 8:00 AM ET Company Participants Brian Gallagher - IR Hugo De Stoop - CEO Lieve Logghe - CFO Conference Call Participants Jon Chappell - Evercore ISI Chris Wetherbee - Citigroup Omar Nokta - Jeffries Frode Morkedal - Clarksons Securities Ben Nolan - Stifel Chris Tsung - Webber Research Greg Lewis - BTIG Thijs Berkelder - ABN AMRO Quirijn Mulder - ING Operator Hello, and welcome to Euronav Q1 2023 Earnings Conference Call. [Operator Instructions] Please note, today's event is being recorded.

Euronav NV (EURN) Q4 2022 Earnings Call Transcript
Euronav NV (NYSE:EURN ) Q4 2022 Earnings Conference Call February 2, 2023 8:00 AM ET Company Participants Brian Gallagher - Head of Investor Relations, Research & Communications Hugo De Stoop - Chief Executive Officer Lieve Logghe - Chief Financial Officer Conference Call Participants Omar Nokta - Jefferies Frode Morkedal - Clarksons Securities Jon Chappell - Evercore ISI Thijs Berkelder - ABN AMRO Chris Robertson - Deutsche Bank Chris Tsung - Webber Research & Advisory Chris Wetherbee - Citigroup Operator Good day, and welcome to the Euronav Fourth Quarter 2022 Earnings Conference Call. [Operator Instructions] Please note this event is being recorded.


Similar Companies
Related Metrics
Explore detailed financial metrics and analysis for EURN.