Fortescue Metals Group Key Executives
This section highlights Fortescue Metals Group's key executives, including their titles and compensation details.
Find Contacts at Fortescue Metals Group
(Showing 0 of )
Fortescue Metals Group Earnings
This section highlights Fortescue Metals Group's earnings, including key dates, EPS, earnings reports, and earnings call transcripts.
Next Earnings Date
Last Earnings Results
Earnings Call Transcripts
| Transcript | Quarter | Year | Date | Estimated EPS | Actual EPS |
|---|

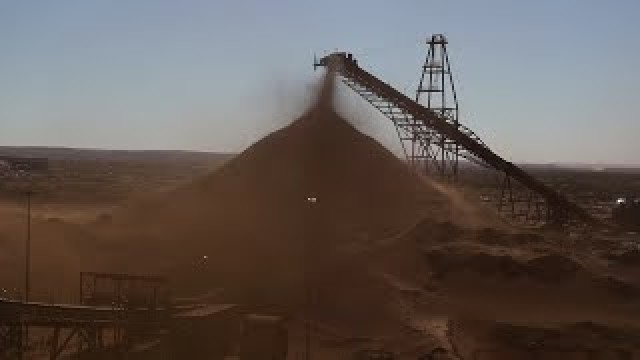
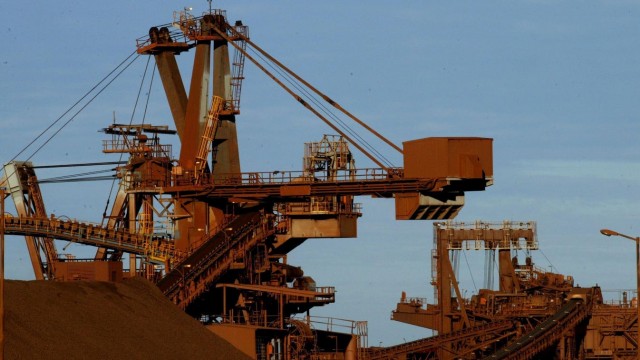
Fortescue Metals Group Limited engages in the exploration, development, production, processing, and sale of iron ore in Australia, China, and internationally. It also explores for copper and gold deposits. The company owns and operates the Chichester Hub that includes the Cloudbreak and Christmas Creek mines located in the Chichester ranges; and the Solomon Hub comprising the Firetail, Kings Valley, and Queens Valley mines located in the Hamersley ranges of Pilbara, Western Australia. It is also developing the Eliwana mine situated in the Pilbara region of Western Australia. In addition, the company holds a portfolio of properties situated in Ecuador and Argentina. Further, it provides port towage services. Fortescue Metals Group Limited was incorporated in 1983 and is headquartered in East Perth, Australia.
$19.49
Stock Price
$30.00B
Market Cap
-
Employees
East Perth, WA
Location
Financial Statements
Access annual & quarterly financial statements for Fortescue Metals Group, including income statements, balance sheets, and cash flow statements..
Annual Income Statement
| Breakdown | June 30, 2024 | June 30, 2023 | June 30, 2022 | June 30, 2021 | June 30, 2020 |
|---|---|---|---|---|---|
| Revenue | $18.11B | $16.66B | $16.49B | $22.43B | $13.25B |
| Cost of Revenue | $8.67B | $7.92B | $7.33B | $6.92B | $6.02B |
| Gross Profit | $9.44B | $8.74B | $9.16B | $15.51B | $7.24B |
| Gross Profit Ratio | 52.11% | 52.45% | 55.55% | 69.14% | 54.60% |
| Research and Development Expenses | $495.00M | $830.27M | $512.73M | $138.69M | $- |
| General and Administrative Expenses | $416.00M | $191.26M | $140.26M | $116.37M | $78.99M |
| Selling and Marketing Expenses | $- | $639.05M | $388.79M | $144.31M | $38.84M |
| Selling General and Administrative Expenses | $416.00M | $830.31M | $529.05M | $260.68M | $117.83M |
| Other Expenses | $51.00M | $93.64M | $-16.50M | $-111.12M | $49.20M |
| Operating Expenses | $1.06B | $830.31M | $529.05M | $260.68M | $117.83M |
| Cost and Expenses | $9.73B | $8.75B | $7.86B | $7.18B | $6.13B |
| Interest Income | $- | $147.11M | $13.27M | $16.10M | $51.68M |
| Interest Expense | $95.00M | $271.51M | $164.97M | $164.06M | $266.67M |
| Depreciation and Amortization | $2.14B | $1.74B | $1.53B | $1.37B | $1.40B |
| EBITDA | $10.51B | $9.63B | $10.40B | $16.62B | $8.15B |
| EBITDA Ratio | 58.05% | 57.80% | 63.06% | 74.11% | 61.53% |
| Operating Income | $8.49B | $7.91B | $8.63B | $15.25B | $7.12B |
| Operating Income Ratio | 46.88% | 47.46% | 52.34% | 67.98% | 53.71% |
| Total Other Income Expenses Net | $-189.00M | $-1.03B | $216.23M | $-372.00M | $-151.00M |
| Income Before Tax | $8.30B | $6.81B | $8.38B | $14.82B | $6.91B |
| Income Before Tax Ratio | 45.83% | 40.86% | 50.83% | 66.07% | 52.18% |
| Income Tax Expense | $2.64B | $2.06B | $2.51B | $4.46B | $2.02B |
| Net Income | $5.68B | $4.80B | $6.20B | $10.29B | $4.74B |
| Net Income Ratio | 31.38% | 28.81% | 37.59% | 45.90% | 35.73% |
| EPS | $3.70 | $1.54 | $1.91 | $3.37 | $1.59 |
| EPS Diluted | $3.69 | $1.53 | $1.90 | $3.36 | $1.59 |
| Weighted Average Shares Outstanding | 1.54B | 3.08B | 3.08B | 3.08B | 3.08B |
| Weighted Average Shares Outstanding Diluted | 1.54B | 3.08B | 3.08B | 3.09B | 3.09B |
| SEC Filing | Source | Source | Source | Source | Source |
| Breakdown | June 30, 2024 | December 31, 2023 | June 30, 2023 | December 31, 2022 | June 30, 2022 | December 31, 2021 | June 30, 2021 | December 31, 2020 | June 30, 2020 | December 31, 2019 | June 30, 2019 | December 31, 2018 | June 30, 2018 | December 31, 2017 | June 30, 2017 | December 31, 2016 | June 30, 2016 | December 31, 2015 | June 30, 2015 | December 31, 2014 |
|---|---|---|---|---|---|---|---|---|---|---|---|---|---|---|---|---|---|---|---|---|
| Revenue | $8.71B | $9.51B | $9.04B | $7.83B | $13.42B | $11.18B | $17.27B | $12.11B | $9.18B | $9.24B | $9.15B | $5.03B | $4.33B | $4.71B | $5.15B | $6.23B | $5.02B | $4.59B | $4.83B | $5.94B |
| Cost of Revenue | $4.61B | $4.07B | $3.88B | $3.94B | $5.67B | $5.14B | $4.96B | $3.99B | $4.08B | $4.17B | $3.75B | $3.52B | $3.36B | $3.13B | $3.13B | $3.44B | $3.25B | $3.63B | $4.31B | $5.02B |
| Gross Profit | $4.10B | $5.45B | $5.16B | $3.89B | $7.75B | $6.04B | $12.31B | $8.12B | $5.10B | $5.08B | $5.40B | $1.50B | $976.85M | $1.58B | $2.02B | $2.79B | $1.77B | $963.95M | $515.84M | $916.54M |
| Gross Profit Ratio | 47.11% | 57.24% | 57.10% | 49.70% | 57.74% | 54.04% | 71.30% | 67.03% | 55.52% | 54.91% | 58.99% | 29.94% | 22.54% | 33.54% | 39.17% | 44.75% | 35.22% | 20.99% | 10.68% | 15.44% |
| Research and Development Expenses | $269.82M | $224.00M | $273.00M | $280.00M | $280.99M | $220.21M | $138.69M | $- | $- | $- | $- | $- | $- | $- | $- | $- | $- | $- | $- | $- |
| General and Administrative Expenses | $230.00M | $186.00M | $148.00M | $140.00M | $94.15M | $191.31M | $90.68M | $112.84M | $89.84M | $74.11M | $76.92M | $58.21M | $52.69M | $39.73M | $36.43M | $38.80M | $20.14M | $50.81M | $81.86M | $37.88M |
| Selling and Marketing Expenses | $55.00M | $41.00M | $195.18M | $58.76M | $15.93M | $22.02M | $46.68M | $36.32M | $60.86M | $29.93M | $35.61M | $5.68M | $13.51M | $28.19M | $10.41M | $59.59M | $41.61M | $145.55M | $20.79M | $43.99M |
| Selling General and Administrative Expenses | $285.00M | $227.00M | $278.00M | $180.00M | $110.08M | $213.33M | $137.36M | $149.16M | $150.70M | $104.04M | $112.53M | $63.89M | $66.20M | $67.92M | $46.84M | $98.39M | $61.75M | $196.36M | $102.65M | $81.88M |
| Other Expenses | $16.18M | $36.00M | $- | $- | $- | $- | $- | $- | $- | $- | $- | $- | $- | $- | $- | $- | $- | $- | $- | $- |
| Operating Expenses | $571.00M | $487.00M | $1.63B | $456.00M | $548.94M | $522.99M | $421.42M | $421.52M | $237.64M | $74.11M | $18.52M | $62.47M | $414.79M | $114.05M | $160.04M | $80.38M | $158.40M | $71.40M | $150.72M | $52.55M |
| Cost and Expenses | $5.18B | $4.55B | $5.51B | $4.40B | $6.22B | $5.66B | $5.38B | $4.41B | $4.32B | $4.24B | $3.77B | $3.58B | $3.77B | $3.25B | $3.29B | $3.52B | $3.41B | $3.70B | $4.46B | $5.07B |
| Interest Income | $- | $101.21M | $86.51M | $62.24M | $7.65M | $5.94M | $4.87M | $11.67M | $24.28M | $27.74M | $16.83M | $141.97M | $195.91M | $219.14M | $248.51M | $304.88M | $366.46M | $447.65M | $391.10M | $326.29M |
| Interest Expense | $- | $194.08M | $156.30M | $118.35M | $90.88M | $78.27M | $74.94M | $91.25M | $111.88M | $154.12M | $136.63M | $- | $- | $- | $- | $- | $- | $- | $- | $- |
| Depreciation and Amortization | $1.07B | $922.00M | $727.00M | $859.00M | $980.57M | $993.69M | $757.48M | $871.58M | $885.34M | $936.36M | $876.01M | $824.85M | $874.16M | $807.35M | $807.98M | $861.97M | $828.23M | $860.97M | $970.61M | $804.11M |
| EBITDA | $4.59B | $5.92B | $5.31B | $4.28B | $5.74B | $4.76B | $9.60B | $6.73B | $3.99B | $4.13B | $4.32B | $2.26B | $1.78B | $2.31B | $2.13B | $2.55B | $1.97B | $1.61B | $1.36B | $1.62B |
| EBITDA Ratio | 52.70% | 62.27% | 58.81% | 54.64% | 42.80% | 42.56% | 55.59% | 55.58% | 43.43% | 44.74% | 47.18% | 44.92% | 40.99% | 49.06% | 41.31% | 41.01% | 39.27% | 35.11% | 28.26% | 27.32% |
| Operating Income | $3.53B | $4.96B | $4.59B | $3.42B | $7.34B | $5.56B | $12.04B | $7.86B | $4.89B | $4.96B | $5.27B | $1.43B | $902.53M | $1.51B | $1.96B | $2.68B | $1.82B | $751.11M | $393.70M | $817.55M |
| Operating Income Ratio | 40.55% | 52.12% | 50.76% | 43.68% | 54.68% | 49.69% | 69.74% | 64.88% | 53.29% | 53.63% | 57.63% | 28.50% | 20.82% | 31.94% | 38.05% | 42.99% | 36.21% | 16.36% | 8.15% | 13.77% |
| Total Other Income Expenses Net | $-91.00M | $-98.00M | $-75.00M | $-24.00M | $-2.44B | $-1.61B | $-230.71M | $-1.99B | $-1.63B | $-1.53B | $-1.62B | $-516.48M | $-631.53M | $-531.76M | $-723.16M | $-943.98M | $-891.54M | $-323.11M | $-419.69M | $-377.55M |
| Income Before Tax | $3.44B | $4.86B | $3.49B | $3.40B | $7.09B | $5.43B | $11.81B | $7.61B | $4.73B | $4.88B | $5.20B | $1.30B | $366.15M | $1.25B | $1.61B | $2.40B | $1.24B | $587.71M | $-25.99M | $537.70M |
| Income Before Tax Ratio | 39.50% | 51.09% | 38.60% | 43.37% | 52.87% | 48.59% | 68.41% | 62.82% | 51.51% | 52.85% | 56.86% | 25.88% | 8.45% | 26.47% | 31.23% | 38.56% | 24.77% | 12.80% | -0.54% | 9.06% |
| Income Tax Expense | $1.11B | $1.53B | $1.06B | $1.03B | $2.14B | $1.61B | $3.53B | $2.31B | $1.42B | $1.39B | $1.58B | $386.16M | $99.98M | $375.48M | $473.60M | $706.76M | $349.01M | $149.67M | $6.50M | $133.20M |
| Net Income | $2.35B | $3.34B | $2.43B | $2.37B | $4.95B | $3.82B | $8.28B | $5.30B | $3.31B | $3.50B | $3.62B | $914.29M | $267.52M | $872.70M | $1.13B | $1.69B | $892.66M | $438.03M | $-18.19M | $404.50M |
| Net Income Ratio | 26.94% | 35.08% | 26.89% | 30.22% | 36.91% | 34.18% | 47.97% | 43.75% | 36.02% | 37.83% | 39.58% | 18.19% | 6.17% | 18.51% | 22.02% | 27.20% | 17.79% | 9.54% | -0.38% | 6.81% |
| EPS | $0.76 | $1.08 | $0.79 | $0.77 | $1.61 | $1.24 | $2.68 | $1.72 | $1.07 | $1.13 | $1.17 | $0.29 | $0.09 | $0.28 | $0.36 | $0.54 | $0.29 | $0.14 | $-0.01 | $0.13 |
| EPS Diluted | $0.76 | $1.08 | $0.79 | $0.77 | $1.61 | $1.24 | $2.68 | $1.72 | $1.07 | $1.13 | $1.17 | $0.29 | $0.09 | $0.28 | $0.36 | $0.54 | $0.29 | $0.14 | $-0.01 | $0.13 |
| Weighted Average Shares Outstanding | 3.08B | 3.08B | 3.08B | 3.08B | 3.08B | 3.08B | 3.09B | 3.09B | 3.09B | 3.09B | 3.08B | 3.11B | 3.14B | 3.12B | 3.12B | 3.13B | 3.13B | 3.13B | 3.11B | 3.12B |
| Weighted Average Shares Outstanding Diluted | 3.08B | 3.08B | 3.08B | 3.08B | 3.08B | 3.08B | 3.09B | 3.09B | 3.09B | 3.09B | 3.09B | 3.11B | 3.12B | 3.12B | 3.12B | 3.13B | 3.13B | 3.13B | 3.12B | 3.12B |
| SEC Filing | Source | Source | Source | Source | Source | Source | Source | Source | Source | Source | Source | Source | Source | Source | Source | Source | Source | Source | Source | Source |
Annual Balance Sheet
| Breakdown | June 30, 2024 | June 30, 2023 | June 30, 2022 | June 30, 2021 | June 30, 2020 |
|---|---|---|---|---|---|
| Cash and Cash Equivalents | $4.90B | $4.28B | $5.22B | $6.93B | $4.89B |
| Short Term Investments | $- | $- | $- | $- | $- |
| Cash and Short Term Investments | $4.90B | $4.28B | $5.22B | $6.93B | $4.89B |
| Net Receivables | $654.00M | $331.00M | $468.00M | $568.00M | $475.00M |
| Inventory | $1.53B | $1.19B | $1.08B | $1.21B | $833.29M |
| Other Current Assets | $81.00M | $278.00M | $123.00M | $249.00M | $139.00M |
| Total Current Assets | $7.17B | $6.07B | $6.90B | $8.96B | $6.34B |
| Property Plant Equipment Net | $21.68B | $20.11B | $19.89B | $18.73B | $16.55B |
| Goodwill | $195.00M | $129.50M | $136.83M | $- | $- |
| Intangible Assets | $193.00M | $298.30M | $256.97M | $10.00M | $7.04M |
| Goodwill and Intangible Assets | $388.00M | $298.30M | $256.97M | $10.00M | $7.04M |
| Long Term Investments | $364.00M | $352.18M | $93.99M | $24.00M | $2.01M |
| Tax Assets | $- | $788.16M | $720.91M | $709.03M | $716.55M |
| Other Non-Current Assets | $461.00M | $1.32B | $1.23B | $656.03M | $649.12M |
| Total Non-Current Assets | $22.89B | $22.87B | $22.19B | $20.13B | $17.93B |
| Other Assets | $- | $1 | $1 | $1 | $1 |
| Total Assets | $30.06B | $28.94B | $29.09B | $29.09B | $24.26B |
| Account Payables | $1.04B | $984.00M | $315.00M | $1.01B | $281.00M |
| Short Term Debt | $192.00M | $165.00M | $173.00M | $167.00M | $186.00M |
| Tax Payables | $- | $303.29M | $283.97M | $1.47B | $1.03B |
| Deferred Revenue | $65.00M | $70.83M | $283.97M | $1.47B | $1.03B |
| Other Current Liabilities | $1.39B | $1.01B | $1.64B | $1.24B | $1.30B |
| Total Current Liabilities | $2.69B | $2.46B | $2.42B | $3.88B | $2.81B |
| Long Term Debt | $5.21B | $5.16B | $5.93B | $4.08B | $4.93B |
| Deferred Revenue Non-Current | $- | $27.93M | $647.92M | $681.03M | $738.69M |
| Deferred Tax Liabilities Non-Current | $1.52B | $2.29B | $2.49B | $2.42B | $2.37B |
| Other Non-Current Liabilities | $1.11B | $3.37B | $3.40B | $3.39B | $3.20B |
| Total Non-Current Liabilities | $7.84B | $8.52B | $9.33B | $7.48B | $8.12B |
| Other Liabilities | $1 | $1 | $- | $1 | $1 |
| Total Liabilities | $10.53B | $10.98B | $11.75B | $11.36B | $10.94B |
| Preferred Stock | $- | $- | $1 | $- | $1 |
| Common Stock | $1.08B | $1.19B | $1.19B | $1.20B | $1.20B |
| Retained Earnings | $18.30B | $16.74B | $16.17B | $16.58B | $12.08B |
| Accumulated Other Comprehensive Income Loss | $175.00M | $169.60M | $108.99M | $46.00M | $62.40M |
| Other Total Stockholders Equity | $- | $-192.89M | $4.22M | $-90.00M | $-104.67M |
| Total Stockholders Equity | $19.55B | $17.95B | $17.33B | $17.73B | $13.32B |
| Total Equity | $19.53B | $17.96B | $17.34B | $17.74B | $13.33B |
| Total Liabilities and Stockholders Equity | $30.08B | $28.94B | $29.09B | $29.09B | $24.26B |
| Minority Interest | $-21.00M | $8.98M | $8.00M | $8.00M | $13.08M |
| Total Liabilities and Total Equity | $30.08B | $28.94B | $29.09B | $29.09B | $24.26B |
| Total Investments | $364.00M | $352.18M | $93.99M | $24.00M | $2.01M |
| Total Debt | $5.40B | $5.31B | $6.10B | $4.25B | $5.15B |
| Net Debt | $497.00M | $1.03B | $878.89M | $-2.68B | $259.65M |
Balance Sheet Charts
| Breakdown | June 30, 2024 | December 31, 2023 | June 30, 2023 | December 31, 2022 | June 30, 2022 | December 31, 2021 | June 30, 2021 | December 31, 2020 | June 30, 2020 | December 31, 2019 | June 30, 2019 | December 31, 2018 | June 30, 2018 | December 31, 2017 | June 30, 2017 | December 31, 2016 | June 30, 2016 | December 31, 2015 | June 30, 2015 | December 31, 2014 |
|---|---|---|---|---|---|---|---|---|---|---|---|---|---|---|---|---|---|---|---|---|
| Cash and Cash Equivalents | $4.90B | $4.75B | $4.28B | $4.00B | $5.22B | $3.99B | $6.93B | $5.15B | $4.89B | $4.72B | $1.87B | $1.37B | $635.24M | $1.14B | $1.41B | $1.61B | $1.18B | $3.18B | $1.81B | $1.92B |
| Short Term Investments | $- | $- | $- | $- | $- | $- | $- | $- | $- | $- | $- | $- | $- | $- | $- | $- | $- | $- | $- | $- |
| Cash and Short Term Investments | $4.90B | $4.75B | $4.28B | $4.00B | $5.22B | $3.99B | $6.93B | $5.15B | $4.89B | $4.72B | $1.87B | $1.37B | $635.24M | $1.14B | $1.41B | $1.61B | $1.18B | $3.18B | $1.81B | $1.92B |
| Net Receivables | $654.00M | $863.00M | $331.00M | $622.00M | $468.00M | $675.76M | $568.00M | $1.28B | $475.00M | $675.54M | $882.00M | $496.89M | $89.00M | $465.18M | $141.00M | $913.24M | $210.00M | $148.30M | $291.00M | $485.15M |
| Inventory | $1.53B | $1.31B | $1.19B | $1.19B | $1.08B | $1.49B | $1.21B | $1.24B | $833.29M | $1.26B | $769.02M | $885.89M | $365.10M | $706.11M | $450.10M | $734.47M | $413.33M | $877.44M | $587.82M | $1.47B |
| Other Current Assets | $81.00M | $129.00M | $278.00M | $117.00M | $123.00M | $176.17M | $249.00M | $173.80M | $139.00M | $91.21M | $84.00M | $73.82M | $202.00M | $66.64M | $38.00M | $72.06M | $76.00M | $50.81M | $84.00M | $155.88M |
| Total Current Assets | $7.17B | $7.05B | $6.07B | $5.93B | $6.90B | $6.33B | $8.96B | $7.85B | $6.34B | $6.75B | $3.60B | $2.82B | $1.21B | $2.38B | $1.99B | $3.33B | $1.81B | $4.26B | $2.68B | $3.97B |
| Property Plant Equipment Net | $21.68B | $21.68B | $20.11B | $21.13B | $19.89B | $27.66B | $18.73B | $23.86B | $16.55B | $23.55B | $15.47B | $22.84B | $11.92B | $20.86B | $12.63B | $22.93B | $12.58B | $23.61B | $13.48B | $22.17B |
| Goodwill | $195.00M | $- | $129.50M | $- | $136.83M | $- | $- | $- | $- | $- | $- | $- | $- | $- | $- | $- | $- | $- | $- | $- |
| Intangible Assets | $193.00M | $311.00M | $298.30M | $285.00M | $256.97M | $44.04M | $10.00M | $11.67M | $7.04M | $11.40M | $5.98M | $5.68M | $2.94M | $6.41M | $5.36M | $12.47M | $11.19M | $38.45M | $33.46M | $63.55M |
| Goodwill and Intangible Assets | $388.00M | $311.00M | $298.30M | $285.00M | $256.97M | $44.04M | $10.00M | $11.67M | $7.04M | $11.40M | $5.98M | $5.68M | $2.94M | $6.41M | $5.36M | $12.47M | $11.19M | $38.45M | $33.46M | $63.55M |
| Long Term Investments | $364.00M | $357.00M | $352.18M | $66.00M | $93.99M | $23.93M | $24.00M | $8.94M | $2.01M | $2.00M | $1.99M | $- | $- | $- | $- | $- | $- | $- | $- | $- |
| Tax Assets | $- | $- | $788.16M | $1 | $720.91M | $-0 | $709.03M | $1 | $716.55M | $1 | $514.01M | $- | $- | $- | $- | $- | $- | $- | $- | $- |
| Other Non-Current Assets | $461.00M | $486.00M | $1.32B | $570.00M | $1.23B | $609.17M | $656.03M | $17.00M | $649.12M | $39.33M | $539.91M | $7.10M | $4.42M | $11.53M | $7.65M | $29.10M | $23.87M | $63.16M | $44.11M | $95.32M |
| Total Non-Current Assets | $22.89B | $22.83B | $22.87B | $22.05B | $22.19B | $28.33B | $20.13B | $23.90B | $17.93B | $23.60B | $16.53B | $22.85B | $11.92B | $20.88B | $12.64B | $22.98B | $12.62B | $23.71B | $13.56B | $22.33B |
| Other Assets | $- | $- | $1 | $- | $1 | $- | $1 | $- | $1 | $- | $1 | $- | $1 | $- | $- | $- | $1 | $- | $1 | $- |
| Total Assets | $30.06B | $29.89B | $28.94B | $27.97B | $29.09B | $34.66B | $29.09B | $31.74B | $24.26B | $30.36B | $20.13B | $25.68B | $13.14B | $23.26B | $14.63B | $26.30B | $14.43B | $27.97B | $16.24B | $26.29B |
| Account Payables | $1.04B | $1.39B | $984.00M | $1.39B | $315.00M | $1.38B | $1.01B | $1.45B | $281.00M | $936.00M | $315.00M | $638.00M | $272.00M | $593.00M | $234.00M | $634.00M | $190.00M | $672.00M | $178.00M | $944.00M |
| Short Term Debt | $192.00M | $164.00M | $165.00M | $172.00M | $173.00M | $172.68M | $167.00M | $170.50M | $186.00M | $179.46M | $86.00M | $118.53M | $97.00M | $147.24M | $121.00M | $125.48M | $93.00M | $216.47M | $155.00M | $179.20M |
| Tax Payables | $- | $442.00M | $303.29M | $211.62M | $283.97M | $319.02M | $1.47B | $817.93M | $1.03B | $627.33M | $759.06M | $- | $- | $- | $- | $- | $- | $- | $- | $- |
| Deferred Revenue | $- | $118.73M | $70.83M | $211.62M | $283.97M | $319.02M | $1.47B | $81.49M | $1.03B | $486.25M | $484.13M | $- | $196.53M | $- | $352.89M | $- | $361.85M | $- | $471.48M | $- |
| Other Current Liabilities | $1.45B | $483.00M | $1.01B | $-101.87M | $1.64B | $-450.72M | $1.24B | $1.99B | $1.30B | $1.48B | $1.48B | $1.33B | $603.00M | $701.45M | $1.85B | $1.60B | $866.00M | $1.72B | $950.63M | $1.34B |
| Total Current Liabilities | $2.69B | $2.48B | $2.46B | $2.10B | $2.42B | $2.96B | $3.88B | $3.74B | $2.81B | $3.44B | $2.64B | $2.08B | $912.01M | $1.44B | $1.69B | $2.36B | $1.22B | $2.61B | $1.28B | $2.46B |
| Long Term Debt | $5.21B | $5.15B | $5.16B | $5.91B | $5.93B | $6.81B | $4.08B | $5.84B | $4.93B | $6.21B | $3.87B | $6.08B | $3.88B | $5.67B | $4.35B | $7.56B | $6.68B | $11.83B | $9.41B | $11.19B |
| Deferred Revenue Non-Current | $- | $63.86M | $27.93M | $634.87M | $647.92M | $663.96M | $681.03M | $747.37M | $738.69M | $698.37M | $522.97M | $- | $388.65M | $- | $342.17M | $- | $418.55M | $- | $647.90M | $- |
| Deferred Tax Liabilities Non-Current | $1.52B | $1.58B | $2.29B | $1.88B | $2.49B | $1.75B | $2.42B | $1.63B | $2.37B | $1.76B | $2.20B | $- | $1.18B | $- | $1.19B | $- | $1.12B | $- | $1.04B | $- |
| Other Non-Current Liabilities | $1.11B | $2.85B | $3.37B | $2.84B | $3.40B | $-1.97B | $3.39B | $-1.63B | $3.20B | $-2.30B | $3.07B | $3.34B | $1.18B | $3.59B | $-858.61M | $3.45B | $258.29M | $2.80B | $-2.41B | $3.33B |
| Total Non-Current Liabilities | $7.84B | $8.00B | $8.52B | $8.75B | $9.33B | $9.99B | $7.48B | $8.54B | $8.12B | $9.07B | $6.94B | $9.42B | $5.06B | $9.26B | $5.50B | $11.01B | $6.94B | $14.63B | $9.23B | $14.52B |
| Other Liabilities | $1 | $- | $1 | $- | $- | $- | $1 | $- | $1 | $- | $- | $- | $1 | $- | $- | $- | $1 | $- | $- | $- |
| Total Liabilities | $10.53B | $10.48B | $10.98B | $10.85B | $11.75B | $12.94B | $11.36B | $12.28B | $10.94B | $12.51B | $9.57B | $11.50B | $5.97B | $10.71B | $7.18B | $13.37B | $8.16B | $17.24B | $10.51B | $16.98B |
| Preferred Stock | $- | $- | $- | $- | $1 | $- | $- | $- | $1 | $- | $1 | $- | $12.16M | $- | $9.11M | $- | $- | $- | $- | $- |
| Common Stock | $1.08B | $1.20B | $1.19B | $1.20B | $1.19B | $1.64B | $1.20B | $1.55B | $1.20B | $1.70B | $1.19B | $1.70B | $947.34M | $1.66B | $986.71M | $1.80B | $970.65M | $1.79B | $984.01M | $1.58B |
| Retained Earnings | $18.30B | $18.14B | $16.74B | $15.95B | $16.17B | $20.15B | $16.58B | $17.99B | $12.08B | $16.09B | $9.33B | $12.43B | $6.17B | $10.84B | $6.42B | $11.09B | $5.27B | $8.87B | $4.70B | $7.64B |
| Accumulated Other Comprehensive Income Loss | $175.00M | $160.00M | $169.60M | $130.00M | $108.99M | $107.35M | $46.00M | $15.56M | $62.40M | $71.26M | $41.84M | $49.69M | $33.86M | $49.98M | $29.85M | $51.27M | $24.62M | $60.42M | $34.98M | $73.32M |
| Other Total Stockholders Equity | $- | $-119.00M | $-192.89M | $-151.00M | $4.22M | $-6.13B | $-90.00M | $-4.57B | $-104.67M | $-41.33M | $-54.84M | $-19.88M | $- | $-11.53M | $- | $-18.02M | $- | $1 | $-1 | $- |
| Total Stockholders Equity | $19.55B | $19.37B | $17.95B | $17.13B | $17.33B | $21.71B | $17.73B | $19.44B | $13.32B | $17.83B | $10.55B | $14.16B | $7.15B | $12.54B | $7.44B | $12.91B | $6.26B | $10.72B | $5.72B | $9.29B |
| Total Equity | $19.53B | $19.40B | $17.96B | $17.13B | $17.34B | $21.72B | $17.74B | $19.46B | $13.33B | $17.85B | $10.56B | $14.17B | $7.16B | $12.56B | $7.45B | $12.93B | $6.27B | $10.74B | $5.73B | $9.31B |
| Total Liabilities and Stockholders Equity | $30.08B | $29.89B | $28.94B | $27.97B | $29.09B | $34.66B | $29.09B | $31.74B | $24.26B | $30.36B | $20.13B | $25.68B | $13.14B | $23.26B | $14.63B | $26.30B | $14.43B | $27.97B | $16.23B | $26.29B |
| Minority Interest | $-21.00M | $30.00M | $8.98M | $3.00M | $8.00M | $11.01M | $8.00M | $27.24M | $13.08M | $18.53M | $12.95M | $18.46M | $9.57M | $17.94M | $10.72M | $19.40M | $10.45M | $17.85M | $9.89M | $17.11M |
| Total Liabilities and Total Equity | $30.08B | $29.89B | $28.94B | $27.97B | $29.09B | $34.66B | $29.09B | $31.74B | $24.26B | $30.36B | $20.13B | $25.68B | $13.14B | $23.26B | $14.63B | $26.30B | $14.43B | $27.97B | $16.23B | $26.29B |
| Total Investments | $364.00M | $357.00M | $352.18M | $66.00M | $93.99M | $23.93M | $24.00M | $8.94M | $2.01M | $2.00M | $1.99M | $- | $- | $- | $- | $- | $- | $- | $- | $- |
| Total Debt | $5.40B | $5.21B | $5.31B | $5.97B | $6.10B | $6.20B | $4.25B | $5.13B | $5.15B | $5.56B | $3.94B | $5.58B | $2.93B | $5.30B | $3.42B | $7.12B | $5.05B | $11.59B | $7.28B | $11.06B |
| Net Debt | $497.00M | $465.00M | $1.03B | $1.97B | $878.89M | $2.21B | $-2.68B | $-24.64M | $259.65M | $838.02M | $2.07B | $4.22B | $2.29B | $4.16B | $2.02B | $5.52B | $3.87B | $8.41B | $5.47B | $9.13B |
Annual Cash Flow
| Breakdown | June 30, 2024 | June 30, 2023 | June 30, 2022 | June 30, 2021 | June 30, 2020 |
|---|---|---|---|---|---|
| Net Income | $5.68B | $4.74B | $5.88B | $10.36B | $4.89B |
| Depreciation and Amortization | $2.14B | $1.72B | $1.45B | $1.37B | $1.44B |
| Deferred Income Tax | $- | $- | $54.99M | $71.46M | $-45.48M |
| Stock Based Compensation | $- | $148.00M | $128.00M | $94.00M | $41.00M |
| Change in Working Capital | $-382.00M | $-385.04M | $-1.40B | $642.14M | $258.40M |
| Accounts Receivables | $- | $-59.24M | $262.63M | $-193.25M | $392.77M |
| Inventory | $- | $-92.81M | $-312.88M | $-386.49M | $-57.88M |
| Accounts Payables | $- | $-987.29K | $46.46M | $829.35M | $73.39M |
| Other Working Capital | $-382.00M | $-232.01M | $-1.40B | $392.53M | $-149.87M |
| Other Non Cash Items | $474.00M | $1.23B | $3.20B | $2.63B | $2.53B |
| Net Cash Provided by Operating Activities | $7.92B | $7.31B | $6.27B | $12.58B | $6.60B |
| Investments in Property Plant and Equipment | $-2.83B | $-2.86B | $-2.66B | $-3.40B | $-2.01B |
| Acquisitions Net | $- | $65.16M | $-195.31M | $-33.21M | $7.24M |
| Purchases of Investments | $-47.00M | $-276.44M | $-57.84M | $-1.01M | $-9.30M |
| Sales Maturities of Investments | $- | $-7.31M | $- | $-1 | $-1 |
| Other Investing Activities | $70.00M | $7.31M | $-82.56M | $-252.63M | $-21.71M |
| Net Cash Used for Investing Activities | $-2.81B | $-3.08B | $-2.91B | $-3.69B | $-2.03B |
| Debt Repayment | $-10.00M | $-760.00M | $1.90B | $-781.00M | $720.00M |
| Common Stock Issued | $- | $- | $- | $- | $- |
| Common Stock Repurchased | $-142.00M | $-149.08M | $-130.84M | $-121.00M | $-45.48M |
| Dividends Paid | $-4.14B | $-3.92B | $-6.70B | $-5.68B | $-1.93B |
| Other Financing Activities | $-173.00M | $-168.00M | $129.09M | $-307.00M | $-32.00M |
| Net Cash Used Provided by Financing Activities | $-4.46B | $-4.91B | $-4.81B | $-6.80B | $-1.29B |
| Effect of Forex Changes on Cash | $-27.00M | $-168.02M | $-125.82M | $750.79K | $-128.19M |
| Net Change in Cash | $616.00M | $-768.08M | $-1.12B | $1.64B | $3.04B |
| Cash at End of Period | $4.90B | $4.28B | $5.22B | $6.93B | $4.89B |
| Cash at Beginning of Period | $4.29B | $5.05B | $6.35B | $5.29B | $1.85B |
| Operating Cash Flow | $7.92B | $7.31B | $6.27B | $12.58B | $6.60B |
| Capital Expenditure | $-2.83B | $-2.86B | $-2.66B | $-3.40B | $-2.01B |
| Free Cash Flow | $5.08B | $4.44B | $3.62B | $9.17B | $4.59B |
Cash Flow Charts
| Breakdown | June 30, 2024 | December 31, 2023 | June 30, 2023 | December 31, 2022 | June 30, 2022 | December 31, 2021 | June 30, 2021 | December 31, 2020 | June 30, 2020 | December 31, 2019 | June 30, 2019 | December 31, 2018 | June 30, 2018 | December 31, 2017 | June 30, 2017 | December 31, 2016 | June 30, 2016 | December 31, 2015 | June 30, 2015 | December 31, 2014 |
|---|---|---|---|---|---|---|---|---|---|---|---|---|---|---|---|---|---|---|---|---|
| Net Income | $2.35B | $3.34B | $2.43B | $2.37B | $4.95B | $3.82B | $8.28B | $5.30B | $3.31B | $3.50B | $3.62B | $914.29M | $267.52M | $872.70M | $1.13B | $1.69B | $892.66M | $438.03M | $-18.19M | $404.50M |
| Depreciation and Amortization | $1.22B | $922.00M | $885.00M | $859.00M | $1.17B | $993.69M | $925.52M | $871.58M | $1.08B | $936.36M | $876.01M | $824.85M | $874.16M | $807.35M | $807.98M | $861.97M | $828.23M | $860.97M | $970.61M | $804.11M |
| Deferred Income Tax | $- | $- | $- | $- | $- | $- | $- | $- | $- | $- | $81.19M | $- | $- | $- | $- | $- | $- | $- | $- | $- |
| Stock Based Compensation | $156.00M | $- | $148.00M | $- | $185.40M | $- | $125.36M | $- | $59.41M | $- | $29.91M | $- | $18.92M | $- | $20.82M | $- | $-4.03M | $- | $11.69M | $- |
| Change in Working Capital | $-382.00M | $- | $-100.00M | $- | $-11.59M | $- | $-702.81M | $- | $512.95M | $- | $-1.49B | $- | $132.41M | $- | $134.01M | $- | $397.34M | $- | $1.06B | $- |
| Accounts Receivables | $-136.00M | $- | $-60.00M | $- | $401.21M | $- | $-256.05M | $- | $550.62M | $- | $-1.14B | $- | $28.37M | $- | $131.41M | $- | $69.80M | $- | $388.51M | $- |
| Inventory | $-222.00M | $- | $-94.00M | $- | $-477.97M | $- | $-512.10M | $- | $-81.14M | $- | $-393.13M | $- | $124.30M | $- | $-44.24M | $- | $293.97M | $- | $669.17M | $- |
| Accounts Payables | $- | $- | $- | $- | $- | $- | $- | $- | $- | $- | $- | $- | $- | $- | $- | $- | $- | $- | $- | $- |
| Other Working Capital | $-24.00M | $- | $54.00M | $- | $65.18M | $- | $65.35M | $- | $43.47M | $- | $41.31M | $- | $-20.27M | $- | $46.84M | $- | $33.56M | $- | $- | $- |
| Other Non Cash Items | $407.00M | $-89.00M | $1.12B | $-279.00M | $237.54M | $-1.88B | $2.28B | $-448.76M | $-172.43M | $5.70M | $1.84B | $-393.26M | $314.81M | $-1.15B | $1.03B | $18.02M | $-303.37M | $207.35M | $-550.92M | $-102.65M |
| Net Cash Provided by Operating Activities | $3.75B | $4.17B | $4.48B | $2.95B | $6.53B | $2.94B | $10.91B | $5.72B | $4.78B | $4.44B | $4.88B | $1.35B | $1.61B | $526.70M | $3.12B | $2.57B | $1.81B | $1.51B | $1.47B | $1.11B |
| Investments in Property Plant and Equipment | $-1.32B | $-1.51B | $-1.54B | $-1.36B | $-1.97B | $-1.98B | $-2.22B | $-2.23B | $-1.58B | $-1.21B | $-736.41M | $-753.86M | $-649.88M | $-538.23M | $-532.15M | $-443.46M | $-318.14M | $-168.90M | $-352.12M | $-706.34M |
| Acquisitions Net | $- | $18.78M | $4.00M | $16.32M | $-304.16M | $3.96M | $-34.19M | $2.12M | $11.44M | $-4.11M | $3.99M | $- | $- | $- | $- | $- | $- | $- | $- | $- |
| Purchases of Investments | $- | $-15.65M | $-258.40M | $-17.34M | $-14.18M | $-46.57M | $-973.24K | $- | $-9.50M | $- | $- | $- | $- | $- | $- | $- | $- | $- | $- | $- |
| Sales Maturities of Investments | $- | $-1 | $- | $- | $- | $- | $-2 | $- | $-1 | $- | $1.42M | $- | $- | $- | $- | $- | $- | $- | $- | $- |
| Other Investing Activities | $29.00M | $-6.00M | $-217.00M | $-1.00M | $-20.28M | $-59.18M | $-102.69M | $-217.90M | $-20.29M | $-12.83M | $2.85M | $89.44M | $-68.91M | $20.50M | $9.11M | $9.70M | $2.68M | $- | $67.57M | $86.77M |
| Net Cash Used for Investing Activities | $-1.30B | $-1.51B | $-1.75B | $-1.37B | $-2.30B | $-2.04B | $-2.32B | $-2.45B | $-1.60B | $-1.23B | $-733.57M | $-664.42M | $-718.79M | $-517.73M | $-523.04M | $-433.76M | $-315.45M | $-168.90M | $-284.56M | $-619.58M |
| Debt Repayment | $- | $-77.00M | $- | $-70.00M | $- | $334.00M | $- | $-1.12B | $- | $-246.00M | $- | $25.00M | $- | $-295.00M | $- | $-1.65B | $- | $-954.00M | $- | $-526.00M |
| Common Stock Issued | $- | $- | $- | $- | $2.88B | $- | $- | $- | $- | $- | $- | $- | $- | $- | $- | $- | $- | $- | $- | $- |
| Common Stock Repurchased | $- | $-142.00M | $1.27M | $-151.00M | $-1.45M | $-188.55M | $8.96M | $-158.23M | $-1.90M | $-62.71M | $-3.22M | $-183.14M | $- | $-30.76M | $- | $-37.42M | $- | $-28.84M | $-1.30M | $-35.44M |
| Dividends Paid | $-2.17B | $-1.97B | $-1.54B | $-2.38B | $-2.88B | $-6.49B | $-4.64B | $-2.86B | $-2.06B | $-715.45M | $-2.78B | $-383.32M | $-356.69M | $-781.72M | $-612.82M | $-393.57M | $-93.96M | $-60.42M | $-89.66M | $-334.84M |
| Other Financing Activities | $-89.00M | $-17.00M | $-845.00M | $-13.00M | $2.05B | $1.76B | $49.34M | $649.59M | $1.38B | $198.45M | $-85.46M | $105.32M | $-572.87M | $-101.33M | $-1.10B | $102.57M | $-2.37B | $11.42M | $4.90M | $-279.16M |
| Net Cash Used Provided by Financing Activities | $-2.26B | $-2.20B | $-2.39B | $-2.61B | $-829.93M | $-6.23B | $-4.59B | $-4.47B | $-686.83M | $-1.15B | $-2.86B | $-542.33M | $-929.56M | $-1.20B | $-1.71B | $-2.72B | $-2.47B | $-1.41B | $-85.76M | $-1.43B |
| Effect of Forex Changes on Cash | $-35.00M | $8.00M | $-60.00M | $-193.00M | $-37.66M | $-216.08M | $-62.68M | $62.26M | $-259.37M | $-8.55M | $17.09M | $1.42M | $1.35M | $-19.22M | $-2.60M | $-2.77M | $-13.42M | $-17.85M | $-51.97M | $-64.77M |
| Net Change in Cash | $154.00M | $364.37M | $276.02M | $-1.19B | $1.23B | $-2.70B | $1.78B | $-253.53M | $162.90M | $2.84B | $501.02M | $140.55M | $-39.18M | $-1.21B | $882.15M | $-586.19M | $-986.63M | $-86.51M | $1.05B | $-1.01B |
| Cash at End of Period | $4.90B | $4.75B | $4.28B | $4.00B | $5.22B | $3.99B | $6.93B | $5.15B | $4.89B | $4.72B | $1.87B | $1.37B | $1.10B | $1.14B | $2.49B | $1.61B | $2.20B | $3.18B | $2.97B | $1.92B |
| Cash at Beginning of Period | $4.75B | $4.38B | $4.00B | $5.19B | $3.99B | $6.69B | $5.15B | $5.41B | $4.72B | $1.88B | $1.37B | $1.23B | $1.14B | $2.36B | $1.61B | $2.19B | $3.18B | $3.27B | $1.92B | $2.93B |
| Operating Cash Flow | $3.75B | $4.17B | $4.48B | $2.95B | $6.53B | $2.94B | $10.91B | $5.72B | $4.78B | $4.44B | $4.88B | $1.35B | $1.61B | $526.70M | $3.12B | $2.57B | $1.81B | $1.51B | $1.47B | $1.11B |
| Capital Expenditure | $-1.32B | $-1.51B | $-1.54B | $-1.36B | $-1.97B | $-1.98B | $-2.22B | $-2.23B | $-1.58B | $-1.21B | $-736.41M | $-753.86M | $-649.88M | $-538.23M | $-532.15M | $-443.46M | $-318.14M | $-168.90M | $-352.12M | $-706.34M |
| Free Cash Flow | $2.42B | $2.66B | $2.95B | $1.58B | $4.56B | $956.53M | $8.70B | $3.49B | $3.20B | $3.22B | $4.14B | $592.01M | $957.93M | $-11.53M | $2.59B | $2.13B | $1.49B | $1.34B | $1.12B | $399.61M |
Fortescue Metals Group Dividends
Explore Fortescue Metals Group's dividend history, including dividend yield, payout ratio, and historical payments.
Dividend Yield
9.27%
Dividend Payout Ratio
72.85%
Dividend Paid & Capex Coverage Ratio
1.14x
Fortescue Metals Group Dividend History
| Dividend | Adjusted Dividend | Date | Record Date | Payment Date | Declaration Date |
|---|---|---|---|---|---|
| $0.6088 | $0.6088 | March 03, 2025 | March 03, 2025 | April 03, 2025 | February 20, 2025 |
| $1.205 | $1.205 | September 09, 2024 | September 09, 2024 | October 04, 2024 | August 28, 2024 |
| $1.415 | $1.415 | March 01, 2024 | March 04, 2024 | April 03, 2024 | February 22, 2024 |
| $1.294 | $1.294 | September 07, 2023 | September 08, 2023 | October 05, 2023 | August 29, 2023 |
| $1.034 | $1.034 | February 27, 2023 | February 28, 2023 | April 05, 2023 | February 15, 2023 |
| $1.659 | $1.659 | September 08, 2022 | September 09, 2022 | October 06, 2022 | August 30, 2022 |
| $1.235 | $1.23496 | February 25, 2022 | February 28, 2022 | April 06, 2022 | February 16, 2022 |
| $3.07807 | $3.07807 | September 08, 2021 | September 09, 2021 | October 07, 2021 | August 30, 2021 |
| $2.281 | $2.281 | March 03, 2021 | March 04, 2021 | March 31, 2021 | March 01, 2021 |
| $1.433 | $1.433 | September 03, 2020 | September 04, 2020 | October 09, 2020 | August 24, 2020 |
| $1.0141 | $1.0141 | March 03, 2020 | March 04, 2020 | April 13, 2020 | February 19, 2020 |
| $0.325 | $0.325 | September 05, 2019 | September 06, 2019 | October 09, 2019 | August 26, 2019 |
| $0.833 | $0.833 | May 23, 2019 | May 24, 2019 | June 21, 2019 | |
| $0.43 | $0.43 | March 01, 2019 | March 04, 2019 | March 29, 2019 | February 21, 2019 |
| $0.175 | $0.175 | August 30, 2018 | August 31, 2018 | October 10, 2018 | August 20, 2018 |
| $0.173 | $0.173 | March 02, 2018 | March 05, 2018 | April 12, 2018 | February 21, 2018 |
| $0.397 | $0.397 | August 30, 2017 | September 01, 2017 | October 11, 2017 | August 21, 2017 |
| $0.306 | $0.306 | March 09, 2017 | March 13, 2017 | April 13, 2017 | |
| $0.183 | $0.183 | August 31, 2016 | October 12, 2016 | ||
| $0.043 | $0.043 | March 03, 2016 | April 14, 2016 |
Fortescue Metals Group News
Read the latest news about Fortescue Metals Group, including recent articles, headlines, and updates.
Fortescue's Billionaire Founder on Tariffs, Copper, Climate Change
Fortescue's Andrew Forrest discusses his outlook for the commodities sector in an interview with Bloomberg Television on the sidelines of the Boao Forum in China. The billionaire founder says the mining group will "continue to build up" its copper option.

Fortescue: Weighed Down By Bleak Iron Ore Outlook, But Fundamentals Remain Strong
Fortescue delivered solid Q1 2025 results but is facing stiff headwinds from plunging iron ore prices. Iron ore demand is expected to decline amid softening steel consumption in China, Fortescue's primary market. The bleak iron ore outlook has overshadowed Fortescue's strong investment fundamentals and attractive valuation at 5x EV/EBITDA.
Mining giant Fortescue says it's time to walk away from the 'proven fantasy' of net zero
Australian mining tycoon Andrew Forrest, founder and executive chairman of Fortescue, says it is time for the world to walk away from the "proven fantasy" of net zero emissions by 2050 and to embrace "real zero" by 2040 instead. Fortescue, which is the world's fourth-largest iron ore miner, has outlined plans to stop burning fossil fuels across its Australian iron ore operations by the end of the decade.
Mining giant Fortescue agrees $2.8bn deal to electrify most of its fleet
Fortescue Ltd (ASX:FMG), the world's fourth largest iron ore miner, has agreed to buy US$2.8 billion worth of battery-electric trucks and diggers to replace over half its fleet. It signed a partnership with German-Swiss equipment manufacturer Liebherr to jointly develop technology that "paves the way for carbon-free mining".
Fortescue: A Call Option On Rebounding Iron Ore Price
Fortescue's FY 2024 was strong with $5.66B net profit, but expect pricing pressure due to lower iron ore prices and higher capex this year. The company benefits from economies of scale but faces challenges with lower grade iron ore and significant transportation costs. Fortescue's shift towards carbon-free energy and metals ventures hasn't yet yielded meaningful returns, impacting its pure-play iron ore status.
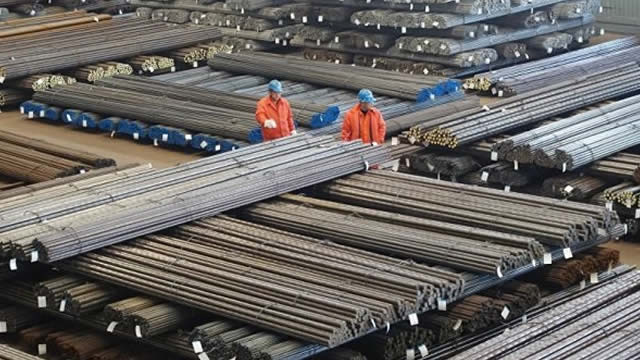
Australia's Fortescue to cut about 700 jobs; appoints insider Apple Paget as CFO
Fortescue will reduce about 700 jobs, or 4.5% of its global workforce, in a fresh restructuring round, the Australian miner said on Wednesday, as it appointed acting Chief Financial Officer Apple Paget as its permanent group finance chief.
Fortescue: An Iron Ore Giant With Strong Cash Flows
Fortescue Metals has performed well, with a 25% increase in stock price and a total return of approximately 30% since September. The company's financial results show strong cash flow and low production costs, resulting in a gross profit margin of just under 60%. Fortescue is expected to continue generating cash and may maintain earnings above US$2/share, trading at around 8 times earnings.
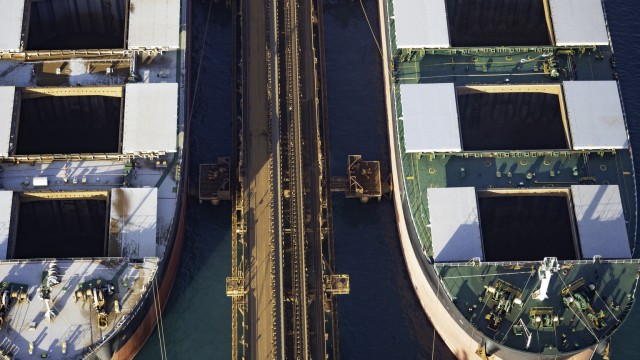
Carbon capture tech a 'complete falsehood', says Fortescue Metals chairman
Carbon capture is not a solution for the energy transition and political leaders need to provide real, non-greenwashed, commitments to encourage investment, Andrew Forrest, executive chairman of Fortescue Metals, said on Tuesday.

Australian iron ore miner Fortescue pours $750M into green energy and metals initiatives
(Kitco News) - Australian mining group Fortescue (ASX: FMG) announced on Tuesday that its Board has approved a final investment decision on two green energy projects and a green metal project, with total investment of approximately US$750 million over the next three years.
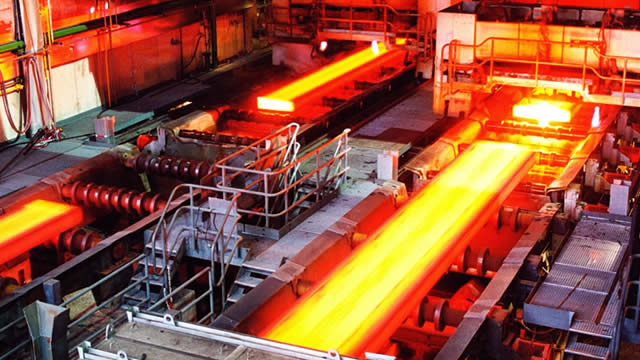
Australian iron ore giant Fortescue reports lower shipments in Sept qtr, reaffirms guidance
(Kitco News) - Australian iron ore miner Fortescue (ASX: FMG) yesterday reported shipments of 45.9 million tonnes in the September 2023 quarter, 3% lower than the prior corresponding period with increased maintenance activity and lower stocks at port.
Similar Companies
Related Metrics
Explore detailed financial metrics and analysis for FSUGY.
