Glencore plc Key Executives
This section highlights Glencore plc's key executives, including their titles and compensation details.
Find Contacts at Glencore plc
(Showing 0 of )
Glencore plc Earnings
This section highlights Glencore plc's earnings, including key dates, EPS, earnings reports, and earnings call transcripts.
Next Earnings Date
Last Earnings Results
Earnings Call Transcripts
| Transcript | Quarter | Year | Date | Estimated EPS | Actual EPS |
|---|---|---|---|---|---|
| Read Transcript | Q4 | 2024 | 2025-02-19 | $0.19 | $0.18 |
| Read Transcript | Q2 | 2024 | 2024-08-07 | N/A | N/A |
| Read Transcript | Q4 | 2023 | 2024-02-21 | $0.21 | $-0.05 |
| Read Transcript | Q2 | 2023 | 2023-08-08 | N/A | N/A |
Financial Statements
Access annual & quarterly financial statements for Glencore plc, including income statements, balance sheets, and cash flow statements..
Annual Income Statement
| Breakdown | December 31, 2024 | December 31, 2023 | December 31, 2022 | December 31, 2021 | December 31, 2020 |
|---|---|---|---|---|---|
| Revenue | $230.94B | $217.83B | $255.98B | $203.75B | $142.34B |
| Cost of Revenue | $224.29B | $207.05B | $228.72B | $191.37B | $138.64B |
| Gross Profit | $6.65B | $10.78B | $27.26B | $12.38B | $3.70B |
| Gross Profit Ratio | 2.88% | 4.95% | 10.65% | 6.08% | 2.60% |
| Research and Development Expenses | $- | $- | $- | $- | $- |
| General and Administrative Expenses | $- | $-21.00M | $- | $- | $- |
| Selling and Marketing Expenses | $2.02B | $2.10B | $2.43B | $2.12B | $1.68B |
| Selling General and Administrative Expenses | $2.02B | $2.10B | $2.43B | $2.12B | $1.68B |
| Other Expenses | $186.00M | $- | $216.00M | $-129.00M | $-12.00M |
| Operating Expenses | $2.21B | $2.08B | $2.43B | $1.99B | $1.68B |
| Cost and Expenses | $226.50B | $209.13B | $231.15B | $193.36B | $140.32B |
| Interest Income | $587.00M | $615.00M | $435.00M | $208.00M | $120.00M |
| Interest Expense | $2.92B | $2.52B | $1.77B | $1.35B | $1.57B |
| Depreciation and Amortization | $6.60B | $6.61B | $7.36B | $6.51B | $6.75B |
| EBITDA | $8.52B | $15.32B | $34.47B | $12.62B | $2.76B |
| EBITDA Ratio | 3.69% | 7.03% | 13.46% | 6.19% | 1.94% |
| Operating Income | $4.44B | $8.70B | $27.48B | $12.92B | $2.41B |
| Operating Income Ratio | 1.92% | 3.99% | 10.73% | 6.34% | 1.69% |
| Total Other Income Expenses Net | $-5.44B | $-3.28B | $-1.95B | $-2.96B | $2.51B |
| Income Before Tax | $-998.00M | $5.42B | $22.88B | $7.38B | $-5.12B |
| Income Before Tax Ratio | -0.43% | 2.49% | 8.94% | 3.62% | -3.59% |
| Income Tax Expense | $1.70B | $2.21B | $6.37B | $3.03B | $-1.17B |
| Net Income | $-1.63B | $4.28B | $17.32B | $4.97B | $-1.90B |
| Net Income Ratio | -0.71% | 1.96% | 6.77% | 2.44% | -1.34% |
| EPS | $-0.26 | $1.38 | $5.32 | $1.50 | $-0.58 |
| EPS Diluted | $-0.26 | $1.36 | $5.28 | $1.50 | $-0.58 |
| Weighted Average Shares Outstanding | 6.08B | 3.11B | 3.26B | 3.30B | 3.30B |
| Weighted Average Shares Outstanding Diluted | 6.08B | 3.13B | 3.29B | 3.33B | 3.30B |
| SEC Filing | Source | Source | Source | Source | Source |
| Breakdown | June 30, 2024 | December 31, 2023 | June 30, 2023 | December 31, 2022 | June 30, 2022 | December 31, 2021 | June 30, 2021 | December 31, 2020 | June 30, 2020 | December 31, 2019 | June 30, 2019 | December 31, 2018 | June 30, 2018 | December 31, 2017 | June 30, 2017 | December 31, 2016 | June 30, 2016 | December 31, 2015 | June 30, 2015 | December 31, 2014 |
|---|---|---|---|---|---|---|---|---|---|---|---|---|---|---|---|---|---|---|---|---|
| Revenue | $117.09B | $108.96B | $107.38B | $122.51B | $134.49B | $110.13B | $93.86B | $69.35B | $70.96B | $107.37B | $107.10B | $111.97B | $108.55B | $105.19B | $100.29B | $83.52B | $69.42B | $73.49B | $73.86B | $107.01B |
| Cost of Revenue | $114.39B | $102.71B | $102.11B | $111.23B | $121.33B | $102.95B | $89.31B | $67.32B | $69.20B | $105.57B | $104.32B | $107.93B | $103.54B | $101.16B | $96.53B | $80.94B | $68.82B | $72.49B | $72.04B | $104.01B |
| Gross Profit | $2.70B | $6.25B | $5.27B | $11.28B | $13.16B | $7.18B | $4.55B | $2.03B | $1.76B | $1.81B | $2.78B | $4.04B | $5.02B | $4.03B | $3.75B | $2.58B | $601.00M | $1.00B | $1.81B | $3.00B |
| Gross Profit Ratio | 2.30% | 5.74% | 4.91% | 9.21% | 9.79% | 6.52% | 4.85% | 2.92% | 2.47% | 1.68% | 2.59% | 3.61% | 4.62% | 3.83% | 3.74% | 3.09% | 0.87% | 1.37% | 2.45% | 2.80% |
| Research and Development Expenses | $- | $- | $- | $- | $- | $- | $- | $- | $- | $- | $- | $- | $- | $- | $- | $- | $- | $- | $- | $- |
| General and Administrative Expenses | $- | $- | $- | $- | $- | $- | $- | $- | $- | $- | $- | $- | $- | $- | $- | $- | $- | $- | $- | $- |
| Selling and Marketing Expenses | $- | $- | $- | $- | $- | $- | $- | $- | $- | $- | $- | $- | $- | $- | $- | $- | $- | $- | $- | $- |
| Selling General and Administrative Expenses | $1.01B | $1.09B | $1.05B | $1.13B | $1.38B | $1.22B | $1.08B | $863.72M | $953.00M | $737.60M | $649.00M | $560.00M | $821.00M | $650.00M | $660.00M | $553.00M | $549.00M | $538.00M | $558.00M | $584.00M |
| Other Expenses | $- | $- | $- | $- | $- | $- | $- | $- | $- | $- | $- | $- | $- | $- | $- | $- | $- | $- | $- | $- |
| Operating Expenses | $1.01B | $1.09B | $1.05B | $1.13B | $1.38B | $1.22B | $1.08B | $863.72M | $953.00M | $737.60M | $649.00M | $2.33B | $554.00M | $689.00M | $126.00M | $1.71B | $522.00M | $8.05B | $1.87B | $556.00M |
| Cost and Expenses | $115.40B | $103.80B | $103.16B | $112.36B | $122.70B | $104.17B | $90.39B | $68.18B | $70.16B | $106.30B | $104.97B | $110.26B | $104.09B | $101.85B | $96.66B | $82.64B | $69.35B | $80.54B | $73.92B | $104.57B |
| Interest Income | $304.00M | $289.65M | $321.00M | $298.20M | $140.00M | $154.97M | $54.00M | $49.55M | $69.00M | $100.40M | $126.00M | $747.00M | $746.00M | $664.00M | $759.00M | $729.00M | $777.00M | $654.00M | $624.00M | $688.00M |
| Interest Expense | $1.26B | $1.20B | $1.03B | $1.15B | $667.00M | $700.40M | $652.00M | $689.81M | $863.00M | $946.36M | $988.00M | $- | $- | $- | $- | $- | $- | $- | $- | $- |
| Depreciation and Amortization | $2.68B | $3.72B | $2.83B | $4.01B | $3.39B | $3.43B | $3.10B | $3.51B | $3.14B | $3.99B | $3.23B | $4.44B | $2.92B | $2.95B | $2.54B | $2.83B | $2.74B | $2.87B | $2.76B | $3.48B |
| EBITDA | $4.38B | $3.75B | $9.08B | $11.02B | $18.80B | $9.39B | $6.69B | $4.68B | $3.93B | $3.68B | $5.36B | $6.89B | $7.11B | $6.23B | $5.64B | $4.41B | $2.79B | $3.33B | $4.01B | $5.30B |
| EBITDA Ratio | 3.74% | 3.44% | 8.46% | 9.00% | 13.98% | 8.52% | 7.13% | 6.74% | 5.54% | 3.42% | 5.00% | 6.15% | 6.55% | 5.92% | 5.62% | 5.28% | 4.02% | 4.54% | 5.43% | 4.95% |
| Operating Income | $1.69B | $5.16B | $4.22B | $10.15B | $11.79B | $5.96B | $3.47B | $1.16B | $803.00M | $1.07B | $2.13B | $2.44B | $4.20B | $3.29B | $3.09B | $1.57B | $52.00M | $467.00M | $1.25B | $1.82B |
| Operating Income Ratio | 1.44% | 4.74% | 3.93% | 8.29% | 8.76% | 5.41% | 3.70% | 1.68% | 1.13% | 1.00% | 1.99% | 2.18% | 3.87% | 3.12% | 3.08% | 1.89% | 0.07% | 0.64% | 1.70% | 1.70% |
| Total Other Income Expenses Net | $-2.06B | $-6.31B | $1.78B | $-4.27B | $4.23B | $-2.17B | $-2.47B | $-1.52B | $-5.99B | $-2.33B | $-1.86B | $-2.52B | $-479.00M | $769.00M | $-225.00M | $-1.88B | $-750.00M | $-8.16B | $-1.94B | $-660.00M |
| Income Before Tax | $-370.00M | $-1.15B | $5.24B | $5.88B | $14.76B | $3.78B | $996.00M | $-361.42M | $-5.19B | $-1.26B | $266.00M | $961.00M | $3.72B | $4.05B | $2.87B | $149.00M | $-698.00M | $-7.70B | $-683.00M | $1.75B |
| Income Before Tax Ratio | -0.32% | -1.05% | 4.88% | 4.80% | 10.97% | 3.44% | 1.06% | -0.52% | -7.31% | -1.17% | 0.25% | 0.86% | 3.43% | 3.85% | 2.86% | 0.18% | -1.01% | -10.47% | -0.92% | 1.64% |
| Income Tax Expense | $532.00M | $468.96M | $1.73B | $2.48B | $3.92B | $1.97B | $1.07B | $-498.41M | $-657.00M | $-58.65M | $677.00M | $919.00M | $1.14B | $1.13B | $633.00M | $689.00M | $51.00M | $252.00M | $243.00M | $1.09B |
| Net Income | $-233.00M | $-283.74M | $4.57B | $5.29B | $12.09B | $3.72B | $1.28B | $677.18M | $-2.60B | $-626.26M | $226.00M | $632.00M | $2.78B | $3.33B | $2.45B | $-343.00M | $-401.00M | $-4.43B | $-785.00M | $588.00M |
| Net Income Ratio | -0.20% | -0.26% | 4.25% | 4.32% | 8.99% | 3.38% | 1.36% | 0.98% | -3.66% | -0.58% | 0.21% | 0.56% | 2.56% | 3.16% | 2.44% | -0.41% | -0.58% | -6.03% | -1.06% | 0.55% |
| EPS | $-0.04 | $-0.09 | $1.46 | $1.64 | $3.68 | $1.12 | $0.38 | $0.20 | $-0.78 | $-0.19 | $0.07 | $0.09 | $0.38 | $0.46 | $0.34 | $-0.05 | $-0.06 | $-0.64 | $-0.12 | $0.09 |
| EPS Diluted | $-0.04 | $-0.09 | $1.44 | $1.62 | $3.66 | $1.12 | $0.38 | $0.20 | $-0.78 | $-0.19 | $0.07 | $0.09 | $0.38 | $0.46 | $0.34 | $-0.05 | $-0.06 | $-0.64 | $-0.12 | $0.09 |
| Weighted Average Shares Outstanding | 5.83B | 3.04B | 3.14B | 3.21B | 3.28B | 3.30B | 3.31B | 3.31B | 3.33B | 3.30B | 3.43B | 7.01B | 7.20B | 7.24B | 7.18B | 7.11B | 7.11B | 6.85B | 6.47B | 6.54B |
| Weighted Average Shares Outstanding Diluted | 6.08B | 3.04B | 3.16B | 3.25B | 3.30B | 3.33B | 3.33B | 3.31B | 3.33B | 3.30B | 3.44B | 7.06B | 7.20B | 7.24B | 7.18B | 7.25B | 7.11B | 6.85B | 6.49B | 6.58B |
| SEC Filing | Source | Source | Source | Source | Source | Source | Source | Source | Source | Source | Source | Source | Source | Source | Source | Source | Source | Source | Source | Source |
Annual Balance Sheet
| Breakdown | December 31, 2024 | December 31, 2023 | December 31, 2022 | December 31, 2021 | December 31, 2020 |
|---|---|---|---|---|---|
| Cash and Cash Equivalents | $2.17B | $1.93B | $1.84B | $2.69B | $1.42B |
| Short Term Investments | $- | $- | $128.00M | $175.00M | $-4.00B |
| Cash and Short Term Investments | $2.17B | $1.93B | $1.97B | $2.69B | $1.42B |
| Net Receivables | $11.96B | $10.86B | $13.07B | $10.62B | $8.12B |
| Inventory | $29.58B | $31.57B | $33.46B | $28.43B | $22.85B |
| Other Current Assets | $15.81B | $19.66B | $20.71B | $15.38B | $10.75B |
| Total Current Assets | $59.51B | $64.04B | $69.22B | $57.78B | $43.21B |
| Property Plant Equipment Net | $50.21B | $39.23B | $39.56B | $43.16B | $47.11B |
| Goodwill | $5.00B | $5.00B | $5.00B | $5.00B | $5.00B |
| Intangible Assets | $1.08B | $1.15B | $1.31B | $1.39B | $1.62B |
| Goodwill and Intangible Assets | $6.08B | $6.15B | $6.31B | $6.38B | $6.62B |
| Long Term Investments | $- | $11.69B | $12.21B | $17.75B | $18.13B |
| Tax Assets | $1.21B | $1.39B | $1.84B | $1.78B | $2.25B |
| Other Non-Current Assets | $13.45B | $6.58B | $3.44B | $662.00M | $678.00M |
| Total Non-Current Assets | $70.95B | $65.05B | $63.36B | $69.73B | $74.79B |
| Other Assets | $- | $-5.22B | $- | $- | $- |
| Total Assets | $130.46B | $123.87B | $132.58B | $127.51B | $118.00B |
| Account Payables | $24.87B | $4.67B | $25.12B | $5.08B | $4.69B |
| Short Term Debt | $12.84B | $11.08B | $10.03B | $7.92B | $8.25B |
| Tax Payables | $2.51B | $1.85B | $4.99B | $2.23B | $1.30B |
| Deferred Revenue | $- | $1.04B | $1.74B | $2.03B | $1.36B |
| Other Current Liabilities | $9.49B | $29.75B | $13.28B | $34.22B | $25.20B |
| Total Current Liabilities | $49.71B | $48.38B | $53.42B | $49.46B | $39.44B |
| Long Term Debt | $25.26B | $21.27B | $18.85B | $26.81B | $29.23B |
| Deferred Revenue Non-Current | $1.11B | $1.29B | $1.55B | $2.09B | $2.59B |
| Deferred Tax Liabilities Non-Current | $5.21B | $2.97B | $3.65B | $4.47B | $4.72B |
| Other Non-Current Liabilities | $13.51B | $11.71B | $9.89B | $7.77B | $7.62B |
| Total Non-Current Liabilities | $45.09B | $37.25B | $33.94B | $41.13B | $44.16B |
| Other Liabilities | $- | $- | $- | $- | $- |
| Total Liabilities | $94.80B | $85.63B | $87.36B | $90.59B | $83.60B |
| Preferred Stock | $- | $- | $4.19B | $3.32B | $3.25B |
| Common Stock | $136.00M | $136.00M | $141.00M | $146.00M | $146.00M |
| Retained Earnings | $27.14B | $29.61B | $25.25B | $7.91B | $2.85B |
| Accumulated Other Comprehensive Income Loss | $- | $-7.03B | $-4.19B | $-3.32B | $-3.25B |
| Other Total Stockholders Equity | $13.39B | $20.87B | $30.86B | $37.80B | $40.49B |
| Total Stockholders Equity | $40.67B | $43.58B | $49.41B | $39.93B | $37.64B |
| Total Equity | $35.66B | $38.24B | $45.22B | $36.92B | $34.40B |
| Total Liabilities and Stockholders Equity | $130.46B | $123.87B | $132.58B | $127.51B | $118.00B |
| Minority Interest | $-5.01B | $-5.34B | $-4.19B | $-3.01B | $-3.23B |
| Total Liabilities and Total Equity | $130.46B | $123.87B | $132.58B | $127.51B | $118.00B |
| Total Investments | $9.77B | $11.69B | $12.33B | $13.91B | $14.13B |
| Total Debt | $38.11B | $32.24B | $28.78B | $34.64B | $37.48B |
| Net Debt | $35.94B | $30.57B | $26.93B | $31.95B | $36.06B |
Balance Sheet Charts
| Breakdown | December 31, 2024 | June 30, 2024 | December 31, 2023 | June 30, 2023 | December 31, 2022 | June 30, 2022 | December 31, 2021 | June 30, 2021 | December 31, 2020 | June 30, 2020 | December 31, 2019 | June 30, 2019 | December 31, 2018 | June 30, 2018 | December 31, 2017 | June 30, 2017 | December 31, 2016 | June 30, 2016 | December 31, 2015 | June 30, 2015 |
|---|---|---|---|---|---|---|---|---|---|---|---|---|---|---|---|---|---|---|---|---|
| Cash and Cash Equivalents | $2.17B | $2.78B | $1.93B | $1.86B | $1.84B | $2.64B | $2.69B | $2.55B | $1.42B | $1.43B | $1.90B | $1.84B | $2.05B | $2.18B | $2.12B | $1.97B | $2.51B | $2.54B | $2.71B | $3.06B |
| Short Term Investments | $- | $8.00M | $21.00M | $130.00M | $128.00M | $-3.71B | $95.00M | $46.00M | $-4.00B | $631.00M | $-2.31B | $244.00M | $34.00M | $37.00M | $83.00M | $143.00M | $10.00M | $11.00M | $39.00M | $35.00M |
| Cash and Short Term Investments | $2.17B | $2.79B | $1.93B | $1.99B | $1.97B | $2.64B | $2.69B | $2.55B | $1.42B | $1.43B | $1.90B | $1.84B | $2.05B | $2.18B | $2.12B | $1.97B | $2.52B | $2.55B | $2.75B | $3.10B |
| Net Receivables | $11.96B | $21.32B | $10.86B | $10.16B | $13.07B | $13.25B | $10.62B | $9.65B | $8.12B | $7.33B | $10.56B | $10.92B | $11.18B | $13.05B | $18.25B | $11.60B | $13.01B | $8.48B | $10.59B | $13.04B |
| Inventory | $29.58B | $30.18B | $31.57B | $31.81B | $33.46B | $30.21B | $28.43B | $24.76B | $22.85B | $19.67B | $19.94B | $20.41B | $20.56B | $24.37B | $24.08B | $17.87B | $18.35B | $16.02B | $18.30B | $23.60B |
| Other Current Assets | $15.81B | $4.64B | $5.71B | $18.97B | $20.71B | $38.23B | $15.38B | $3.29B | $10.75B | $16.44B | $9.02B | $19.43B | $10.44B | $23.10B | $11.00B | $9.64B | $11.50B | $19.73B | $10.26B | $11.43B |
| Total Current Assets | $59.51B | $58.92B | $58.82B | $62.83B | $69.22B | $71.08B | $57.78B | $48.96B | $43.21B | $37.53B | $41.84B | $41.67B | $44.27B | $49.65B | $49.73B | $39.38B | $43.41B | $46.81B | $42.20B | $51.29B |
| Property Plant Equipment Net | $50.21B | $37.53B | $39.23B | $38.91B | $39.56B | $44.06B | $43.16B | $45.64B | $47.11B | $48.52B | $55.36B | $57.41B | $56.77B | $57.02B | $57.05B | $52.43B | $53.83B | $57.38B | $61.28B | $68.88B |
| Goodwill | $5.00B | $5.00B | $5.00B | $5.00B | $5.00B | $5.00B | $5.00B | $5.00B | $5.00B | $5.00B | $5.00B | $5.00B | $5.05B | $5.05B | $5.05B | $5.05B | $5.05B | $5.05B | $5.88B | $6.00B |
| Intangible Assets | $1.08B | $979.00M | $1.15B | $1.19B | $1.31B | $1.30B | $1.39B | $1.61B | $1.62B | $1.61B | $2.01B | $2.06B | $1.92B | $1.56B | $1.74B | $1.70B | $1.67B | $1.64B | $1.64B | $2.71B |
| Goodwill and Intangible Assets | $6.08B | $5.98B | $6.15B | $6.19B | $6.31B | $6.30B | $6.38B | $6.61B | $6.62B | $6.62B | $7.01B | $7.06B | $6.97B | $6.61B | $6.79B | $6.75B | $6.72B | $6.69B | $7.52B | $8.71B |
| Long Term Investments | $- | $9.41B | $11.69B | $8.45B | $12.21B | $16.01B | $17.75B | $18.46B | $18.13B | $17.29B | $17.68B | $18.91B | $18.58B | $19.18B | $19.93B | $18.06B | $14.83B | $11.91B | $12.60B | $12.88B |
| Tax Assets | $1.21B | $- | $1.39B | $1.77B | $1.84B | $1.76B | $1.78B | $2.10B | $2.25B | $1.41B | $1.48B | $1.58B | $1.73B | $1.67B | $1.73B | $1.84B | $1.76B | $1.65B | $1.85B | $1.71B |
| Other Non-Current Assets | $13.45B | $5.19B | $6.58B | $3.60B | $3.44B | $739.00M | $662.00M | $653.00M | $678.00M | $596.00M | $722.00M | $546.00M | $353.00M | $327.00M | $369.00M | $634.00M | $4.06B | $3.42B | $3.04B | $4.61B |
| Total Non-Current Assets | $70.95B | $58.12B | $65.05B | $58.92B | $63.36B | $68.88B | $69.73B | $73.46B | $74.79B | $74.42B | $82.24B | $85.51B | $84.40B | $84.81B | $85.87B | $79.72B | $81.19B | $81.04B | $86.29B | $96.78B |
| Other Assets | $- | $3.65B | $- | $- | $- | $- | $- | $- | $- | $- | $- | $- | $- | $- | $- | $- | $- | $- | $- | $- |
| Total Assets | $130.46B | $120.69B | $123.87B | $121.75B | $132.58B | $139.96B | $127.51B | $122.42B | $118.00B | $111.95B | $124.08B | $127.18B | $128.67B | $134.46B | $135.59B | $119.10B | $124.60B | $127.85B | $128.49B | $148.07B |
| Account Payables | $24.87B | $4.58B | $472.00M | $21.85B | $25.12B | $4.04B | $5.08B | $7.11B | $4.69B | $5.54B | $5.57B | $3.42B | $8.99B | $26.04B | $6.93B | $20.44B | $22.44B | $18.76B | $19.42B | $24.55B |
| Short Term Debt | $12.84B | $8.63B | $11.08B | $9.24B | $10.03B | $8.85B | $7.92B | $7.42B | $8.25B | $12.39B | $7.98B | $6.37B | $8.64B | $8.93B | $9.46B | $7.44B | $10.07B | $9.00B | $11.26B | $11.59B |
| Tax Payables | $2.51B | $1.60B | $1.85B | $2.27B | $4.99B | $3.44B | $2.23B | $1.60B | $1.30B | $440.00M | $813.00M | $979.00M | $1.41B | $980.00M | $618.00M | $329.00M | $179.00M | $147.00M | $175.00M | $239.00M |
| Deferred Revenue | $- | $-571.00M | $1.04B | $797.00M | $1.74B | $1.79B | $2.03B | $1.97B | $1.36B | $1.11B | $798.00M | $810.00M | $- | $- | $- | $- | $- | $- | $- | $- |
| Other Current Liabilities | $9.49B | $33.31B | $33.94B | $13.28B | $13.28B | $40.88B | $34.22B | $27.32B | $25.20B | $19.39B | $25.09B | $28.05B | $21.33B | $10.00B | $27.41B | $9.24B | $10.68B | $15.88B | $10.02B | $9.16B |
| Total Current Liabilities | $49.71B | $48.13B | $48.38B | $46.64B | $53.42B | $57.21B | $49.46B | $45.42B | $39.44B | $37.77B | $39.45B | $39.63B | $40.37B | $45.91B | $44.41B | $37.45B | $43.37B | $43.79B | $40.87B | $45.54B |
| Long Term Debt | $25.26B | $22.77B | $21.27B | $19.48B | $18.85B | $22.09B | $26.81B | $27.65B | $29.23B | $26.55B | $29.07B | $29.48B | $26.42B | $24.09B | $24.53B | $23.01B | $23.19B | $29.59B | $32.93B | $39.07B |
| Deferred Revenue Non-Current | $1.11B | $1.22B | $1.29B | $1.44B | $1.55B | $1.77B | $2.09B | $2.32B | $2.59B | $2.44B | $2.67B | $2.38B | $2.30B | $2.59B | $2.56B | $2.22B | $2.27B | $1.90B | $1.45B | $1.02B |
| Deferred Tax Liabilities Non-Current | $5.21B | $2.57B | $2.97B | $3.27B | $3.65B | $4.60B | $4.47B | $4.72B | $4.72B | $4.62B | $5.97B | $6.58B | $6.84B | $6.84B | $7.02B | $5.78B | $5.66B | $5.44B | $5.78B | $6.35B |
| Other Non-Current Liabilities | $13.51B | $10.23B | $11.71B | $9.74B | $9.89B | $9.84B | $7.77B | $7.44B | $7.62B | $7.66B | $7.68B | $7.56B | $7.35B | $7.52B | $7.61B | $6.51B | $8.60B | $13.44B | $13.34B | $15.11B |
| Total Non-Current Liabilities | $45.09B | $36.80B | $37.25B | $33.94B | $33.94B | $38.29B | $41.13B | $42.13B | $44.16B | $41.27B | $45.39B | $46.01B | $42.92B | $41.08B | $41.72B | $37.51B | $37.45B | $43.02B | $46.27B | $54.19B |
| Other Liabilities | $- | $- | $- | $- | $- | $- | $- | $- | $- | $- | $- | $- | $- | $- | $- | $- | $- | $- | $- | $- |
| Total Liabilities | $94.80B | $84.93B | $85.63B | $80.58B | $87.36B | $95.50B | $90.59B | $87.55B | $83.60B | $79.04B | $84.84B | $85.64B | $83.29B | $86.99B | $86.14B | $74.96B | $80.82B | $86.81B | $87.14B | $99.73B |
| Preferred Stock | $- | $- | $- | $7.15B | $4.19B | $6.70B | $3.32B | $5.61B | $3.25B | $6.41B | $2.40B | $- | $4.94B | $4.69B | $2.42B | $2.84B | $2.80B | $3.91B | $4.42B | $3.26B |
| Common Stock | $136.00M | $136.00M | $136.00M | $137.00M | $141.00M | $146.00M | $146.00M | $146.00M | $146.00M | $146.00M | $146.00M | $146.00M | $146.00M | $146.00M | $146.00M | $146.00M | $146.00M | $146.00M | $146.00M | $133.00M |
| Retained Earnings | $27.14B | $29.25B | $26.98B | $29.65B | $25.25B | $19.89B | $7.91B | $4.09B | $2.85B | $1.84B | $4.74B | $5.33B | $5.34B | $4.81B | $2.27B | $-1.27B | $-3.74B | $-5.61B | $-5.10B | $-928.00M |
| Accumulated Other Comprehensive Income Loss | $- | $-7.09B | $-4.41B | $-7.15B | $-4.19B | $-6.70B | $-3.32B | $-5.61B | $-3.25B | $-6.41B | $-2.40B | $-4.67B | $-4.94B | $-4.69B | $-2.42B | $-2.84B | $-2.80B | $-3.91B | $-4.42B | $-3.26B |
| Other Total Stockholders Equity | $13.39B | $19.21B | $23.49B | $23.02B | $30.86B | $34.35B | $37.80B | $38.93B | $40.49B | $40.49B | $40.36B | $41.36B | $45.19B | $46.84B | $44.91B | $49.73B | $45.03B | $42.82B | $41.79B | $42.49B |
| Total Stockholders Equity | $40.67B | $41.50B | $43.58B | $45.65B | $49.41B | $47.68B | $39.93B | $37.55B | $37.64B | $36.07B | $40.27B | $42.17B | $45.74B | $47.10B | $49.76B | $45.77B | $44.24B | $41.27B | $41.25B | $44.95B |
| Total Equity | $35.66B | $35.76B | $38.24B | $41.17B | $45.22B | $44.45B | $36.92B | $34.87B | $34.40B | $32.91B | $39.24B | $41.55B | $45.38B | $47.48B | $49.45B | $44.14B | $43.78B | $41.04B | $41.34B | $48.35B |
| Total Liabilities and Stockholders Equity | $130.46B | $120.69B | $123.87B | $121.75B | $132.58B | $139.96B | $127.51B | $122.42B | $118.00B | $111.95B | $124.08B | $127.18B | $128.67B | $134.46B | $135.59B | $119.10B | $124.60B | $127.85B | $128.49B | $148.07B |
| Minority Interest | $-5.01B | $-5.73B | $-5.34B | $-4.48B | $-4.19B | $-3.23B | $-3.01B | $-2.68B | $-3.23B | $-3.16B | $-1.04B | $-621.00M | $-355.00M | $371.00M | $-300.00M | $-1.63B | $-462.00M | $-231.00M | $89.00M | $3.39B |
| Total Liabilities and Total Equity | $130.46B | $120.69B | $123.87B | $121.75B | $132.58B | $139.96B | $127.51B | $122.42B | $118.00B | $111.95B | $124.08B | $127.18B | $128.67B | $134.46B | $135.59B | $119.10B | $124.60B | $127.85B | $128.49B | $148.07B |
| Total Investments | $9.77B | $9.41B | $11.69B | $8.58B | $12.33B | $12.30B | $13.91B | $14.14B | $14.13B | $14.70B | $15.37B | $15.99B | $15.98B | $16.33B | $16.96B | $15.35B | $14.84B | $11.92B | $12.64B | $12.91B |
| Total Debt | $38.11B | $32.01B | $32.24B | $28.66B | $28.78B | $30.74B | $34.64B | $35.02B | $37.48B | $38.85B | $37.04B | $35.84B | $34.99B | $33.02B | $33.93B | $30.41B | $33.22B | $38.25B | $44.05B | $50.48B |
| Net Debt | $35.94B | $29.23B | $30.32B | $26.80B | $26.93B | $28.11B | $31.95B | $32.47B | $36.06B | $37.43B | $35.14B | $34.00B | $32.95B | $30.84B | $31.81B | $28.44B | $30.71B | $35.71B | $41.34B | $47.42B |
Annual Cash Flow
| Breakdown | December 31, 2024 | December 31, 2023 | December 31, 2022 | December 31, 2021 | December 31, 2020 |
|---|---|---|---|---|---|
| Net Income | $-998.00M | $4.28B | $22.88B | $7.38B | $-5.12B |
| Depreciation and Amortization | $6.60B | $6.61B | $6.99B | $6.33B | $6.67B |
| Deferred Income Tax | $- | $- | $-4.75B | $-476.00M | $-182.00M |
| Stock Based Compensation | $564.00M | $742.00M | $1.13B | $476.00M | $182.00M |
| Change in Working Capital | $2.06B | $3.75B | $-13.27B | $-5.12B | $-4.01B |
| Accounts Receivables | $-80.00M | $7.54B | $-4.94B | $-5.89B | $-385.00M |
| Inventory | $2.77B | $1.98B | $-5.04B | $-5.66B | $-3.19B |
| Accounts Payables | $- | $-5.77B | $-3.29B | $6.42B | $-436.00M |
| Other Working Capital | $-629.00M | $- | $- | $- | $- |
| Other Non Cash Items | $1.83B | $-4.34B | $681.00M | $275.00M | $5.12B |
| Net Cash Provided by Operating Activities | $10.05B | $11.04B | $13.66B | $8.86B | $2.66B |
| Investments in Property Plant and Equipment | $-5.61B | $-4.48B | $-4.18B | $-3.62B | $-3.57B |
| Acquisitions Net | $-6.97B | $344.00M | $776.00M | $252.00M | $-222.00M |
| Purchases of Investments | $-215.00M | $-946.00M | $-476.00M | $-86.00M | $-122.00M |
| Sales Maturities of Investments | $192.00M | $56.00M | $604.00M | $194.00M | $135.00M |
| Other Investing Activities | $880.00M | $1.48B | $1.55B | $2.72B | $1.07B |
| Net Cash Used for Investing Activities | $-11.72B | $-3.56B | $-1.72B | $-541.00M | $-2.71B |
| Debt Repayment | $5.58B | $2.43B | $-5.74B | $-1.90B | $-1.79B |
| Common Stock Issued | $- | $- | $238.00M | $- | $- |
| Common Stock Repurchased | $-230.00M | $-3.67B | $-2.50B | $-746.00M | $- |
| Dividends Paid | $-1.58B | $-6.45B | $-4.83B | $-2.12B | $- |
| Other Financing Activities | $-1.63B | $205.00M | $-367.00M | $-1.76B | $1.47B |
| Net Cash Used Provided by Financing Activities | $2.14B | $-7.49B | $-13.20B | $-6.52B | $-320.00M |
| Effect of Forex Changes on Cash | $-70.00M | $-6.00M | $-50.00M | $11.00M | $-36.00M |
| Net Change in Cash | $402.00M | $-11.00M | $-1.31B | $1.81B | $-403.00M |
| Cash at End of Period | $2.39B | $1.99B | $2.00B | $3.31B | $1.50B |
| Cash at Beginning of Period | $1.99B | $2.00B | $3.31B | $1.50B | $1.90B |
| Operating Cash Flow | $10.05B | $11.04B | $13.66B | $8.86B | $2.66B |
| Capital Expenditure | $-5.61B | $-4.48B | $-4.18B | $-3.62B | $-3.57B |
| Free Cash Flow | $4.44B | $6.55B | $9.48B | $5.24B | $-905.00M |
Cash Flow Charts
| Breakdown | June 30, 2024 | December 31, 2023 | June 30, 2023 | December 31, 2022 | June 30, 2022 | December 31, 2021 | June 30, 2021 | December 31, 2020 | June 30, 2020 | December 31, 2019 | June 30, 2019 | December 31, 2018 | June 30, 2018 | December 31, 2017 | June 30, 2017 | December 31, 2016 | June 30, 2016 | December 31, 2015 | June 30, 2015 | December 31, 2014 |
|---|---|---|---|---|---|---|---|---|---|---|---|---|---|---|---|---|---|---|---|---|
| Net Income | $-233.00M | $-283.74M | $4.57B | $5.29B | $12.09B | $3.72B | $1.28B | $677.18M | $-2.60B | $-626.26M | $226.00M | $632.00M | $2.78B | $3.33B | $2.45B | $1.75B | $-369.00M | $-4.29B | $-676.00M | $588.00M |
| Depreciation and Amortization | $3.08B | $3.72B | $2.83B | $4.01B | $3.39B | $3.43B | $3.10B | $3.51B | $3.14B | $3.99B | $3.23B | $4.44B | $2.92B | $2.95B | $2.54B | $2.83B | $2.74B | $2.87B | $2.76B | $3.48B |
| Deferred Income Tax | $- | $-7.44B | $- | $-12.54B | $- | $-11.66B | $- | $-7.85B | $- | $-7.84B | $- | $-6.45B | $- | $10.36B | $- | $6.58B | $- | $-7.84B | $- | $151.00M |
| Stock Based Compensation | $- | $328.00M | $- | $150.00M | $- | $189.00M | $- | $182.00M | $- | $190.00M | $- | $158.00M | $- | $157.00M | $- | $109.00M | $- | $101.00M | $- | $70.00M |
| Change in Working Capital | $-249.00M | $328.49M | $3.37B | $-4.37B | $-9.04B | $-4.61B | $-544.00M | $-645.98M | $-3.25B | $332.62M | $1.74B | $6.29B | $-21.00M | $-10.52B | $3.74B | $-6.69B | $-1.02B | $7.74B | $2.65B | $-221.00M |
| Accounts Receivables | $-1.53B | $-1.10B | $8.53B | $5.25B | $-10.24B | $-2.43B | $-3.49B | $-3.16B | $2.78B | $462.82M | $741.00M | $2.48B | $249.00M | $-4.27B | $3.11B | $-4.00B | $-1.00B | $3.25B | $1.73B | $1.21B |
| Inventory | $1.28B | $178.73M | $1.77B | $-3.41B | $-1.68B | $-3.87B | $-1.82B | $-3.11B | $14.00M | $288.98M | $385.00M | $3.81B | $-270.00M | $-6.24B | $629.00M | $-2.68B | $-24.00M | $4.49B | $919.00M | $-1.43B |
| Accounts Payables | $2.42B | $1.25B | $-6.93B | $-6.21B | $2.88B | $1.69B | $4.77B | $5.62B | $-6.05B | $-419.18M | $617.00M | $- | $- | $- | $- | $- | $- | $- | $- | $- |
| Other Working Capital | $-2.42B | $- | $- | $- | $- | $- | $- | $- | $- | $- | $- | $- | $- | $- | $- | $- | $- | $- | $- | $- |
| Other Non Cash Items | $2.48B | $8.63B | $-1.58B | $16.18B | $16.18B | $13.79B | $9.37B | $7.72B | $12.21B | $8.29B | $4.79B | $-5.10B | $-538.00M | $4.00B | $-3.83B | $3.33B | $2.15B | $-705.00M | $2.78B | $-213.00M |
| Net Cash Provided by Operating Activities | $5.08B | $5.29B | $6.89B | $8.72B | $6.79B | $4.86B | $6.45B | $3.60B | $-23.00M | $4.34B | $5.28B | $6.43B | $5.13B | $-86.00M | $4.90B | $1.33B | $3.50B | $5.71B | $7.51B | $3.70B |
| Investments in Property Plant and Equipment | $-2.38B | $-2.34B | $-2.08B | $-2.35B | $-1.88B | $-2.09B | $-1.55B | $-1.92B | $-1.55B | $-2.58B | $-2.11B | $-2.74B | $-1.95B | $-2.15B | $-1.44B | $-1.69B | $-1.36B | $-2.59B | $-2.93B | $-4.47B |
| Acquisitions Net | $99.00M | $-296.26M | $713.00M | $-111.90M | $960.00M | $566.82M | $41.00M | $-201.57M | $-18.00M | $58.79M | $-23.00M | $-1.78B | $-1.14B | $-674.00M | $- | $176.00M | $- | $-188.00M | $-130.00M | $-1.79B |
| Purchases of Investments | $-24.00M | $-844.00M | $-88.00M | $-298.16M | $-183.00M | $-73.54M | $-13.00M | $-30.53M | $-88.00M | $-110.26M | $-14.00M | $- | $- | $- | $- | $- | $- | $- | $- | $- |
| Sales Maturities of Investments | $168.00M | $171.43K | $55.00M | $591.55M | $19.00M | $21.23M | $174.00M | $127.16M | $4.00M | $69.29M | $49.00M | $- | $- | $- | $- | $- | $- | $- | $- | $- |
| Other Investing Activities | $353.00M | $-326.00M | $1.75B | $-2.17M | $-200.00M | $1.93B | $1.15B | $778.00M | $80.00M | $548.00M | $571.00M | $-327.00M | $643.00M | $1.22B | $503.00M | $6.15B | $335.00M | $603.00M | $-43.00M | $7.16B |
| Net Cash Used for Investing Activities | $-1.78B | $-3.48B | $-1.40B | $-2.17B | $-1.28B | $-1.58B | $-1.34B | $-2.02B | $-1.65B | $-2.56B | $-2.10B | $-4.85B | $-2.45B | $-1.59B | $-938.00M | $4.64B | $-1.02B | $-2.17B | $-3.10B | $888.00M |
| Debt Repayment | $1.17B | $2.75B | $-353.00M | $-1.03B | $-2.26B | $- | $-2.32B | $-2.33B | $1.35B | $744.53M | $-1.00B | $- | $534.00M | $- | $-2.39B | $- | $-3.95B | $- | $896.00M | $- |
| Common Stock Issued | $- | $-339.89M | $-281.00M | $-6.42M | $247.00M | $-331.01M | $-307.00M | $- | $- | $-35.58K | $6.00M | $- | $2.28B | $- | $- | $- | $- | $- | $4.07B | $- |
| Common Stock Repurchased | $-230.00M | $-1.19B | $-2.43B | $-2.04B | $-486.00M | $-619.72M | $-131.00M | $- | $- | $-1.08B | $-1.23B | $-1.69B | $-321.00M | $- | $- | $- | $- | $-24.00M | $-248.00M | $-756.00M |
| Dividends Paid | $-790.00M | $-3.61B | $-2.75B | $-3.18B | $-1.71B | $-1.33B | $-794.00M | $- | $- | $-1.33B | $-1.37B | $-1.41B | $-1.43B | $-499.00M | $-499.00M | $- | $- | $-777.00M | $-1.55B | $-787.00M |
| Other Financing Activities | $-2.65B | $295.96M | $-18.00M | $-822.64M | $-1.91B | $-491.89M | $-831.00M | $797.82M | $-74.00M | $-92.31M | $207.00M | $1.36B | $-1.41B | $2.32B | $-1.60B | $-6.14B | $1.45B | $-3.09B | $-3.26B | $-3.46B |
| Net Cash Used Provided by Financing Activities | $-2.49B | $-1.75B | $-5.56B | $-7.23B | $-6.12B | $-2.50B | $-4.07B | $-1.54B | $1.28B | $-1.70B | $-3.39B | $-1.74B | $-2.60B | $1.82B | $-4.48B | $-6.13B | $-2.49B | $-3.89B | $-4.17B | $-5.00B |
| Effect of Forex Changes on Cash | $-15.00M | $14.00M | $-20.00M | $-25.00M | $-25.00M | $-4.00M | $15.00M | $36.00M | $-72.00M | $-13.00M | $2.00M | $15.00M | $-48.00M | $20.00M | $1.00M | $-15.00M | $2.71B | $-2.71B | $2.82B | $-2.82B |
| Net Change in Cash | $2.78B | $62.00M | $-60.00M | $-713.00M | $-605.00M | $695.00M | $1.05B | $73.00M | $-474.00M | $61.00M | $-208.00M | $-142.00M | $41.00M | $156.00M | $-516.00M | $-180.00M | $2.69B | $-3.06B | $3.06B | $-3.24B |
| Cash at End of Period | $2.78B | $1.93B | $1.86B | $1.92B | $2.64B | $3.24B | $2.55B | $1.50B | $1.43B | $1.90B | $1.84B | $2.05B | $2.19B | $2.16B | $2.00B | $2.51B | $2.69B | $- | $3.06B | $- |
| Cash at Beginning of Period | $- | $1.86B | $1.92B | $2.64B | $3.24B | $2.55B | $1.50B | $1.43B | $1.90B | $1.84B | $2.05B | $2.19B | $2.15B | $2.00B | $2.52B | $2.69B | $- | $3.06B | $- | $3.24B |
| Operating Cash Flow | $5.08B | $5.29B | $6.89B | $8.72B | $6.79B | $4.86B | $6.45B | $3.60B | $-23.00M | $4.34B | $5.28B | $6.43B | $5.13B | $-86.00M | $4.90B | $1.33B | $3.50B | $5.71B | $7.51B | $3.70B |
| Capital Expenditure | $-2.38B | $-2.34B | $-2.08B | $-2.35B | $-1.88B | $-2.09B | $-1.55B | $-1.92B | $-1.55B | $-2.58B | $-2.11B | $-2.74B | $-1.95B | $-2.15B | $-1.44B | $-1.69B | $-1.36B | $-2.59B | $-2.93B | $-4.47B |
| Free Cash Flow | $2.70B | $2.95B | $4.81B | $6.38B | $4.92B | $2.76B | $4.91B | $1.68B | $-1.57B | $1.76B | $3.17B | $3.69B | $3.19B | $-2.23B | $3.46B | $-355.00M | $2.14B | $3.12B | $4.58B | $-776.00M |

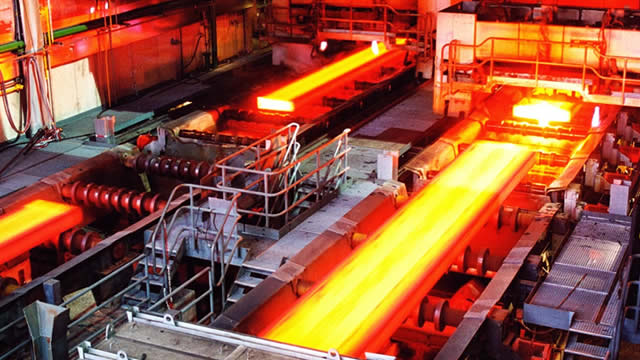
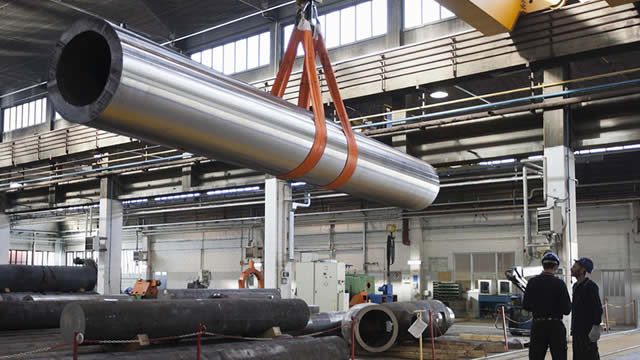
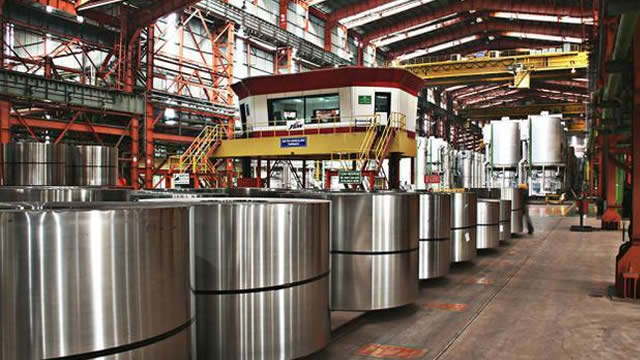
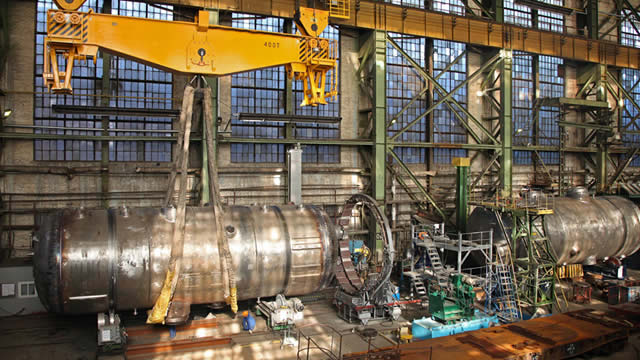
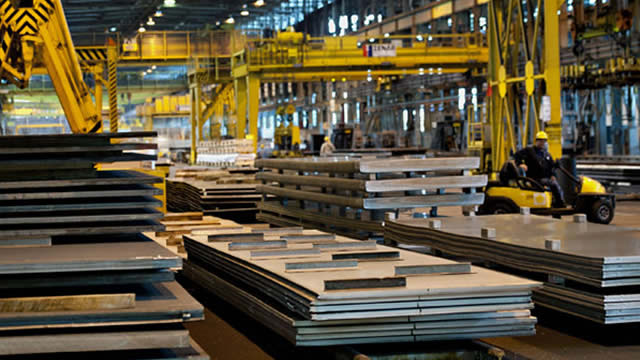
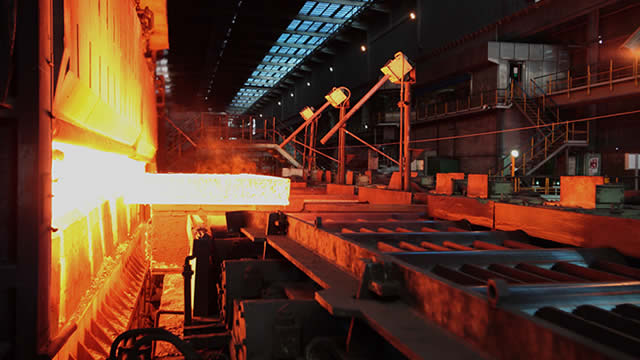
Glencore plc produces, refines, processes, stores, transports, and markets metals and minerals, and energy products in the Americas, Europe, Asia, Africa, and Oceania. It operates through two segments, Marketing Activities and Industrial Activities. The company produces and markets copper, cobalt, nickel, zinc, lead, chrome ore, ferrochrome, vanadium, alumina, aluminum, tin, and iron ore. It also engages in the oil exploration/production, distribution, storage, and bunkering activities; and offers coal, crude oil and oil products, refined products, and natural gas. In addition, the company markets and distributes physical commodities sourced from third party producers and its production to industrial consumers in the battery, electronic, construction, automotive, steel, energy, and oil industries. Further, it provides financing, logistics, and other services to producers and consumers of commodities. The company was formerly known as Glencore Xstrata plc and changed its name to Glencore plc in May 2014. Glencore plc was founded in 1974 and is headquartered in Baar, Switzerland.
$7.05
Stock Price
$42.36B
Market Cap
-
Employees
Baar, None
Location
Revenue (FY 2024)
$230.94B
6.0% YoY
Net Income (FY 2024)
$-1.63B
-138.2% YoY
EPS (FY 2024)
$-0.26
-119.1% YoY
Free Cash Flow (FY 2024)
$4.44B
-32.2% YoY
Profitability
Gross Margin
2.7%
Net Margin
-0.7%
ROE
-4.0%
ROA
-1.3%
Valuation
P/E Ratio
-32.88
P/S Ratio
0.23
EV/EBITDA
9.11
Market Cap
$42.36B
Revenue & Net Income
Profit Margins
Cash Flow Summary
Operating Cash Flow
$10.05B
-8.9% YoY
Free Cash Flow
$4.44B
-32.2% YoY
Balance Sheet Summary
Total Assets
$130.46B
5.3% YoY
Total Debt
$38.11B
18.2% YoY
Shareholder Equity
$40.67B
-52.3% YoY
Dividend Overview
$0.09
Latest Dividend
%
Dividend Yield
%
Payout Ratio
Recent Dividend History
| Date | Amount | Type |
|---|---|---|
| 2025-05-02 | $0.09 | May 02, 25 |
| 2024-08-30 | $0.13 | August 30, 24 |
| 2024-05-02 | $0.13 | May 02, 24 |
| 2023-08-31 | $0.55 | August 31, 23 |
| 2023-05-04 | $0.44 | May 04, 23 |
| 2022-09-01 | $0.48 | September 01, 22 |
| 2022-04-21 | $0.26 | April 21, 22 |
| 2021-09-02 | $0.18 | September 02, 21 |
| 2021-04-22 | $0.12 | April 22, 21 |
| 2020-04-23 | $0.17 | April 23, 20 |
Glencore plc Dividends
Explore Glencore plc's dividend history, including dividend yield, payout ratio, and historical payments.
Dividend Yield
2.94%
Dividend Payout Ratio
-96.70%
Dividend Paid & Capex Coverage Ratio
1.40x
Glencore plc Dividend History
| Dividend | Adjusted Dividend | Date | Record Date | Payment Date | Declaration Date |
|---|---|---|---|---|---|
| $0.085 | $0.085 | May 02, 2025 | May 02, 2025 | June 18, 2025 | March 04, 2025 |
| $0.13 | $0.13 | August 30, 2024 | August 30, 2024 | September 27, 2024 | May 16, 2024 |
| $0.13 | $0.13 | May 02, 2024 | May 03, 2024 | June 20, 2024 | March 22, 2024 |
| $0.55 | $0.55 | August 31, 2023 | September 01, 2023 | October 06, 2023 | August 18, 2023 |
| $0.44 | $0.44 | May 04, 2023 | May 05, 2023 | June 16, 2023 | April 21, 2023 |
| $0.48 | $0.48 | September 01, 2022 | September 02, 2022 | September 29, 2022 | August 31, 2022 |
| $0.26 | $0.26 | April 21, 2022 | April 22, 2022 | June 06, 2022 | February 23, 2022 |
| $0.182 | $0.182 | September 02, 2021 | September 03, 2021 | October 05, 2021 | August 31, 2021 |
| $0.12 | $0.12 | April 22, 2021 | April 23, 2021 | June 07, 2021 | March 13, 2021 |
| $0.17 | $0.17 | April 23, 2020 | June 05, 2020 | ||
| $0.17 | $0.17 | September 05, 2019 | September 06, 2019 | October 08, 2019 | |
| $0.17 | $0.17 | April 25, 2019 | April 26, 2019 | June 10, 2019 | |
| $0.17 | $0.17 | September 06, 2018 | September 07, 2018 | November 19, 2018 | |
| $0.17 | $0.17 | April 26, 2018 | April 27, 2018 | June 07, 2018 | February 27, 2018 |
| $0.07 | $0.07 | September 07, 2017 | September 08, 2017 | October 11, 2017 | August 07, 2017 |
| $0.07 | $0.07 | May 10, 2017 | May 12, 2017 | June 15, 2017 | March 08, 2017 |
| $0.12 | $0.12 | September 09, 2015 | October 13, 2015 | ||
| $0.046 | $0.046 | July 02, 2015 | July 14, 2015 | July 01, 2015 | |
| $0.24 | $0.24 | April 22, 2015 | June 08, 2015 | ||
| $0.12 | $0.12 | September 03, 2014 | October 03, 2014 |
Glencore plc News
Read the latest news about Glencore plc, including recent articles, headlines, and updates.

Glencore hit as recession fears stalk the commodities sector
Glencore PLC (LSE:GLEN) shares slid 5% in early trading on Monday, caught in the broad sell-off following President Trump's sweeping tariffs that have sparked fears of a global recession. While Glencore is one of the world's most diversified miners, it also runs one of the largest commodity trading businesses globally - a model heavily exposed to price swings and market activity.

Stock Picks From Seeking Alpha's March 2025 New Analysts
In March, we welcomed 30 new analysts to Seeking Alpha, and in this article we are showcasing their stock picks and investment strategies. Our analysts covered a diverse set of industries—including IT, financials, utilities, materials, and mining—and provided ratings ranging from Strong Sell to Strong Buy. Top picks include C3.ai, Robinhood, Central Puerto, CF Industries, and Kyndryl.

Glencore: Positive Near-Term Catalysts Ahead
Glencore's marketing division is well-positioned to take advantage of dislocations created by tariffs. There are several positive catalysts to watch out for, such as 1) dual listing, 2) ongoing buyback, and 3) the Viterra/Bunge merger. Despite solid results and good execution, GLNCY is discounted compared to its peers. Our buy is confirmed.
Nickel Miners News For The Month Of March 2025
Nickel spot prices were higher the last month. Critical Raw Materials Act: EU funds 47 raw materials projects, includes 12 nickel projects. Nickel market news - Indonesia's nickel boom is forcing its own smelters to shut down. China to add cobalt, copper, nickel & lithium in boost to state metal reserves. Nickel company news - Vale produced 160kt of nickel in 2024, down from 165kt in 2023. Jinchuan Group International Resources issues a negative profit warning.


Glencore Stock: Coal Isn't A Dirty Word Anymore
Glencore's strategic decision to retain and expand its coal portfolio, despite falling prices, is proving advantageous amid the complex energy transition. Copper is pivotal for Glencore's future growth, with demand set to surge due to electrification and grid expansion, positioning the company favorably. Institutional investors overwhelmingly support Glencore's coal strategy, highlighting the company's ability to capitalize on favorable acquisition opportunities.

Glencore coal action requires support to stabilise market, say bank as it cuts price target
Glencore PLC (LSE:GLEN) will cut production at its Cerrejón thermal coal mine in Colombia by as much as 10 million tonnes this year, a reduction of roughly 8% of its total thermal coal output. The decision, announced on Tuesday, is in response to what the company called “unsustainable prices” in the seaborne coal market.

Technology Minerals makes first black mass shipment to Glencore; completes Leinster sale
Technology Minerals PLC (LSE:TM1) has kicked off deliveries of black mass to Europe in a deal with commodities giant Glencore, marking a key step in its push to build a circular economy for battery metals. The AIM-listed company said its battery recycling arm, Recyclus, which holds a 48.35% stake, has shipped the first batch of the material - 111 tonnes in total - to be delivered in six equal shipments by early April.

Santacruz Silver implements plan to accelerate payments to Glencore
Santacruz Silver Mining Ltd (TSX-V:SCZ, OTC:SZSMF) announced the implementation of a structured payment plan to accelerate its obligations owed to Glencore, securing a cost-saving of US$40 million. As part of the agreement, Santacruz made an initial payment of US$10 million to Glencore under the newly structured plan.

Glencore price target cut on weak coal pricing and underwhelming results
Deutsche Bank has lowered its price target for Glencore PLC (LSE:GLEN) from 480p to 450p, citing weak coal prices, underwhelming 2024 results, and market uncertainty over the company's strategic direction. Despite this, it maintains a 'buy' rating, seeing deep value at current levels.

Technology Minerals to start Black Mass shipments to Glencore in March
Technology Minerals PLC (LSE:TM1) 48.35%-owned battery recycling firm, Recyclus Group, has secured a Transfrontier Shipment of Waste (TFS) licence. The approval allows Recyclus to transport black mass to Europe under its offtake agreement with Glencore.
Glencore Is Highly Undervalued
Glencore's unique value lies in its strong commodity trading operation and disciplined approach to mergers, exemplified by its recent $7bn acquisition of Teck's coal business. CEO Gary Nagle emphasizes share buybacks and potential re-listing on NYSE or ASX for higher valuation, driving significant upside potential. Valuation analysis suggests a 50% upside, with a conservative long-term copper price and stable Marketing segment contributing to the robust forecast.

Glencore plc (GLCNF) Q4 2024 Earnings Call Transcript
Glencore plc (OTCPK:GLCNF) Q4 2024 Earnings Call February 19, 2025 3:30 AM ET Company Participants Martin Fewings - Investor Relations Gary Nagle - Chief Executive Officer Steven Kalmin - Chief Financial Officer Conference Call Participants Izak Rossouw - Barclays Jason Fairclough - Bank of America Ephrem Ravi - Citi Alain Gabriel - Morgan Stanley Chris LaFemina - Jefferies Liam Fitzpatrick - Deutsche Bank Myles Allsop - UBS Bob Brackett - Bernstein Matt Greene - Goldman Sachs Alan Spence - BNP Ben Davis - RBC Richard Hatch - Berenberg Alon Olsha - Bloomberg Intelligence Martin Fewings Good morning. Welcome. Thank you for joining us for our 2024 Financial Results.

Glencore considering ditching London Stock Exchange listing
Glencore PLC has signalled it is considering ditching the London Stock Exchange in favour of a primary listing elsewhere. Following results on Wednesday, chief executive Gary Nagle flagged the miner could potentially move overseas in search of a higher valuation.


Glencore ups dividend and restarts $1bn buyback as earnings fall
Glencore PLC (LSE:GLEN) attempted to paper over the cracks by increasing its dividend and launching a $1 billion share buyback, as earnings fell for a second straight year in 2024 due to weaker commodity prices. The London-listed miner and commodity trader reported adjusted earnings of $14.36 billion, down 16% from $17.1 billion the previous year, driven primarily by lower industrial coal prices.


Glencore upgraded by leading Wall Street bank - here's why
Morgan Stanley has upgraded Glencore PLC (LSE:GLEN) to 'overweight', saying the market has overreacted to concerns about weaker coal prices and potential pressure on its trading business. The bank believes these fears are exaggerated and that Glencore now presents an attractive buying opportunity.

Nickel Miners News For The Month Of January 2025
Nickel spot prices were lower the last month. Nickel market news - Nornickel: "Around 40% of all nickel producers are loss-making at the current price." Indonesia is considering policy to reduce nickel mining quota in 2025 to 150kt. Nickel company news - Nornickel nickel production in 2024 decreased 2% to 205 kt. Vale's nickel production was slightly lower in 2024 at ~160kt.
Glencore says output was in-line with expectations, thanks to stronger second half
Glencore PLC (LSE:GLEN) told investors that its full-year 2024 production remained within guidance, with strong second-half performances across key commodities. The company highlighted significant increases in steelmaking coal production following its acquisition of Elk Valley Resources (EVR).

Glencore: M&A In 2025 Could Ignite This Stock
Glencore's market cap has dropped from over $70 billion to below $57 billion, making it a potential takeover target in 2025. Despite recent declines, commodity demand is expected to rise due to population growth, persistent inflation, and long development times for new projects. The Trump administration's policies could spur M&A activity in the mining sector, enhancing economies of scale and profitability.


Massive mining sector shakeup: Bloomberg reports Rio Tinto and Glencore in preliminary deal talks
Neils Christensen has a diploma in journalism from Lethbridge College and has more than a decade of reporting experience working for news organizations throughout Canada. His experiences include covering territorial and federal politics in Nunavut, Canada.

Rio Tinto, Glencore in talks for potential industry-changing merger – Bloomberg
Mining giants Rio Tinto Ltd (LSE:RIO, ASX:RIO, OTC:RTNTF) and Glencore PLC (LSE:GLEN) have reportedly engaged in preliminary discussions about a potential merger, Bloomberg reported on Thursday, citing sources familiar with the matter. The talks, which remain in the early stages, could pave the way for the mining industry's largest-ever deal, reshaping the global landscape.

Similar Companies
Related Metrics
Explore detailed financial metrics and analysis for GLNCY.