Global Atomic (GLO.TO) Price-to-Earnings (P/E) Ratio
Price: $0.7
Market Cap: $215.65M
Avg Volume: 1.48M
Market Cap: $215.65M
Avg Volume: 1.48M
Country: CA
Industry: Industrial Materials
Sector: Basic Materials
Industry: Industrial Materials
Sector: Basic Materials
Price-to-Earnings (P/E) Ratio Summary
Global Atomic's P/E ratios across different time periods:
- TTM: 20.35
- Annual: 22.67
- Quarterly: 4.07
What is P/E Ratio?
The Price-to-Earnings (P/E) ratio is a valuation metric that compares a company's stock price to its earnings per share (EPS). It indicates how much investors are willing to pay for each dollar of company earnings.
Related Metrics
- Price-to-Book (P/B) Ratio: 0.71
- Price-to-Sales (P/S) Ratio: 204.14
Annual Ratios
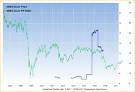
Global Atomic Historical P/E Ratio
Historical P/B Ratio
Historical P/S Ratio
TTM P/E Ratio
20.35
P/B Ratio (Annual)
0.71
P/S Ratio (Annual)
204.14
Global Atomic Historical Valuation Metrics
The table below shows various valuation metrics for each year, with the latest data available for the last fiscal year 2024.
| Year | P/E Ratio | P/B Ratio | P/S Ratio |
|---|---|---|---|
| 2024 | 22.67 | 0.71 | 204.14 |
| 2023 | -33.17 | 3.49 | 798.08 |
| 2022 | -33.66 | 6.17 | 542.45 |
| 2021 | -81.51 | 7.50 | 710.37 |
| 2020 | -64.93 | 4.59 | 335.74 |
| 2019 | 18.42 | 1.30 | 287.53 |
| 2018 | 5.68 | 0.84 | 49.44 |
| 2017 | 2.68 | 0.39 | 15.50 |
| 2016 | 2.19 | 0.65 | 14.35 |
| 2015 | -4.30 | 0.41 | 11.36 |
| 2014 | 7.05 | 1.12 | 26.06 |
| 2013 | 6.68 | 1.11 | 26.45 |
| 2012 | 12.06 | 1.22 | 1.04 |
| 2011 | 7.33 | 1.32 | 1.27 |
| 2010 | 16.80 | 2.50 | 1.20 |
Related Metrics
Explore detailed financial metrics and analysis for GLO.TO.