IGO Key Executives
This section highlights IGO's key executives, including their titles and compensation details.
Find Contacts at IGO
(Showing 0 of )
IGO Earnings
This section highlights IGO's earnings, including key dates, EPS, earnings reports, and earnings call transcripts.
Next Earnings Date
Last Earnings Results
Earnings Call Transcripts
| Transcript | Quarter | Year | Date | Estimated EPS | Actual EPS |
|---|---|---|---|---|---|
| Read Transcript | Q2 | 2025 | 2025-01-30 | N/A | N/A |
| Read Transcript | Q1 | 2025 | 2024-10-28 | N/A | N/A |
| Read Transcript | Q4 | 2024 | 2024-08-29 | N/A | N/A |
| Read Transcript | Q3 | 2024 | 2024-05-05 | N/A | N/A |
| Read Transcript | Q2 | 2024 | 2024-02-22 | N/A | N/A |
| Read Transcript | Q1 | 2024 | 2023-10-30 | N/A | N/A |
| Read Transcript | Q4 | 2023 | 2023-08-31 | N/A | N/A |
| Read Transcript | Q3 | 2023 | 2023-04-29 | N/A | N/A |
Financial Statements
Access annual & quarterly financial statements for IGO, including income statements, balance sheets, and cash flow statements..
Annual Income Statement
| Breakdown | June 30, 2024 | June 30, 2023 | June 30, 2022 | June 30, 2021 | June 30, 2020 |
|---|---|---|---|---|---|
| Revenue | $823.20M | $1.05B | $845.20M | $619.86M | $870.22M |
| Cost of Revenue | $469.00M | $846.70M | $517.90M | $468.12M | $474.95M |
| Gross Profit | $354.20M | $203.20M | $327.30M | $151.74M | $395.26M |
| Gross Profit Ratio | 43.03% | 19.35% | 38.72% | 24.48% | 45.42% |
| Research and Development Expenses | $- | $- | $- | $- | $- |
| General and Administrative Expenses | $241.50M | $114.10M | $66.00M | $56.39M | $67.00M |
| Selling and Marketing Expenses | $21.40M | $22.80M | $20.80M | $16.31M | $17.62M |
| Selling General and Administrative Expenses | $262.90M | $63.40M | $86.80M | $72.70M | $84.62M |
| Other Expenses | $- | $200.00K | $29.30M | $33.01M | $12.71M |
| Operating Expenses | $262.90M | $63.20M | $581.00M | $473.00M | $665.97M |
| Cost and Expenses | $731.90M | $909.90M | $581.00M | $473.00M | $665.97M |
| Interest Income | $15.10M | $9.20M | $2.20M | $2.90M | $6.10M |
| Interest Expense | $17.00M | $41.10M | $5.10M | $25.40M | $3.55M |
| Depreciation and Amortization | $222.20M | $290.00M | $176.30M | $175.97M | $171.72M |
| EBITDA | $144.80M | $430.00M | $644.30M | $357.61M | $466.69M |
| EBITDA Ratio | 17.59% | 40.96% | 76.23% | 57.69% | 53.63% |
| Operating Income | $109.40M | $140.00M | $471.60M | $181.92M | $221.53M |
| Operating Income Ratio | 13.29% | 13.33% | 55.80% | 29.35% | 25.46% |
| Total Other Income Expenses Net | $-203.80M | $-1.06B | $-76.90M | $-201.81M | $-152.28M |
| Income Before Tax | $-94.40M | $-923.30M | $463.50M | $156.59M | $219.51M |
| Income Before Tax Ratio | -11.47% | -87.94% | 54.84% | 25.26% | 25.22% |
| Income Tax Expense | $-97.20M | $131.20M | $132.60M | $39.82M | $64.42M |
| Net Income | $2.80M | $549.10M | $330.90M | $548.66M | $155.09M |
| Net Income Ratio | 0.34% | 52.30% | 39.15% | 88.51% | 17.82% |
| EPS | $0.01 | $1.46 | $0.88 | $0.48 | $0.52 |
| EPS Diluted | $0.01 | $1.44 | $0.88 | $0.48 | $0.52 |
| Weighted Average Shares Outstanding | 378.63M | 378.63M | 378.63M | 339.28M | 298.43M |
| Weighted Average Shares Outstanding Diluted | 378.63M | 379.92M | 379.93M | 340.75M | 299.89M |
| SEC Filing | Source | Source | Source | Source | Source |
| Breakdown | June 30, 2024 | December 31, 2023 | June 30, 2023 | December 31, 2022 | June 30, 2022 | December 31, 2021 | June 30, 2021 | December 31, 2020 | June 30, 2020 | December 31, 2019 | June 30, 2019 | December 31, 2018 | June 30, 2018 | December 31, 2017 | June 30, 2017 | December 31, 2016 | June 30, 2016 | December 31, 2015 | June 30, 2015 | December 31, 2014 |
|---|---|---|---|---|---|---|---|---|---|---|---|---|---|---|---|---|---|---|---|---|
| Revenue | $403.10M | $408.60M | $506.60M | $543.30M | $474.60M | $370.60M | $183.00M | $436.86M | $416.24M | $453.98M | $431.88M | $352.63M | $423.18M | $354.76M | $198.81M | $223.12M | $194.37M | $218.82M | $221.07M | $274.26M |
| Cost of Revenue | $219.60M | $465.50M | $378.90M | $464.90M | $266.00M | $251.20M | $130.46M | $337.31M | $332.16M | $331.24M | $149.01M | $144.35M | $139.97M | $140.60M | $80.69M | $89.45M | $75.63M | $86.95M | $72.66M | $90.63M |
| Gross Profit | $183.50M | $-56.90M | $127.70M | $78.40M | $208.60M | $119.40M | $52.54M | $99.55M | $84.08M | $122.74M | $282.87M | $208.28M | $283.21M | $214.16M | $118.12M | $133.67M | $118.74M | $131.87M | $148.40M | $183.63M |
| Gross Profit Ratio | 45.52% | -13.93% | 25.21% | 14.43% | 43.95% | 32.22% | 28.71% | 22.79% | 20.20% | 27.04% | 65.50% | 59.07% | 66.92% | 60.37% | 59.42% | 59.91% | 61.09% | 60.26% | 67.13% | 66.95% |
| Research and Development Expenses | $- | $- | $- | $- | $- | $- | $- | $- | $- | $- | $- | $- | $- | $- | $- | $- | $- | $- | $- | $- |
| General and Administrative Expenses | $- | $- | $- | $- | $- | $- | $8.26M | $13.60M | $16.85M | $10.97M | $57.94M | $55.73M | $65.61M | $65.38M | $47.98M | $39.15M | $40.08M | $47.44M | $46.05M | $46.01M |
| Selling and Marketing Expenses | $- | $- | $- | $- | $- | $- | $4.20M | $3.95M | $4.14M | $4.67M | $9.92M | $8.42M | $10.31M | $9.47M | $5.01M | $7.08M | $7.31M | $8.83M | $7.76M | $11.78M |
| Selling General and Administrative Expenses | $146.50M | $15.40M | $41.30M | $22.10M | $13.20M | $16.90M | $12.46M | $17.55M | $20.98M | $15.64M | $67.86M | $64.15M | $75.92M | $74.85M | $52.99M | $46.23M | $47.39M | $56.27M | $53.81M | $57.78M |
| Other Expenses | $- | $15.60M | $500.00K | $5.50M | $- | $- | $- | $- | $- | $- | $- | $- | $- | $- | $- | $- | $- | $- | $- | $- |
| Operating Expenses | $146.50M | $-200.00K | $40.80M | $16.60M | $13.20M | $16.90M | $12.46M | $17.55M | $20.98M | $15.64M | $177.03M | $203.45M | $205.82M | $203.40M | $122.09M | $103.26M | $93.11M | $216.63M | $107.90M | $112.60M |
| Cost and Expenses | $366.10M | $465.30M | $419.70M | $481.50M | $279.20M | $268.10M | $142.93M | $354.85M | $353.15M | $346.88M | $326.04M | $347.80M | $345.79M | $344.00M | $202.77M | $192.71M | $168.74M | $303.58M | $180.56M | $203.23M |
| Interest Income | $14.00M | $11.10M | $5.90M | $3.30M | $1.00M | $1.20M | $1.29M | $1.61M | $2.67M | $3.42M | $1.57M | $3.65M | $3.37M | $5.72M | $21.00K | $5.00K | $9.00K | $67.00K | $288.00K | $1.28M |
| Interest Expense | $13.60M | $13.20M | $19.90M | $24.10M | $3.10M | $2.90M | $24.89M | $1.56M | $2.41M | $2.67M | $- | $- | $- | $- | $- | $- | $- | $- | $- | $- |
| Depreciation and Amortization | $203.60M | $108.80M | $127.30M | $159.80M | $87.00M | $88.60M | $52.76M | $122.86M | $115.88M | $127.75M | $109.31M | $127.80M | $129.20M | $122.94M | $66.90M | $47.76M | $47.20M | $88.01M | $51.54M | $50.47M |
| EBITDA | $-178.90M | $52.10M | $-352.35M | $221.60M | $282.40M | $191.10M | $119.00M | $204.87M | $-12.25M | $234.84M | $211.10M | $137.82M | $204.67M | $134.31M | $60.99M | $81.05M | $65.32M | $69.66M | $87.47M | $121.34M |
| EBITDA Ratio | -44.38% | 12.75% | -69.55% | 40.79% | 59.50% | 51.57% | 65.03% | 46.90% | -2.94% | 51.73% | 48.88% | 39.08% | 48.36% | 37.86% | 30.68% | 36.33% | 33.60% | 31.84% | 39.57% | 44.24% |
| Operating Income | $37.00M | $-56.70M | $86.90M | $61.80M | $195.40M | $102.50M | $40.08M | $82.01M | $63.09M | $107.09M | $101.79M | $10.02M | $75.47M | $11.37M | $-5.91M | $33.29M | $18.11M | $-18.35M | $35.92M | $70.87M |
| Operating Income Ratio | 9.18% | -13.88% | 17.15% | 11.37% | 41.17% | 27.66% | 21.90% | 18.77% | 15.16% | 23.59% | 23.57% | 2.84% | 17.84% | 3.20% | -2.97% | 14.92% | 9.32% | -8.38% | 16.25% | 25.84% |
| Total Other Income Expenses Net | $-371.90M | $176.95M | $-87.55M | $-42.10M | $-21.50M | $-38.85M | $24.52M | $-68.31M | $12.73M | $-35.25M | $-110.74M | $-142.95M | $-1.45M | $-134.27M | $1.93M | $-2.89M | $-45.73M | $-160.43M | $-54.38M | $-1.12M |
| Income Before Tax | $-334.90M | $-254.70M | $-943.00M | $19.70M | $173.90M | $112.90M | $79.96M | $76.62M | $75.83M | $143.68M | $104.27M | $1.18M | $74.02M | $5.04M | $-3.99M | $30.40M | $25.61M | $-84.83M | $40.21M | $69.75M |
| Income Before Tax Ratio | -83.08% | -62.33% | -186.14% | 3.63% | 36.64% | 30.46% | 43.69% | 17.54% | 18.22% | 31.65% | 24.14% | 0.34% | 17.49% | 1.42% | -2.00% | 13.63% | 13.18% | -38.77% | 18.19% | 25.43% |
| Income Tax Expense | $49.40M | $-47.80M | $71.10M | $60.10M | $96.00M | $36.60M | $17.35M | $22.47M | $20.82M | $43.60M | $29.04M | $321.00K | $24.50M | $1.88M | $788.00K | $10.19M | $6.57M | $7.01M | $12.96M | $20.23M |
| Net Income | $-285.50M | $288.30M | $-41.90M | $591.00M | $240.20M | $90.70M | $109.69M | $54.15M | $55.01M | $100.08M | $75.22M | $861.00K | $49.52M | $3.16M | $-3.20M | $20.21M | $19.05M | $-77.82M | $27.26M | $49.52M |
| Net Income Ratio | -70.83% | 70.56% | -8.27% | 108.78% | 50.61% | 24.47% | 59.94% | 12.40% | 13.22% | 22.05% | 17.42% | 0.24% | 11.70% | 0.89% | -1.61% | 9.06% | 9.80% | -35.56% | 12.33% | 18.06% |
| EPS | $-0.76 | $0.76 | $-0.11 | $1.56 | $0.64 | $0.24 | $0.28 | $0.15 | $0.18 | $0.34 | $0.25 | $0.00 | $0.17 | $0.01 | $-0.01 | $0.07 | $0.07 | $-0.40 | $0.23 | $0.40 |
| EPS Diluted | $-0.76 | $0.76 | $-0.11 | $1.56 | $0.64 | $0.24 | $0.28 | $0.15 | $0.18 | $0.34 | $0.25 | $0.00 | $0.17 | $0.01 | $-0.01 | $0.07 | $0.07 | $-0.40 | $0.23 | $0.40 |
| Weighted Average Shares Outstanding | 378.62M | 377.93M | 378.12M | 378.08M | 378.47M | 378.44M | 378.57M | 372.39M | 298.45M | 298.45M | 305.71M | 287.00M | 296.34M | 292.87M | 291.79M | 287.88M | 255.57M | 192.71M | 118.34M | 118.13M |
| Weighted Average Shares Outstanding Diluted | 378.62M | 379.54M | 378.12M | 379.62M | 379.98M | 379.82M | 378.57M | 372.39M | 300.24M | 299.70M | 305.86M | 287.00M | 296.20M | 292.87M | 293.36M | 287.88M | 255.35M | 192.71M | 118.30M | 118.13M |
| SEC Filing | Source | Source | Source | Source | Source | Source | Source | Source | Source | Source | Source | Source | Source | Source | Source | Source | Source | Source | Source | Source |
Annual Balance Sheet
| Breakdown | June 30, 2024 | June 30, 2023 | June 30, 2022 | June 30, 2021 | June 30, 2020 |
|---|---|---|---|---|---|
| Cash and Cash Equivalents | $468.00M | $775.20M | $367.10M | $528.51M | $510.31M |
| Short Term Investments | $62.40M | $62.40M | $126.80M | $110.94M | $107.76M |
| Cash and Short Term Investments | $535.50M | $837.60M | $493.90M | $639.46M | $618.07M |
| Net Receivables | $40.10M | $73.10M | $95.10M | $79.37M | $65.91M |
| Inventory | $120.00M | $136.20M | $82.50M | $34.01M | $75.67M |
| Other Current Assets | $63.70M | $90.90M | $73.70M | $5.75M | $3.22M |
| Total Current Assets | $759.30M | $1.14B | $745.20M | $758.60M | $762.87M |
| Property Plant Equipment Net | $602.40M | $617.90M | $2.00B | $963.48M | $1.34B |
| Goodwill | $- | $- | $- | $- | $- |
| Intangible Assets | $- | $- | $- | $- | $- |
| Goodwill and Intangible Assets | $- | $-1 | $- | $-100.53M | $-284.00K |
| Long Term Investments | $2.20B | $2.45B | $1.99B | $1.86B | $284.00K |
| Tax Assets | $- | $69.50M | $26.60M | $30.72M | $119.73M |
| Other Non-Current Assets | $2.80M | $464.80M | $82.40M | $100.53M | $68.20M |
| Total Non-Current Assets | $2.81B | $3.60B | $4.10B | $2.85B | $1.53B |
| Other Assets | $- | $1 | $- | $- | $- |
| Total Assets | $3.57B | $4.74B | $4.85B | $3.61B | $2.29B |
| Account Payables | $68.70M | $160.80M | $149.20M | $47.29M | $53.01M |
| Short Term Debt | $22.50M | $207.50M | $196.60M | $4.42M | $63.17M |
| Tax Payables | $- | $- | $83.30M | $171.95M | $- |
| Deferred Revenue | $- | $- | $- | $- | $- |
| Other Current Liabilities | $38.50M | $41.70M | $10.90M | $8.72M | $7.06M |
| Total Current Liabilities | $129.70M | $410.00M | $440.00M | $232.38M | $123.24M |
| Long Term Debt | $26.20M | $224.60M | $750.80M | $20.63M | $33.55M |
| Deferred Revenue Non-Current | $- | $45.10M | $- | $- | $- |
| Deferred Tax Liabilities Non-Current | $- | $219.50M | $137.00M | $108.56M | $141.79M |
| Other Non-Current Liabilities | $201.60M | $313.10M | $219.20M | $47.29M | $210.43M |
| Total Non-Current Liabilities | $227.80M | $537.70M | $970.00M | $176.47M | $243.98M |
| Other Liabilities | $- | $- | $- | $- | $- |
| Total Liabilities | $357.50M | $947.70M | $1.41B | $408.86M | $367.22M |
| Preferred Stock | $- | $- | $- | $- | $- |
| Common Stock | $2.65B | $2.65B | $2.64B | $2.65B | $1.90B |
| Retained Earnings | $5.10M | $594.90M | $45.80M | $45.76M | $9.81M |
| Accumulated Other Comprehensive Income Loss | $581.00M | $563.80M | $747.60M | $505.54M | $18.87M |
| Other Total Stockholders Equity | $-28.00M | $-19.70M | $- | $- | $- |
| Total Stockholders Equity | $3.21B | $3.79B | $3.44B | $3.20B | $1.93B |
| Total Equity | $3.21B | $3.79B | $3.44B | $3.20B | $1.93B |
| Total Liabilities and Stockholders Equity | $3.57B | $4.74B | $4.85B | $3.61B | $2.29B |
| Minority Interest | $- | $- | $- | $- | $- |
| Total Liabilities and Total Equity | $3.57B | $4.74B | $4.85B | $3.61B | $2.29B |
| Total Investments | $2.26B | $2.51B | $2.12B | $1.97B | $107.76M |
| Total Debt | $48.70M | $432.10M | $947.40M | $25.05M | $96.72M |
| Net Debt | $-419.30M | $-343.10M | $580.30M | $-503.47M | $-413.59M |
Balance Sheet Charts
| Breakdown | June 30, 2024 | December 31, 2023 | June 30, 2023 | December 31, 2022 | June 30, 2022 | December 31, 2021 | June 30, 2021 | December 31, 2020 | June 30, 2020 | December 31, 2019 | June 30, 2019 | December 31, 2018 | June 30, 2018 | December 31, 2017 | June 30, 2017 | December 31, 2016 | June 30, 2016 | December 31, 2015 | June 30, 2015 | December 31, 2014 |
|---|---|---|---|---|---|---|---|---|---|---|---|---|---|---|---|---|---|---|---|---|
| Cash and Cash Equivalents | $468.00M | $276.40M | $367.10M | $515.00M | $367.10M | $569.80M | $528.51M | $1.19B | $510.31M | $452.76M | $348.21M | $208.07M | $138.69M | $51.34M | $35.76M | $109.22M | $46.26M | $58.93M | $121.30M | $93.33M |
| Short Term Investments | $62.40M | $63.20M | $126.80M | $119.60M | $126.80M | $125.30M | $110.94M | $114.24M | $107.76M | $68.59M | $27.53M | $22.23M | $24.29M | $14.81M | $15.35M | $9.43M | $5.02M | $13.67M | $15.57M | $1.02M |
| Cash and Short Term Investments | $535.50M | $339.60M | $493.90M | $634.60M | $493.90M | $695.10M | $639.46M | $1.30B | $618.07M | $521.35M | $375.74M | $230.31M | $162.98M | $66.15M | $51.11M | $118.64M | $51.28M | $72.60M | $136.87M | $94.35M |
| Net Receivables | $40.10M | $89.30M | $73.10M | $123.90M | $95.10M | $63.80M | $79.37M | $41.57M | $65.91M | $30.27M | $24.57M | $48.33M | $50.86M | $90.06M | $56.56M | $30.65M | $21.56M | $29.00M | $13.48M | $33.17M |
| Inventory | $120.00M | $115.10M | $82.50M | $75.50M | $82.50M | $42.50M | $34.01M | $84.85M | $75.67M | $80.12M | $70.27M | $64.68M | $82.49M | $63.41M | $63.16M | $40.99M | $46.50M | $33.72M | $40.30M | $32.67M |
| Other Current Assets | $63.70M | $152.30M | $90.90M | $32.40M | $73.70M | $1.90M | $5.75M | $115.45M | $3.22M | $473.00K | $23.66M | $- | $45.23M | $3.41M | $48.28M | $3.11M | $10.12M | $- | $8.61M | $5.80M |
| Total Current Assets | $759.30M | $710.00M | $745.20M | $866.40M | $745.20M | $803.30M | $758.60M | $1.54B | $762.87M | $632.21M | $494.25M | $343.32M | $341.55M | $223.04M | $219.11M | $193.40M | $129.46M | $135.32M | $204.24M | $165.99M |
| Property Plant Equipment Net | $602.40M | $516.50M | $2.00B | $1.75B | $1.75B | $783.50M | $963.48M | $1.17B | $1.34B | $1.31B | $1.45B | $1.51B | $1.56B | $1.68B | $1.72B | $1.72B | $1.63B | $1.49B | $460.47M | $476.30M |
| Goodwill | $- | $- | $- | $- | $- | $- | $- | $- | $- | $- | $- | $- | $- | $- | $- | $- | $- | $- | $- | $- |
| Intangible Assets | $- | $- | $- | $- | $- | $- | $- | $- | $- | $- | $- | $- | $- | $- | $- | $- | $- | $- | $- | $- |
| Goodwill and Intangible Assets | $- | $- | $- | $- | $- | $- | $-100.53M | $-1 | $-288.00K | $- | $- | $- | $- | $- | $- | $- | $14.00K | $- | $- | $- |
| Long Term Investments | $2.20B | $2.31B | $1.99B | $2.24B | $2.08B | $1.89B | $1.86B | $259.00K | $288.00K | $15.26M | $- | $- | $- | $- | $- | $- | $799.00K | $19.00K | $- | $- |
| Tax Assets | $- | $106.00M | $26.60M | $17.80M | $26.60M | $29.30M | $30.72M | $100.90M | $119.73M | $127.69M | $180.24M | $- | $207.27M | $- | $251.43M | $- | $219.43M | $- | $130.52M | $- |
| Other Non-Current Assets | $2.80M | $466.20M | $82.40M | $245.90M | $243.00M | $145.20M | $100.53M | $152.49M | $68.20M | $167.54M | $67.59M | $294.30M | $62.51M | $273.20M | $20.09M | $262.86M | $32.00M | $237.37M | $25.00M | $152.15M |
| Total Non-Current Assets | $2.81B | $3.39B | $4.10B | $4.25B | $4.10B | $2.85B | $2.85B | $1.43B | $1.53B | $1.62B | $1.70B | $1.80B | $1.83B | $1.96B | $1.99B | $1.99B | $1.88B | $1.72B | $615.99M | $628.44M |
| Other Assets | $- | $- | $- | $- | $- | $- | $- | $1 | $- | $- | $- | $- | $- | $- | $- | $- | $- | $- | $- | $- |
| Total Assets | $3.57B | $4.10B | $4.85B | $5.12B | $4.85B | $3.65B | $3.61B | $2.97B | $2.29B | $2.25B | $2.19B | $2.15B | $2.17B | $2.18B | $2.21B | $2.18B | $2.01B | $1.86B | $820.22M | $794.43M |
| Account Payables | $68.70M | $100.70M | $160.80M | $154.20M | $149.20M | $42.50M | $47.29M | $54.33M | $53.01M | $50.42M | $49.90M | $49.45M | $14.45M | $66.50M | $6.40M | $46.51M | $9.93M | $113.55M | $8.92M | $40.04M |
| Short Term Debt | $22.50M | $25.20M | $207.50M | $196.40M | $196.60M | $4.50M | $4.42M | $5.97M | $63.17M | $63.20M | $56.23M | $56.23M | $56.23M | $56.23M | $56.23M | $27.66M | $43.15M | $82.00K | $510.00K | $1.75M |
| Tax Payables | $- | $- | $- | $- | $77.00M | $209.00M | $171.95M | $- | $- | $- | $- | $- | $- | $- | $- | $- | $- | $- | $- | $- |
| Deferred Revenue | $- | $- | $- | $- | $77.00M | $209.00M | $- | $- | $- | $- | $- | $- | $- | $- | $42.65M | $- | $97.20M | $- | $36.17M | $- |
| Other Current Liabilities | $38.50M | $43.30M | $71.70M | $80.50M | $-59.80M | $11.60M | $8.72M | $16.84M | $7.06M | $6.29M | $5.18M | $5.56M | $47.03M | $19.40M | $58.88M | $8.32M | $106.59M | $2.39M | $41.22M | $6.68M |
| Total Current Liabilities | $129.70M | $169.20M | $440.00M | $431.10M | $440.00M | $267.60M | $232.38M | $77.15M | $123.24M | $119.91M | $111.31M | $111.24M | $117.71M | $142.12M | $121.50M | $82.49M | $159.67M | $116.02M | $50.64M | $48.48M |
| Long Term Debt | $26.20M | $36.10M | $224.60M | $539.70M | $750.80M | $18.40M | $20.63M | $31.68M | $33.55M | $32.13M | $28.36M | $56.48M | $84.59M | $112.71M | $140.81M | $168.93M | $222.67M | $194.47M | $- | $82.00K |
| Deferred Revenue Non-Current | $- | $- | $- | $31.60M | $37.30M | $-1 | $- | $- | $- | $-1 | $- | $- | $- | $- | $- | $- | $- | $- | $- | $- |
| Deferred Tax Liabilities Non-Current | $- | $208.00M | $137.00M | $149.00M | $137.00M | $106.50M | $108.56M | $141.71M | $141.79M | $128.96M | $137.91M | $- | $131.64M | $- | $139.90M | $- | $100.95M | $- | $73.98M | $- |
| Other Non-Current Liabilities | $201.60M | $303.50M | $745.40M | $233.40M | $219.20M | $154.40M | $47.29M | $212.71M | $210.43M | $191.96M | $201.54M | $196.99M | $193.81M | $193.37M | $213.38M | $184.57M | $169.25M | $111.88M | $104.08M | $94.55M |
| Total Non-Current Liabilities | $227.80M | $339.60M | $970.00M | $773.10M | $970.00M | $172.80M | $176.47M | $244.39M | $243.98M | $224.09M | $229.90M | $253.47M | $278.39M | $306.08M | $354.20M | $353.50M | $391.93M | $306.35M | $104.08M | $94.63M |
| Other Liabilities | $- | $- | $- | $- | $- | $1 | $- | $- | $- | $1 | $- | $- | $- | $- | $- | $- | $- | $- | $- | $- |
| Total Liabilities | $357.50M | $508.80M | $1.41B | $1.20B | $1.41B | $440.40M | $408.86M | $321.54M | $367.22M | $344.00M | $341.21M | $364.71M | $396.10M | $448.20M | $475.70M | $435.99M | $551.60M | $422.37M | $154.73M | $143.10M |
| Preferred Stock | $- | $- | $- | $- | $- | $- | $- | $- | $- | $- | $- | $- | $- | $- | $- | $- | $- | $- | $- | $- |
| Common Stock | $2.65B | $2.65B | $2.64B | $2.65B | $2.65B | $2.65B | $2.65B | $2.59B | $1.90B | $1.90B | $1.90B | $1.90B | $1.88B | $1.88B | $1.88B | $1.88B | $1.60B | $1.60B | $737.32M | $737.32M |
| Retained Earnings | $5.10M | $883.20M | $45.80M | $636.80M | $45.80M | $136.50M | $45.76M | $34.42M | $9.81M | $-9.75M | $-62.57M | $-125.99M | $-115.04M | $-161.84M | $-159.13M | $-150.06M | $-158.54M | $-178.81M | $-88.02M | $-101.22M |
| Accumulated Other Comprehensive Income Loss | $581.00M | $90.70M | $747.60M | $648.10M | $747.60M | $432.80M | $505.54M | $18.81M | $18.87M | $16.68M | $15.78M | $13.15M | $14.77M | $15.98M | $13.45M | $15.12M | $12.87M | $12.95M | $16.19M | $15.22M |
| Other Total Stockholders Equity | $-28.00M | $-131.90M | $-355.00M | $-662.60M | $- | $-417.30M | $- | $- | $- | $- | $- | $1 | $- | $- | $- | $- | $- | $1 | $- | $1 |
| Total Stockholders Equity | $3.21B | $3.60B | $3.44B | $3.92B | $3.44B | $3.21B | $3.20B | $2.65B | $1.93B | $1.90B | $1.85B | $1.78B | $1.78B | $1.73B | $1.73B | $1.74B | $1.46B | $1.44B | $665.50M | $651.32M |
| Total Equity | $3.21B | $3.60B | $3.44B | $3.92B | $3.44B | $3.21B | $3.20B | $2.65B | $1.93B | $1.90B | $1.85B | $1.78B | $1.78B | $1.73B | $1.73B | $1.74B | $1.46B | $1.44B | $665.50M | $651.32M |
| Total Liabilities and Stockholders Equity | $3.57B | $4.10B | $4.85B | $5.12B | $4.85B | $3.65B | $3.61B | $2.97B | $2.29B | $2.25B | $2.19B | $2.15B | $2.17B | $2.18B | $2.21B | $2.18B | $2.01B | $1.86B | $820.22M | $794.43M |
| Minority Interest | $- | $- | $- | $- | $- | $- | $- | $- | $- | $- | $- | $- | $- | $- | $- | $- | $- | $- | $- | $- |
| Total Liabilities and Total Equity | $3.57B | $4.10B | $4.85B | $5.12B | $4.85B | $3.65B | $3.61B | $2.97B | $2.29B | $2.25B | $2.19B | $2.15B | $2.17B | $2.18B | $2.21B | $2.18B | $2.01B | $1.86B | $820.22M | $794.43M |
| Total Investments | $2.26B | $2.37B | $2.12B | $2.36B | $2.20B | $2.02B | $1.97B | $114.50M | $107.76M | $83.85M | $27.53M | $22.23M | $24.29M | $14.81M | $15.35M | $9.43M | $5.82M | $13.69M | $15.57M | $1.02M |
| Total Debt | $48.70M | $61.30M | $947.40M | $736.10M | $947.40M | $22.90M | $25.05M | $37.65M | $96.72M | $95.33M | $84.59M | $112.71M | $140.81M | $168.93M | $197.04M | $196.59M | $265.83M | $194.47M | $510.00K | $82.00K |
| Net Debt | $-419.30M | $-215.10M | $580.30M | $221.10M | $580.30M | $-546.90M | $-503.47M | $-1.15B | $-413.59M | $-357.43M | $-263.62M | $-95.37M | $2.13M | $117.60M | $161.28M | $87.37M | $219.56M | $135.54M | $-120.79M | $-93.25M |
Annual Cash Flow
| Breakdown | June 30, 2024 | June 30, 2023 | June 30, 2022 | June 30, 2021 | June 30, 2020 |
|---|---|---|---|---|---|
| Net Income | $2.80M | $549.10M | $330.90M | $116.77M | $86.31M |
| Depreciation and Amortization | $225.80M | $290.00M | $176.30M | $175.97M | $171.72M |
| Deferred Income Tax | $- | $104.10M | $30.60M | $60.06M | $64.42M |
| Stock Based Compensation | $10.30M | $11.80M | $6.30M | $4.90M | $4.49M |
| Change in Working Capital | $39.50M | $-160.20M | $-40.00M | $176.94M | $-37.32M |
| Accounts Receivables | $30.40M | $-55.50M | $13.60M | $-31.39M | $-21.33M |
| Inventory | $20.00M | $-36.60M | $-300.00K | $9.05M | $-20.71M |
| Accounts Payables | $- | $-7.50M | $39.60M | $24.39M | $1.12M |
| Other Working Capital | $-10.90M | $-60.60M | $-92.90M | $174.89M | $3.60M |
| Other Non Cash Items | $593.60M | $1.28B | $190.30M | $266.21M | $496.76M |
| Net Cash Provided by Operating Activities | $872.00M | $1.39B | $388.40M | $446.05M | $397.52M |
| Investments in Property Plant and Equipment | $-198.90M | $-338.40M | $-88.10M | $-94.71M | $-87.67M |
| Acquisitions Net | $- | $52.60M | $-1.17B | $-977.00M | $27.53M |
| Purchases of Investments | $-41.20M | $-7.80M | $-2.80M | $-20.50M | $-54.92M |
| Sales Maturities of Investments | $- | $52.60M | $-69.30M | $27.23M | $43.09M |
| Other Investing Activities | $-200.00K | $-52.60M | $47.70M | $11.00K | $-43.37M |
| Net Cash Used for Investing Activities | $-240.30M | $-293.60M | $-1.28B | $-1.06B | $-115.34M |
| Debt Repayment | $-360.00M | $-540.20M | $889.90M | $-74.66M | $-28.57M |
| Common Stock Issued | $- | $-200.00K | $- | $765.77M | $- |
| Common Stock Repurchased | $-13.10M | $-13.10M | $-10.10M | $-16.67M | $- |
| Dividends Paid | $-537.70M | $-143.90M | $-113.60M | $-29.54M | $-82.71M |
| Other Financing Activities | $-46.00M | $-42.60M | $-4.40M | $-11.90M | $-5.68M |
| Net Cash Used Provided by Financing Activities | $-943.70M | $-726.70M | $761.80M | $633.00M | $-116.96M |
| Effect of Forex Changes on Cash | $4.80M | $5.30M | $700.00K | $4.12M | $-3.11M |
| Net Change in Cash | $-307.20M | $408.10M | $-161.40M | $18.20M | $162.10M |
| Cash at End of Period | $468.00M | $775.20M | $367.10M | $528.51M | $510.31M |
| Cash at Beginning of Period | $775.20M | $367.10M | $528.50M | $510.31M | $348.21M |
| Operating Cash Flow | $872.00M | $1.39B | $388.40M | $446.05M | $397.52M |
| Capital Expenditure | $-198.90M | $-338.40M | $-88.10M | $-94.71M | $-87.67M |
| Free Cash Flow | $673.10M | $1.05B | $300.30M | $351.34M | $309.85M |
Cash Flow Charts
| Breakdown | June 30, 2024 | December 31, 2023 | June 30, 2023 | December 31, 2022 | June 30, 2022 | December 31, 2021 | June 30, 2021 | December 31, 2020 | June 30, 2020 | December 31, 2019 | June 30, 2019 | December 31, 2018 | June 30, 2018 | December 31, 2017 | June 30, 2017 | December 31, 2016 | June 30, 2016 | December 31, 2015 | June 30, 2015 | December 31, 2014 |
|---|---|---|---|---|---|---|---|---|---|---|---|---|---|---|---|---|---|---|---|---|
| Net Income | $-285.50M | $288.30M | $-41.90M | $591.00M | $240.20M | $90.70M | $62.61M | $54.15M | $55.01M | $100.08M | $75.22M | $861.00K | $49.52M | $3.16M | $-3.20M | $20.21M | $19.05M | $-77.82M | $27.26M | $49.52M |
| Depreciation and Amortization | $234.10M | $108.80M | $127.30M | $159.80M | $87.00M | $88.60M | $52.76M | $122.86M | $115.88M | $127.75M | $109.31M | $127.80M | $129.20M | $122.94M | $66.90M | $47.76M | $47.20M | $88.01M | $51.54M | $50.47M |
| Deferred Income Tax | $- | $- | $-279.20M | $- | $-168.75M | $- | $60.06M | $- | $64.42M | $- | $- | $- | $- | $- | $- | $- | $- | $- | $- | $- |
| Stock Based Compensation | $4.00M | $3.15M | $4.10M | $1.80M | $1.70M | $1.45M | $1.20M | $1.25M | $1.16M | $1.08M | $1.58M | $1.54M | $1.98M | $1.29M | $724.00K | $423.00K | $537.00K | $282.00K | $1.60M | $1.35M |
| Change in Working Capital | $39.50M | $- | $20.50M | $- | $-6.95M | $- | $-9.70M | $- | $-8.61M | $- | $28.53M | $- | $-89.71M | $- | $-2.58M | $- | $-13.55M | $- | $-6.58M | $- |
| Accounts Receivables | $30.40M | $- | $11.05M | $- | $12.95M | $- | $-14.60M | $- | $- | $- | $25.37M | $- | $-26.91M | $- | $-10.43M | $- | $-6.49M | $- | $11.35M | $- |
| Inventory | $20.00M | $- | $-18.30M | $- | $-150.00K | $- | $4.55M | $- | $-10.36M | $- | $-7.38M | $- | $-49.69M | $- | $635.00K | $- | $-12.91M | $- | $-16.09M | $- |
| Accounts Payables | $- | $- | $- | $- | $- | $- | $- | $- | $- | $- | $- | $- | $- | $- | $- | $- | $- | $- | $- | $- |
| Other Working Capital | $-10.90M | $- | $27.75M | $- | $-19.75M | $- | $350.00K | $- | $1.74M | $- | $10.53M | $- | $-13.11M | $- | $7.21M | $- | $5.85M | $- | $-1.83M | $- |
| Other Non Cash Items | $312.20M | $388.20M | $994.30M | $130.70M | $31.70M | $201.40M | $134.47M | $310.38M | $148.62M | $273.01M | $-5.32M | $32.77M | $75.45M | $-16.02M | $-9.75M | $-42.81M | $-1.29M | $39.63M | $13.97M | $12.58M |
| Net Cash Provided by Operating Activities | $304.30M | $567.70M | $825.10M | $561.90M | $184.90M | $203.50M | $204.39M | $241.66M | $152.17M | $245.35M | $209.34M | $162.97M | $166.43M | $111.37M | $52.09M | $25.59M | $51.95M | $50.11M | $87.78M | $113.93M |
| Investments in Property Plant and Equipment | $-13.60M | $-185.30M | $-196.60M | $-141.80M | $-30.40M | $-57.70M | $-42.73M | $-51.98M | $-47.42M | $-40.25M | $-44.83M | $-61.36M | $-70.38M | $-69.82M | $-112.83M | $-125.88M | $-144.29M | $-92.49M | $-34.35M | $-38.79M |
| Acquisitions Net | $- | $- | $52.60M | $- | $-1.17B | $100.00K | $16.38M | $26.98M | $27.53M | $- | $- | $- | $- | $- | $-942.00K | $-16.63M | $- | $-202.05M | $- | $- |
| Purchases of Investments | $- | $-40.40M | $-800.00K | $-7.00M | $-8.30M | $-16.20M | $-1.76B | $-111.85M | $-32.37M | $-22.55M | $- | $- | $- | $- | $- | $- | $- | $- | $- | $- |
| Sales Maturities of Investments | $- | $- | $-25.90M | $- | $4.15M | $- | $862.35M | $- | $-1 | $- | $- | $- | $- | $- | $- | $- | $- | $- | $- | $- |
| Other Investing Activities | $-1.00M | $-20.20M | $25.90M | $-3.50M | $-4.15M | $-8.05M | $-59.00K | $3.85M | $-278.00K | $-11.27M | $16.30M | $7.08M | $25.65M | $9.55M | $-5.47M | $-11.54M | $8.73M | $-241.00K | $-12.86M | $115.00K |
| Net Cash Used for Investing Activities | $-14.60M | $-225.70M | $-144.80M | $-148.80M | $-1.21B | $-73.80M | $-928.12M | $-136.85M | $-52.54M | $-62.80M | $-28.53M | $-54.28M | $-44.73M | $-60.27M | $-119.24M | $-154.05M | $-135.56M | $-294.79M | $-47.21M | $-38.67M |
| Debt Repayment | $- | $- | $- | $- | $- | $- | $- | $- | $- | $- | $- | $- | $- | $- | $- | $- | $- | $- | $- | $- |
| Common Stock Issued | $- | $- | $-200.00K | $- | $-10.10M | $- | $35.30M | $- | $- | $- | $- | $- | $- | $- | $- | $- | $- | $- | $- | $- |
| Common Stock Repurchased | $- | $-6.55M | $- | $-6.55M | $1.80B | $-5.05M | $1.00K | $-5.76M | $- | $- | $- | $- | $- | $- | $- | $- | $- | $- | $- | $- |
| Dividends Paid | $-83.30M | $-454.40M | $-106.00M | $-37.90M | $-37.90M | $-75.70M | $- | $-29.54M | $-35.45M | $-47.26M | $-11.81M | $-11.81M | $-5.87M | $-5.87M | $-5.87M | $-11.73M | $- | $-12.79M | $-14.05M | $-11.71M |
| Other Financing Activities | $-15.30M | $-384.15M | $-121.90M | $-91.00M | $443.90M | $36.70M | $32.83M | $317.75M | $16.16M | $8.07M | $-28.57M | $-28.57M | $-28.57M | $-28.57M | $- | $202.93M | $70.91M | $194.23M | $-1.46M | $-27.18M |
| Net Cash Used Provided by Financing Activities | $-98.60M | $-845.10M | $-455.80M | $-270.90M | $849.90M | $-88.10M | $32.83M | $600.17M | $-38.57M | $-78.39M | $-40.38M | $-40.38M | $-34.44M | $-34.44M | $-5.87M | $191.20M | $70.91M | $181.44M | $-15.51M | $-38.89M |
| Effect of Forex Changes on Cash | $500.00K | $2.15M | $-200.00K | $2.85M | $500.00K | $-150.00K | $16.65M | $-14.60M | $-1.75M | $194.50K | $-290.00K | $1.07M | $90.00K | $-1.09M | $-438.00K | $215.00K | $37.00K | $870.00K | $2.90M | $- |
| Net Change in Cash | $- | $-498.80M | $260.20M | $147.90M | $-202.70M | $41.29M | $-657.62M | $675.82M | $57.55M | $104.16M | $70.07M | $34.69M | $43.68M | $7.79M | $-36.73M | $31.48M | $-6.33M | $-31.18M | $13.98M | $18.18M |
| Cash at End of Period | $468.00M | $276.40M | $775.20M | $515.00M | $367.10M | $569.80M | $528.51M | $1.19B | $510.31M | $452.76M | $70.07M | $208.07M | $43.68M | $51.34M | $-36.73M | $109.22M | $-6.33M | $58.93M | $13.98M | $93.33M |
| Cash at Beginning of Period | $276.40M | $775.20M | $515.00M | $367.10M | $569.80M | $528.51M | $1.19B | $510.31M | $452.76M | $348.60M | $- | $173.38M | $- | $43.55M | $- | $77.74M | $- | $90.11M | $- | $75.15M |
| Operating Cash Flow | $304.30M | $567.70M | $825.10M | $561.90M | $184.90M | $203.50M | $204.39M | $241.66M | $152.17M | $245.35M | $209.34M | $162.97M | $166.43M | $111.37M | $52.09M | $25.59M | $51.95M | $50.11M | $87.78M | $113.93M |
| Capital Expenditure | $-13.60M | $-185.30M | $-196.60M | $-141.80M | $-30.40M | $-57.70M | $-42.73M | $-51.98M | $-47.42M | $-40.25M | $-44.83M | $-61.36M | $-70.38M | $-69.82M | $-112.83M | $-125.88M | $-144.29M | $-92.49M | $-34.35M | $-38.79M |
| Free Cash Flow | $290.70M | $382.40M | $628.50M | $420.10M | $154.50M | $145.80M | $161.66M | $189.68M | $104.75M | $205.10M | $164.51M | $101.61M | $96.06M | $41.55M | $-60.74M | $-100.29M | $-92.34M | $-42.38M | $53.44M | $75.14M |

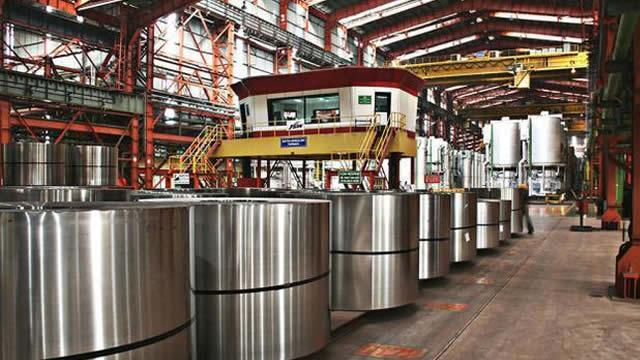
IGO Limited operates as an exploration and mining company that engages in discovering, developing, and operating assets focused on metals to enable clean energy in Australia. It owns and operates a 100% interest in the Nova nickel-copper-cobalt operation located to the east northeast of Norseman in the Great Western Woodlands of Western Australia; a 100% interest in the Cosmos nickel operation located to the north of Leinster in Western Australia; and a 100% interest in the Forrestania nickel operation located to the east of Perth in Western Australia. The company also focuses on investing in lithium mines, as well as holds 100% interest in the downstream processing refinery at Kwinana in Western Australia to produce battery grade lithium hydroxide. In addition, it owns and operates various projects, including Fraser Range, Kimberley, Paterson, Copper Coast, Frontier, Raptor, and Western Gawler projects. The company was formerly known as Independence Group NL and changed its name to IGO Limited in January 2020. IGO Limited was incorporated in 2000 and is headquartered in Perth, Australia.
$4.70
Stock Price
$1.78B
Market Cap
-
Employees
Perth, WA
Location
Revenue (FY 2024)
$823.20M
-21.6% YoY
Net Income (FY 2024)
$2.80M
-99.5% YoY
EPS (FY 2024)
$0.01
-99.5% YoY
Free Cash Flow (FY 2024)
$673.10M
-35.8% YoY
Profitability
Gross Margin
-16.9%
Net Margin
0.4%
ROE
0.1%
ROA
0.1%
Valuation
P/E Ratio
1582.36
P/S Ratio
5.56
EV/EBITDA
27.70
Market Cap
$1.78B
Revenue & Net Income
Profit Margins
Cash Flow Summary
Operating Cash Flow
$872.00M
-37.1% YoY
Free Cash Flow
$673.10M
-35.8% YoY
Balance Sheet Summary
Total Assets
$3.57B
-24.7% YoY
Total Debt
$48.70M
88.7% YoY
Shareholder Equity
$3.21B
-15.3% YoY
Dividend Overview
$0.35
Latest Dividend
%
Dividend Yield
%
Payout Ratio
Recent Dividend History
| Date | Amount | Type |
|---|---|---|
| 2024-09-12 | $0.35 | September 12, 24 |
| 2024-03-12 | $0.14 | March 12, 24 |
| 2023-09-12 | $0.20 | September 12, 23 |
| 2023-03-15 | $0.19 | March 15, 23 |
| 2022-09-14 | $0.06 | September 14, 22 |
| 2022-03-02 | $0.07 | March 02, 22 |
| 2021-09-10 | $0.15 | September 10, 21 |
IGO Dividends
Explore IGO's dividend history, including dividend yield, payout ratio, and historical payments.
Dividend Yield
12.14%
Dividend Payout Ratio
19203.57%
Dividend Paid & Capex Coverage Ratio
1.19x
IGO Dividend History
| Dividend | Adjusted Dividend | Date | Record Date | Payment Date | Declaration Date |
|---|---|---|---|---|---|
| $0.35391 | $0.35391 | September 12, 2024 | September 12, 2024 | October 07, 2024 | |
| $0.14315 | $0.14315 | March 12, 2024 | March 13, 2024 | April 08, 2024 | |
| $0.20429 | $0.20429 | September 12, 2023 | September 13, 2023 | October 10, 2023 | |
| $0.18729 | $0.18729 | March 15, 2023 | March 16, 2023 | April 10, 2023 | |
| $0.06464 | $0.06464 | September 14, 2022 | September 15, 2022 | October 11, 2022 | |
| $0.07374 | $0.07374 | March 02, 2022 | March 03, 2022 | March 28, 2022 | |
| $0.14542 | $0.14542 | September 10, 2021 | September 13, 2021 | October 04, 2021 |
IGO News
Read the latest news about IGO, including recent articles, headlines, and updates.
Nickel Miners News For The Month Of March 2025
Nickel spot prices were higher the last month. Critical Raw Materials Act: EU funds 47 raw materials projects, includes 12 nickel projects. Nickel market news - Indonesia's nickel boom is forcing its own smelters to shut down. China to add cobalt, copper, nickel & lithium in boost to state metal reserves. Nickel company news - Vale produced 160kt of nickel in 2024, down from 165kt in 2023. Jinchuan Group International Resources issues a negative profit warning.

IGO Limited (IPGDF) Q2 2025 Earnings Call Transcript
IGO Limited (OTCPK:IPGDF) Q2 2025 Earnings Conference Call February 19, 2025 4:30 PM ET Company Participants Ivan Vella - Managing Director and Chief Executive Officer Kathleen Bozanic - Chief Financial Officer Conference Call Participants Hugo Nicolaci - Goldman Sachs Matthew Frydman - MST Financial Mitch Ryan - Jefferies Rob Stein - Macquarie Tim Hoff - Canaccord Matt Chalmers - BofA Securities Jon Bishop - Jarden Levi Spry - UBS Operator Thank you for standing by, and welcome to the IGO Limited Half Year Results Call. All participants are in a listen-only mode.

Nickel Miners News For The Month Of January 2025
Nickel spot prices were lower the last month. Nickel market news - Nornickel: "Around 40% of all nickel producers are loss-making at the current price." Indonesia is considering policy to reduce nickel mining quota in 2025 to 150kt. Nickel company news - Nornickel nickel production in 2024 decreased 2% to 205 kt. Vale's nickel production was slightly lower in 2024 at ~160kt.
Nickel Miners News For The Month Of December 2024
Nickel spot prices were slightly lower in the last month. Nickel market news - Letter to Congress on price support for US critical minerals. Fast permits if investing $1B in the US. Indonesia weighs deep cuts in nickel mining to boost prices. Nickel company news - Vale informs the Voisey's Bay Mine Expansion project completion. Premium Resources continues to intersect significant lengths of mineralization at Selebi North: 16.80 metres of 2.80% NiEq.
Nickel Miners News For The Month Of November 2024
Nickel spot prices were flat the last month. Nickel market news - BMI: Battery nickel demand set to triple by 2030. Nickel surplus are expected to continue over the next few years, prices are expected to remain flat. Nickel company news - Huayou seeks US$2.7 billion loan to fund nickel smelter project with Vale and Ford. GEM, PT Vale Indonesia partner for $1.4bn nickel HPAL project in Indonesia.

Nickel Miners News For The Month Of October 2024
Nickel spot prices were lower the last month. Nickel market news - The US government is reportedly examining price support mechanisms for domestic critical mineral projects. US Treasury allows miners to access clean energy manufacturing subsidy. Nickel company news - Eramet revises downwards its 2024 production targets for Comilog and PT Weda Bay Nickel.
IGO Limited (IPGDF) Q1 2025 Earnings Call Transcript
IGO Limited (OTCPK:IPGDF) Q1 2025 Results Conference Call October 27, 2024 8:00 PM ET Company Participants Ivan Vella - CEO, MD & Director Kathleen Bozanic - Chief Financial Officer Conference Call Participants Daniel Morgan - Barrenjoey Matthew Frydman - MST Financial Hugo Nicolaci - Goldman Sachs Levi Spry - UBS Tim Hoff - Canaccord Rahul Anand - Morgan Stanley Kate McCutcheon - Citi Kaan Peker - RBC Jon Bishop - Jarden Group Jon Sharp - CLSA Rob Stein - Macquarie Ivan Vella Thank you. Good morning, everyone.

IGO Limited: Lithium Cost Leader With Major Diversification Potential
IGO Limited is the only Lithium company in the world making significant cash from its lithium operation with regard to its valuation. The company is highly profitable even in its nickel-copper-cobalt segment. IGO owns one of the biggest mining exploration portfolios in the world with strong copper potential (apart from lithium and nickel).
IGO Limited (IPGDF) Q4 2024 Earnings Call Transcript
IGO Limited (OTCPK:IPGDF) Q4 2024 Results Conference Call August 28, 2024 8:00 PM ET Company Participants Ivan Vella - CEO, MD & Director Kathleen Bozanic - Chief Financial Officer Conference Call Participants Hugo Nicolaci - Goldman Sachs Levi Spry - UBS Matthew Frydman - MST Financial Daniel Morgan - Barrenjoey Tim Hoff - Canaccord Jon Bishop - Jarden Rob Stein - Macquarie Ivan Vella Thank you. Good morning, everyone.

IGO Limited (IPGDF) Q3 2024 Earnings Call Transcript
IGO Limited (OTCPK:IPGDF) Q3 2024 Earnings Conference Call April 29, 2024 8:00 PM ET Company Participants Ivan Vella - Managing Director & CEO Kathleen Bozanic - CFO Conference Call Participants Hugo Nicolaci - Goldman Sachs Rahul Anand - Morgan Stanley Jon Bishop - Jarden Group Australia Tim Hoff - Canaccord Levi Spry - UBS Robert Stein - Macquarie Kaan Peker - RBC Mitch Ryan - Jefferies Daniel Morgan - Barrenjoey Kate McCutcheon - Citi Matthew Frydman - MST Financial Lyndon Fagan - JP Morgan Ivan Vella Thank you, Ashley. Good morning, everyone, and welcome to our March Quarterly Results Call.

Nickel Miners News For The Month Of April 2024
Nickel spot prices were significantly higher the last month. Nickel market news - US & UK prohibit import of Russian-origin aluminum, copper, and nickel. The U.S. Loans Program Office has added supply/production of critical minerals to the list. Nickel company news - Ardea, Sumitomo Metal Mining (SMM) and Mitsubishi Corporation [MC] to form a JV to develop the Kalgoorlie Nickel Project (KNP) – Goongarrie Hub.

Nickel Miners News For The Month Of March 2024
Nickel spot prices were lower the last month and remain very low causing distress to the nickel miners. Nickel market news - Macquarie - Nickel market surplus just 36,000t this year. Nickel prices may soon recover from Indonesia-induced slump. Nickel company news - Vale to build another $2B HPAL plant in Indonesia. BHP has stood down around a quarter of the workforce building its $1.7B West Musgrave Nickel Project.

Nickel Miners News For The Month Of February 2024
Nickel spot prices were higher for the last month. Morgan Stanley suggests the possibility nickel (price) is close to a trough “looks increasingly likely". Nickel market news - EU, US to align global minerals push against China's supply grip. US moves to restore stockpiling ‘panic button' in EV metals fight with China. Nickel company news - BHP writes down value of Australian nickel assets after nickel price collapse. Eramet achieves a new record for nickel ore volumes in Indonesia (+72%) in 2023.

Nickel Miners News For The Month Of January 2023
Nickel spot prices were flat for the last month. Nickel market news - Macquarie forecasts surpluses for the nickel market all the way out to 2027. Fastmarkets - Surge in nickel production capacity to lead to structural oversupply. Nickel company news - BHP warns on the impact of low nickel prices. IGO decides to put Cosmos Nickel Project into care and maintenance.
Nickel Miners News For The Month Of December 2023
Nickel spot prices were flat for the last month. Low nickel prices leads to BHP issuing dire warning on nickel mines. 2024 nickel supply is set to outpace growth, which will suppress prices and exert pressure on producers' margins. In nickel company news - Panoramic Resources collapses into Voluntary Administration. Premium Nickel Resources drills 10.45 metres of 1.45% NiEq.


Nickel Miners News For The Month Of August 2023
Nickel spot prices were lower the last month. Nickel market news - BHP: "Turning to the longer term, we believe that nickel will be a substantial beneficiary of the global electrification mega–trend." Nickel company news - Glencore announces US$1.2 billion share buyback program. Horizonte Minerals' Araguaia Nickel Project now 65% complete.

IGO Limited (IPGDF) Q4 2023 Earnings Call Transcript
IGO Limited (OTCPK:IPGDF) Q4 2023 Earnings Conference Call August 30, 2023 8:00 PM ET Company Participants Matt Dusci - Acting CEO Kath Bozanic - CFO Conference Call Participants Levi Spry - UBS Kate McCutcheon - Citi Daniel Morgan - Barrenjoey Lyndon Fagan - JPMorgan Jon Bishop - Jarden Group Australia Robert Stein - CLSA Matthew Frydman - MST Financial Hugo Nicolaci - Goldman Sachs Timothy Hoff - Canaccord Genuity Operator Thank you for standing by, and welcome to the IGO Limited FY '23 Results Webcast. [Operator Instructions] I would now like to hand the conference over to Matt Dusci, Acting Chief Executive Officer.

Cobalt Miners News For The Month Of July 2023
Cobalt spot prices were significantly higher for the month. LME inventory was unchanged for the month. Cobalt market news - "Most analysts predict supply will continue to exceed demand in 2023". LFP batteries extend dominance over NCM batteries in China. Cobalt miners news - Glencore H1, 2023 production of 21,700 tonnes of cobalt, up 5% YoY. CMOC agrees to pay Congo's Gecamines $800 million to end spat.
Nickel Miners News For The Month Of June 2023
Nickel spot prices were lower last month. Nickel market news - BMI forecasts a nearly 2 million tonne nickel supply gap by 2030 and says nickel requires the largest critical mineral investment of $66 billion. Nickel company news - Nickel Industries conditional 19.99% placement to PT United Tractors Tbk raises A$943m. Poseidon Nickel updated Black Swan disseminated Resource of 26.3Mt at 0.72% nickel.

Nickel Miners News For The Month Of May 2023
Nickel spot prices were significantly lower the last month. Nickel market news - Nickel faces huge supply glut of Class 2 nickel as Indonesian output booms; however Class I nickel demand is very strong with LME inventory levels declining. Nickel company news - Vale imminent sale of 10% of its base metals business, reported to be worth $US20-25B. Glencore & Li-Cycle announce joint study for battery recycling hub.
Cobalt Miners News For The Month Of May 2023
Cobalt spot prices were flat for the month, and LME inventory was lower for the month. Cobalt market news - Cobalt to remain key EV raw material despite substitution threat. Fastmarkets' research analysts forecast cobalt will reach an oversupply of 4,000 tonnes in 2023.
IGO Limited (IPGDF) Q3 2023 Earnings Call Transcript
IGO Limited (OTCPK:IPGDF) Q3 2023 Results Conference Call April 27, 2023 8:00 PM ET Company Participants Matt Dusci - Acting CEO Kath Bozanic - CFO Conference Call Participants Rahul Anand - Morgan Stanley Australia Matt Greene - Credit Suisse Lyndon Fagan - JPMorgan Jon Bishop - Jarden Group Australia Levi Spry - UBS Kate McCutcheon - Citi Hayden Bairstow - Macquarie Kaan Peker - RBC Mitch Ryan - Jefferies Hugo Nicolaci - Goldman Sachs Matthew Frydman - MST Financial Daniel Morgan - Barrenjoey Matt Dusci Thank you, operator. Good morning, everyone, and thank you for joining the call this morning as we present our operating and financial results for the March quarter.

Nickel Miners News For The Month Of March 2023
Nickel spot prices were lower the last month. Sprott launches Nickel Miners ETF. Nickel market news - EU Critical Raw Materials Act 10% of critical raw materials mined in Europe by 2030. Ford CEO says lithium and nickel are the key constraining commodities.
Cobalt Miners News For The Month Of March 2023
Cobalt spot prices were lower for the month, LME inventory was lower for the month. Cobalt market news - EU Commission wants 10% of critical raw materials mined in Europe by 2030. Fastmarkets forecast cobalt surplus of 4,000t in 2023, increasing to 14,000t in 2024.
Similar Companies
Related Metrics
Explore detailed financial metrics and analysis for IIDDY.