Japan Airlines Key Executives
This section highlights Japan Airlines 's key executives, including their titles and compensation details.
Find Contacts at Japan Airlines
(Showing 0 of )
Japan Airlines Earnings
This section highlights Japan Airlines 's earnings, including key dates, EPS, earnings reports, and earnings call transcripts.
Next Earnings Date
Last Earnings Results
Earnings Call Transcripts
| Transcript | Quarter | Year | Date | Estimated EPS | Actual EPS |
|---|

Japan Airlines Co., Ltd., together with its subsidiaries, provides scheduled and non-scheduled air transport services in Japan and internationally. The company operates through Air Transportation and Other segments. It offers domestic and international passenger, ground handling, and cargo air transport services. The company is also involved in the aerial work and other related business; and sale of package tours. As of March 31, 2021, it operated a fleet of 218 aircraft. The company was formerly known as Japan Airlines International Co., Ltd. and changed its name to Japan Airlines Co., Ltd. in April 2011. The company was founded in 1951 and is headquartered in Tokyo, Japan.
$9.04
Stock Price
$7.89B
Market Cap
-
Employees
Tokyo, None
Location
Financial Statements
Access annual & quarterly financial statements for Japan Airlines , including income statements, balance sheets, and cash flow statements..
Annual Income Statement
| Breakdown | March 31, 2024 | March 31, 2023 | March 31, 2022 | March 31, 2021 | March 31, 2020 |
|---|---|---|---|---|---|
| Revenue | $1.65T | $1.38T | $705.46B | $494.62B | $1.41T |
| Cost of Revenue | $840.85B | $773.86B | $569.97B | $542.18B | $1.08T |
| Gross Profit | $811.04B | $601.73B | $135.49B | $-47.56B | $335.08B |
| Gross Profit Ratio | 49.10% | 43.74% | 19.21% | -9.62% | 23.74% |
| Research and Development Expenses | $- | $- | $- | $- | $- |
| General and Administrative Expenses | $- | $- | $- | $- | $- |
| Selling and Marketing Expenses | $- | $- | $- | $- | $- |
| Selling General and Administrative Expenses | $- | $675.74B | $495.44B | $486.91B | $234.45B |
| Other Expenses | $670.11B | $14.78B | $370.26B | $-3.00B | $-561.00M |
| Operating Expenses | $670.11B | $536.67B | $370.26B | $342.85B | $234.45B |
| Cost and Expenses | $1.51T | $1.31T | $940.22B | $885.04B | $1.31T |
| Interest Income | $9.28B | $2.07B | $1.99B | $1.80B | $1.44B |
| Interest Expense | $15.21B | $14.21B | $9.11B | $7.57B | $658.00M |
| Depreciation and Amortization | $149.96B | $157.45B | $178.49B | $182.49B | $162.42B |
| EBITDA | $304.47B | $205.33B | $-58.73B | $-205.92B | $254.29B |
| EBITDA Ratio | 18.43% | 14.93% | -8.32% | -41.63% | 18.02% |
| Operating Income | $140.93B | $65.06B | $-234.77B | $-390.41B | $100.63B |
| Operating Income Ratio | 8.53% | 4.73% | -33.28% | -78.93% | 7.13% |
| Total Other Income Expenses Net | $-1.63B | $-12.63B | $-11.85B | $-13.66B | $-4.12B |
| Income Before Tax | $139.31B | $52.43B | $-246.62B | $-404.08B | $96.51B |
| Income Before Tax Ratio | 8.43% | 3.81% | -34.96% | -81.69% | 6.84% |
| Income Tax Expense | $43.39B | $18.55B | $-65.27B | $-116.20B | $39.07B |
| Net Income | $95.53B | $34.42B | $-177.55B | $-286.69B | $48.06B |
| Net Income Ratio | 5.78% | 2.50% | -25.17% | -57.96% | 3.41% |
| EPS | $109.31 | $39.39 | $-203.15 | $-382.50 | $70.02 |
| EPS Diluted | $109.31 | $39.39 | $-203.15 | $-382.50 | $70.02 |
| Weighted Average Shares Outstanding | 874.01M | 874.01M | 874.01M | 749.53M | 686.33M |
| Weighted Average Shares Outstanding Diluted | 874.01M | 874.01M | 874.01M | 749.53M | 686.33M |
| SEC Filing | Source | Source | Source | Source | Source |
| Breakdown | June 30, 2024 | March 31, 2024 | December 31, 2023 | September 30, 2023 | June 30, 2023 | March 31, 2023 | December 31, 2022 | September 30, 2022 | June 30, 2022 | March 31, 2022 | December 31, 2021 | September 30, 2021 | June 30, 2021 | March 31, 2021 | December 31, 2020 | September 30, 2020 | June 30, 2020 | March 31, 2020 | December 31, 2019 | September 30, 2019 |
|---|---|---|---|---|---|---|---|---|---|---|---|---|---|---|---|---|---|---|---|---|
| Revenue | $425.80B | $402.52B | $428.43B | $439.50B | $381.44B | $370.00B | $387.07B | $360.43B | $272.86B | $191.07B | $213.15B | $162.62B | $138.60B | $128.64B | $165.84B | $122.49B | $77.64B | $280.36B | $365.39B | $401.53B |
| Cost of Revenue | $181.35B | $128.49B | $218.97B | $208.99B | $194.02B | $198.91B | $197.65B | $195.26B | $181.88B | $151.58B | $147.30B | $140.37B | $130.71B | $137.16B | $140.54B | $135.65B | $128.83B | $243.11B | $178.42B | $179.97B |
| Gross Profit | $244.45B | $274.04B | $209.45B | $230.51B | $187.42B | $171.09B | $189.42B | $165.16B | $90.98B | $39.48B | $65.85B | $22.25B | $7.90B | $-8.52B | $25.30B | $-13.16B | $-51.18B | $37.25B | $186.97B | $221.56B |
| Gross Profit Ratio | 57.41% | 68.08% | 48.89% | 52.45% | 49.14% | 46.24% | 48.94% | 45.82% | 33.34% | 20.67% | 30.89% | 13.68% | 5.70% | -6.62% | 15.25% | -10.74% | -65.92% | 13.29% | 51.17% | 55.18% |
| Research and Development Expenses | $- | $- | $- | $- | $- | $- | $- | $- | $- | $- | $- | $- | $- | $- | $- | $- | $- | $- | $- | $- |
| General and Administrative Expenses | $- | $- | $- | $- | $- | $- | $- | $- | $- | $- | $- | $- | $- | $- | $- | $- | $- | $- | $- | $- |
| Selling and Marketing Expenses | $- | $- | $- | $- | $- | $- | $- | $- | $- | $- | $- | $- | $- | $- | $- | $- | $- | $- | $- | $- |
| Selling General and Administrative Expenses | $- | $284.12B | $259.95B | $254.76B | $236.69B | $236.39B | $227.42B | $208.10B | $191.22B | $162.82B | $158.78B | $148.88B | $145.50B | $154.08B | $- | $- | $- | $56.78B | $57.13B | $59.96B |
| Other Expenses | $224.84B | $25.06B | $2.13B | $1.64B | $2.50B | $15.68B | $3.71B | $10.80B | $121.17B | $100.71B | $97.69B | $87.11B | $84.74B | $-2.77B | $-99.00M | $-83.00M | $-46.00M | $1.83B | $-1.71B | $-13.00M |
| Operating Expenses | $224.84B | $259.06B | $171.89B | $172.98B | $156.57B | $139.97B | $151.36B | $138.93B | $121.17B | $100.71B | $97.69B | $87.11B | $84.74B | $92.39B | $95.47B | $77.99B | $77.00B | $56.78B | $155.67B | $160.63B |
| Cost and Expenses | $406.19B | $387.55B | $390.86B | $381.96B | $350.58B | $338.88B | $349.00B | $334.20B | $303.04B | $252.29B | $245.00B | $227.48B | $215.45B | $229.55B | $236.01B | $213.64B | $205.82B | $299.89B | $334.09B | $340.60B |
| Interest Income | $6.05B | $2.72B | $842.00M | $1.02B | $4.69B | $1.22B | $225.00M | $1.51B | $2.75B | $1.56B | $477.00M | $21.00M | $14.00M | $691.00M | $362.00M | $196.00M | $549.00M | $210.00M | $547.00M | $287.00M |
| Interest Expense | $3.92B | $3.64B | $3.71B | $3.68B | $4.17B | $3.31B | $7.06B | $3.44B | $4.04B | $3.32B | $3.21B | $1.41B | $1.25B | $1.10B | $1.44B | $1.15B | $3.87B | $- | $358.00M | $1.05B |
| Depreciation and Amortization | $38.20B | $37.90B | $36.87B | $38.22B | $36.98B | $36.01B | $38.46B | $41.10B | $41.98B | $47.99B | $41.19B | $46.21B | $43.35B | $46.62B | $49.39B | $44.34B | $44.60B | $15.59B | $41.31B | $40.84B |
| EBITDA | $57.81B | $61.58B | $74.43B | $95.75B | $67.83B | $49.68B | $73.18B | $70.52B | $17.21B | $-15.08B | $12.35B | $-22.94B | $-39.28B | $-51.17B | $-20.46B | $-48.43B | $-85.86B | $-4.68B | $73.55B | $104.11B |
| EBITDA Ratio | 13.58% | 15.30% | 17.37% | 21.79% | 17.78% | 13.43% | 18.91% | 19.56% | 6.31% | -7.89% | 5.79% | -14.11% | -28.34% | -39.78% | -12.33% | -39.54% | -110.58% | -1.67% | 20.13% | 25.93% |
| Operating Income | $19.61B | $14.98B | $37.56B | $57.53B | $30.86B | $31.12B | $38.06B | $26.23B | $-30.19B | $-61.22B | $-31.84B | $-64.86B | $-76.84B | $-100.91B | $-70.17B | $-91.15B | $-128.18B | $-19.54B | $31.31B | $60.93B |
| Operating Income Ratio | 4.60% | 3.72% | 8.77% | 13.09% | 8.09% | 8.41% | 9.83% | 7.28% | -11.06% | -32.04% | -14.94% | -39.88% | -55.44% | -78.44% | -42.31% | -74.41% | -165.08% | -6.97% | 8.57% | 15.17% |
| Total Other Income Expenses Net | $1.59B | $-168.32B | $-2.69B | $-335.00M | $-155.53B | $-3.35B | $-10.40B | $-128.30B | $1.30B | $3.30B | $-2.40B | $-5.70B | $-7.04B | $-3.63B | $-1.11B | $-2.77B | $-6.15B | $-906.00M | $-6.96B | $1.29B |
| Income Before Tax | $21.20B | $14.33B | $34.88B | $57.20B | $31.90B | $27.76B | $27.66B | $25.97B | $-28.81B | $-57.92B | $-34.25B | $-70.56B | $-83.89B | $-104.54B | $-71.29B | $-93.92B | $-134.33B | $-20.44B | $31.89B | $62.22B |
| Income Before Tax Ratio | 4.98% | 3.56% | 8.14% | 13.01% | 8.36% | 7.50% | 7.15% | 7.21% | -10.56% | -30.32% | -16.07% | -43.39% | -60.52% | -81.26% | -42.98% | -76.67% | -173.01% | -7.29% | 8.73% | 15.50% |
| Income Tax Expense | $7.39B | $6.08B | $10.36B | $17.40B | $9.55B | $9.91B | $8.71B | $8.46B | $-8.47B | $-6.87B | $-10.40B | $-22.30B | $-25.70B | $-30.47B | $-20.22B | $-26.31B | $-39.20B | $2.33B | $10.06B | $19.20B |
| Net Income | $13.98B | $9.66B | $24.20B | $38.61B | $23.06B | $18.11B | $18.47B | $17.43B | $-19.56B | $-49.23B | $-23.35B | $-47.06B | $-57.92B | $-73.97B | $-51.49B | $-67.52B | $-93.71B | $-22.91B | $20.68B | $41.20B |
| Net Income Ratio | 3.28% | 2.40% | 5.65% | 8.78% | 6.05% | 4.89% | 4.77% | 4.83% | -7.17% | -25.77% | -10.95% | -28.94% | -41.79% | -57.50% | -31.05% | -55.12% | -120.69% | -8.17% | 5.66% | 10.26% |
| EPS | $16.00 | $11.06 | $27.69 | $44.18 | $26.39 | $20.72 | $21.14 | $9.97 | $-11.19 | $-28.17 | $-13.36 | $-26.92 | $-33.14 | $-48.07 | $-33.46 | $-50.09 | $-69.52 | $-16.75 | $15.12 | $29.88 |
| EPS Diluted | $16.00 | $11.06 | $27.69 | $44.18 | $26.39 | $20.72 | $21.14 | $9.97 | $-11.19 | $-28.17 | $-13.36 | $-26.92 | $-33.14 | $-48.07 | $-33.46 | $-50.09 | $-69.52 | $-16.75 | $15.12 | $29.88 |
| Weighted Average Shares Outstanding | 874.01M | 874.01M | 874.01M | 874.01M | 874.01M | 874.01M | 874.01M | 1.75B | 1.75B | 1.75B | 1.75B | 1.75B | 1.75B | 1.54B | 1.54B | 1.35B | 1.35B | 1.37B | 1.37B | 1.38B |
| Weighted Average Shares Outstanding Diluted | 874.01M | 874.01M | 874.01M | 874.01M | 874.01M | 874.01M | 874.01M | 1.75B | 1.75B | 1.75B | 1.75B | 1.75B | 1.75B | 1.54B | 1.54B | 1.35B | 1.35B | 1.37B | 1.37B | 1.38B |
| SEC Filing | Source | Source | Source | Source | Source | Source | Source | Source | Source | Source | Source | Source | Source | Source | Source | Source | Source | Source | Source | Source |
Annual Balance Sheet
| Breakdown | March 31, 2024 | March 31, 2023 | March 31, 2022 | March 31, 2021 | March 31, 2020 |
|---|---|---|---|---|---|
| Cash and Cash Equivalents | $713.87B | $639.25B | $494.23B | $408.33B | $329.15B |
| Short Term Investments | $16.47B | $11.20B | $43.36B | $14.13B | $-48.34B |
| Cash and Short Term Investments | $730.34B | $650.45B | $537.59B | $422.47B | $329.15B |
| Net Receivables | $173.02B | $174.91B | $120.32B | $76.76B | $87.92B |
| Inventory | $43.95B | $36.75B | $31.28B | $23.68B | $26.49B |
| Other Current Assets | $75.30B | $71.98B | $104.68B | $59.04B | $82.43B |
| Total Current Assets | $1.02T | $922.88B | $750.50B | $567.82B | $526.00B |
| Property Plant Equipment Net | $1.10T | $1.03T | $1.05T | $1.05T | $997.81B |
| Goodwill | $3.99B | $3.67B | $6.16B | $- | $- |
| Intangible Assets | $83.20B | $79.64B | $81.47B | $89.66B | $95.78B |
| Goodwill and Intangible Assets | $87.19B | $83.31B | $87.64B | $89.66B | $95.78B |
| Long Term Investments | $214.67B | $207.96B | $196.44B | $178.50B | $148.46B |
| Tax Assets | $- | $278.65B | $284.29B | $225.89B | $84.63B |
| Other Non-Current Assets | $229.22B | $- | $- | $- | $6.69B |
| Total Non-Current Assets | $1.63T | $1.60T | $1.62T | $1.54T | $1.33T |
| Other Assets | $- | $4.00M | $4.00M | $3.00M | $2.00M |
| Total Assets | $2.65T | $2.52T | $2.37T | $2.11T | $1.86T |
| Account Payables | $160.05B | $136.14B | $94.05B | $97.19B | $166.33B |
| Short Term Debt | $106.94B | $111.97B | $86.79B | $69.62B | $39.69B |
| Tax Payables | $2.60B | $2.64B | $3.60B | $3.89B | $4.08B |
| Deferred Revenue | $- | $381.00B | $262.58B | $265.37B | $76.76B |
| Other Current Liabilities | $467.61B | $37.83B | $23.47B | $40.83B | $148.37B |
| Total Current Liabilities | $737.20B | $669.58B | $470.49B | $476.89B | $358.46B |
| Long Term Debt | $780.36B | $813.53B | $895.83B | $445.52B | $240.80B |
| Deferred Revenue Non-Current | $- | $165.59B | $203.78B | $192.31B | $166.09B |
| Deferred Tax Liabilities Non-Current | $- | $3.50B | $1.97B | $108.00M | $241.00M |
| Other Non-Current Liabilities | $183.33B | $14.94B | $161.20B | $11.01B | $128.27B |
| Total Non-Current Liabilities | $963.69B | $994.07B | $1.06T | $648.85B | $369.07B |
| Other Liabilities | $- | $- | $- | $- | $- |
| Total Liabilities | $1.70T | $1.66T | $1.53T | $1.13T | $727.53B |
| Preferred Stock | $- | $- | $- | $- | $- |
| Common Stock | $273.20B | $273.20B | $273.20B | $273.20B | $181.35B |
| Retained Earnings | $306.88B | $225.64B | $176.41B | $352.96B | $797.91B |
| Accumulated Other Comprehensive Income Loss | $- | $44.22B | $76.92B | $48.14B | $5.51B |
| Other Total Stockholders Equity | $329.87B | $273.22B | $273.21B | $273.15B | $182.51B |
| Total Stockholders Equity | $909.95B | $816.29B | $799.74B | $947.46B | $1.09T |
| Total Equity | $948.35B | $856.96B | $844.14B | $981.53B | $1.13T |
| Total Liabilities and Stockholders Equity | $2.65T | $2.52T | $2.37T | $2.11T | $1.86T |
| Minority Interest | $38.40B | $40.67B | $44.40B | $34.08B | $37.02B |
| Total Liabilities and Total Equity | $2.65T | $2.52T | $2.37T | $2.11T | $1.86T |
| Total Investments | $183.19B | $178.84B | $171.90B | $152.29B | $100.12B |
| Total Debt | $887.29B | $925.50B | $928.46B | $515.15B | $191.47B |
| Net Debt | $173.43B | $286.26B | $434.24B | $106.81B | $-137.68B |
Balance Sheet Charts
| Breakdown | June 30, 2024 | March 31, 2024 | December 31, 2023 | September 30, 2023 | June 30, 2023 | March 31, 2023 | December 31, 2022 | September 30, 2022 | June 30, 2022 | March 31, 2022 | December 31, 2021 | September 30, 2021 | June 30, 2021 | March 31, 2021 | December 31, 2020 | September 30, 2020 | June 30, 2020 | March 31, 2020 | December 31, 2019 | September 30, 2019 |
|---|---|---|---|---|---|---|---|---|---|---|---|---|---|---|---|---|---|---|---|---|
| Cash and Cash Equivalents | $819.38B | $713.87B | $684.06B | $743.58B | $716.01B | $639.25B | $553.05B | $543.00B | $530.36B | $494.23B | $518.34B | $372.97B | $357.02B | $408.33B | $454.97B | $346.69B | $394.31B | $329.15B | $296.43B | $365.99B |
| Short Term Investments | $17.51B | $16.47B | $14.24B | $21.55B | $14.05B | $11.20B | $15.27B | $25.74B | $44.82B | $43.36B | $19.60B | $19.61B | $18.89B | $14.13B | $7.05B | $4.29B | $1.72B | $-7.63B | $30.00B | $30.00B |
| Cash and Short Term Investments | $836.89B | $713.87B | $698.30B | $765.13B | $730.06B | $650.45B | $568.32B | $568.74B | $575.18B | $537.59B | $537.94B | $392.58B | $375.90B | $422.47B | $462.02B | $350.97B | $396.04B | $329.15B | $326.43B | $395.99B |
| Net Receivables | $196.79B | $173.02B | $162.53B | $172.59B | $168.67B | $174.91B | $151.44B | $154.61B | $145.75B | $120.32B | $89.89B | $79.44B | $72.57B | $76.76B | $70.97B | $63.25B | $74.56B | $87.92B | $154.54B | $159.35B |
| Inventory | $45.50B | $43.95B | $43.70B | $40.70B | $37.86B | $36.75B | $39.42B | $36.78B | $32.51B | $31.28B | $24.59B | $24.42B | $24.30B | $23.68B | $26.29B | $27.62B | $27.89B | $26.49B | $24.48B | $25.84B |
| Other Current Assets | $77.24B | $91.77B | $100.43B | $100.66B | $82.33B | $71.98B | $89.08B | $97.81B | $113.56B | $104.68B | $76.37B | $73.46B | $70.26B | $59.04B | $57.98B | $48.35B | $53.49B | $82.43B | $103.73B | $66.90B |
| Total Current Assets | $1.16T | $1.02T | $990.72B | $1.06T | $1.00T | $922.88B | $832.99B | $832.21B | $822.19B | $750.50B | $709.20B | $550.29B | $524.14B | $567.82B | $610.21B | $485.90B | $550.26B | $526.00B | $609.18B | $648.08B |
| Property Plant Equipment Net | $940.63B | $1.10T | $1.10T | $1.06T | $1.02T | $1.03T | $1.03T | $1.04T | $1.05T | $1.05T | $1.06T | $1.06T | $1.06T | $1.05T | $1.06T | $1.06T | $1.06T | $997.81B | $1.00T | $961.72B |
| Goodwill | $- | $3.99B | $- | $- | $- | $3.67B | $- | $- | $- | $6.16B | $- | $- | $- | $- | $- | $- | $- | $- | $- | $- |
| Intangible Assets | $88.40B | $87.19B | $84.69B | $82.37B | $83.04B | $79.64B | $83.65B | $81.36B | $84.33B | $81.47B | $84.20B | $86.57B | $89.03B | $89.66B | $92.35B | $94.07B | $94.58B | $95.78B | $94.10B | $93.05B |
| Goodwill and Intangible Assets | $88.40B | $87.19B | $84.69B | $82.37B | $83.04B | $83.31B | $83.65B | $81.36B | $84.33B | $87.64B | $84.20B | $86.57B | $89.03B | $89.66B | $92.35B | $94.07B | $94.58B | $95.78B | $94.10B | $93.05B |
| Long Term Investments | $185.86B | $186.75B | $160.78B | $167.83B | $217.10B | $167.64B | $155.37B | $148.81B | $200.89B | $196.44B | $175.12B | $178.99B | $131.45B | $138.15B | $148.93B | $144.00B | $152.24B | $107.75B | $203.72B | $196.02B |
| Tax Assets | $- | $229.21B | $244.63B | $246.10B | $268.30B | $278.65B | $293.90B | $295.00B | $292.58B | $284.29B | $287.13B | $273.93B | $251.82B | $225.89B | $197.27B | $182.16B | $157.36B | $84.63B | $-94.10B | $-93.05B |
| Other Non-Current Assets | $410.25B | $27.92B | $42.43B | $50.36B | $- | $40.32B | $45.64B | $53.97B | $- | $- | $- | $- | $44.26B | $40.34B | $32.15B | $23.78B | $21.88B | $47.40B | $124.10B | $123.05B |
| Total Non-Current Assets | $1.63T | $1.63T | $1.63T | $1.61T | $1.59T | $1.60T | $1.61T | $1.62T | $1.62T | $1.62T | $1.60T | $1.60T | $1.58T | $1.54T | $1.53T | $1.51T | $1.49T | $1.33T | $1.33T | $1.28T |
| Other Assets | $- | $- | $4.00M | $4.00M | $3.00M | $4.00M | $2.00M | $3.00M | $3.00M | $4.00M | $5.00M | $4.00M | $2.00M | $3.00M | $3.00M | $3.00M | $3.00M | $2.00M | $2.00M | $1.00M |
| Total Assets | $2.78T | $2.65T | $2.62T | $2.66T | $2.59T | $2.52T | $2.44T | $2.45T | $2.44T | $2.37T | $2.31T | $2.15T | $2.10T | $2.11T | $2.14T | $1.99T | $2.04T | $1.86T | $1.94T | $1.93T |
| Account Payables | $169.24B | $160.05B | $151.61B | $151.77B | $135.39B | $136.14B | $140.22B | $131.03B | $116.09B | $94.05B | $97.89B | $90.40B | $89.50B | $97.19B | $97.74B | $86.05B | $73.64B | $166.33B | $175.36B | $177.79B |
| Short Term Debt | $111.28B | $106.94B | $125.15B | $119.51B | $115.42B | $111.97B | $100.40B | $108.12B | $99.57B | $86.79B | $66.63B | $66.25B | $74.33B | $69.62B | $61.57B | $50.90B | $50.74B | $39.69B | $12.91B | $12.73B |
| Tax Payables | $875.00M | $2.60B | $1.28B | $1.61B | $901.00M | $2.64B | $1.38B | $2.18B | $1.05B | $3.60B | $1.17B | $1.86B | $861.00M | $3.89B | $2.42B | $2.60B | $3.08B | $4.08B | $- | $- |
| Deferred Revenue | $- | $368.92B | $397.46B | $411.14B | $428.00B | $381.00B | $342.04B | $347.82B | $340.81B | $262.58B | $250.67B | $244.75B | $266.15B | $265.37B | $254.15B | $259.79B | $261.77B | $76.76B | $- | $- |
| Other Current Liabilities | $533.22B | $98.70B | $42.88B | $36.71B | $44.11B | $37.83B | $35.00B | $24.88B | $37.21B | $23.47B | $25.36B | $25.16B | $41.37B | $40.83B | $41.10B | $37.11B | $37.17B | $148.37B | $231.56B | $244.26B |
| Total Current Liabilities | $814.61B | $737.20B | $718.37B | $720.75B | $723.81B | $669.58B | $619.04B | $614.03B | $594.75B | $470.49B | $441.72B | $428.43B | $472.21B | $476.89B | $456.98B | $436.45B | $426.41B | $358.46B | $419.84B | $434.77B |
| Long Term Debt | $837.55B | $780.36B | $772.57B | $801.65B | $814.40B | $813.53B | $791.72B | $815.71B | $821.58B | $841.68B | $812.82B | $635.02B | $498.96B | $445.52B | $433.01B | $450.25B | $453.93B | $240.80B | $142.94B | $120.77B |
| Deferred Revenue Non-Current | $- | $- | $200.64B | $200.57B | $168.43B | $165.59B | $188.66B | $188.90B | $194.54B | $203.78B | $201.66B | $199.58B | $198.96B | $192.31B | $183.00B | $190.90B | $175.92B | $166.09B | $- | $- |
| Deferred Tax Liabilities Non-Current | $- | $3.32B | $3.44B | $3.79B | $4.33B | $3.50B | $4.55B | $2.71B | $1.85B | $1.97B | $161.00M | $160.00M | $155.00M | $108.00M | $125.00M | $119.00M | $114.00M | $241.00M | $- | $- |
| Other Non-Current Liabilities | $185.05B | $183.33B | $14.63B | $15.33B | $15.86B | $14.94B | $10.88B | $9.48B | $9.60B | $11.57B | $10.56B | $12.31B | $9.85B | $11.01B | $12.08B | $12.60B | $12.70B | $128.27B | $159.45B | $165.18B |
| Total Non-Current Liabilities | $1.02T | $963.68B | $987.84B | $1.02T | $998.69B | $994.07B | $991.26B | $1.01T | $1.03T | $1.06T | $1.03T | $846.92B | $707.77B | $648.85B | $628.09B | $653.75B | $642.55B | $369.07B | $302.39B | $285.94B |
| Other Liabilities | $- | $- | $- | $- | $- | $- | $- | $- | $- | $- | $- | $- | $- | $- | $- | $- | $- | $- | $- | $- |
| Total Liabilities | $1.84T | $1.70T | $1.71T | $1.74T | $1.72T | $1.66T | $1.61T | $1.63T | $1.62T | $1.53T | $1.47T | $1.28T | $1.18T | $1.13T | $1.09T | $1.09T | $1.07T | $727.53B | $722.23B | $720.72B |
| Preferred Stock | $- | $- | $- | $- | $- | $- | $- | $- | $- | $- | $- | $- | $- | $- | $- | $- | $- | $66.97B | $12.10B | $26.08B |
| Common Stock | $273.20B | $273.20B | $273.20B | $273.20B | $273.20B | $273.20B | $273.20B | $273.20B | $273.20B | $273.20B | $273.20B | $273.20B | $273.20B | $273.20B | $273.20B | $181.35B | $181.35B | $181.35B | $181.35B | $181.35B |
| Retained Earnings | $301.19B | $306.88B | $286.61B | $276.35B | $237.78B | $225.64B | $192.68B | $174.25B | $156.81B | $176.41B | $222.02B | $247.99B | $295.03B | $352.96B | $432.42B | $483.88B | $551.43B | $797.91B | $840.82B | $854.57B |
| Accumulated Other Comprehensive Income Loss | $59.49B | $56.28B | $43.44B | $62.76B | $50.11B | $44.22B | $49.28B | $60.24B | $79.88B | $76.92B | $49.37B | $52.77B | $49.87B | $546.35B | $38.42B | $23.08B | $19.68B | $-66.97B | $-12.10B | $-26.08B |
| Other Total Stockholders Equity | $273.61B | $273.58B | $273.51B | $273.48B | $273.42B | $273.22B | $273.22B | $273.22B | $273.21B | $273.21B | $273.15B | $273.15B | $273.15B | $273.15B | $273.15B | $182.03B | $182.03B | $48.59B | $148.32B | $110.35B |
| Total Stockholders Equity | $907.50B | $909.95B | $876.75B | $885.79B | $834.51B | $816.29B | $788.39B | $780.92B | $783.10B | $799.74B | $817.74B | $847.12B | $891.25B | $947.46B | $1.02T | $870.35B | $934.49B | $1.09T | $1.18T | $1.17T |
| Total Equity | $944.35B | $948.35B | $915.33B | $924.56B | $871.86B | $856.96B | $829.34B | $820.43B | $824.52B | $844.14B | $845.93B | $878.89B | $924.22B | $981.53B | $1.05T | $904.16B | $968.41B | $1.13T | $1.22T | $1.21T |
| Total Liabilities and Stockholders Equity | $2.78T | $2.65T | $2.62T | $2.66T | $2.59T | $2.52T | $2.44T | $2.45T | $2.44T | $2.37T | $2.31T | $2.15T | $2.10T | $2.11T | $2.14T | $1.99T | $2.04T | $1.86T | $1.94T | $1.93T |
| Minority Interest | $36.85B | $38.40B | $38.58B | $38.76B | $37.34B | $40.67B | $40.96B | $39.51B | $41.42B | $44.40B | $28.19B | $31.77B | $32.97B | $34.08B | $34.22B | $33.81B | $33.92B | $37.02B | $36.91B | $35.79B |
| Total Liabilities and Total Equity | $2.78T | $2.65T | $2.62T | $2.66T | $2.59T | $2.52T | $2.44T | $2.45T | $2.44T | $2.37T | $2.31T | $2.15T | $2.10T | $2.11T | $2.14T | $1.99T | $2.04T | $1.86T | $1.94T | $1.93T |
| Total Investments | $203.37B | $186.75B | $175.02B | $189.37B | $188.04B | $178.84B | $170.63B | $174.55B | $174.48B | $171.90B | $149.60B | $154.49B | $150.33B | $152.29B | $155.98B | $148.28B | $153.96B | $100.12B | $233.72B | $226.02B |
| Total Debt | $948.83B | $887.29B | $897.72B | $921.16B | $929.82B | $925.50B | $892.12B | $923.83B | $921.15B | $928.46B | $879.45B | $701.28B | $573.29B | $515.15B | $494.58B | $501.15B | $504.67B | $191.47B | $155.85B | $133.50B |
| Net Debt | $129.45B | $173.43B | $213.66B | $177.58B | $213.81B | $286.26B | $339.07B | $380.83B | $390.79B | $434.24B | $361.11B | $328.31B | $216.28B | $106.81B | $39.61B | $154.47B | $110.36B | $-137.68B | $-140.58B | $-232.49B |
Annual Cash Flow
| Breakdown | March 31, 2024 | March 31, 2023 | March 31, 2022 | March 31, 2021 | March 31, 2020 |
|---|---|---|---|---|---|
| Net Income | $95.53B | $52.43B | $-246.62B | $-404.08B | $96.51B |
| Depreciation and Amortization | $149.96B | $158.20B | $178.78B | $190.59B | $138.03B |
| Deferred Income Tax | $- | $- | $- | $- | $- |
| Stock Based Compensation | $- | $- | $- | $- | $- |
| Change in Working Capital | $66.58B | $60.03B | $-6.91B | $-58.01B | $-102.20B |
| Accounts Receivables | $-583.00M | $-56.00B | $-26.84B | $2.60B | $64.26B |
| Inventory | $-6.69B | $-4.88B | $-2.42B | $4.81B | $-4.52B |
| Accounts Payables | $21.42B | $42.24B | $-4.71B | $-27.04B | $-15.28B |
| Other Working Capital | $52.42B | $78.67B | $27.07B | $-38.38B | $-146.66B |
| Other Non Cash Items | $51.88B | $22.25B | $-28.80B | $51.99B | $-72.31B |
| Net Cash Provided by Operating Activities | $363.94B | $292.91B | $-103.55B | $-219.52B | $60.03B |
| Investments in Property Plant and Equipment | $-218.07B | $-117.49B | $-161.31B | $-89.69B | $-239.61B |
| Acquisitions Net | $2.31B | $-3.09B | $-4.97B | $90.71B | $240.22B |
| Purchases of Investments | $-3.00B | $-8.08B | $-13.86B | $-8.12B | $-5.65B |
| Sales Maturities of Investments | $466.00M | $1.69B | $1.23B | $2.25B | $1.47B |
| Other Investing Activities | $23.20B | $14.21B | $5.14B | $-86.17B | $-218.00B |
| Net Cash Used for Investing Activities | $-195.10B | $-112.77B | $-173.77B | $-91.01B | $-221.57B |
| Debt Repayment | $-43.72B | $-5.55B | $393.67B | $236.29B | $51.27B |
| Common Stock Issued | $- | $- | $- | $182.66B | $- |
| Common Stock Repurchased | $- | $- | $- | $- | $-40.02B |
| Dividends Paid | $-23.92B | $-2.00M | $-7.00M | $-31.00M | $-38.15B |
| Other Financing Activities | $-37.39B | $-32.92B | $-34.38B | $-30.30B | $-3.24B |
| Net Cash Used Provided by Financing Activities | $-105.03B | $-38.47B | $359.28B | $388.62B | $-30.14B |
| Effect of Forex Changes on Cash | $10.80B | $3.34B | $3.93B | $1.09B | $-1.24B |
| Net Change in Cash | $74.62B | $145.02B | $85.89B | $79.19B | $-192.91B |
| Cash at End of Period | $713.87B | $639.25B | $494.23B | $408.33B | $329.15B |
| Cash at Beginning of Period | $639.25B | $494.23B | $408.33B | $329.15B | $522.06B |
| Operating Cash Flow | $363.94B | $292.91B | $-103.55B | $-219.52B | $60.03B |
| Capital Expenditure | $-218.07B | $-117.49B | $-161.31B | $-89.69B | $-239.61B |
| Free Cash Flow | $138.84B | $175.42B | $-264.85B | $-309.20B | $-179.58B |
Cash Flow Charts
| Breakdown | June 30, 2024 | March 31, 2024 | December 31, 2023 | September 30, 2023 | June 30, 2023 | March 31, 2023 | December 31, 2022 | September 30, 2022 | June 30, 2022 | March 31, 2022 | December 31, 2021 | September 30, 2021 | June 30, 2021 | March 31, 2021 | December 31, 2020 | September 30, 2020 | June 30, 2020 | March 31, 2020 | December 31, 2019 | September 30, 2019 |
|---|---|---|---|---|---|---|---|---|---|---|---|---|---|---|---|---|---|---|---|---|
| Net Income | $13.98B | $9.66B | $34.88B | $57.20B | $31.90B | $27.76B | $27.50B | $25.97B | $-28.81B | $-57.92B | $-34.25B | $-70.56B | $-83.89B | $-104.54B | $-71.29B | $-93.92B | $-134.33B | $-17.62B | $35.33B | $58.77B |
| Depreciation and Amortization | $38.20B | $37.90B | $36.87B | $38.22B | $36.98B | $36.49B | $38.62B | $41.10B | $41.98B | $45.84B | $43.38B | $46.21B | $43.35B | $52.26B | $49.39B | $44.34B | $44.60B | $15.59B | $54.58B | $27.57B |
| Deferred Income Tax | $- | $- | $- | $- | $- | $- | $- | $- | $- | $- | $- | $- | $- | $- | $- | $- | $- | $- | $- | $- |
| Stock Based Compensation | $- | $- | $- | $- | $- | $- | $- | $- | $- | $- | $- | $- | $- | $- | $- | $- | $- | $- | $- | $- |
| Change in Working Capital | $-25.81B | $45.20B | $-15.16B | $5.81B | $49.08B | $13.62B | $-2.53B | $-2.47B | $51.41B | $-8.14B | $4.19B | $-7.66B | $4.70B | $-114.00M | $-6.47B | $-493.00M | $-50.94B | $-4.96B | $5.18B | $-103.87B |
| Accounts Receivables | $-24.48B | $-8.50B | $10.07B | $-7.09B | $4.93B | $-18.92B | $1.56B | $-10.99B | $-27.66B | $-11.36B | $-14.16B | $-4.20B | $2.89B | $-4.95B | $-9.11B | $-3.18B | $19.84B | $- | $- | $- |
| Inventory | $-1.60B | $-147.00M | $-2.78B | $-3.10B | $-665.00M | $3.15B | $-2.96B | $-4.01B | $-1.07B | $-737.00M | $-258.00M | $-961.00M | $-465.00M | $3.03B | $169.00M | $2.38B | $-767.00M | $-1.73B | $1.10B | $-2.49B |
| Accounts Payables | $7.79B | $8.26B | $-1.95B | $19.18B | $-4.07B | $-3.83B | $7.94B | $15.73B | $22.41B | $-9.73B | $7.63B | $2.44B | $-5.06B | $-2.10B | $- | $- | $- | $- | $- | $- |
| Other Working Capital | $-7.51B | $45.58B | $-20.51B | $-3.18B | $48.88B | $33.22B | $-9.08B | $-3.20B | $57.73B | $3.96B | $18.61B | $-2.50B | $5.17B | $-3.14B | $-6.63B | $-2.87B | $-50.17B | $-3.23B | $4.07B | $-101.39B |
| Other Non Cash Items | $79.65B | $70.93B | $3.30B | $-11.48B | $5.70B | $23.60B | $7.58B | $-23.14B | $14.21B | $3.41B | $-4.17B | $-17.98B | $-10.05B | $12.77B | $-1.57B | $30.34B | $10.46B | $1.21B | $-58.01B | $-10.38B |
| Net Cash Provided by Operating Activities | $106.03B | $87.50B | $59.88B | $89.75B | $123.65B | $101.48B | $71.16B | $41.47B | $78.80B | $-16.82B | $9.15B | $-50.00B | $-45.88B | $-39.63B | $-29.94B | $-19.74B | $-130.21B | $-5.78B | $37.07B | $-27.91B |
| Investments in Property Plant and Equipment | $-40.73B | $-60.07B | $-72.87B | $-48.03B | $-37.11B | $-34.05B | $-26.74B | $-21.29B | $-35.41B | $-28.53B | $-33.92B | $-52.27B | $-46.58B | $-16.54B | $-1.25B | $650.00M | $1.05B | $- | $- | $- |
| Acquisitions Net | $1.15B | $568.00M | $87.00M | $172.00M | $1.48B | $1.87B | $7.29B | $-31.00M | $888.00M | $-7.11B | $785.00M | $841.00M | $2.14B | $467.00M | $934.00M | $25.00M | $468.00M | $- | $28.00M | $179.00M |
| Purchases of Investments | $-1.71B | $-611.00M | $-2.16B | $-121.00M | $-105.00M | $-8.08B | $19.11B | $- | $- | $-1.28B | $- | $-9.50B | $-3.09B | $-1.87B | $-104.00M | $-3.01B | $-3.14B | $-906.00M | $-2.94B | $-1.63B |
| Sales Maturities of Investments | $- | $3.00M | $463.00M | $47.86B | $-1.48B | $1.34B | $342.00M | $- | $- | $397.00M | $829.00M | $- | $2.14B | $827.00M | $934.00M | $25.00M | $468.00M | $933.00M | $208.00M | $-1.00M |
| Other Investing Activities | $2.33B | $20.33B | $1.20B | $-46.75B | $1.63B | $222.00M | $-21.56B | $1.30B | $2.04B | $455.00M | $274.00M | $5.08B | $-46.42B | $-16.93B | $-34.30B | $-11.82B | $-23.98B | $-33.21B | $-79.20B | $-55.34B |
| Net Cash Used for Investing Activities | $-38.96B | $-39.78B | $-73.28B | $-46.87B | $-35.58B | $-38.70B | $-21.56B | $-20.02B | $-32.49B | $-36.07B | $-33.65B | $-56.69B | $-47.37B | $-17.97B | $-33.79B | $-14.13B | $-25.12B | $-33.19B | $-81.93B | $-56.97B |
| Debt Repayment | $53.20B | $-15.31B | $-21.13B | $-10.22B | $-430.00M | $33.47B | $-20.29B | $-10.43B | $-5.35B | $27.09B | $180.07B | $138.95B | $47.55B | $17.39B | $-4.05B | $-7.27B | $230.25B | $35.55B | $- | $- |
| Common Stock Issued | $- | $- | $- | $- | $- | $- | $- | $- | $- | $- | $- | $- | $- | $-88.00M | $- | $- | $- | $- | $- | $- |
| Common Stock Repurchased | $- | $- | $- | $- | $- | $- | $- | $- | $- | $- | $- | $- | $- | $- | $- | $- | $- | $-10.00B | $-10.01B | $-10.00B |
| Dividends Paid | $-18.70B | $-121.00M | $-12.95B | $-666.00M | $-10.19B | $- | $-1.00M | $- | $-1.00M | $-1.00M | $-78.00M | $-81.00M | $-3.00M | $-2.00M | $-7.00M | $-10.00M | $-12.00M | $-193.00M | $-18.77B | $-467.00M |
| Other Financing Activities | $-309.00M | $-9.70B | $-11.41B | $-6.26B | $-6.64B | $-10.83B | $-14.15B | $-1.16B | $-9.72B | $-1.90B | $-10.01B | $-16.44B | $-6.02B | $-7.67B | $176.15B | $-6.27B | $-9.78B | $17.62B | $16.01B | $-891.00M |
| Net Cash Used Provided by Financing Activities | $34.20B | $-21.55B | $-45.49B | $-17.15B | $-17.26B | $22.64B | $-34.44B | $-11.60B | $-15.07B | $25.18B | $170.13B | $122.43B | $41.53B | $9.63B | $172.10B | $-13.56B | $220.46B | $42.97B | $-24.62B | $-11.36B |
| Effect of Forex Changes on Cash | $4.25B | $3.64B | $-628.00M | $1.84B | $5.95B | $770.00M | $-5.10B | $2.78B | $4.90B | $3.58B | $-269.00M | $214.00M | $398.00M | $1.33B | $-87.00M | $-197.00M | $45.00M | $-1.29B | $-70.00M | $523.00M |
| Net Change in Cash | $819.38B | $29.81B | $-59.52B | $27.57B | $76.76B | $86.20B | $10.05B | $12.63B | $36.14B | $-24.11B | $145.37B | $15.95B | $-51.32B | $-46.63B | $108.28B | $-47.63B | $65.17B | $2.71B | $-69.55B | $-95.71B |
| Cash at End of Period | $819.38B | $713.87B | $684.06B | $743.58B | $716.01B | $639.25B | $553.05B | $543.00B | $530.36B | $494.23B | $518.34B | $372.97B | $357.02B | $408.33B | $454.97B | $346.69B | $394.31B | $329.15B | $326.43B | $395.99B |
| Cash at Beginning of Period | $- | $684.06B | $743.58B | $716.01B | $639.25B | $553.05B | $543.00B | $530.36B | $494.23B | $518.34B | $372.97B | $357.02B | $408.33B | $454.97B | $346.69B | $394.31B | $329.15B | $326.43B | $395.99B | $491.70B |
| Operating Cash Flow | $106.03B | $87.50B | $59.88B | $89.75B | $123.65B | $101.48B | $71.16B | $41.47B | $78.80B | $-16.82B | $9.15B | $-50.00B | $-45.88B | $-39.63B | $-29.94B | $-19.74B | $-130.21B | $-5.78B | $37.07B | $-27.91B |
| Capital Expenditure | $-40.73B | $-60.07B | $-72.87B | $-48.03B | $-37.11B | $-34.05B | $-26.74B | $-21.29B | $-35.41B | $-28.53B | $-33.92B | $-52.27B | $-46.58B | $-16.54B | $-1.25B | $650.00M | $1.05B | $- | $- | $- |
| Free Cash Flow | $65.31B | $27.43B | $-12.99B | $41.72B | $86.54B | $67.44B | $44.42B | $20.18B | $43.38B | $-45.35B | $-24.77B | $-102.27B | $-92.47B | $-56.17B | $-31.19B | $-19.09B | $-129.16B | $-5.78B | $37.07B | $-27.91B |
Japan Airlines Dividends
Explore Japan Airlines 's dividend history, including dividend yield, payout ratio, and historical payments.
Dividend Yield
1.88%
Dividend Payout Ratio
25.04%
Dividend Paid & Capex Coverage Ratio
1.50x
Japan Airlines Dividend History
| Dividend | Adjusted Dividend | Date | Record Date | Payment Date | Declaration Date |
|---|---|---|---|---|---|
| $0.072388 | $0.072388 | September 28, 2023 | September 29, 2023 | December 19, 2023 | |
| $0.061827 | $0.061827 | March 30, 2023 | March 31, 2023 | July 11, 2023 | |
| $0.18388 | $0.18388 | September 26, 2019 | September 27, 2019 | December 18, 2019 | September 10, 2019 |
Japan Airlines News
Read the latest news about Japan Airlines , including recent articles, headlines, and updates.
Japan Airlines Stock Remains Extremely Undervalued
Japan Airlines reported a 10.9% revenue increase for the nine months ending December 2024, driven by strong growth in cargo and international passenger revenues. Despite revenue growth, total expenses rose by 11%, with fuel and non-fuel costs increasing, resulting in only 10% of revenue translating to the bottom line. The stock trades at 4x EV/EBITDA, below its median of 5.4x, suggesting it's undervalued; I maintain my buy rating.

Japan Airlines Stock Undervalued With 9% Annual EBITDA Growth
Japan Airlines' Q2 results showed a 9.9% revenue growth, but EBIT declined due to rising costs outpacing capacity growth, impacting operating margins. Despite challenges, Japan Airlines expects a stronger second half, with a forecasted 17% EBIT growth, presenting potential upside if targets are met. Analysts predict a lower EBIT than the company, suggesting additional upside if Japan Airlines achieves its forecast, with a FY25 price target of $11.47.

Japan Airlines: Why I Remain Bullish
Japan Airlines' FY2023 financial results showed strong revenue growth, particularly in the international passenger segment. Despite challenges in the cargo business, the LCC arm of operations saw significant revenue growth. FY2024 guidance indicates potential for revenue growth and EBIT margin expansion, making Japan Airlines' stock still a buy with a 31% upside.

Intelsat Multi-Orbit Inflight Connectivity Coming to Japan Airlines
MCLEAN, Va.--(BUSINESS WIRE)--Intelsat, operator of the world's largest integrated satellite and terrestrial network, was selected by Japan Airlines to provide multi-orbit inflight connectivity service on more than 20 Boeing 737 MAX aircraft to be delivered in the coming years. The airline will become one of the first in the Asia-Pacific region to offer reliable, multi-orbit service using Intelsat's new electronically steered array (ESA) antenna. “Japan Airlines' passengers will soon benefit fr.

FPT Software Collaborates with JAL Information Technology to Develop Strategic Aviation IT System
TOKYO--(BUSINESS WIRE)--FPT Software signed a Memorandum of Understanding (MOU) with JAL Information Technology (JIT), a subsidiary of JAL Infotec - an aviation technology solutions and services provider under Japan Airlines. This partnership will see both sides collaborating on the development of IT systems for aviation and non-aviation sectors, as well as exchanging human resources to enhance technical capability and expand business horizons. Besides, the two companies will leverage AI, IoT, and Cloud to create new values through the IT solutions delivered to clients. FPT Software plans to mobilize the resources in Japan and its global markets to form a specialized team dedicated to providing high-quality digital services and solutions for JIT. Both companies aim to create new service values, reduce cost and lead time for non-aviation business activities of JAL Infotec and JIT. JAL Infotec’s Chief Executive Officer, Koyama Hideyuki, commended the long-standing partnership between FPT Software and JAL Infotec, which has been in place since 2005. Throughout this time, FPT Software has played a pivotal role in developing numerous business systems for JAL Infotec. “I am glad that FPT Software and JAL Infotec have been working together to address challenges not only for us but also for many large customers. I hope our collaboration can also strengthen the bilateral relationship between Vietnam and Japan," he added. "Our two-decade partnership is built on the unwavering trust of JAL Infotec and our dedicated efforts. This collaboration is poised for success, with FPT Software's commitment to bolstering JAL's digital transformation and advancing the business growth of both companies," said FPT Software Senior Executive Vice President and FPT Japan CEO Do Van Khac. With nearly 20 years of operating in the Japanese market, FPT Software’s subsidiary FPT Japan now stands out as one of the largest foreign technology firms in terms of workforce, with 3,500 employees across 16 local offices and innovation hubs, as well as 15,000 global employees dedicated to the Japanese market, providing world-class IT services to over 450 clients worldwide. The company is also recognized for excellent employee benefits and workplace happiness, earning accolades such as Best Workplaces in Asia, Best Places to Work in Japan, and Best Places to Work for Women in Japan. About FPT Software FPT Software, a subsidiary of FPT Corporation, is a global technology and IT services provider headquartered in Vietnam, with $1 billion in revenue (2023) and over 30,000 employees in 30 countries. The company champions complex business opportunities and challenges with its world-class services in Advanced Analytics, AI, Digital Platforms, Cloud, Hyperautomation, IoT, Low-code, and so on. It has partnered with over 1,000+ clients worldwide, 91 of which are Fortune Global 500 companies in Aviation, Automotive, Banking, Financial Services and Insurance, Healthcare, Logistics, Manufacturing, Utilities, and more. For more information, please visit https://fptsoftware.com/

Japan Airlines Stock Can Fly Higher
Japan Airlines stock lost more value than ANA Holdings stock. The first half results show growth in total revenues, particularly in the international passenger business and cargo business. JAPSY has increased expectations for international passenger revenues and expects strong demand recovery, while cargo revenues are expected to decrease.
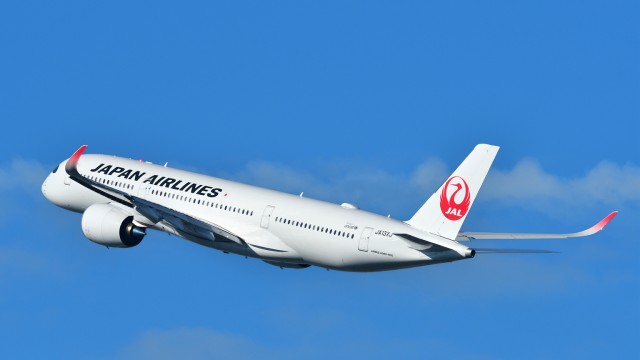
379 Survive Japan Airlines Flight 516 Fiery Crash At Haneda Airport
Following a stellar year of airline safety, with no commercial airline accidents reported in 2023, the new year begins with the remarkable survival of 379 Japan Airlines passengers and crew involved in a fiery crash at Haneda Airport.

Universal Hydrogen, Japan Airlines Co., Ltd., and JAL Engineering Co., Ltd.
LOS ANGELES--(BUSINESS WIRE)-- #aerospace--Following the announcement in March 2023 of Universal Hydrogen's collaboration in Japan to study green hydrogen supply and logistics solutions for Japanese airlines, the company today announced it has signed a memorandum of understanding (MoU) with Japan Airlines Co., Ltd. (JAL) and JAL Engineering Co., Ltd. (JALEC) to bring hydrogen-powered flight to Japan and establish JAL's position as a global leader in operating true zero-carbon-emissions passenger aircraft. “.

Japan Airlines Aims For Double-Digit Profit Growth
Japan Airlines saw a significant increase in capacity and revenue, driven by international passenger demand. Domestic passenger service revenues increased, but were offset by a decline in cargo business. Japan Airlines forecasted higher revenues for the year, with growth expected in the international operations and a higher consolidated net profit.
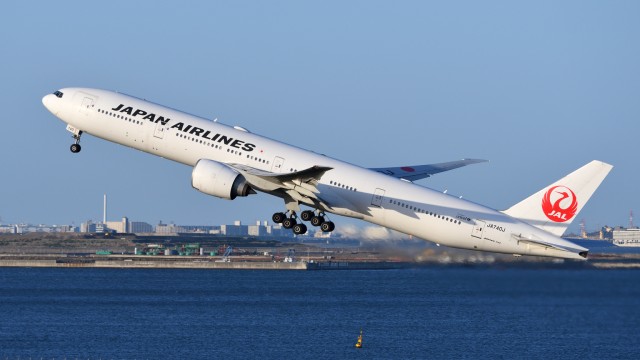
Japan Airlines Trials Clothing Rental Service to Promote Sustainable Tourism
International travelers heading to Japan are being offered a convenient — and sustainable — way to dress for their visit. On Wednesday (July 5), Japan Airlines (JAL) announced the launch of a rental clothing service called “Any Wear, Anywhere,” for foreign tourists and business travelers using JAL-operated flights.

Japan Airlines returns to freighter business
Japan Airlines is going back to the future. Thirteen years after getting rid of its freighter business as part of a bankruptcy reorganization, the passenger carrier is reintroducing a dedicated cargo fleet in a strategic move to capitalize on growth opportunities in the cargo and mail sectors.
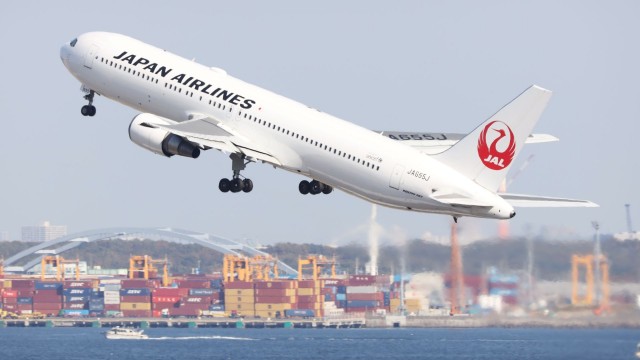
Japan Airlines posts narrower Q1 operating loss
Japan Airlines on Monday posted a narrower 30.2 billion yen ($228 million) operating loss for the first quarter, aided by a recovery in travel demand as pandemic-related restrictions eased. Earnings for the three months to June 30 missed an average 28.5 billion yen operating loss estimated by four analysts, according to Refinitiv data.
Similar Companies
International Consolidated Airlines Group S.A.
BABWF
Price: $3.50
Market Cap: $16.60B
Related Metrics
Explore detailed financial metrics and analysis for JAPSY.


