Nuveen Corporate Income 2023 Target Term Fund Key Executives
This section highlights Nuveen Corporate Income 2023 Target Term Fund's key executives, including their titles and compensation details.
Find Contacts at Nuveen Corporate Income 2023 Target Term Fund
(Showing 0 of )
Nuveen Corporate Income 2023 Target Term Fund Earnings
This section highlights Nuveen Corporate Income 2023 Target Term Fund's earnings, including key dates, EPS, earnings reports, and earnings call transcripts.
Next Earnings Date
Last Earnings Results
Earnings Call Transcripts
| Transcript | Quarter | Year | Date | Estimated EPS | Actual EPS |
|---|

Nuveen Corporate Income 2023 Target Term Fund (JHAA)
None
$9.70
Stock Price
$74.64M
Market Cap
-
Employees
Chicago, IL
Location
Financial Statements
Access annual & quarterly financial statements for Nuveen Corporate Income 2023 Target Term Fund, including income statements, balance sheets, and cash flow statements..
Annual Income Statement
| Breakdown | December 31, 2022 | December 31, 2021 | December 31, 2020 | December 31, 2019 | December 31, 2018 |
|---|---|---|---|---|---|
| Revenue | $-2.02M | $3.14M | $1.86M | $8.62M | $-13.77K |
| Cost of Revenue | $- | $- | $- | $- | $- |
| Gross Profit | $-2.02M | $3.14M | $1.86M | $8.62M | $-13.77K |
| Gross Profit Ratio | 100.00% | 100.00% | 100.00% | 100.00% | 100.00% |
| Research and Development Expenses | $- | $- | $- | $- | $- |
| General and Administrative Expenses | $155.99K | $127.09K | $163.45K | $148.06K | $29.07K |
| Selling and Marketing Expenses | $- | $- | $- | $- | $- |
| Selling General and Administrative Expenses | $155.99K | $127.09K | $163.45K | $148.06K | $29.07K |
| Other Expenses | $123 | $1.02K | $181 | $124 | $6 |
| Operating Expenses | $156.11K | $128.11K | $163.63K | $148.19K | $29.07K |
| Cost and Expenses | $156.11K | $128.11K | $163.63K | $148.19K | $29.07K |
| Interest Income | $3.99M | $4.28M | $5.29M | $6.45M | $- |
| Interest Expense | $605.76K | $214.50K | $351.33K | $764.29K | $- |
| Depreciation and Amortization | $228.49K | $236.56K | $206.30K | $171.86K | $161.14K |
| EBITDA | $-1.57M | $3.01M | $1.69M | $8.47M | $-42.84K |
| EBITDA Ratio | 77.73% | 95.92% | 91.19% | 98.28% | 311.16% |
| Operating Income | $-1.57M | $3.01M | $1.69M | $8.47M | $-42.84K |
| Operating Income Ratio | 77.73% | 95.92% | 91.19% | 98.28% | 311.16% |
| Total Other Income Expenses Net | $- | $- | $- | $- | $- |
| Income Before Tax | $-2.17M | $3.01M | $1.69M | $8.47M | $-42.84K |
| Income Before Tax Ratio | 107.73% | 95.92% | 91.19% | 98.28% | 311.16% |
| Income Tax Expense | $- | $- | $- | $- | $- |
| Net Income | $-2.17M | $3.01M | $1.69M | $8.47M | $-42.84K |
| Net Income Ratio | 107.73% | 95.92% | 91.19% | 98.28% | 311.16% |
| EPS | $-0.28 | $0.39 | $0.22 | $1.08 | $-0.01 |
| EPS Diluted | $-0.28 | $0.39 | $0.22 | $1.08 | $-0.01 |
| Weighted Average Shares Outstanding | 7.77M | 7.72M | 7.70M | 7.85M | 4.28M |
| Weighted Average Shares Outstanding Diluted | 7.77M | 7.72M | 7.70M | 7.85M | 4.28M |
| SEC Filing | Source | Source | Source | Source | Source |
| Breakdown |
|---|
| Revenue |
| Cost of Revenue |
| Gross Profit |
| Gross Profit Ratio |
| Research and Development Expenses |
| General and Administrative Expenses |
| Selling and Marketing Expenses |
| Selling General and Administrative Expenses |
| Other Expenses |
| Operating Expenses |
| Cost and Expenses |
| Interest Income |
| Interest Expense |
| Depreciation and Amortization |
| EBITDA |
| EBITDA Ratio |
| Operating Income |
| Operating Income Ratio |
| Total Other Income Expenses Net |
| Income Before Tax |
| Income Before Tax Ratio |
| Income Tax Expense |
| Net Income |
| Net Income Ratio |
| EPS |
| EPS Diluted |
| Weighted Average Shares Outstanding |
| Weighted Average Shares Outstanding Diluted |
| SEC Filing |
Annual Balance Sheet
| Breakdown | December 31, 2022 | December 31, 2021 | December 31, 2020 | December 31, 2019 | December 31, 2018 |
|---|---|---|---|---|---|
| Cash and Cash Equivalents | $43.12K | $- | $121.47K | $- | $69.09M |
| Short Term Investments | $- | $- | $- | $- | $- |
| Cash and Short Term Investments | $43.12K | $- | $121.47K | $- | $69.09M |
| Net Receivables | $1.11M | $1.97M | $3.95M | $1.07M | $- |
| Inventory | $- | $- | $- | $- | $- |
| Other Current Assets | $- | $- | $- | $- | $- |
| Total Current Assets | $1.16M | $1.97M | $4.07M | $1.07M | $69.09M |
| Property Plant Equipment Net | $- | $- | $- | $- | $- |
| Goodwill | $- | $- | $- | $- | $- |
| Intangible Assets | $- | $- | $- | $- | $- |
| Goodwill and Intangible Assets | $- | $- | $- | $- | $- |
| Long Term Investments | $100.64M | $103.48M | $103.67M | $108.90M | $- |
| Tax Assets | $- | $- | $- | $- | $- |
| Other Non-Current Assets | $-100.64M | $-103.48M | $-103.67M | $-108.90M | $- |
| Total Non-Current Assets | $100.64M | $103.48M | $103.67M | $108.90M | $- |
| Other Assets | $813 | $463 | $289 | $36 | $69.09M |
| Total Assets | $101.80M | $105.44M | $107.75M | $109.97M | $69.09M |
| Account Payables | $4.32M | $2.50M | $4.02M | $1.31M | $- |
| Short Term Debt | $- | $- | $- | $- | $- |
| Tax Payables | $- | $- | $- | $- | $- |
| Deferred Revenue | $- | $- | $- | $- | $- |
| Other Current Liabilities | $-4.32M | $-2.50M | $-4.02M | $-1.31M | $- |
| Total Current Liabilities | $4.32M | $2.50M | $4.02M | $1.31M | $- |
| Long Term Debt | $24.50M | $24.52M | $25.08M | $27.02M | $- |
| Deferred Revenue Non-Current | $- | $- | $- | $- | $- |
| Deferred Tax Liabilities Non-Current | $- | $- | $- | $- | $- |
| Other Non-Current Liabilities | $-20.18M | $-24.52M | $-25.08M | $-27.02M | $- |
| Total Non-Current Liabilities | $4.32M | $24.52M | $25.08M | $27.02M | $- |
| Other Liabilities | $20.28M | $140.90K | $125.18K | $603.72K | $42.84K |
| Total Liabilities | $28.92M | $27.17M | $29.22M | $28.94M | $42.84K |
| Preferred Stock | $- | $- | $- | $- | $- |
| Common Stock | $77.58K | $78.26K | $78.25K | $78.18K | $70.10K |
| Retained Earnings | $-3.52M | $1.22M | $1.46M | $4.00M | $- |
| Accumulated Other Comprehensive Income Loss | $- | $- | $- | $- | $- |
| Other Total Stockholders Equity | $76.32M | $76.97M | $76.99M | $76.95M | $68.97M |
| Total Stockholders Equity | $72.88M | $78.27M | $78.52M | $81.03M | $69.04M |
| Total Equity | $72.88M | $78.27M | $78.52M | $81.03M | $69.04M |
| Total Liabilities and Stockholders Equity | $101.80M | $105.44M | $107.75M | $109.97M | $69.09M |
| Minority Interest | $- | $- | $- | $- | $- |
| Total Liabilities and Total Equity | $101.80M | $105.44M | $107.75M | $109.97M | $69.09M |
| Total Investments | $100.64M | $103.48M | $103.67M | $108.90M | $- |
| Total Debt | $24.50M | $24.52M | $25.08M | $27.02M | $- |
| Net Debt | $24.46M | $24.52M | $24.96M | $27.02M | $-69.09M |
Balance Sheet Charts
| Breakdown | June 30, 2023 | December 31, 2022 | June 30, 2022 | December 31, 2021 | June 30, 2021 | December 31, 2020 | June 30, 2020 | December 31, 2019 | June 30, 2019 |
|---|---|---|---|---|---|---|---|---|---|
| Cash and Cash Equivalents | $82.59K | $43.12K | $43.12K | $- | $- | $121.47K | $112.87K | $- | $- |
| Short Term Investments | $- | $- | $- | $- | $- | $- | $- | $- | $- |
| Cash and Short Term Investments | $82.59K | $43.12K | $43.12K | $- | $- | $121.47K | $112.87K | $- | $- |
| Net Receivables | $1.59M | $1.11M | $1.02M | $1.97M | $4.82M | $3.95M | $3.54M | $1.07M | $2.75M |
| Inventory | $- | $- | $- | $- | $- | $- | $- | $- | $- |
| Other Current Assets | $- | $- | $- | $- | $- | $- | $- | $- | $- |
| Total Current Assets | $1.68M | $1.16M | $1.06M | $1.97M | $4.82M | $4.07M | $3.65M | $1.07M | $2.75M |
| Property Plant Equipment Net | $- | $- | $- | $- | $- | $- | $- | $- | $- |
| Goodwill | $- | $- | $- | $- | $- | $- | $- | $- | $- |
| Intangible Assets | $- | $- | $- | $- | $- | $- | $- | $- | $- |
| Goodwill and Intangible Assets | $- | $- | $- | $- | $- | $- | $- | $- | $- |
| Long Term Investments | $72.29M | $100.64M | $97.21M | $103.48M | $103.68M | $103.67M | $94.00M | $108.90M | $106.25M |
| Tax Assets | $- | $- | $- | $- | $- | $- | $- | $- | $- |
| Other Non-Current Assets | $-72.29M | $-100.64M | $-97.21M | $-103.48M | $-103.68M | $-103.67M | $-94.00M | $-108.90M | $-106.25M |
| Total Non-Current Assets | $72.29M | $100.64M | $97.21M | $103.48M | $103.68M | $103.67M | $94.00M | $108.90M | $106.25M |
| Other Assets | $4.79K | $813 | $3.95K | $463 | $355 | $289 | $4.27K | $36 | $6.93K |
| Total Assets | $73.97M | $101.80M | $98.28M | $105.44M | $108.50M | $107.75M | $97.66M | $109.97M | $109.01M |
| Account Payables | $170.78K | $4.32M | $256.73K | $2.50M | $4.32M | $4.02M | $343.68K | $1.31M | $912.62K |
| Short Term Debt | $- | $- | $- | $- | $- | $- | $- | $- | $- |
| Tax Payables | $- | $- | $- | $- | $- | $- | $- | $- | $- |
| Deferred Revenue | $- | $- | $- | $- | $- | $- | $- | $- | $- |
| Other Current Liabilities | $-170.78K | $-4.32M | $-256.73K | $-2.50M | $-4.32M | $-4.02M | $-343.68K | $-1.31M | $-912.62K |
| Total Current Liabilities | $170.78K | $4.32M | $256.73K | $2.50M | $4.32M | $4.02M | $343.68K | $1.31M | $912.62K |
| Long Term Debt | $- | $24.50M | $24.52M | $24.52M | $24.78M | $25.08M | $24.52M | $27.02M | $25.50M |
| Deferred Revenue Non-Current | $- | $- | $- | $- | $- | $- | $- | $- | $- |
| Deferred Tax Liabilities Non-Current | $- | $- | $- | $- | $- | $- | $- | $- | $- |
| Other Non-Current Liabilities | $- | $-20.18M | $-24.27M | $-24.52M | $-24.78M | $-25.08M | $-24.52M | $-27.02M | $-25.50M |
| Total Non-Current Liabilities | $- | $4.32M | $256.73K | $24.52M | $24.78M | $25.08M | $24.52M | $27.02M | $25.50M |
| Other Liabilities | $- | $20.28M | $24.40M | $140.90K | $138.86K | $125.18K | $93.42K | $603.72K | $2.10M |
| Total Liabilities | $170.78K | $28.92M | $24.91M | $27.17M | $29.24M | $29.22M | $24.96M | $28.94M | $28.51M |
| Preferred Stock | $- | $- | $- | $- | $- | $- | $- | $- | $- |
| Common Stock | $76.92K | $77.58K | $78.26K | $78.26K | $78.26K | $78.25K | $78.24K | $78.18K | $78.13K |
| Retained Earnings | $-2.05M | $-3.52M | $-3.65M | $1.22M | $2.21M | $1.46M | $-4.36M | $4.00M | $3.52M |
| Accumulated Other Comprehensive Income Loss | $- | $- | $- | $- | $- | $- | $- | $- | $- |
| Other Total Stockholders Equity | $75.68M | $76.32M | $76.94M | $76.97M | $76.97M | $76.99M | $76.98M | $76.95M | $76.89M |
| Total Stockholders Equity | $73.70M | $72.88M | $73.36M | $78.27M | $79.25M | $78.52M | $72.69M | $81.03M | $80.50M |
| Total Equity | $73.70M | $72.88M | $73.36M | $78.27M | $79.25M | $78.52M | $72.69M | $81.03M | $80.50M |
| Total Liabilities and Stockholders Equity | $73.97M | $101.80M | $98.28M | $105.44M | $108.50M | $107.75M | $97.66M | $109.97M | $109.01M |
| Minority Interest | $- | $- | $- | $- | $- | $- | $- | $- | $- |
| Total Liabilities and Total Equity | $73.97M | $101.80M | $98.28M | $105.44M | $108.50M | $107.75M | $97.66M | $109.97M | $109.01M |
| Total Investments | $72.29M | $100.64M | $97.21M | $103.48M | $103.68M | $103.67M | $94.00M | $108.90M | $106.25M |
| Total Debt | $- | $24.50M | $24.52M | $24.52M | $24.78M | $25.08M | $24.52M | $27.02M | $25.50M |
| Net Debt | $-82.59K | $24.46M | $24.48M | $24.52M | $24.78M | $24.96M | $24.41M | $27.02M | $25.50M |
Annual Cash Flow
| Breakdown | December 31, 2022 | December 31, 2021 | December 31, 2020 | December 31, 2019 |
|---|---|---|---|---|
| Net Income | $-2.17M | $3.01M | $1.69M | $8.47M |
| Depreciation and Amortization | $- | $- | $- | $- |
| Deferred Income Tax | $- | $- | $- | $- |
| Stock Based Compensation | $- | $- | $- | $- |
| Change in Working Capital | $2.59M | $-65.76K | $391.53K | $-1.20M |
| Accounts Receivables | $- | $- | $- | $- |
| Inventory | $- | $- | $- | $- |
| Accounts Payables | $- | $- | $- | $- |
| Other Working Capital | $- | $- | $- | $- |
| Other Non Cash Items | $2.84M | $197.39K | $5.22M | $-107.39M |
| Net Cash Provided by Operating Activities | $3.25M | $3.14M | $7.31M | $-100.11M |
| Investments in Property Plant and Equipment | $- | $- | $- | $- |
| Acquisitions Net | $- | $- | $- | $- |
| Purchases of Investments | $- | $- | $- | $- |
| Sales Maturities of Investments | $- | $- | $- | $- |
| Other Investing Activities | $- | $- | $- | $- |
| Net Cash Used for Investing Activities | $- | $- | $- | $- |
| Debt Repayment | $- | $- | $- | $- |
| Common Stock Issued | $583.12K | $- | $- | $7.92M |
| Common Stock Repurchased | $-583.12K | $- | $- | $28.02M |
| Dividends Paid | $-2.60M | $-3.26M | $-4.20M | $-4.40M |
| Other Financing Activities | $-608.12K | $- | $-2.99M | $35.43M |
| Net Cash Used Provided by Financing Activities | $-3.21M | $-3.26M | $-7.19M | $31.03M |
| Effect of Forex Changes on Cash | $- | $- | $- | $- |
| Net Change in Cash | $43.12K | $-121.47K | $121.47K | $-69.09M |
| Cash at End of Period | $43.12K | $- | $121.47K | $- |
| Cash at Beginning of Period | $- | $121.47K | $- | $69.09M |
| Operating Cash Flow | $3.25M | $3.14M | $7.31M | $-100.11M |
| Capital Expenditure | $- | $- | $- | $- |
| Free Cash Flow | $3.25M | $3.14M | $7.31M | $-100.11M |
Cash Flow Charts
| Breakdown |
|---|
| Net Income |
| Depreciation and Amortization |
| Deferred Income Tax |
| Stock Based Compensation |
| Change in Working Capital |
| Accounts Receivables |
| Inventory |
| Accounts Payables |
| Other Working Capital |
| Other Non Cash Items |
| Net Cash Provided by Operating Activities |
| Investments in Property Plant and Equipment |
| Acquisitions Net |
| Purchases of Investments |
| Sales Maturities of Investments |
| Other Investing Activities |
| Net Cash Used for Investing Activities |
| Debt Repayment |
| Common Stock Issued |
| Common Stock Repurchased |
| Dividends Paid |
| Other Financing Activities |
| Net Cash Used Provided by Financing Activities |
| Effect of Forex Changes on Cash |
| Net Change in Cash |
| Cash at End of Period |
| Cash at Beginning of Period |
| Operating Cash Flow |
| Capital Expenditure |
| Free Cash Flow |
Nuveen Corporate Income 2023 Target Term Fund Dividends
Explore Nuveen Corporate Income 2023 Target Term Fund's dividend history, including dividend yield, payout ratio, and historical payments.
Dividend Yield
3.69%
Dividend Payout Ratio
-119.58%
Dividend Paid & Capex Coverage Ratio
1.25x
Nuveen Corporate Income 2023 Target Term Fund Dividend History
| Dividend | Adjusted Dividend | Date | Record Date | Payment Date | Declaration Date |
|---|---|---|---|---|---|
| $0.0185 | $0.0185 | October 12, 2023 | October 13, 2023 | November 01, 2023 | October 02, 2023 |
| $0.0185 | $0.0185 | September 14, 2023 | September 15, 2023 | October 02, 2023 | September 01, 2023 |
| $0.0185 | $0.0185 | August 14, 2023 | August 15, 2023 | September 01, 2023 | August 01, 2023 |
| $0.0185 | $0.0185 | July 13, 2023 | July 14, 2023 | August 01, 2023 | July 03, 2023 |
| $0.0185 | $0.0185 | June 14, 2023 | June 15, 2023 | July 03, 2023 | June 01, 2023 |
| $0.0185 | $0.0185 | May 12, 2023 | May 15, 2023 | June 01, 2023 | May 01, 2023 |
| $0.0185 | $0.0185 | April 13, 2023 | April 14, 2023 | May 01, 2023 | April 04, 2023 |
| $0.0185 | $0.0185 | March 14, 2023 | March 15, 2023 | April 03, 2023 | March 01, 2023 |
| $0.025 | $0.025 | February 14, 2023 | February 15, 2023 | March 01, 2023 | February 01, 2023 |
| $0.025 | $0.025 | January 12, 2023 | January 13, 2023 | February 01, 2023 | January 03, 2023 |
| $0.025 | $0.025 | December 14, 2022 | December 15, 2022 | December 30, 2022 | December 01, 2022 |
| $0.025 | $0.025 | November 14, 2022 | November 15, 2022 | December 01, 2022 | November 01, 2022 |
| $0.025 | $0.025 | October 13, 2022 | October 14, 2022 | November 01, 2022 | October 03, 2022 |
| $0.025 | $0.025 | September 14, 2022 | September 15, 2022 | October 03, 2022 | September 01, 2022 |
| $0.025 | $0.025 | August 12, 2022 | August 15, 2022 | September 01, 2022 | August 01, 2022 |
| $0.025 | $0.025 | July 14, 2022 | July 15, 2022 | August 01, 2022 | July 01, 2022 |
| $0.025 | $0.025 | June 14, 2022 | June 15, 2022 | July 01, 2022 | June 01, 2022 |
| $0.032 | $0.0315 | May 12, 2022 | May 13, 2022 | June 01, 2022 | May 02, 2022 |
| $0.032 | $0.0315 | April 13, 2022 | April 14, 2022 | May 02, 2022 | April 01, 2022 |
| $0.032 | $0.0315 | March 14, 2022 | March 15, 2022 | April 01, 2022 | March 01, 2022 |
Nuveen Corporate Income 2023 Target Term Fund News
Read the latest news about Nuveen Corporate Income 2023 Target Term Fund, including recent articles, headlines, and updates.
Nuveen Corporate Income 2023 Target Term Fund Announces Termination and Liquidation
NEW YORK--(BUSINESS WIRE)--Nuveen Corporate Income 2023 Target Term Fund (NYSE: JHAA) completed its termination and liquidation following the close of business on December 1, 2023. The termination and liquidation was performed in accordance with the fund's investment objectives and organizational documents, consistent with the fund's previously announced liquidation plans. JHAA launched on December 18, 2018 as a short duration strategy that invested primarily in high yield corporate debt securi.

Nuveen Corporate Income 2023 Target Term Fund Announces Liquidation Details
NEW YORK--(BUSINESS WIRE)--Nuveen Corporate Income 2023 Target Term Fund (NYSE: JHAA) today announced new details concerning its liquidation. Consistent with its investment objectives and organizational documents, the fund plans to terminate its existence and liquidate on or about December 1, 2023. As the fund approaches liquidation, its common shares will continue trading on the New York Stock Exchange through November 24, 2023 and will be suspended from trading before the market opens on Nove.

CEF Weekly Review: Sell In May Worked This Time
We review CEF market valuation and performance through the first week of June and highlight recent market action. CEFs finished in a strong fashion, partly reversing the weakness over May. With a weak May behind us, we take a look at seasonality and whether "sell in May" works in CEFs.

JHAA: A 'Drier-Powder' Double-Digit Yield Opportunity For The Rest Of The Year
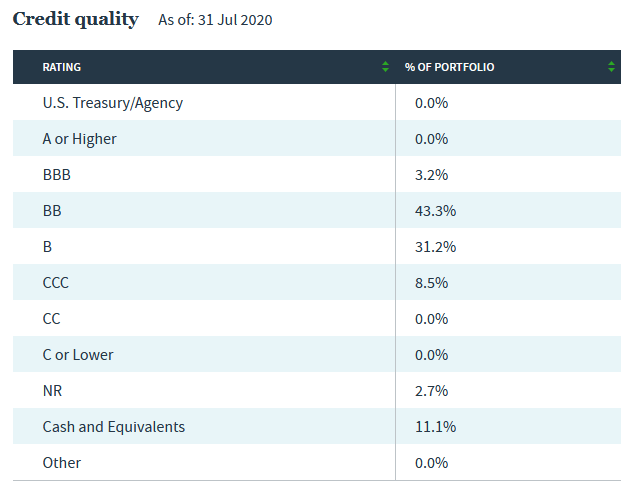
Nuveen Corporate Income 2023 Target Term is a Nuveen target term fund allocated mostly to BBB/BB-rated corporate bonds. JHAA is expected to terminate this December, which offers a potential opportunity given the fund continues to trade at a discount. Adding up all the fund's key performance drivers into December, we come up with a roughly 10% yield opportunity.


How To Strengthen High-Yield Allocations With Term CEFs
The high-yield sector has proven relatively resilient this year owing to its long duration profile. However, with the bulk of credit spread widening now retraced, it makes sense to take some chips off the table and lighten up on risk in the sector.

Nuveen Closed-End Funds Announce Postponement of Annual Meeting of Shareholders Originally Scheduled for April 8, 2020 and Change to a Virtual Meeting
The following Nuveen closed-end funds (each, a "Fund" and collectively, the "Funds") announced today that each Fund’s 2020 Annual Meeting of Shareholders (the "Meeting") has been postponed and that the meeting will be held as a virtual meeting:

Similar Companies
Virtus Convertible & Income 2024 Target Term Fund
CBH
Price: $9.19
Market Cap: $167.75M
Eaton Vance National Municipal Opportunities Trust
EOT
Price: $16.77
Market Cap: $262.03M
BlackRock MuniHoldings New York Quality Fund, Inc.
MHN
Price: $10.28
Market Cap: $310.73M
Nuveen California Select Tax-Free Income Portfolio
NXC
Price: $13.15
Market Cap: $83.66M
Related Metrics
Explore detailed financial metrics and analysis for JHAA.