John Hancock Income Securities Trust Key Executives
This section highlights John Hancock Income Securities Trust's key executives, including their titles and compensation details.
Find Contacts at John Hancock Income Securities Trust
(Showing 0 of )
John Hancock Income Securities Trust Earnings
This section highlights John Hancock Income Securities Trust's earnings, including key dates, EPS, earnings reports, and earnings call transcripts.
Next Earnings Date
Last Earnings Results
Earnings Call Transcripts
| Transcript | Quarter | Year | Date | Estimated EPS | Actual EPS |
|---|

John Hancock Income Securities Trust is a closed ended fixed income mutual fund launched and managed by John Hancock Investment Management LLC. It is co-managed by John Hancock Asset Management. The fund invests in the fixed income markets of United States. It invests primarily in corporate and government bonds with average maturity of 7.57 years. The fund benchmarks the performance of its portfolios against the Lehman Brothers Government/ Credit Bond Index. John Hancock Income Securities Trust was formed in February 14, 1973 and is domiciled in United States.
$11.27
Stock Price
$131.26M
Market Cap
-
Employees
Boston, MA
Location
Financial Statements
Access annual & quarterly financial statements for John Hancock Income Securities Trust, including income statements, balance sheets, and cash flow statements..
Annual Income Statement
| Breakdown | October 31, 2024 | October 31, 2023 | October 31, 2022 | October 31, 2021 | October 31, 2020 |
|---|---|---|---|---|---|
| Revenue | $19.18M | $10.97M | $-42.00M | $10.00M | $13.48M |
| Cost of Revenue | $- | $- | $1.46M | $1.60M | $1.57M |
| Gross Profit | $19.18M | $10.97M | $-43.46M | $8.40M | $11.91M |
| Gross Profit Ratio | 100.00% | 100.00% | 103.49% | 84.02% | 88.36% |
| Research and Development Expenses | $- | $- | $-25 | $1 | $1 |
| General and Administrative Expenses | $233.14K | $302.45K | $228.00K | $280.91K | $257.52K |
| Selling and Marketing Expenses | $- | $- | $- | $- | $- |
| Selling General and Administrative Expenses | $233.14K | $302.45K | $228.00K | $280.91K | $257.52K |
| Other Expenses | $- | $- | $36.68K | $49.89K | $59.19K |
| Operating Expenses | $271.83K | $1.60M | $264.67K | $330.80K | $316.71K |
| Cost and Expenses | $271.83K | $1.60M | $264.67K | $330.80K | $316.71K |
| Interest Income | $11.96M | $10.69M | $9.69M | $10.57M | $10.34M |
| Interest Expense | $5.53M | $5.09M | $1.70M | $654.71K | $1.28M |
| Depreciation and Amortization | $- | $-9.36M | $-8.24M | $-8.95M | $-8.80M |
| EBITDA | $- | $-3.99M | $-40.56M | $- | $- |
| EBITDA Ratio | 0.00% | -36.43% | 96.59% | 0.00% | 0.00% |
| Operating Income | $18.91M | $9.36M | $-40.56M | $9.67M | $13.16M |
| Operating Income Ratio | 98.58% | 85.37% | 96.59% | 96.69% | 97.65% |
| Total Other Income Expenses Net | $- | $-9.09M | $-42.26M | $720.62K | $4.37M |
| Income Before Tax | $18.91M | $273.29K | $-42.26M | $9.67M | $13.16M |
| Income Before Tax Ratio | 98.58% | 2.49% | 100.63% | 96.69% | 97.65% |
| Income Tax Expense | $- | $- | $8.24M | $8.29M | $8.97M |
| Net Income | $18.91M | $273.29K | $-42.26M | $9.67M | $13.16M |
| Net Income Ratio | 98.58% | 2.49% | 100.63% | 96.69% | 97.65% |
| EPS | $1.62 | $0.02 | $-3.63 | $0.83 | $1.13 |
| EPS Diluted | $1.62 | $0.02 | $-3.63 | $0.83 | $1.13 |
| Weighted Average Shares Outstanding | 11.65M | 11.65M | 11.65M | 11.65M | 11.65M |
| Weighted Average Shares Outstanding Diluted | 11.65M | 11.65M | 11.65M | 11.65M | 11.65M |
| SEC Filing | Source | Source | Source | Source | Source |
| Breakdown | April 30, 2024 | October 31, 2023 | April 30, 2023 | October 31, 2022 | April 30, 2022 | October 31, 2021 | April 30, 2021 | October 31, 2020 | April 30, 2020 | October 31, 2019 | April 30, 2019 | October 31, 2018 | April 30, 2018 | October 31, 2017 | April 30, 2017 | October 31, 2016 | April 30, 2016 | October 31, 2015 | April 30, 2015 | October 31, 2014 |
|---|---|---|---|---|---|---|---|---|---|---|---|---|---|---|---|---|---|---|---|---|
| Revenue | $4.01M | $5.56M | $5.40M | $-2.34M | $4.02M | $6.79M | $8.20M | $7.36M | $7.36M | $6.87M | $5.87M | $5.79M | $5.89M | $5.96M | $5.98M | $6.01M | $5.97M | $6.11M | $6.04M | $6.32M |
| Cost of Revenue | $696.62K | $- | $- | $711.37K | $752.48K | $792.88K | $805.25K | $793.40K | $775.24K | $772.53K | $- | $- | $- | $- | $- | $- | $- | $- | $- | $- |
| Gross Profit | $3.32M | $5.56M | $5.40M | $-3.05M | $3.27M | $6.00M | $7.39M | $6.56M | $6.59M | $6.09M | $5.87M | $5.79M | $5.89M | $5.96M | $5.98M | $6.01M | $5.97M | $6.11M | $6.04M | $6.32M |
| Gross Profit Ratio | 82.64% | 100.00% | 100.00% | 130.44% | 81.28% | 88.33% | 90.18% | 89.21% | 89.47% | 88.75% | 100.00% | 100.00% | 100.00% | 100.00% | 100.00% | 100.00% | 100.00% | 100.00% | 100.00% | 100.00% |
| Research and Development Expenses | $- | $- | $- | $- | $- | $- | $- | $- | $- | $- | $- | $- | $- | $- | $- | $- | $- | $- | $- | $- |
| General and Administrative Expenses | $- | $806.39K | $798.33K | $388.72K | $409.91K | $441.18K | $443.04K | $435.68K | $427.16K | $428.30K | $842.24K | $867.51K | $869.25K | $892.94K | $873.30K | $891.81K | $893.78K | $964.31K | $872.20K | $929.61K |
| Selling and Marketing Expenses | $- | $- | $- | $- | $- | $- | $- | $- | $- | $- | $- | $- | $- | $- | $- | $- | $- | $- | $- | $- |
| Selling General and Administrative Expenses | $10.79M | $806.39K | $798.33K | $388.72K | $409.91K | $441.18K | $443.04K | $435.68K | $427.16K | $428.30K | $842.24K | $867.51K | $869.25K | $892.94K | $873.30K | $891.81K | $893.78K | $964.31K | $872.20K | $929.61K |
| Other Expenses | $- | $- | $- | $7 | $-27.70M | $- | $- | $- | $- | $2 | $- | $- | $- | $- | $- | $- | $- | $- | $- | $- |
| Operating Expenses | $10.79M | $13.79M | $8.19M | $10.39M | $14.81M | $571.72K | $375.16K | $5.31M | $3.35M | $3.44M | $7.98M | $5.76M | $10.77M | $1.53M | $1.66M | $3.59M | $619.80K | $9.01M | $227.55K | $1.17M |
| Cost and Expenses | $-10.09M | $13.79M | $8.19M | $13.79M | $28.45M | $2.79M | $1.88M | $-8.71M | $9.91M | $6.01M | $7.98M | $5.76M | $10.77M | $1.53M | $1.66M | $3.59M | $619.80K | $9.01M | $227.55K | $1.17M |
| Interest Income | $- | $2.75M | $2.34M | $655.55K | $193.41K | $160.79K | $166.57K | $179.41K | $462.87K | $655.18K | $- | $- | $- | $833.14K | $634.27K | $496.95K | $465.66K | $557.98K | $542.74K | $476.86K |
| Interest Expense | $- | $- | $- | $1.31M | $- | $- | $- | $- | $- | $- | $- | $- | $- | $- | $- | $- | $- | $- | $- | $- |
| Depreciation and Amortization | $- | $-4.76M | $-4.61M | $-1.94M | $-2.18M | $-2.13M | $-2.34M | $-2.29M | $-2.11M | $11.03M | $-5.03M | $-4.92M | $-5.02M | $-5.07M | $-5.10M | $-5.12M | $-5.08M | $-5.15M | $-5.17M | $-5.39M |
| EBITDA | $14.10M | $- | $- | $-16.13M | $-24.43M | $1.87M | $6.32M | $16.07M | $-2.54M | $3.21M | $- | $- | $- | $- | $- | $- | $- | $- | $- | $- |
| EBITDA Ratio | 351.58% | 0.00% | 0.00% | 690.21% | -607.77% | 27.53% | 77.12% | 218.43% | -34.55% | 46.73% | 0.00% | 0.00% | 0.00% | 0.00% | 0.00% | 0.00% | 0.00% | 0.00% | 0.00% | 0.00% |
| Operating Income | $14.10M | $4.76M | $4.61M | $-16.13M | $-24.43M | $4.00M | $6.32M | $16.07M | $-1.62M | $11.03M | $5.03M | $4.92M | $5.02M | $5.07M | $5.10M | $5.12M | $5.08M | $5.15M | $5.17M | $5.39M |
| Operating Income Ratio | 351.58% | 85.50% | 85.23% | 690.21% | -607.77% | 58.89% | 77.12% | 218.43% | -21.98% | 160.62% | 85.66% | 85.01% | 85.25% | 85.02% | 85.39% | 85.16% | 85.03% | 84.23% | 85.56% | 85.28% |
| Total Other Income Expenses Net | $-2.78M | $-15.73M | $6.64M | $-1.31M | $-386.82K | $-321.58K | $-333.14K | $-358.83K | $-925.75K | $8.72M | $7.42M | $-6.16M | $-16.80M | $1.59M | $-1.42M | $3.98M | $-191.69K | $-8.60M | $557.01K | $1.62M |
| Income Before Tax | $11.33M | $-10.97M | $11.25M | $-17.44M | $-24.82M | $3.68M | $5.99M | $15.71M | $-2.54M | $1 | $12.45M | $-1.24M | $-5.89M | $6.66M | $3.68M | $9.10M | $4.88M | $-3.45M | $5.72M | $7.01M |
| Income Before Tax Ratio | 282.34% | -197.28% | 208.15% | 746.32% | -617.40% | 54.16% | 73.06% | 213.55% | -34.55% | 0.00% | 211.92% | -21.46% | -99.87% | 111.76% | 61.59% | 151.40% | 81.82% | -56.47% | 94.78% | 110.97% |
| Income Tax Expense | $- | $-15.73M | $6.64M | $-1 | $2.18M | $2.13M | $2.34M | $2.29M | $2.11M | $1 | $7.42M | $-6.16M | $-10.91M | $1.59M | $-1.42M | $3.98M | $-191.69K | $-8.60M | $557.01K | $1.62M |
| Net Income | $11.33M | $-10.97M | $11.25M | $-17.44M | $-24.82M | $3.68M | $5.99M | $15.71M | $-2.54M | $11.65M | $12.45M | $-1.24M | $-5.89M | $6.66M | $3.68M | $9.10M | $4.88M | $-3.45M | $5.72M | $7.01M |
| Net Income Ratio | 282.34% | -197.28% | 208.15% | 746.32% | -617.40% | 54.16% | 73.06% | 213.55% | -34.55% | 169.63% | 211.92% | -21.46% | -99.87% | 111.76% | 61.59% | 151.40% | 81.82% | -56.47% | 94.78% | 110.97% |
| EPS | $0.97 | $-0.94 | $0.96 | $-1.50 | $-2.13 | $0.32 | $0.51 | $1.35 | $-0.22 | $1.00 | $1.06 | $-0.11 | $-0.50 | $0.58 | $0.32 | $0.78 | $0.42 | $-0.30 | $0.48 | $0.60 |
| EPS Diluted | $0.97 | $-0.94 | $0.96 | $-1.50 | $-2.13 | $0.32 | $0.51 | $1.35 | $-0.22 | $1.00 | $1.06 | $-0.11 | $-0.50 | $0.58 | $0.32 | $0.78 | $0.42 | $-0.30 | $0.48 | $0.60 |
| Weighted Average Shares Outstanding | 11.65M | 23.29M | 23.29M | 11.65M | 11.65M | 11.65M | 11.65M | 11.65M | 11.65M | 11.65M | 11.65M | 11.65M | 11.65M | 11.65M | 11.65M | 11.65M | 11.65M | 11.65M | 11.74M | 11.74M |
| Weighted Average Shares Outstanding Diluted | 11.65M | 23.29M | 23.29M | 11.65M | 11.65M | 11.65M | 11.65M | 11.65M | 11.65M | 11.65M | 11.65M | 11.65M | 11.65M | 11.65M | 11.65M | 11.65M | 11.65M | 11.65M | 11.74M | 11.74M |
| SEC Filing | Source | Source | Source | Source | Source | Source | Source | Source | Source | Source | Source | Source | Source | Source | Source | Source | Source | Source | Source | Source |
Annual Balance Sheet
| Breakdown | October 31, 2024 | October 31, 2023 | October 31, 2022 | October 31, 2021 | October 31, 2020 |
|---|---|---|---|---|---|
| Cash and Cash Equivalents | $17.48K | $36.56K | $18.48K | $519.32K | $9.86K |
| Short Term Investments | $- | $- | $2.56M | $14.81M | $2.70M |
| Cash and Short Term Investments | $17.48K | $36.56K | $18.48K | $519.32K | $9.86K |
| Net Receivables | $3.34M | $9.93M | $20.22M | $2.25M | $2.54M |
| Inventory | $- | $- | $22.81M | $17.58M | $1 |
| Other Current Assets | $7.37M | $7.46M | $2.56M | $14.81M | $2.70M |
| Total Current Assets | $10.72M | $16.95M | $20.24M | $2.77M | $2.55M |
| Property Plant Equipment Net | $- | $- | $- | $- | $- |
| Goodwill | $- | $- | $- | $- | $- |
| Intangible Assets | $- | $- | $- | $- | $- |
| Goodwill and Intangible Assets | $- | $- | $- | $- | $- |
| Long Term Investments | $230.61M | $220.93M | $221.27M | $286.87M | $275.68M |
| Tax Assets | $- | $- | $- | $- | $- |
| Other Non-Current Assets | $-230.61M | $- | $-221.27M | $-286.87M | $-275.68M |
| Total Non-Current Assets | $338.44M | $220.93M | $221.27M | $286.87M | $275.68M |
| Other Assets | $-115.18M | $-6.97M | $21.35K | $18.26K | $22.36K |
| Total Assets | $233.99M | $230.91M | $241.53M | $289.65M | $278.26M |
| Account Payables | $1.46M | $11.39M | $17.93M | $13.03M | $1.06M |
| Short Term Debt | $- | $91.30M | $91.30M | $91.30M | $91.30M |
| Tax Payables | $- | $- | $- | $- | $- |
| Deferred Revenue | $- | $- | $-73.37M | $-78.27M | $-90.24M |
| Other Current Liabilities | $-1.46M | $-102.69M | $-109.23M | $-104.33M | $-92.36M |
| Total Current Liabilities | $- | $102.69M | $17.93M | $13.03M | $1.06M |
| Long Term Debt | $- | $- | $- | $- | $- |
| Deferred Revenue Non-Current | $- | $- | $- | $- | $- |
| Deferred Tax Liabilities Non-Current | $- | $- | $- | $- | $- |
| Other Non-Current Liabilities | $- | $- | $- | $- | $- |
| Total Non-Current Liabilities | $- | $- | $17.93M | $13.19M | $91.30M |
| Other Liabilities | $92.87M | $103.27M | $73.48M | $-13.19M | $123.21K |
| Total Liabilities | $92.87M | $103.27M | $109.34M | $13.03M | $92.48M |
| Preferred Stock | $- | $- | $- | $- | $- |
| Common Stock | $175.07M | $175.07M | $175.07M | $175.07M | $175.07M |
| Retained Earnings | $-33.96M | $-47.44M | $-42.88M | $10.09M | $10.71M |
| Accumulated Other Comprehensive Income Loss | $- | $0 | $0 | $-0 | $0 |
| Other Total Stockholders Equity | $- | $- | $-0 | $- | $- |
| Total Stockholders Equity | $141.11M | $127.63M | $132.19M | $185.16M | $185.77M |
| Total Equity | $141.11M | $127.63M | $132.19M | $185.16M | $185.77M |
| Total Liabilities and Stockholders Equity | $233.99M | $230.91M | $241.53M | $289.65M | $278.26M |
| Minority Interest | $- | $- | $- | $- | $- |
| Total Liabilities and Total Equity | $233.99M | $230.91M | $241.53M | $289.65M | $278.26M |
| Total Investments | $230.61M | $220.93M | $221.27M | $286.87M | $275.68M |
| Total Debt | $- | $91.30M | $91.30M | $91.30M | $91.30M |
| Net Debt | $-17.48K | $91.26M | $91.28M | $90.78M | $91.29M |
Balance Sheet Charts
| Breakdown | October 31, 2024 | April 30, 2024 | October 31, 2023 | April 30, 2023 | October 31, 2022 | April 30, 2022 | October 31, 2021 | April 30, 2021 | October 31, 2020 | April 30, 2020 | October 31, 2019 | April 30, 2019 | October 31, 2018 | April 30, 2018 | October 31, 2017 | April 30, 2017 | October 31, 2016 | April 30, 2016 | October 31, 2015 | April 30, 2015 |
|---|---|---|---|---|---|---|---|---|---|---|---|---|---|---|---|---|---|---|---|---|
| Cash and Cash Equivalents | $17.48K | $84.23K | $36.56K | $148.96K | $18.48K | $5.04K | $519.32K | $- | $9.86K | $958 | $782 | $91.64K | $93.63K | $8.55K | $78.31K | $5.81K | $2.39K | $30.45K | $33.05K | $53.84K |
| Short Term Investments | $- | $5.12M | $6.98M | $5.11M | $2.56M | $7.93M | $14.81M | $12.62M | $2.70M | $2.90M | $3.62M | $- | $- | $- | $- | $- | $- | $- | $- | $- |
| Cash and Short Term Investments | $17.48K | $5.21M | $36.56K | $148.96K | $18.48K | $5.04K | $519.32K | $12.62M | $9.86K | $958 | $782 | $91.64K | $93.63K | $8.55K | $78.31K | $5.81K | $2.39K | $30.45K | $33.05K | $53.84K |
| Net Receivables | $3.34M | $2.84M | $9.93M | $6.85M | $20.22M | $2.22M | $2.25M | $3.01M | $2.54M | $2.48M | $4.49M | $2.35M | $2.45M | $5.23M | $18.35M | $2.60M | $2.84M | $4.53M | $5.32M | $3.57M |
| Inventory | $- | $- | $16.95M | $12.11M | $22.81M | $1 | $17.58M | $- | $1 | $5.39M | $8.12M | $-0 | $- | $1 | $1 | $- | $1 | $- | $1 | $- |
| Other Current Assets | $-3.34M | $-8.04M | $7.46M | $- | $2.56M | $7.93M | $14.81M | $12.62M | $2.70M | $2.88M | $625.00K | $- | $- | $453.90K | $23.53K | $638.23K | $622.35K | $303.90K | $1.10M | $3.43M |
| Total Current Assets | $17.48K | $8.07M | $9.96M | $7.00M | $20.24M | $2.22M | $2.77M | $3.01M | $2.55M | $2.48M | $4.49M | $2.44M | $2.54M | $5.27M | $18.45M | $3.24M | $3.46M | $4.86M | $6.45M | $7.05M |
| Property Plant Equipment Net | $- | $- | $- | $- | $- | $- | $- | $- | $- | $- | $- | $- | $- | $- | $- | $- | $- | $- | $- | $- |
| Goodwill | $- | $- | $- | $- | $- | $- | $- | $- | $- | $- | $- | $- | $- | $- | $- | $- | $- | $- | $- | $- |
| Intangible Assets | $- | $- | $- | $- | $- | $- | $- | $- | $- | $- | $- | $- | $- | $- | $- | $- | $- | $- | $- | $- |
| Goodwill and Intangible Assets | $- | $- | $- | $- | $- | $- | $- | $- | $- | $- | $- | $- | $- | $- | $- | $- | $- | $- | $- | $- |
| Long Term Investments | $230.61M | $220.29M | $220.93M | $234.51M | $221.27M | $249.06M | $286.87M | $284.44M | $275.68M | $265.22M | $274.32M | $263.33M | $255.13M | $262.64M | $169.78M | $155.81M | $163.99M | $155.24M | $104.71M | $90.66M |
| Tax Assets | $- | $- | $- | $- | $- | $- | $- | $- | $- | $- | $- | $- | $- | $- | $- | $- | $- | $- | $- | $- |
| Other Non-Current Assets | $-230.61M | $-220.29M | $-220.93M | $-234.51M | $-221.27M | $-249.06M | $-286.87M | $-284.44M | $-275.68M | $-265.22M | $-274.32M | $-263.33M | $-255.13M | $-262.64M | $103.15M | $112.02M | $105.02M | $109.96M | $158.14M | $181.75M |
| Total Non-Current Assets | $233.97M | $220.29M | $220.93M | $234.51M | $221.27M | $249.06M | $286.87M | $284.44M | $275.68M | $265.22M | $274.32M | $263.33M | $255.13M | $262.64M | $272.92M | $267.83M | $269.01M | $265.20M | $262.85M | $272.41M |
| Other Assets | $233.99M | $228.36M | $14.93K | $27.89K | $21.35K | $29.16K | $18.26K | $26.57K | $22.36K | $26.56K | $14.97K | $30.21K | $18.64K | $- | $- | $- | $- | $- | $- | $- |
| Total Assets | $233.99M | $228.36M | $230.91M | $241.53M | $241.53M | $251.31M | $289.65M | $287.48M | $278.26M | $267.73M | $278.83M | $265.80M | $257.69M | $267.91M | $291.37M | $271.08M | $272.47M | $270.07M | $269.31M | $279.46M |
| Account Payables | $1.46M | $783.83K | $11.87M | $9.40M | $17.93M | $6.89M | $13.03M | $10.09M | $1.06M | $1.73M | $6.05M | $504.89K | $657.43K | $5.58M | $18.45M | $235.02K | $427.12K | $1.98M | $1.00M | $1.23M |
| Short Term Debt | $- | $91.30M | $91.30M | $91.30M | $91.30M | $91.30M | $91.30M | $91.30M | $91.30M | $91.30M | $91.30M | $91.30M | $91.30M | $91.30M | $91.30M | $91.36M | $91.39M | $91.39M | $91.52M | $91.30M |
| Tax Payables | $- | $- | $- | $- | $- | $- | $- | $- | $- | $- | $- | $- | $- | $- | $- | $- | $- | $- | $- | $- |
| Deferred Revenue | $- | $- | $-79.43M | $-81.90M | $-73.37M | $-84.41M | $-78.27M | $-81.21M | $-90.24M | $-89.57M | $-85.25M | $-90.80M | $-90.64M | $-85.72M | $- | $- | $- | $1 | $- | $- |
| Other Current Liabilities | $-1.46M | $-92.08M | $-103.17M | $-100.70M | $-109.23M | $-98.19M | $-104.33M | $-101.39M | $-92.36M | $-93.03M | $-97.35M | $-91.80M | $-91.96M | $-96.88M | $148.72K | $133.82K | $103.45K | $82.90K | $75.44K | $67.40K |
| Total Current Liabilities | $- | $788.90K | $11.87M | $9.40M | $17.93M | $6.89M | $13.03M | $10.09M | $1.06M | $1.73M | $6.05M | $504.89K | $657.43K | $5.58M | $109.90M | $91.73M | $91.92M | $93.46M | $92.60M | $92.59M |
| Long Term Debt | $- | $- | $- | $- | $- | $- | $- | $- | $- | $- | $- | $- | $- | $- | $- | $- | $- | $151.55K | $220.24K | $515.14K |
| Deferred Revenue Non-Current | $- | $- | $- | $- | $- | $- | $- | $- | $- | $- | $- | $- | $- | $- | $- | $- | $- | $- | $- | $- |
| Deferred Tax Liabilities Non-Current | $- | $- | $- | $- | $- | $- | $- | $- | $- | $- | $- | $- | $- | $- | $- | $- | $- | $- | $- | $- |
| Other Non-Current Liabilities | $- | $861.55K | $- | $- | $- | $- | $- | $- | $- | $- | $- | $- | $- | $- | $- | $- | $- | $69.86K | $102.84K | $80.40K |
| Total Non-Current Liabilities | $- | $861.55K | $11.97M | $9.46M | $17.93M | $6.89M | $13.19M | $91.30M | $91.30M | $91.30M | $91.30M | $91.30M | $91.30M | $91.30M | $- | $- | $- | $221.41K | $323.08K | $595.54K |
| Other Liabilities | $92.87M | $90.51M | $-11.97M | $-9.46M | $73.48M | $84.53M | $-13.19M | $108.27K | $123.21K | $81.27K | $124.06K | $108.93K | $99.63K | $106.40K | $- | $- | $- | $- | $- | $- |
| Total Liabilities | $92.87M | $92.16M | $11.87M | $9.40M | $109.34M | $98.31M | $13.03M | $101.50M | $92.48M | $93.11M | $97.47M | $91.91M | $92.06M | $96.99M | $109.90M | $91.73M | $91.92M | $93.68M | $92.92M | $93.19M |
| Preferred Stock | $- | $- | $- | $- | $- | $- | $- | $- | $- | $- | $- | $- | $- | $- | $- | $- | $- | $- | $- | $- |
| Common Stock | $175.07M | $175.07M | $175.07M | $175.07M | $175.07M | $175.07M | $175.07M | $175.07M | $175.07M | $175.07M | $175.07M | $175.07M | $175.07M | $175.50M | $175.50M | $182.29M | $182.29M | $183.66M | $183.66M | $185.63M |
| Retained Earnings | $-33.96M | $-38.87M | $-47.44M | $-34.30M | $-42.88M | $-22.07M | $10.09M | $10.91M | $10.71M | $-448.73K | $6.29M | $-1.19M | $-9.43M | $471.44K | $5.87M | $-3.00M | $-1.83M | $-7.27M | $-7.27M | $638.31K |
| Accumulated Other Comprehensive Income Loss | $- | $- | $0 | $0 | $0 | $-0 | $-0 | $0 | $0 | $0 | $0 | $0 | $0 | $- | $0 | $0 | $0 | $0 | $0 | $-0 |
| Other Total Stockholders Equity | $- | $- | $- | $-0 | $-0 | $- | $- | $- | $- | $- | $- | $-0 | $- | $-5.05M | $- | $- | $- | $-0 | $-0 | $- |
| Total Stockholders Equity | $141.11M | $136.20M | $127.63M | $140.77M | $132.19M | $153.00M | $185.16M | $185.98M | $185.77M | $174.62M | $181.35M | $173.88M | $165.63M | $170.92M | $181.37M | $179.29M | $180.46M | $176.39M | $176.39M | $186.27M |
| Total Equity | $141.11M | $136.20M | $127.63M | $140.77M | $132.19M | $153.00M | $185.16M | $185.98M | $185.77M | $174.62M | $181.35M | $173.88M | $165.63M | $170.92M | $181.37M | $179.29M | $180.46M | $176.39M | $176.39M | $186.27M |
| Total Liabilities and Stockholders Equity | $233.99M | $228.36M | $230.91M | $241.53M | $241.53M | $251.31M | $289.65M | $287.48M | $278.26M | $267.73M | $278.83M | $265.80M | $257.69M | $267.91M | $291.27M | $271.03M | $272.38M | $270.07M | $269.31M | $279.46M |
| Minority Interest | $- | $- | $- | $- | $- | $- | $- | $- | $- | $- | $- | $- | $- | $- | $- | $- | $- | $- | $- | $- |
| Total Liabilities and Total Equity | $233.99M | $228.36M | $230.91M | $241.53M | $241.53M | $251.31M | $289.65M | $287.48M | $278.26M | $267.73M | $278.83M | $265.80M | $257.69M | $267.91M | $291.27M | $271.03M | $272.38M | $270.07M | $269.31M | $279.46M |
| Total Investments | $230.61M | $225.41M | $220.93M | $234.51M | $221.27M | $249.06M | $286.87M | $284.44M | $275.68M | $265.22M | $274.32M | $263.33M | $255.13M | $262.64M | $169.78M | $155.81M | $163.99M | $155.24M | $104.71M | $90.66M |
| Total Debt | $- | $91.30M | $91.30M | $91.30M | $91.30M | $91.30M | $91.30M | $91.30M | $91.30M | $91.30M | $91.30M | $91.30M | $91.30M | $91.30M | $91.30M | $91.36M | $91.39M | $91.54M | $91.74M | $91.82M |
| Net Debt | $-17.48K | $91.22M | $91.26M | $91.15M | $91.28M | $91.29M | $90.78M | $91.30M | $91.29M | $91.30M | $91.30M | $91.21M | $91.21M | $91.29M | $91.22M | $91.36M | $91.39M | $91.51M | $91.71M | $91.76M |
Annual Cash Flow
| Breakdown | October 31, 2024 | October 31, 2023 | October 31, 2022 | October 31, 2021 | October 31, 2020 |
|---|---|---|---|---|---|
| Net Income | $18.91M | $273.29K | $-42.26M | $9.67M | $13.16M |
| Depreciation and Amortization | $- | $- | $- | $- | $- |
| Deferred Income Tax | $- | $- | $- | $- | $- |
| Stock Based Compensation | $- | $- | $- | $- | $- |
| Change in Working Capital | $-3.81M | $4.23M | $-13.12M | $12.30M | $-3.05M |
| Accounts Receivables | $6.59M | $10.30M | $-17.97M | $293.23K | $1.95M |
| Inventory | $- | $- | $- | $- | $- |
| Accounts Payables | $- | $-6.22M | $4.63M | $11.98M | $-4.86M |
| Other Working Capital | $-10.40M | $151.61K | $220.69K | $30.34K | $-135.30K |
| Other Non Cash Items | $-9.69M | $339.22K | $65.60M | $-11.18M | $-1.36M |
| Net Cash Provided by Operating Activities | $5.41M | $4.84M | $10.22M | $10.79M | $8.75M |
| Investments in Property Plant and Equipment | $- | $- | $- | $- | $- |
| Acquisitions Net | $- | $- | $- | $- | $- |
| Purchases of Investments | $- | $-333.54M | $-254.20M | $-174.67M | $-177.73M |
| Sales Maturities of Investments | $- | $- | $248.44M | $164.18M | $177.01M |
| Other Investing Activities | $- | $- | $- | $20.98M | $1.44M |
| Net Cash Used for Investing Activities | $- | $- | $-5.76M | $10.49M | $718.73K |
| Debt Repayment | $- | $- | $- | $- | $- |
| Common Stock Issued | $- | $- | $- | $- | $- |
| Common Stock Repurchased | $- | $- | $- | $- | $- |
| Dividends Paid | $-5.43M | $-4.83M | $-10.72M | $-10.28M | $-8.74M |
| Other Financing Activities | $- | $- | $- | $- | $- |
| Net Cash Used Provided by Financing Activities | $-5.43M | $-4.83M | $-10.72M | $-10.28M | $-8.74M |
| Effect of Forex Changes on Cash | $- | $- | $5.76M | $-10.49M | $-718.73K |
| Net Change in Cash | $-19.09K | $18.08K | $-500.84K | $509.46K | $9.08K |
| Cash at End of Period | $17.48K | $36.56K | $18.48K | $519.32K | $9.86K |
| Cash at Beginning of Period | $36.56K | $18.48K | $519.32K | $9.86K | $782 |
| Operating Cash Flow | $5.41M | $4.84M | $10.22M | $10.79M | $8.75M |
| Capital Expenditure | $- | $5 | $- | $- | $- |
| Free Cash Flow | $5.41M | $4.84M | $10.22M | $10.79M | $8.75M |
Cash Flow Charts
| Breakdown | April 30, 2024 | October 31, 2023 | April 30, 2023 | October 31, 2022 | April 30, 2022 | October 31, 2021 | April 30, 2021 | October 31, 2020 | April 30, 2020 | October 31, 2019 | April 30, 2019 | October 31, 2018 | April 30, 2018 | October 31, 2017 | April 30, 2017 | October 31, 2016 | April 30, 2016 | October 31, 2015 | April 30, 2015 | October 31, 2014 |
|---|---|---|---|---|---|---|---|---|---|---|---|---|---|---|---|---|---|---|---|---|
| Net Income | $11.33M | $-10.97M | $11.25M | $-17.44M | $-24.82M | $3.68M | $5.99M | $15.71M | $-2.54M | $11.03M | $12.45M | $-1.24M | $-5.89M | $6.66M | $3.68M | $9.10M | $4.88M | $-3.45M | $5.72M | $7.01M |
| Depreciation and Amortization | $- | $- | $- | $- | $- | $- | $- | $- | $- | $- | $- | $- | $- | $- | $- | $- | $- | $- | $- | $- |
| Deferred Income Tax | $- | $- | $- | $- | $- | $- | $- | $- | $- | $- | $- | $- | $- | $- | $- | $- | $- | $- | $- | $- |
| Stock Based Compensation | $- | $- | $- | $- | $- | $- | $- | $- | $- | $- | $- | $- | $- | $- | $- | $- | $- | $- | $- | $- |
| Change in Working Capital | $-4.03M | $-553.77K | $4.79M | $-6.96M | $-6.16M | $3.76M | $8.54M | $-684.85K | $-2.36M | $3.43M | $110.02K | $2.83M | $13.16M | $-15.73M | $448.82K | $1.59M | $558.25K | $-1.78M | $-1.12M | $446.82K |
| Accounts Receivables | $7.09M | $-3.08M | $13.37M | $-18.01M | $34.06K | $755.79K | $-462.56K | $-61.15K | $2.01M | $-2.15M | $104.82K | $2.78M | $13.12M | $-15.75M | $236.23K | $1.69M | $793.73K | $-1.76M | $-1.03M | $453.78K |
| Inventory | $- | $- | $- | $- | $- | $- | $- | $- | $- | $- | $- | $- | $- | $- | $- | $- | $- | $- | $- | $- |
| Accounts Payables | $-11.07M | $2.42M | $-8.63M | $10.81M | $-6.18M | $2.95M | $9.04M | $-633.42K | $-4.23M | $5.58M | $- | $- | $- | $- | $- | $- | $- | $- | $- | $- |
| Other Working Capital | $-49.99K | $104.66K | $46.95K | $232.75K | $-12.06K | $61.49K | $-31.16K | $9.72K | $-145.02K | $-3.33K | $5.20K | $43.39K | $38.97K | $22.82K | $212.59K | $-99.90K | $-235.48K | $-25.00K | $-84.28K | $-6.96K |
| Other Non Cash Items | $-7.61M | $14.86M | $-13.71M | $22.97M | $40.12M | $-4.80M | $-17.03M | $-9.69M | $9.58M | $-9.63M | $-8.36M | $2.55M | $-2.78M | $13.72M | $720.84K | $-5.69M | $-561.72K | $11.64M | $861.06K | $-3.18M |
| Net Cash Provided by Operating Activities | $-312.10K | $2.68M | $7.06M | $-8.63M | $3.00M | $6.34M | $6.07M | $4.64M | $2.45M | $8.26M | $4.20M | $4.13M | $4.49M | $4.66M | $4.85M | $5.00M | $4.88M | $6.41M | $5.47M | $4.28M |
| Investments in Property Plant and Equipment | $-4 | $- | $- | $- | $- | $- | $- | $- | $- | $- | $- | $- | $- | $- | $- | $- | $- | $- | $- | $- |
| Acquisitions Net | $- | $- | $- | $- | $- | $- | $- | $- | $- | $- | $- | $- | $- | $- | $- | $- | $- | $- | $- | $- |
| Purchases of Investments | $-97.85M | $-146.83M | $-186.71M | $-172.23M | $-81.97M | $-103.52M | $-71.14M | $-71.40M | $-106.33M | $-65.70M | $- | $- | $- | $- | $- | $- | $- | $- | $- | $- |
| Sales Maturities of Investments | $99.11M | $148.07M | $183.89M | $169.52M | $78.92M | $83.41M | $80.77M | $69.69M | $107.32M | $68.31M | $- | $- | $- | $- | $- | $- | $- | $- | $- | $- |
| Other Investing Activities | $4 | $- | $- | $- | $- | $- | $- | $- | $- | $- | $- | $- | $- | $- | $- | $- | $- | $- | $- | $- |
| Net Cash Used for Investing Activities | $1.26M | $1.25M | $-2.82M | $-2.71M | $-3.05M | $860.72K | $9.63M | $-268.87K | $987.60K | $-2.62M | $- | $- | $- | $- | $- | $- | $- | $- | $- | $- |
| Debt Repayment | $- | $- | $- | $- | $- | $- | $- | $- | $- | $- | $- | $- | $- | $- | $- | $- | $- | $- | $- | $- |
| Common Stock Issued | $- | $- | $- | $- | $- | $- | $- | $- | $- | $- | $- | $- | $- | $- | $- | $- | $- | $- | $- | $- |
| Common Stock Repurchased | $- | $- | $- | $- | $- | $- | $- | $- | $- | $- | $- | $- | $- | $- | $- | $- | $- | $-1.34M | $- | $- |
| Dividends Paid | $-2.76M | $-2.16M | $-2.66M | $-3.38M | $-7.34M | $-4.49M | $-5.79M | $-4.55M | $-4.19M | $-3.56M | $-4.20M | $-4.05M | $-4.56M | $-4.58M | $-4.85M | $-5.03M | $-4.88M | $-5.09M | $-5.41M | $-5.31M |
| Other Financing Activities | $- | $- | $- | $- | $3.67M | $-3.98K | $3.98K | $- | $- | $- | $- | $- | $-4.56M | $- | $- | $- | $- | $- | $- | $1.00M |
| Net Cash Used Provided by Financing Activities | $-2.76M | $-2.16M | $-2.66M | $-3.38M | $-7.34M | $-4.50M | $-5.78M | $-4.55M | $-4.19M | $-3.56M | $-4.20M | $-4.05M | $-4.56M | $-4.58M | $-4.85M | $-5.03M | $-4.88M | $-6.43M | $-5.41M | $-4.31M |
| Effect of Forex Changes on Cash | $- | $-1.87M | $-1.45M | $14.73M | $6.88M | $- | $- | $- | $- | $- | $- | $- | $- | $- | $- | $- | $- | $- | $- | $- |
| Net Change in Cash | $47.67K | $-112.39K | $130.47K | $13.44K | $-514.28K | $2.71M | $9.92M | $8.91K | $-749.46K | $2.09M | $-997 | $42.54K | $-34.88K | $36.25K | $1.71K | $-14.03K | $-1.30K | $-10.39K | $26.62K | $-17.96K |
| Cash at End of Period | $84.23K | $36.56K | $148.96K | $18.48K | $5.04K | $519.32K | $9.93M | $9.86K | $958 | $782 | $-997 | $42.54K | $-34.88K | $36.25K | $1.71K | $-14.03K | $-1.30K | $-10.39K | $26.62K | $-17.96K |
| Cash at Beginning of Period | $36.56K | $148.96K | $18.48K | $5.04K | $519.32K | $-2.19M | $9.86K | $958 | $750.41K | $-2.08M | $- | $- | $- | $- | $- | $- | $- | $- | $- | $- |
| Operating Cash Flow | $-312.10K | $2.68M | $7.06M | $-8.63M | $3.00M | $6.34M | $6.07M | $4.64M | $2.45M | $8.26M | $4.20M | $4.13M | $4.49M | $4.66M | $4.85M | $5.00M | $4.88M | $6.41M | $5.47M | $4.28M |
| Capital Expenditure | $-4 | $- | $- | $- | $- | $- | $- | $- | $- | $- | $- | $- | $- | $- | $- | $- | $- | $- | $- | $- |
| Free Cash Flow | $-312.10K | $2.68M | $7.06M | $-8.63M | $3.00M | $6.34M | $6.07M | $4.64M | $2.45M | $8.26M | $4.20M | $4.13M | $4.49M | $4.66M | $4.85M | $5.00M | $4.88M | $6.41M | $5.47M | $4.28M |
John Hancock Income Securities Trust Dividends
Explore John Hancock Income Securities Trust's dividend history, including dividend yield, payout ratio, and historical payments.
Dividend Yield
4.09%
Dividend Payout Ratio
28.72%
Dividend Paid & Capex Coverage Ratio
1.00x
John Hancock Income Securities Trust Dividend History
| Dividend | Adjusted Dividend | Date | Record Date | Payment Date | Declaration Date |
|---|---|---|---|---|---|
| $0.1318 | $0.1318 | March 13, 2025 | March 13, 2025 | March 31, 2025 | March 03, 2025 |
| $0.2017 | $0.2017 | December 12, 2024 | December 12, 2024 | December 31, 2024 | December 02, 2024 |
| $0.1132 | $0.1132 | September 13, 2024 | September 13, 2024 | September 30, 2024 | September 03, 2024 |
| $0.1159 | $0.1159 | June 13, 2024 | June 13, 2024 | June 28, 2024 | June 03, 2024 |
| $0.1095 | $0.1095 | March 08, 2024 | March 11, 2024 | March 28, 2024 | March 01, 2024 |
| $0.1277 | $0.1277 | December 08, 2023 | December 11, 2023 | December 29, 2023 | December 01, 2023 |
| $0.0868 | $0.0868 | September 08, 2023 | September 11, 2023 | September 29, 2023 | September 01, 2023 |
| $0.099 | $0.099 | June 09, 2023 | June 12, 2023 | June 30, 2023 | June 01, 2023 |
| $0.0909 | $0.0909 | March 10, 2023 | March 13, 2023 | March 31, 2023 | March 01, 2023 |
| $0.124 | $0.124 | December 29, 2022 | December 09, 2022 | ||
| $0.1377 | $0.1377 | December 09, 2022 | December 12, 2022 | December 30, 2022 | December 01, 2022 |
| $0.1216 | $0.1216 | September 09, 2022 | September 12, 2022 | September 30, 2022 | September 03, 2022 |
| $0.168 | $0.1682 | June 10, 2022 | June 13, 2022 | June 30, 2022 | June 01, 2022 |
| $0.178 | $0.178 | March 10, 2022 | March 11, 2022 | March 31, 2022 | March 01, 2022 |
| $0.452 | $0.4523 | December 10, 2021 | December 13, 2021 | December 31, 2021 | December 03, 2021 |
| $0.191 | $0.1914 | September 10, 2021 | September 13, 2021 | September 30, 2021 | September 01, 2021 |
| $0.2103 | $0.1945 | June 10, 2021 | June 11, 2021 | June 30, 2021 | June 02, 2021 |
| $0.1968 | $0.1968 | March 10, 2021 | March 11, 2021 | March 31, 2021 | March 01, 2021 |
| $0.3 | $0.3001 | December 10, 2020 | December 11, 2020 | December 31, 2020 | December 01, 2020 |
| $0.186 | $0.1859 | September 10, 2020 | September 11, 2020 | September 30, 2020 | September 01, 2020 |
John Hancock Income Securities Trust News
Read the latest news about John Hancock Income Securities Trust, including recent articles, headlines, and updates.
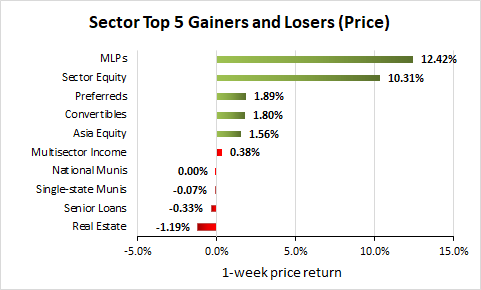
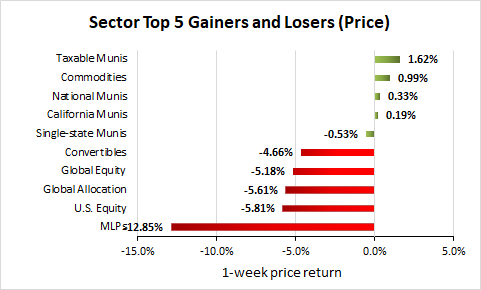
CEF Weekly Review: Will BTT Terminate?
We review the CEF market valuation and performance through the first week of March and highlight recent market action. Nearly all CEF sectors were down due to poor risk sentiment, but year-to-date performance remains mostly positive, led by EM assets. BlackRock Municipal 2030 Target Term renewed its share repurchase program.

JOHN HANCOCK CLOSED-END FUNDS ANNOUNCE RENEWAL OF SHARE REPURCHASE PLANS
BOSTON , Dec. 12, 2024 /PRNewswire/ - John Hancock Financial Opportunities Fund (NYSE: BTO), John Hancock Hedged Equity & Income Fund (NYSE: HEQ), John Hancock Income Securities Trust (NYSE: JHS), John Hancock Investors Trust (NYSE: JHI), John Hancock Premium Dividend Fund (NYSE: PDT), and John Hancock Tax-Advantaged Dividend Income Fund (NYSE: HTD) (each a "Fund" and collectively, the "Funds") announced today that the Board of Trustees has renewed the Funds' share repurchase plans. The Board of Trustees approved the renewal of the share repurchase plans as part of its ongoing evaluation of options to enhance shareholder value and potentially decrease the discount between the market price and the net asset value per share ("NAV") of the Funds' common shares.

JOHN HANCOCK CLOSED-END FUNDS DECLARE QUARTERLY DISTRIBUTIONS
BOSTON , Dec. 2, 2024 /PRNewswire/ - The John Hancock closed-end funds listed below declared their quarterly distributions today as follows: Declaration Date: December 2, 2024 Ex Date: December 12, 2024 Record Date: December 12, 2024 Payment Date: December 31, 2024 Ticker Fund Name Distribution Per Share Change FromPrevious Distribution Market Price as of 11/29/2024 Annualized Current Distribution Rate at Market HEQ Hedged Equity & Income $0.2500 - $11.11 9.00 % JHS Income Securities Trust $0.2017 0.0885 $11.49 7.02 % JHI Investors Trust $0.3455 0.0321 $14.22 9.72 % BTO Financial Opportunities Fund $0.6500 - $39.40 6.60 % John Hancock Hedged Equity & Income Fund Hedged Equity & Income Fund (the "Fund") declared its quarterly distribution pursuant to the Fund's managed distribution plan (the "HEQ Plan"). Under the HEQ Plan, the Fund makes quarterly distributions in a fixed amount of $0.2500 per share, which will be paid quarterly until further notice.


JOHN HANCOCK CLOSED-END FUNDS RELEASE EARNINGS DATA
BOSTON , Feb. 12, 2024 /PRNewswire/ - The John Hancock Closed-End Funds listed in the table below announced earnings1 for the three months ended January 31, 2024. The same data for the comparable three-month period ended January 31, 2023 is also available below.

JOHN HANCOCK CLOSED-END FUNDS ANNOUNCE ANNUAL SHAREHOLDER MEETING AND RECORD DATES
BOSTON , Sept. 28, 2023 /PRNewswire/ - The ten John Hancock closed-end funds listed below announced today that each fund's Annual Meeting of Shareholders ("Annual Meeting") will be held on February 20, 2024, at 2:00 p.m.


The Jacksonville Humane Society and partners help pets find
JACKSONVILLE, Fal — Each year, more than five million pets enter animal shelters in need of loving homes. In partnership with PetSmart Charities, Jacksonville Humane Society (JHS) and Animal Care and Protective Services (ACPS) will bring adoptable pets to two Jacksonville PetSmart locations in… Read Full Article Here Source link The Jacksonville Humane Society and partners help pets find...

John Hancock Closed-end Funds Announce Renewal of Share Repurchase Plans
BOSTON, MA, Jan. 20, 2021 /PRNewswire/ - John Hancock Financial Opportunities Fund (NYSE: BTO), John Hancock Hedged Equity & Income Fund (NYSE: HEQ), John Hancock Income Securities Trust (NYSE: JHS), John Hancock Investors Trust (NYSE: JHI), John Hancock Premium Dividend Fund (NYSE: PDT),...


MML Investors Services LLC Sells 26,606 Shares of John Hancock Patriot Premium Div Fund II (NYSE:PDT)
MML Investors Services LLC reduced its position in John Hancock Patriot Premium Div Fund II (NYSE:PDT) by 53.0% in the first quarter, according to its most recent disclosure with the Securities and Exchange Commission (SEC). The fund owned 23,564 shares of the real estate investment trust’s stock after selling 26,606 shares during the quarter. MML […]

Bank of America Corp DE Sells 3,084 Shares of John Hancock Income Securities Trust (NYSE:JHS)
Bank of America Corp DE trimmed its stake in John Hancock Income Securities Trust (NYSE:JHS) by 11.6% during the fourth quarter, according to its most recent 13F filing with the SEC. The institutional investor owned 23,500 shares of the financial services provider’s stock after selling 3,084 shares during the period. Bank of America Corp DE […]


Similar Companies
Virtus Convertible & Income 2024 Target Term Fund
CBH
Price: $9.19
Market Cap: $167.75M
Eaton Vance National Municipal Opportunities Trust
EOT
Price: $16.65
Market Cap: $260.15M
BlackRock MuniHoldings New York Quality Fund, Inc.
MHN
Price: $9.83
Market Cap: $297.27M
Nuveen California Select Tax-Free Income Portfolio
NXC
Price: $12.75
Market Cap: $81.12M
Related Metrics
Explore detailed financial metrics and analysis for JHS.