Karora Resources Key Executives
This section highlights Karora Resources's key executives, including their titles and compensation details.
Find Contacts at Karora Resources
(Showing 0 of )
Karora Resources Earnings
This section highlights Karora Resources's earnings, including key dates, EPS, earnings reports, and earnings call transcripts.
Next Earnings Date
Last Earnings Results
Earnings Call Transcripts
| Transcript | Quarter | Year | Date | Estimated EPS | Actual EPS |
|---|---|---|---|---|---|
| Read Transcript | Q1 | 2024 | 2024-05-13 | N/A | N/A |
| Read Transcript | Q4 | 2023 | 2024-03-22 | N/A | N/A |
| Read Transcript | Q3 | 2023 | 2023-11-10 | N/A | N/A |
| Read Transcript | Q2 | 2023 | 2023-08-14 | N/A | N/A |
| Read Transcript | Q1 | 2023 | 2023-05-15 | N/A | N/A |

Karora Resources Inc. operates as a multi-operational mineral resource company in Australia. The company explores for gold and nickel deposits. It holds 100% interests in the Beta Hunt Gold Mine; the Higginsville Gold Operations; and Spargos Reward Gold Project located in Western Australia. The company was formerly known as Royal Nickel Corporation and changed its name to Karora Resources Inc. in June 2020. Karora Resources Inc. was incorporated in 2006 and is headquartered in West Perth, Australia.
$4.83
Stock Price
$862.91M
Market Cap
-
Employees
West Perth, WA
Location
Financial Statements
Access annual & quarterly financial statements for Karora Resources, including income statements, balance sheets, and cash flow statements..
Annual Income Statement
| Breakdown | December 31, 2023 | December 31, 2022 | December 31, 2021 | December 31, 2020 | December 31, 2019 |
|---|---|---|---|---|---|
| Revenue | $416.32M | $317.04M | $264.19M | $239.14M | $128.04M |
| Cost of Revenue | $297.73M | $253.10M | $167.56M | $149.42M | $98.15M |
| Gross Profit | $118.59M | $63.94M | $96.62M | $89.72M | $29.88M |
| Gross Profit Ratio | 28.50% | 20.17% | 36.60% | 37.52% | 23.34% |
| Research and Development Expenses | $809.00K | $862.00K | $310.00K | $- | $98.00K |
| General and Administrative Expenses | $43.99M | $36.84M | $30.47M | $26.78M | $14.25M |
| Selling and Marketing Expenses | $24.82M | $862.00K | $310.00K | $- | $98.00K |
| Selling General and Administrative Expenses | $68.82M | $36.84M | $30.47M | $26.78M | $14.25M |
| Other Expenses | $-1.33M | $-772.00K | $-223.00K | $524.00K | $893.00K |
| Operating Expenses | $70.15M | $36.84M | $30.47M | $26.78M | $15.14M |
| Cost and Expenses | $367.88M | $289.94M | $198.03M | $176.20M | $113.29M |
| Interest Income | $976.00K | $546.00K | $134.00K | $175.00K | $- |
| Interest Expense | $7.59M | $5.29M | $4.16M | $4.79M | $2.37M |
| Depreciation and Amortization | $69.63M | $56.59M | $29.59M | $23.97M | $9.51M |
| EBITDA | $118.08M | $80.31M | $95.41M | $87.18M | $21.55M |
| EBITDA Ratio | 28.36% | 25.82% | 36.27% | 36.46% | 18.37% |
| Operating Income | $48.44M | $27.10M | $66.16M | $63.21M | $12.86M |
| Operating Income Ratio | 11.64% | 8.55% | 25.04% | 26.43% | 10.05% |
| Total Other Income Expenses Net | $-28.32M | $-9.45M | $-20.09M | $31.93M | $-20.58M |
| Income Before Tax | $20.12M | $16.65M | $46.06M | $95.13M | $-7.72M |
| Income Before Tax Ratio | 4.83% | 5.25% | 17.44% | 39.78% | -6.03% |
| Income Tax Expense | $11.20M | $6.75M | $18.60M | $7.00M | $-774.00K |
| Net Income | $8.92M | $9.90M | $27.47M | $88.13M | $-6.94M |
| Net Income Ratio | 2.14% | 3.12% | 10.40% | 36.85% | -5.42% |
| EPS | $0.05 | $0.06 | $0.18 | $0.63 | $-0.06 |
| EPS Diluted | $0.05 | $0.06 | $0.18 | $0.61 | $-0.06 |
| Weighted Average Shares Outstanding | 175.80M | 164.44M | 148.70M | 139.76M | 119.24M |
| Weighted Average Shares Outstanding Diluted | 179.44M | 167.98M | 153.70M | 143.38M | 119.24M |
| SEC Filing | Source | Source | Source | Source | Source |
| Breakdown | March 31, 2024 | December 31, 2023 | September 30, 2023 | June 30, 2023 | March 31, 2023 | December 31, 2022 | September 30, 2022 | June 30, 2022 | March 31, 2022 | December 31, 2021 | September 30, 2021 | June 30, 2021 | March 31, 2021 | December 31, 2020 | September 30, 2020 | June 30, 2020 | March 31, 2020 | December 31, 2019 | September 30, 2019 | June 30, 2019 |
|---|---|---|---|---|---|---|---|---|---|---|---|---|---|---|---|---|---|---|---|---|
| Revenue | $115.54M | $101.78M | $107.14M | $110.59M | $96.81M | $96.83M | $81.33M | $73.61M | $65.27M | $66.97M | $68.36M | $69.57M | $59.28M | $69.35M | $59.41M | $56.10M | $54.28M | $56.83M | $43.09M | $17.25M |
| Cost of Revenue | $79.76M | $81.95M | $75.33M | $78.73M | $78.53M | $77.78M | $62.53M | $57.97M | $54.82M | $44.03M | $41.55M | $41.64M | $40.34M | $41.19M | $36.20M | $36.36M | $35.68M | $37.54M | $32.04M | $18.68M |
| Gross Profit | $35.78M | $19.83M | $31.81M | $31.86M | $18.27M | $19.05M | $18.80M | $15.64M | $10.45M | $22.94M | $26.81M | $27.93M | $18.95M | $28.16M | $23.21M | $19.74M | $18.61M | $19.29M | $11.05M | $-1.43M |
| Gross Profit Ratio | 31.00% | 19.50% | 29.70% | 28.80% | 18.90% | 19.70% | 23.10% | 21.20% | 16.00% | 34.30% | 39.20% | 40.10% | 32.00% | 40.61% | 39.07% | 35.19% | 34.27% | 33.94% | 25.65% | -8.29% |
| Research and Development Expenses | $724.00K | $55.00K | $144.00K | $234.00K | $- | $- | $204.00K | $- | $- | $- | $- | $- | $- | $- | $- | $- | $- | $- | $- | $- |
| General and Administrative Expenses | $9.49M | $12.27M | $12.38M | $10.29M | $9.70M | $12.52M | $7.48M | $4.07M | $12.77M | $9.71M | $6.13M | $8.47M | $6.16M | $6.84M | $10.09M | $6.85M | $3.00M | $6.54M | $1.55M | $3.46M |
| Selling and Marketing Expenses | $7.54M | $6.26M | $144.00K | $234.00K | $376.00K | $- | $204.00K | $178.00K | $- | $- | $- | $- | $- | $- | $- | $- | $- | $60.00K | $- | $22.00K |
| Selling General and Administrative Expenses | $17.79M | $18.53M | $12.52M | $10.29M | $9.70M | $12.52M | $7.48M | $4.07M | $12.77M | $9.71M | $6.13M | $8.47M | $6.16M | $6.84M | $10.09M | $6.85M | $3.00M | $6.54M | $1.55M | $3.46M |
| Other Expenses | $-10.00K | $-87.00K | $-2.00K | $27.00K | $-54.00K | $-573.00K | $29.00K | $-249.00K | $21.00K | $-100.00K | $-108.00K | $- | $-15.00K | $130.00K | $147.00K | $-12.00K | $247.00K | $- | $-137.00K | $-377.00K |
| Operating Expenses | $17.79M | $18.61M | $12.83M | $10.29M | $9.70M | $12.52M | $7.48M | $4.07M | $12.77M | $9.71M | $6.13M | $8.47M | $6.22M | $6.84M | $10.09M | $6.85M | $3.00M | $6.83M | $1.79M | $3.62M |
| Cost and Expenses | $97.55M | $100.56M | $88.16M | $89.03M | $88.23M | $90.31M | $70.01M | $62.04M | $67.59M | $53.74M | $47.68M | $50.12M | $46.55M | $48.03M | $46.28M | $43.21M | $38.68M | $44.38M | $33.83M | $22.30M |
| Interest Income | $568.00K | $432.00K | $187.00K | $145.00K | $212.00K | $207.00K | $210.00K | $84.00K | $45.00K | $34.00K | $31.00K | $33.00K | $36.00K | $43.00K | $31.00K | $28.00K | $73.00K | $- | $- | $10.00K |
| Interest Expense | $1.56M | $2.16M | $2.00M | $1.81M | $1.61M | $1.59M | $1.45M | $1.15M | $1.09M | $905.00K | $1.14M | $998.00K | $1.06M | $1.64M | $1.30M | $797.00K | $1.05M | $667.00K | $965.00K | $637.00K |
| Depreciation and Amortization | $19.39M | $20.34M | $14.25M | $16.34M | $18.71M | $18.54M | $15.27M | $13.89M | $8.88M | $7.96M | $6.48M | $7.81M | $7.34M | $9.93M | $4.58M | $5.33M | $4.13M | $5.82M | $3.17M | $1.47M |
| EBITDA | $37.27M | $21.56M | $31.93M | $37.33M | $26.77M | $24.70M | $26.38M | $25.26M | $6.56M | $20.15M | $27.07M | $27.17M | $20.07M | $31.42M | $17.88M | $17.96M | $19.74M | $18.10M | $11.06M | $-4.90M |
| EBITDA Ratio | 32.35% | 21.18% | 30.63% | 33.75% | 27.66% | 24.58% | 32.44% | 34.10% | 10.06% | 31.83% | 39.66% | 39.18% | 33.86% | 45.30% | 30.10% | 32.50% | 36.18% | 31.85% | 26.13% | -23.93% |
| Operating Income | $17.99M | $1.22M | $18.97M | $21.57M | $8.58M | $6.53M | $11.32M | $11.57M | $-2.25M | $13.24M | $20.68M | $19.45M | $12.79M | $21.32M | $49.21M | $12.89M | $15.60M | $12.92M | $9.20M | $-7.53M |
| Operating Income Ratio | 15.57% | 1.20% | 17.71% | 19.50% | 8.86% | 6.74% | 13.92% | 15.72% | -3.45% | 19.76% | 30.26% | 27.96% | 21.57% | 30.74% | 82.83% | 22.98% | 28.74% | 22.74% | 21.35% | -43.68% |
| Total Other Income Expenses Net | $-11.88M | $-5.75M | $-5.44M | $-8.72M | $-10.32M | $3.27M | $-3.37M | $-10.52M | $166.00K | $-3.71M | $-4.68M | $-9.26M | $-2.45M | $5.48M | $37.09M | $4.35M | $-14.72M | $-843.00K | $-8.51M | $-10.26M |
| Income Before Tax | $6.11M | $-4.53M | $13.54M | $12.85M | $-1.74M | $9.80M | $7.95M | $1.05M | $-2.15M | $9.52M | $16.00M | $10.20M | $10.34M | $26.80M | $50.21M | $17.24M | $884.00K | $12.08M | $-434.00K | $-16.07M |
| Income Before Tax Ratio | 5.29% | -4.45% | 12.63% | 11.62% | -1.80% | 10.12% | 9.77% | 1.43% | -3.30% | 14.22% | 23.41% | 14.66% | 17.43% | 38.64% | 84.52% | 30.73% | 1.63% | 21.26% | -1.01% | -93.18% |
| Income Tax Expense | $3.97M | $-2.82M | $6.61M | $6.21M | $1.20M | $244.00K | $3.57M | $1.38M | $1.56M | $3.41M | $5.67M | $4.81M | $4.71M | $-16.11M | $15.34M | $7.42M | $345.00K | $-699.00K | $-179.00K | $104.00K |
| Net Income | $2.14M | $-1.71M | $6.92M | $6.64M | $-2.94M | $9.56M | $4.38M | $-328.00K | $-3.71M | $6.11M | $10.34M | $5.39M | $5.62M | $42.91M | $34.87M | $9.82M | $539.00K | $12.78M | $-255.00K | $-16.18M |
| Net Income Ratio | 1.85% | -1.68% | 6.46% | 6.01% | -3.04% | 9.87% | 5.38% | -0.45% | -5.68% | 9.13% | 15.13% | 7.75% | 9.49% | 61.87% | 58.69% | 17.50% | 0.99% | 22.49% | -0.59% | -93.79% |
| EPS | $0.01 | $-0.01 | $0.04 | $0.04 | $-0.02 | $0.05 | $0.03 | $0.00 | $-0.02 | $0.04 | $0.07 | $0.04 | $0.04 | $0.30 | $0.24 | $0.07 | $0.00 | $0.08 | $0.00 | $-0.15 |
| EPS Diluted | $0.01 | $-0.01 | $0.04 | $0.04 | $-0.02 | $0.05 | $0.03 | $0.00 | $-0.02 | $0.04 | $0.07 | $0.04 | $0.04 | $0.28 | $0.24 | $0.07 | $0.00 | $0.07 | $0.00 | $-0.14 |
| Weighted Average Shares Outstanding | 178.40M | 177.83M | 176.20M | 174.87M | 174.27M | 174.24M | 171.81M | 157.84M | 154.44M | 152.80M | 148.59M | 146.80M | 146.25M | 153.24M | 142.84M | 135.61M | 135.12M | 142.07M | 125.43M | 111.17M |
| Weighted Average Shares Outstanding Diluted | 181.82M | 177.83M | 179.89M | 179.53M | 174.27M | 174.24M | 174.25M | 157.84M | 154.44M | 152.80M | 153.01M | 153.15M | 151.02M | 154.91M | 147.81M | 140.85M | 137.47M | 135.00M | 125.43M | 112.31M |
| SEC Filing | Source | Source | Source | Source | Source | Source | Source | Source | Source | Source | Source | Source | Source | Source | Source | Source | Source | Source | Source | Source |
Annual Balance Sheet
| Breakdown | December 31, 2023 | December 31, 2022 | December 31, 2021 | December 31, 2020 | December 31, 2019 |
|---|---|---|---|---|---|
| Cash and Cash Equivalents | $82.54M | $68.79M | $91.00M | $79.69M | $34.66M |
| Short Term Investments | $1.53M | $1.52M | $3.55M | $3.15M | $158.00K |
| Cash and Short Term Investments | $84.07M | $70.30M | $94.55M | $82.85M | $34.81M |
| Net Receivables | $5.08M | $8.53M | $5.67M | $4.26M | $7.00M |
| Inventory | $39.54M | $32.69M | $32.88M | $20.75M | $15.04M |
| Other Current Assets | $2.75M | $4.34M | $2.32M | $2.00M | $1.84M |
| Total Current Assets | $131.45M | $115.86M | $135.43M | $109.86M | $58.70M |
| Property Plant Equipment Net | $465.51M | $426.96M | $300.68M | $239.04M | $98.95M |
| Goodwill | $- | $- | $- | $- | $- |
| Intangible Assets | $- | $- | $- | $- | $- |
| Goodwill and Intangible Assets | $- | $- | $- | $- | $- |
| Long Term Investments | $7.17M | $- | $- | $- | $19.70M |
| Tax Assets | $188.00K | $363.00K | $207.00K | $- | $376.00K |
| Other Non-Current Assets | $327.00K | $13.93M | $20.00K | $1.20M | $52.00K |
| Total Non-Current Assets | $473.19M | $441.25M | $300.91M | $240.24M | $119.08M |
| Other Assets | $- | $- | $- | $- | $- |
| Total Assets | $604.65M | $557.11M | $436.33M | $350.10M | $177.78M |
| Account Payables | $39.24M | $21.76M | $18.68M | $6.06M | $7.26M |
| Short Term Debt | $9.82M | $4.24M | $6.41M | $4.73M | $599.00K |
| Tax Payables | $- | $- | $254.00K | $41.00K | $486.00K |
| Deferred Revenue | $- | $- | $43.01M | $39.27M | $21.51M |
| Other Current Liabilities | $28.96M | $51.84M | $2.63M | $2.92M | $2.33M |
| Total Current Liabilities | $78.02M | $77.84M | $70.98M | $53.02M | $32.19M |
| Long Term Debt | $53.33M | $44.41M | $35.23M | $34.22M | $31.52M |
| Deferred Revenue Non-Current | $14.26M | $- | $53.53M | $48.02M | $- |
| Deferred Tax Liabilities Non-Current | $42.38M | $31.92M | $25.14M | $7.53M | $- |
| Other Non-Current Liabilities | $63.22M | $54.30M | $53.63M | $48.12M | $21.78M |
| Total Non-Current Liabilities | $158.93M | $130.63M | $113.99M | $89.87M | $53.30M |
| Other Liabilities | $- | $- | $- | $- | $- |
| Total Liabilities | $236.95M | $208.47M | $184.97M | $142.90M | $85.50M |
| Preferred Stock | $- | $- | $- | $- | $- |
| Common Stock | $408.10M | $395.53M | $310.14M | $289.48M | $263.42M |
| Retained Earnings | $-73.64M | $-82.56M | $-92.31M | $-119.48M | $-207.51M |
| Accumulated Other Comprehensive Income Loss | $533.00K | $2.60M | $2.01M | $5.79M | $6.05M |
| Other Total Stockholders Equity | $32.69M | $33.07M | $31.52M | $31.41M | $30.32M |
| Total Stockholders Equity | $367.69M | $348.64M | $251.37M | $207.20M | $92.28M |
| Total Equity | $367.69M | $348.64M | $251.37M | $207.20M | $92.28M |
| Total Liabilities and Stockholders Equity | $604.65M | $557.11M | $436.33M | $350.10M | $177.78M |
| Minority Interest | $- | $- | $- | $- | $- |
| Total Liabilities and Total Equity | $604.65M | $557.11M | $436.33M | $350.10M | $177.78M |
| Total Investments | $8.71M | $1.52M | $3.55M | $3.15M | $19.85M |
| Total Debt | $63.16M | $48.65M | $41.64M | $38.95M | $32.12M |
| Net Debt | $-19.38M | $-20.14M | $-49.37M | $-40.74M | $-2.54M |
Balance Sheet Charts
| Breakdown | March 31, 2024 | December 31, 2023 | September 30, 2023 | June 30, 2023 | March 31, 2023 | December 31, 2022 | September 30, 2022 | June 30, 2022 | March 31, 2022 | December 31, 2021 | September 30, 2021 | June 30, 2021 | March 31, 2021 | December 31, 2020 | September 30, 2020 | June 30, 2020 | March 31, 2020 | December 31, 2019 | September 30, 2019 | June 30, 2019 |
|---|---|---|---|---|---|---|---|---|---|---|---|---|---|---|---|---|---|---|---|---|
| Cash and Cash Equivalents | $87.30M | $82.54M | $84.16M | $70.83M | $65.88M | $68.79M | $56.08M | $114.09M | $78.10M | $91.00M | $86.72M | $82.16M | $76.75M | $79.69M | $67.30M | $50.17M | $38.41M | $34.66M | $24.77M | $8.84M |
| Short Term Investments | $2.25M | $1.53M | $1.84M | $2.53M | $3.05M | $1.52M | $1.51M | $2.02M | $2.90M | $3.55M | $4.09M | $3.95M | $4.81M | $3.15M | $2.37M | $146.00K | $124.00K | $158.00K | $191.00K | $270.00K |
| Cash and Short Term Investments | $89.55M | $84.07M | $86.00M | $73.35M | $68.93M | $70.30M | $57.59M | $116.12M | $81.00M | $94.55M | $90.81M | $86.11M | $81.56M | $82.85M | $69.67M | $50.31M | $38.53M | $34.81M | $24.96M | $9.11M |
| Net Receivables | $6.41M | $5.08M | $4.31M | $5.23M | $5.30M | $8.53M | $5.04M | $3.80M | $7.27M | $5.67M | $4.92M | $4.20M | $4.93M | $1.71M | $2.94M | $2.64M | $2.71M | $1.09M | $5.40M | $5.72M |
| Inventory | $33.97M | $39.54M | $41.01M | $32.98M | $32.46M | $32.69M | $45.09M | $33.13M | $36.51M | $32.88M | $27.44M | $23.12M | $21.35M | $20.75M | $18.90M | $16.72M | $13.33M | $15.04M | $20.65M | $22.60M |
| Other Current Assets | $2.12M | $2.75M | $2.86M | $3.81M | $4.07M | $4.34M | $1.69M | $1.33M | $1.83M | $2.32M | $480.00K | $1.14M | $1.95M | $4.55M | $387.00K | $11.61M | $5.44M | $7.76M | $1.34M | $1.62M |
| Total Current Assets | $132.05M | $131.45M | $134.17M | $115.38M | $110.76M | $115.86M | $109.42M | $154.38M | $126.60M | $135.43M | $123.65M | $114.58M | $109.78M | $109.86M | $91.90M | $81.28M | $60.01M | $58.70M | $52.34M | $39.05M |
| Property Plant Equipment Net | $470.94M | $465.51M | $449.28M | $422.85M | $427.11M | $426.96M | $409.84M | $322.30M | $315.07M | $300.68M | $274.29M | $249.64M | $237.81M | $239.04M | $223.05M | $147.83M | $99.57M | $98.95M | $91.68M | $92.71M |
| Goodwill | $- | $- | $- | $- | $- | $- | $- | $- | $- | $- | $- | $- | $- | $- | $- | $- | $- | $- | $- | $- |
| Intangible Assets | $- | $- | $- | $- | $- | $- | $- | $- | $- | $- | $- | $- | $- | $- | $- | $- | $- | $- | $- | $- |
| Goodwill and Intangible Assets | $- | $- | $- | $- | $- | $- | $- | $- | $- | $- | $- | $- | $- | $- | $- | $- | $- | $- | $- | $- |
| Long Term Investments | $7.17M | $7.17M | $- | $- | $- | $- | $- | $- | $- | $- | $- | $- | $- | $- | $- | $2.56M | $19.28M | $19.70M | $22.14M | $21.97M |
| Tax Assets | $169.00K | $188.00K | $363.00K | $355.00K | $363.00K | $363.00K | $224.00K | $211.00K | $204.00K | $207.00K | $- | $- | $- | $- | $- | $- | $237.00K | $376.00K | $- | $- |
| Other Non-Current Assets | $187.00K | $327.00K | $13.00K | $11.60M | $13.30M | $13.93M | $649.00K | $20.00K | $20.00K | $20.00K | $20.00K | $20.00K | $20.00K | $1.20M | $899.00K | $21.00K | $21.00K | $52.00K | $54.00K | $56.00K |
| Total Non-Current Assets | $478.47M | $473.19M | $449.66M | $434.80M | $440.78M | $441.25M | $410.71M | $322.53M | $315.30M | $300.91M | $274.31M | $249.66M | $237.83M | $240.24M | $223.94M | $150.42M | $119.10M | $119.08M | $113.88M | $114.74M |
| Other Assets | $- | $- | $- | $- | $- | $- | $- | $- | $- | $- | $- | $- | $- | $- | $- | $- | $- | $- | $- | $- |
| Total Assets | $610.52M | $604.65M | $583.83M | $550.17M | $551.54M | $557.11M | $520.13M | $476.91M | $441.90M | $436.33M | $397.96M | $364.24M | $347.61M | $350.10M | $315.85M | $231.70M | $179.11M | $177.78M | $166.22M | $153.79M |
| Account Payables | $33.89M | $39.24M | $32.18M | $6.27M | $8.90M | $21.76M | $7.00M | $3.48M | $18.97M | $18.68M | $4.83M | $8.58M | $11.90M | $6.06M | $4.78M | $4.09M | $5.17M | $7.26M | $12.55M | $17.08M |
| Short Term Debt | $10.26M | $9.82M | $8.69M | $6.94M | $5.11M | $4.24M | $4.93M | $34.80M | $6.83M | $6.41M | $5.64M | $5.55M | $4.62M | $4.73M | $5.11M | $4.59M | $1.70M | $599.00K | $10.12M | $10.12M |
| Tax Payables | $- | $- | $- | $- | $- | $- | $- | $- | $282.00K | $254.00K | $31.00K | $34.00K | $62.00K | $41.00K | $30.00K | $1.93M | $677.00K | $486.00K | $- | $- |
| Deferred Revenue | $- | $- | $19.82M | $36.99M | $- | $- | $- | $- | $- | $43.01M | $37.72M | $33.06M | $27.69M | $39.27M | $34.96M | $25.65M | $19.27M | $21.51M | $12.65M | $2.44M |
| Other Current Liabilities | $29.52M | $28.96M | $5.08M | $42.55M | $52.82M | $51.84M | $48.28M | $40.46M | $46.72M | $2.63M | $2.65M | $35.66M | $29.99M | $42.20M | $38.25M | $26.91M | $21.76M | $23.84M | $17.52M | $20.11M |
| Total Current Liabilities | $73.67M | $78.02M | $65.77M | $55.76M | $66.83M | $77.84M | $60.21M | $78.75M | $72.80M | $70.98M | $50.87M | $49.83M | $46.57M | $53.02M | $48.16M | $37.52M | $29.32M | $32.19M | $40.19M | $47.32M |
| Long Term Debt | $54.14M | $53.33M | $52.54M | $49.66M | $46.10M | $44.41M | $42.13M | $4.35M | $35.09M | $35.23M | $33.92M | $34.48M | $34.10M | $34.22M | $38.10M | $37.53M | $31.76M | $31.52M | $24.92M | $24.75M |
| Deferred Revenue Non-Current | $14.93M | $14.26M | $- | $- | $- | $- | $- | $- | $- | $53.53M | $50.84M | $44.49M | $42.11M | $48.02M | $48.64M | $47.33M | $- | $- | $20.57M | $21.27M |
| Deferred Tax Liabilities Non-Current | $45.49M | $42.38M | $43.94M | $37.79M | $32.60M | $31.92M | $30.61M | $27.10M | $27.12M | $25.14M | $21.64M | $16.28M | $11.92M | $7.53M | $23.61M | $5.70M | $- | $- | $383.00K | $579.00K |
| Other Non-Current Liabilities | $66.44M | $63.22M | $60.23M | $55.38M | $59.64M | $54.30M | $58.05M | $50.08M | $52.47M | $53.63M | $50.91M | $44.59M | $42.19M | $55.65M | $72.37M | $60.00K | $21.62M | $21.78M | $21.60M | $22.53M |
| Total Non-Current Liabilities | $166.07M | $158.93M | $156.71M | $142.83M | $138.34M | $130.63M | $130.79M | $81.53M | $114.69M | $113.99M | $106.47M | $95.34M | $88.22M | $89.87M | $110.47M | $90.63M | $53.38M | $53.30M | $46.52M | $47.28M |
| Other Liabilities | $- | $- | $- | $- | $- | $- | $- | $- | $- | $- | $- | $- | $- | $- | $- | $- | $- | $- | $- | $- |
| Total Liabilities | $239.74M | $236.95M | $222.47M | $198.59M | $205.17M | $208.47M | $191.00M | $160.28M | $187.48M | $184.97M | $157.33M | $145.17M | $134.79M | $142.90M | $158.64M | $128.15M | $82.70M | $85.50M | $86.71M | $94.60M |
| Preferred Stock | $- | $- | $- | $- | $- | $- | $- | $- | $- | $- | $- | $- | $- | $- | $- | $- | $- | $- | $- | $- |
| Common Stock | $409.73M | $408.10M | $405.87M | $398.15M | $396.48M | $395.53M | $391.29M | $380.42M | $314.74M | $310.14M | $306.48M | $292.24M | $290.09M | $289.48M | $284.50M | $265.44M | $263.64M | $263.42M | $263.00M | $245.01M |
| Retained Earnings | $-71.50M | $-73.64M | $-71.93M | $-78.85M | $-85.50M | $-82.56M | $-92.11M | $-96.35M | $-96.02M | $-92.31M | $-98.42M | $-108.69M | $-114.08M | $-119.48M | $-162.28M | $-197.15M | $-206.97M | $-207.51M | $-220.29M | $-220.03M |
| Accumulated Other Comprehensive Income Loss | $-1.86M | $533.00K | $-3.57M | $-2.27M | $954.00K | $2.60M | $-1.17M | $-1.01M | $3.50M | $2.01M | $1.66M | $2.68M | $4.40M | $5.79M | $4.24M | $5.02M | $9.02M | $6.05M | $6.63M | $5.16M |
| Other Total Stockholders Equity | $34.41M | $32.69M | $30.99M | $34.56M | $34.44M | $33.07M | $31.12M | $33.57M | $32.20M | $31.52M | $30.91M | $32.83M | $32.41M | $31.41M | $30.75M | $30.24M | $30.72M | $30.32M | $30.17M | $29.05M |
| Total Stockholders Equity | $370.78M | $367.69M | $361.36M | $351.58M | $346.37M | $348.64M | $329.13M | $316.63M | $254.42M | $251.37M | $240.63M | $219.07M | $212.83M | $207.20M | $157.21M | $103.55M | $96.41M | $92.28M | $79.51M | $59.19M |
| Total Equity | $370.78M | $367.69M | $361.36M | $351.58M | $346.37M | $348.64M | $329.13M | $316.63M | $254.42M | $251.37M | $240.63M | $219.07M | $212.83M | $207.20M | $157.21M | $103.55M | $96.41M | $92.28M | $79.51M | $59.19M |
| Total Liabilities and Stockholders Equity | $610.52M | $604.65M | $583.83M | $550.17M | $551.54M | $557.11M | $520.13M | $476.91M | $441.90M | $436.33M | $397.96M | $364.24M | $347.61M | $350.10M | $315.85M | $231.70M | $179.11M | $177.78M | $166.22M | $153.79M |
| Minority Interest | $- | $- | $- | $- | $- | $- | $- | $- | $- | $- | $- | $- | $- | $- | $- | $- | $- | $- | $- | $- |
| Total Liabilities and Total Equity | $610.52M | $604.65M | $583.83M | $550.17M | $551.54M | $557.11M | $520.13M | $476.91M | $441.90M | $436.33M | $397.96M | $364.24M | $347.61M | $350.10M | $315.85M | $231.70M | $179.11M | $177.78M | $166.22M | $153.79M |
| Total Investments | $9.42M | $8.71M | $1.84M | $2.53M | $3.05M | $1.52M | $1.51M | $2.02M | $2.90M | $3.55M | $4.09M | $3.95M | $4.81M | $3.15M | $2.37M | $2.71M | $19.40M | $19.85M | $22.33M | $22.24M |
| Total Debt | $64.40M | $63.16M | $61.22M | $56.60M | $51.21M | $48.65M | $47.06M | $39.16M | $41.92M | $41.64M | $39.56M | $40.03M | $38.72M | $38.95M | $43.21M | $42.12M | $33.46M | $32.12M | $35.49M | $35.39M |
| Net Debt | $-22.90M | $-19.38M | $-22.94M | $-14.22M | $-14.67M | $-20.14M | $-9.02M | $-74.94M | $-36.18M | $-49.37M | $-47.16M | $-42.13M | $-38.03M | $-40.74M | $-24.09M | $-8.04M | $-4.94M | $-2.54M | $10.71M | $26.54M |
Annual Cash Flow
| Breakdown | December 31, 2023 | December 31, 2022 | December 31, 2021 | December 31, 2020 | December 31, 2019 |
|---|---|---|---|---|---|
| Net Income | $8.92M | $9.90M | $27.47M | $88.13M | $-6.94M |
| Depreciation and Amortization | $69.63M | $55.54M | $29.75M | $23.98M | $9.51M |
| Deferred Income Tax | $11.20M | $6.75M | $18.60M | $7.00M | $-121.00K |
| Stock Based Compensation | $10.02M | $7.65M | $8.26M | $9.37M | $-574.00K |
| Change in Working Capital | $4.84M | $-739.00K | $2.25M | $5.91M | $1.75M |
| Accounts Receivables | $3.43M | $-2.66M | $-1.71M | $2.75M | $-4.98M |
| Inventory | $1.51M | $-8.07M | $-13.37M | $-1.99M | $5.74M |
| Accounts Payables | $-242.00K | $8.73M | $17.74M | $5.30M | $6.19M |
| Other Working Capital | $139.00K | $1.25M | $-408.00K | $-153.00K | $-5.20M |
| Other Non Cash Items | $24.45M | $9.12M | $20.14M | $-43.26M | $11.55M |
| Net Cash Provided by Operating Activities | $129.06M | $88.22M | $106.46M | $91.13M | $15.18M |
| Investments in Property Plant and Equipment | $-103.14M | $-171.14M | $-92.02M | $-46.30M | $-25.39M |
| Acquisitions Net | $204.00K | $265.00K | $- | $5.03M | $-21.82M |
| Purchases of Investments | $-773.00K | $- | $-119.00K | $-1.01M | $-219.00K |
| Sales Maturities of Investments | $-407.00K | $- | $- | $1.01M | $22.04M |
| Other Investing Activities | $407.00K | $546.00K | $134.00K | $-20.42M | $-21.82M |
| Net Cash Used for Investing Activities | $-103.71M | $-170.33M | $-92.00M | $-61.70M | $-47.21M |
| Debt Repayment | $- | $- | $- | $- | $- |
| Common Stock Issued | $1.61M | $69.00M | $13.79M | $17.73M | $39.10M |
| Common Stock Repurchased | $- | $-492.00K | $-814.00K | $-260.00K | $- |
| Dividends Paid | $- | $- | $- | $- | $- |
| Other Financing Activities | $-11.00M | $59.28M | $5.00K | $14.62M | $65.35M |
| Net Cash Used Provided by Financing Activities | $-11.00M | $59.28M | $5.00K | $14.62M | $65.35M |
| Effect of Forex Changes on Cash | $-596.00K | $611.00K | $-3.15M | $987.00K | $-5.00K |
| Net Change in Cash | $13.75M | $-22.22M | $11.31M | $45.04M | $33.32M |
| Cash at End of Period | $82.54M | $68.79M | $91.00M | $79.69M | $34.66M |
| Cash at Beginning of Period | $68.79M | $91.00M | $79.69M | $34.66M | $1.34M |
| Operating Cash Flow | $129.06M | $88.22M | $106.46M | $91.13M | $15.18M |
| Capital Expenditure | $-103.14M | $-171.14M | $-92.02M | $-46.30M | $-25.39M |
| Free Cash Flow | $25.92M | $-82.92M | $14.44M | $44.83M | $-10.21M |
Cash Flow Charts
| Breakdown | March 31, 2024 | December 31, 2023 | September 30, 2023 | June 30, 2023 | March 31, 2023 | December 31, 2022 | September 30, 2022 | June 30, 2022 | March 31, 2022 | December 31, 2021 | September 30, 2021 | June 30, 2021 | March 31, 2021 | December 31, 2020 | September 30, 2020 | June 30, 2020 | March 31, 2020 | December 31, 2019 | September 30, 2019 | June 30, 2019 |
|---|---|---|---|---|---|---|---|---|---|---|---|---|---|---|---|---|---|---|---|---|
| Net Income | $2.14M | $-1.71M | $6.92M | $6.64M | $-2.94M | $9.56M | $4.38M | $-328.00K | $-3.71M | $6.11M | $10.34M | $5.39M | $5.62M | $42.91M | $34.87M | $9.82M | $539.00K | $12.78M | $-255.00K | $-16.18M |
| Depreciation and Amortization | $19.39M | $20.34M | $13.89M | $16.02M | $18.41M | $18.02M | $15.01M | $13.70M | $8.82M | $8.15M | $6.51M | $7.77M | $7.32M | $9.93M | $4.58M | $5.33M | $4.13M | $5.82M | $2.05M | $1.12M |
| Deferred Income Tax | $3.97M | $-2.75M | $6.61M | $6.21M | $1.20M | $244.00K | $3.57M | $1.38M | $1.56M | $3.41M | $5.67M | $4.81M | $4.71M | $-16.11M | $15.34M | $7.42M | $345.00K | $58.00K | $-179.00K | $3.43M |
| Stock Based Compensation | $3.19M | $3.23M | $3.87M | $1.25M | $1.67M | $4.50M | $1.22M | $-3.84M | $5.77M | $3.95M | $856.00K | $2.31M | $1.14M | $1.31M | $6.35M | $1.94M | $-223.00K | $922.00K | $-2.35M | $1.50M |
| Change in Working Capital | $1.75M | $7.93M | $9.22M | $-4.53M | $-7.78M | $8.41M | $547.00K | $-9.99M | $296.00K | $8.25M | $63.00K | $-3.72M | $-2.34M | $5.51M | $-1.88M | $3.40M | $-1.12M | $6.44M | $-1.73M | $210.00K |
| Accounts Receivables | $-1.35M | $-539.00K | $856.00K | $-37.00K | $3.15M | $-3.31M | $-1.10M | $3.24M | $-1.48M | $-728.00K | $-1.04M | $727.00K | $-666.00K | $-1.32M | $-302.00K | $4.13M | $238.00K | $-1.56M | $179.00K | $-4.23M |
| Inventory | $4.10M | $2.51M | $485.00K | $381.00K | $-1.87M | $320.00K | $-8.54M | $1.69M | $-1.54M | $-4.07M | $-6.52M | $-2.07M | $-716.00K | $-1.44M | $-100.00K | $-2.53M | $2.07M | $5.95M | $1.95M | $-1.62M |
| Accounts Payables | $-927.00K | $6.13M | $7.61M | $-5.09M | $-8.89M | $11.63M | $9.61M | $-15.30M | $2.80M | $14.88M | $7.05M | $-3.19M | $-1.00M | $- | $- | $- | $- | $- | $-1.42M | $5.74M |
| Other Working Capital | $-76.00K | $-178.00K | $273.00K | $224.00K | $-180.00K | $-233.00K | $581.00K | $387.00K | $1.84M | $12.32M | $6.58M | $-1.65M | $-1.62M | $6.94M | $-1.78M | $5.93M | $-3.19M | $489.00K | $-2.44M | $317.00K |
| Other Non Cash Items | $51.77M | $4.71M | $4.83M | $8.81M | $10.30M | $-4.19M | $3.57M | $10.32M | $-578.00K | $3.64M | $4.48M | $9.76M | $2.20M | $-6.54M | $-38.43M | $-6.10M | $7.80M | $-1.06M | $4.54M | $3.59M |
| Net Cash Provided by Operating Activities | $42.07M | $31.77M | $45.34M | $34.41M | $20.86M | $36.54M | $28.29M | $11.24M | $12.15M | $33.52M | $27.92M | $26.32M | $18.66M | $37.01M | $20.83M | $21.82M | $11.48M | $24.96M | $2.07M | $-6.33M |
| Investments in Property Plant and Equipment | $-31.69M | $-32.43M | $-26.95M | $-23.91M | $-19.85M | $-21.45M | $-89.82M | $-35.08M | $-24.78M | $-25.79M | $-31.05M | $-16.98M | $-18.19M | $-19.98M | $-8.10M | $-10.52M | $-7.70M | $-11.61M | $-4.22M | $-3.58M |
| Acquisitions Net | $- | $204.00K | $- | $- | $-48.00K | $- | $- | $265.00K | $- | $- | $- | $- | $- | $8.85M | $-3.82M | $- | $- | $-219.00K | $- | $-21.60M |
| Purchases of Investments | $- | $-500.00K | $-225.00K | $- | $-48.00K | $- | $- | $- | $- | $- | $- | $- | $-119.00K | $- | $10.70M | $- | $- | $- | $- | $- |
| Sales Maturities of Investments | $- | $-136.00K | $- | $- | $48.00K | $- | $- | $- | $- | $- | $- | $- | $- | $- | $1.01M | $- | $- | $- | $- | $- |
| Other Investing Activities | $568.00K | $136.00K | $187.00K | $145.00K | $212.00K | $207.00K | $210.00K | $84.00K | $45.00K | $34.00K | $31.00K | $33.00K | $36.00K | $-11.71M | $-20.42M | $32.00K | $73.00K | $-219.00K | $- | $- |
| Net Cash Used for Investing Activities | $-31.69M | $-32.72M | $-26.99M | $-23.77M | $-19.69M | $-21.25M | $-89.61M | $-34.73M | $-24.74M | $-25.76M | $-31.02M | $-16.95M | $-18.28M | $-22.85M | $-20.62M | $-10.52M | $-7.70M | $-11.83M | $-4.22M | $-25.17M |
| Debt Repayment | $- | $- | $- | $- | $- | $- | $- | $- | $- | $- | $- | $- | $- | $- | $- | $- | $- | $- | $- | $- |
| Common Stock Issued | $185.00K | $1.21M | $150.00K | $190.00K | $69.00K | $414.00K | $-206.00K | $69.00M | $1.43M | $1.25M | $10.80M | $1.31M | $417.00K | $- | $17.73M | $- | $- | $-201.00K | $17.45M | $10.84M |
| Common Stock Repurchased | $- | $- | $- | $- | $- | $- | $-492.00K | $- | $- | $- | $-201.00K | $- | $-613.00K | $-260.00K | $- | $- | $- | $- | $- | $- |
| Dividends Paid | $- | $- | $- | $- | $- | $- | $- | $- | $- | $- | $- | $- | $- | $- | $- | $- | $- | $- | $- | $- |
| Other Financing Activities | $-5.19M | $-3.15M | $-4.29M | $-4.14M | $-3.29M | $-4.22M | $3.17M | $61.34M | $-1.02M | $-3.67M | $8.34M | $-2.52M | $-2.09M | $-3.68M | $16.67M | $122.00K | $-139.00K | $-3.23M | $18.08M | $39.59M |
| Net Cash Used Provided by Financing Activities | $-4.05M | $-3.15M | $-4.29M | $-4.14M | $-3.29M | $-4.22M | $3.17M | $61.34M | $-1.02M | $-3.67M | $8.34M | $-2.52M | $-2.09M | $-3.68M | $17.78M | $660.00K | $-139.00K | $-3.23M | $18.08M | $39.59M |
| Effect of Forex Changes on Cash | $-1.57M | $2.49M | $-739.00K | $-1.55M | $-789.00K | $1.63M | $135.00K | $-1.85M | $701.00K | $194.00K | $-678.00K | $-1.43M | $-1.24M | $1.92M | $-851.00K | $-199.00K | $116.00K | $-5.00K | $-1.00K | $1.00K |
| Net Change in Cash | $4.76M | $-1.62M | $13.33M | $4.95M | $-2.91M | $12.71M | $-58.01M | $35.99M | $-12.90M | $4.29M | $4.56M | $5.41M | $-2.95M | $12.40M | $17.13M | $11.76M | $3.75M | $9.88M | $15.93M | $8.09M |
| Cash at End of Period | $87.30M | $82.54M | $84.16M | $70.83M | $65.88M | $68.79M | $56.08M | $114.09M | $78.10M | $91.00M | $86.72M | $82.16M | $76.75M | $79.69M | $67.30M | $50.17M | $38.41M | $34.66M | $24.77M | $8.84M |
| Cash at Beginning of Period | $82.54M | $84.16M | $70.83M | $65.88M | $68.79M | $56.08M | $114.09M | $78.10M | $91.00M | $86.72M | $82.16M | $76.75M | $79.69M | $67.30M | $50.17M | $38.41M | $34.66M | $24.77M | $8.84M | $752.00K |
| Operating Cash Flow | $42.07M | $31.77M | $45.34M | $34.41M | $20.86M | $36.54M | $28.29M | $11.24M | $12.15M | $33.52M | $27.92M | $26.32M | $18.66M | $37.01M | $20.83M | $21.82M | $11.48M | $24.96M | $2.07M | $-6.33M |
| Capital Expenditure | $-31.69M | $-32.43M | $-26.95M | $-23.91M | $-19.85M | $-21.45M | $-89.82M | $-35.08M | $-24.78M | $-25.79M | $-31.05M | $-16.98M | $-18.19M | $-19.98M | $-8.10M | $-10.52M | $-7.70M | $-11.61M | $-4.22M | $-3.58M |
| Free Cash Flow | $10.38M | $-661.00K | $18.39M | $10.50M | $1.00M | $15.08M | $-61.53M | $-23.84M | $-12.63M | $7.72M | $-3.13M | $9.34M | $465.00K | $17.02M | $12.73M | $11.30M | $3.77M | $13.34M | $-2.15M | $-9.90M |
Karora Resources Dividends
Explore Karora Resources's dividend history, including dividend yield, payout ratio, and historical payments.
Karora Resources News
Read the latest news about Karora Resources, including recent articles, headlines, and updates.
KARORA RESOURCES ANNOUNCES MERGER TRANSACTION WITH WESTGOLD RESOURCES
TORONTO, April 7, 2024 /CNW/ – Karora Resources Inc. (TSX: KRR) (OTCQX: KRRGF) (“Karora”) and Westgold Resources Limited (ASX: WGX) (OTCQX: WGXRF) (“Westgold”) have agreed to combine in a merger pursuant to which Westgold will acquire 100% of the issued and outstanding common shares of Karora (“Karora Shares”) by way of a statutory plan of arrangement under … The post KARORA RESOURCES ANNOUNCES MERGER TRANSACTION WITH WESTGOLD RESOURCES appeared first on Headlines of Today...

Karora Resources Inc. (KRRGF) Q3 2023 Earnings Call Transcript
Karora Resources Inc. (OTCQX:KRRGF) Q3 2023 Results Conference Call November 10, 2023 10:00 AM ET Company Participants Paul Huet - Chairman and CEO Oliver Turner - Head of Corporate Development Leigh Junk - MD- Australia Conference Call Participants Puneet Singh - Eight Capital Jeremy Hoy - Canaccord Genuity John Sclodnick - Desjardins Operator Good morning, ladies and gentlemen, and welcome to the Karora Resources Third Quarter 2023 Conference Call. At this time, all lines are in a listen-only mode.

Karora Resources Inc. (KRRGF) Q2 2023 Earnings Call Transcript
Karora Resources Inc. (OTCQX:KRRGF) Q2 2023 Results Conference Call August 14, 2023 10:00 AM ET Company Participants Oliver Turner - EVP, Corporate Development Leigh Junk - MD- Australia Conference Call Participants Jeremy Hoy - Canaccord Genuity John Sclodnick - Desjardins Matthew O'Keefe - Cantor Fitzgerald Operator Good morning, ladies and gentlemen, and welcome to the Karora Resources Second Quarter Conference Call and Webcast. [Operator Instructions].

Gold producer Karora says its 2022 net earnings down due to higher costs
(Kitco News) - Karora Resources (TSX: KRR) today announced record gold production of 133,887 ounces in 2022, at the top end of the company's guidance range of 120,000 - 135,000 ounces and up 19% from 2021, driven by higher tonnes processed following the acquisition of the Lakewood Mill in July 2022.

Karora Resources Inc. (KRRGF) Q3 2022 Earnings Call Transcript
Karora Resources Inc. (OTCQX:KRRGF) Q3 2022 Earnings Conference Call November 7, 2022 10:00 AM ET Company Participants Paul Huet - Chairman and CEO Oliver Turner - EVP, Corporate Development Bevan Jones - Chief Operating Officer, Australia Conference Call Participants John Sclodnick - Desjardins Matthew O'Keefe - Cantor Fitzgerald Michael Fairbairn - Canaccord Operator Good day and welcome to the Karora Resources Third Quarter 2022 Conference Call. Today's conference is being recorded.

Karora Resources: Cheap For No Reason
Karora Resources released its Q3 production results last month, reporting record production of ~38,400 ounces, a 25% beat vs. its previous record. In addition to solid operational results, the company remains on time/budget for its second decline, which will be operational by Q2 2023 and continues to have exploration success.
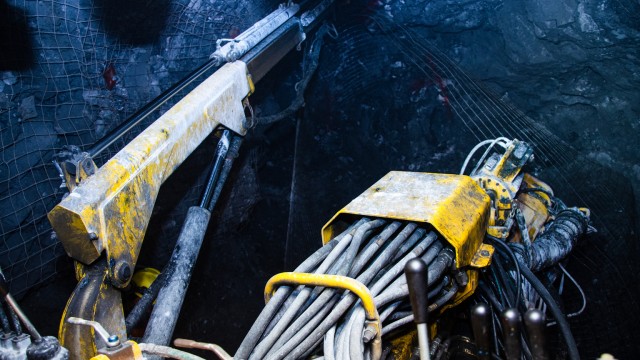
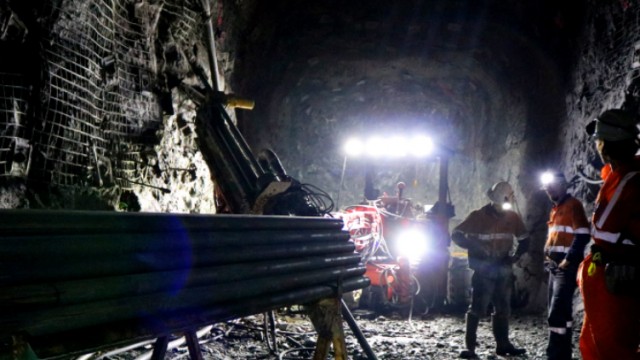
Gold producers miss estimates for third quarter output but junior player Karora Resources bucks trend, say analysts
Mining giant Barrick Gold's gold production came in lower than estimates in the third quarter, as did mid-tier Eldorado Gold's, but junior producer Karora Resources bucked that trend, achieving record quarterly output in the three months. Broker Stifel GMP has produced notes on the three producers, and highlighted that Karora had churned out 38,437 ounces in the quarter from its Beta Hunt and Higginsville mines in the Kalgoorlie belt of Western Australia, trouncing the record set in the last quarter of 30,652 ounces by an impressive 25%.
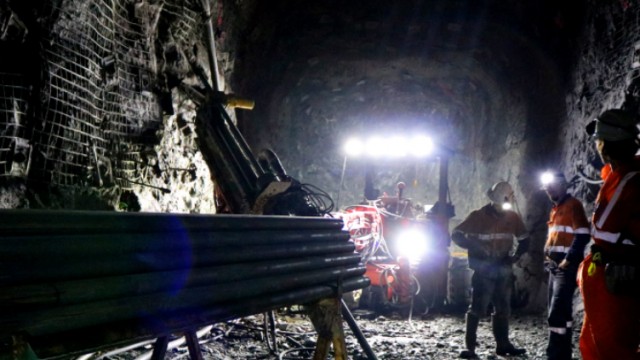
Gold producers miss estimates for third quarter output but junior player Karora Resources bucks trend - analysts
Mining giant Barrick Gold's gold production came in lower than estimates in the third quarter, as did mid-tier Eldorado Gold's, but junior producer Karora Resources bucked that trend, achieving record quarterly output in the three months. Broker Stifel GMP has produced notes on the three producers, and highlighted that Karora had churned out 38,437 ounces in the quarter from its Beta Hunt and Higginsville mines in the Kalgoorlie belt of Western Australia, trouncing the record set in the last quarter of 30,652 ounces by an impressive 25%.
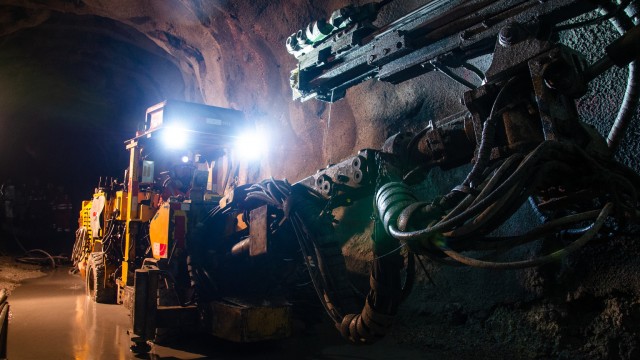
Karora Resources: Too Cheap To Ignore
Karora released its Q2 results earlier this month, reporting quarterly production of ~30,700 ounces of gold, a nearly 3% increase from the year-ago period despite significant headwinds. Unfortunately, while costs were up due to increased productivity and higher tonnes milled, costs were up sharply year-over-year, leading to a share decline in the stock.
Karora Resources Inc. (KRRGF) CEO Paul Huet on Q2 2022 Results - Earnings Call Transcript
Karora Resources Inc. (OTCQX:KRRGF) Q2 2022 Results Conference Call August 12, 2022 10:00 AM ET Company Participants Paul Huet - Chairman, CEO Oliver Turner - EVP, Corporate Development Mike Doolin - SVP, Technical Services Conference Call Participants Ovais Habib - Scotiabank Nicolas Dion - Cormark Securities John Sclodnick - Desjardins Michael Fairbairn - Canaccord Genuity Operator Good day, and welcome to the Karora Resources Second Quarter 2022 Conference call. [Operator Instructions] At this time, I would like to turn the conference over to Mr.

Karora Resources: Buy The Dip
Karora Resources released its Q1 results earlier this month, reporting quarterly production of ~30,700 ounces, a 3% increase from the year-ago period. While this was a solid performance given the challenging environment (labor tightness), we could see another quarter of elevated costs due to inflationary pressures (labor, fuel).

Karora Resources to acquire Lakewood gold mill in Australia for A$80 million
(Kitco News) - Karora Resources (TSX: KRR) announced today that it has entered into a binding agreement to acquire the operating, fully permitted 1.0 Mtpa Lakewood Mill gold processing facility located near Kalgoorlie, Western Australia, approximately 60 kilometres from the Beta Hunt Mine.

Karora increases gold production in Australia in Q1 despite 'challenging' conditions
(Kitco News) - Karora Resources (TSX: KRR) today announced consolidated gold production of 27,489 ounces for the first quarter of 2022 from its Beta Hunt and Higginsville mines in Western Australia, up 11% compared to Q1 2021.

Karora Resources hits high-grade nickel at its Beta Hunt mine in Western Australia
Karora Resources Inc. (TSX:KRR) announced new nickel exploration results from the 50C nickel trough at its Beta Hunt mine in Western Australia, which included 3.8% nickel over 10.9 metres and 4.2% nickel over 3.0 metres. The company said the new results have extended the known 50C nickel trough strike length to over 200 metres, from 150 metres previously, and includes drilling along strike of the 50C discovery and the parallel 10C nickel trough.
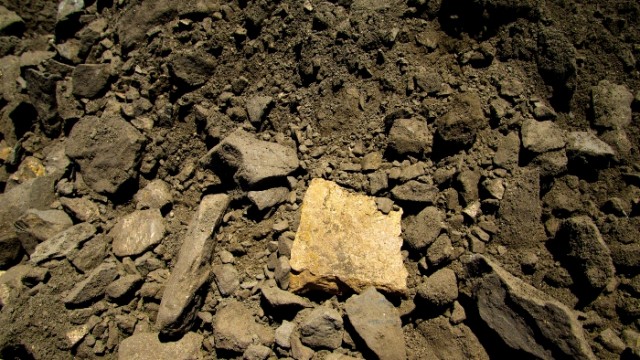
Karora Resources reveals 2022 gold output guidance and first nickel production forecast at Beta Hunt in Western Australia
Karora Resources Inc announced 2022 gold production guidance of between 110,000 and 135,000 ounces at anticipated all-in sustaining costs (AISC) of US$950 to US$1,050 per ounce sold. The company also said initial nickel production at its Beta Hunt mine in Western Australia this year is forecasted to range between 450 and 550 nickel tonnes.

Canaccord Genuity resumes coverage of Karora Resources with a 'Buy' rating and a C$6.25 target price
Canaccord Genuity (TSX:CF, LSE:CF) has resumed coverage of Karora Resources Inc with a 'Buy' rating and a C$6.25 target price, noting that the stock offers organic growth, at a good price. The Canadian broker noted that Karora (KRR) is a Western Australia-based gold producer operating the historic Beta Hunt (BH) gold-nickel mine and the Higginsville Gold Operations (HGO), which consists of a 1.6 million tonnes per annum mill and a conglomerate of open pit and underground mines.
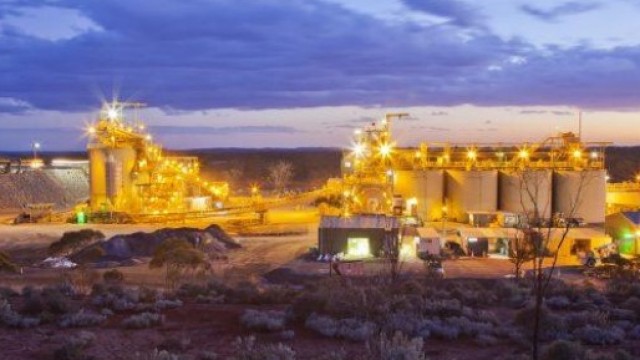
Karora Resources says third major Beta Hunt shear zone extended to over 500m of strike with potential to extend over 2 km
Karora Resources Inc has announced new exploration drilling results from its Beta Hunt Mine that materially extend the strike length of gold mineralization at the Fletcher Zone to over 500 metres (m). The company said the recently discovered Gamma Block mineralization strike length has also been extended to over 200m.
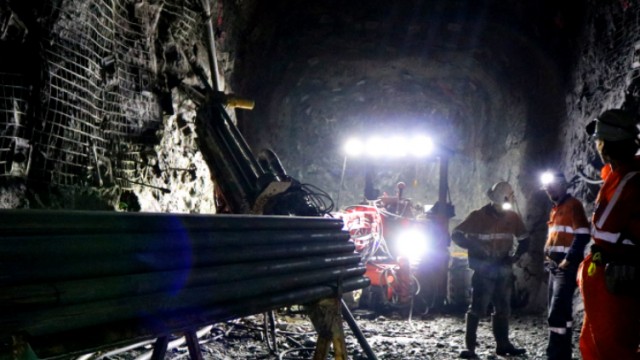
Karora Resources keeping up the momentum down under as it focuses on growing production and cutting costs
A quality gold producer in Western Australia Robust financial position driven by strong free-cash-flow generation A large and expanding resource base What Karora Resources does: Karora Resources Inc (TSE:KRR) (OTCMKTS:KRRGF) (FRA:5RN1) is now a "top tier" junior gold producer in Western Australia having started its transformation - when known as RNC Minerals - with its purchase in 2019 of the Higginsville Gold Operations (HGO). The group is focused on growing gold production and reducing costs at the integrated Beta Hunt Gold Mine and the Higginsville mine and its associated treatment facility.
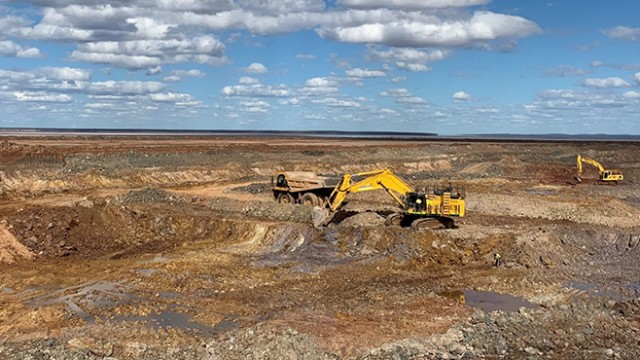
Karora Resources appoints Australian resource veteran Shirley In't Veld to its board of directors
Karora Resources Inc. (TSX:KRR) has announced the appointment of Shirley In't Veld to the company's board of directors, effective immediately. In't Veld, who is based out of Australia, has over 30 years of career experience in the mining, renewables and energy sectors and is currently a director of Alumina Limited (ASX:AWC), National Broadband Network Co, and APA Group (ASX:APA).

Karora Resources intersects more high-grade gold at its Beta Hunt mine in Western Australia
Karora Resources Inc has announced new exploration drill results from its Beta Hunt gold mine in Western Australia, which included 40.5 grams per tonne (g/t) gold over 4.0 metres (m), as well as its widest intercept to date totalling 1.5 g/t gold over 90.5m. The company said the new results include the discovery of high-grade gold mineralization about 50m below the interpreted extension of the 50C nickel trough in the Gamma Block.
Similar Companies
Related Metrics
Explore detailed financial metrics and analysis for KRRGF.
