Loma Negra Compañía Industrial Argentina Sociedad Anónima Key Executives
This section highlights Loma Negra Compañía Industrial Argentina Sociedad Anónima's key executives, including their titles and compensation details.
Find Contacts at Loma Negra Compañía Industrial Argentina Sociedad Anónima
(Showing 0 of )
Loma Negra Compañía Industrial Argentina Sociedad Anónima Earnings
This section highlights Loma Negra Compañía Industrial Argentina Sociedad Anónima's earnings, including key dates, EPS, earnings reports, and earnings call transcripts.
Next Earnings Date
Last Earnings Results
Earnings Call Transcripts
| Transcript | Quarter | Year | Date | Estimated EPS | Actual EPS |
|---|---|---|---|---|---|
| Read Transcript | Q3 | 2024 | 2024-11-09 | N/A | N/A |
| Read Transcript | Q2 | 2024 | 2024-08-08 | N/A | N/A |
| Read Transcript | Q1 | 2024 | 2024-05-10 | N/A | N/A |
| Read Transcript | Q4 | 2023 | 2024-03-07 | N/A | N/A |
| Read Transcript | Q3 | 2023 | 2023-11-09 | N/A | N/A |

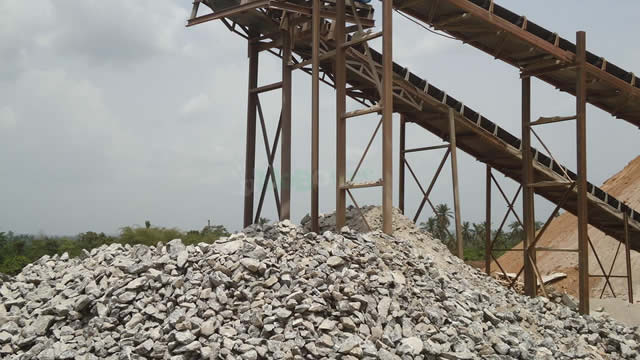
Loma Negra Compañía Industrial Argentina Sociedad Anónima, together with its subsidiaries, manufactures and sells cement and its derivatives in Argentina. The company operates through Cement, Masonry Cement and Lime; Concrete; Rail Services; Aggregates; and Others segments. It offers masonry cement, aggregates, ready-mix concrete, concrete, and lime to wholesale distributors, concrete producers, industrial customers, and others for use in the construction. The company also provides rail transportation services; and treats and recycles industrial waste for use as fuel. It markets its products under the Loma Negra, San Martín, Plasticor, Cacique Plus, Cacique Max, Loma Negra Plus, and Lomax brands. The company was founded in 1926 and is based in Buenos Aires, Argentina. Loma Negra Compañía Industrial Argentina Sociedad Anónima is a subsidiary of InterCement Trading e Inversiones S.A.
$11.16
Stock Price
$260.47M
Market Cap
1.09K
Employees
Buenos Aires, None
Location
Financial Statements
Access annual & quarterly financial statements for Loma Negra Compañía Industrial Argentina Sociedad Anónima, including income statements, balance sheets, and cash flow statements..
Annual Income Statement
| Breakdown | December 31, 2024 | December 31, 2023 | December 31, 2022 | December 31, 2021 | December 31, 2020 |
|---|---|---|---|---|---|
| Revenue | $699.18B | $422.16B | $451.95B | $446.87B | $62.83B |
| Cost of Revenue | $512.20B | $316.37B | $329.97B | $305.72B | $43.81B |
| Gross Profit | $186.98B | $105.79B | $121.98B | $141.15B | $19.01B |
| Gross Profit Ratio | 26.74% | 25.10% | 27.00% | 31.60% | 30.26% |
| Research and Development Expenses | $- | $- | $- | $- | $- |
| General and Administrative Expenses | $- | $36.42B | $37.08B | $36.41B | $- |
| Selling and Marketing Expenses | $- | $2.13B | $1.81B | $1.89B | $- |
| Selling General and Administrative Expenses | $73.17B | $38.55B | $38.89B | $38.30B | $5.41B |
| Other Expenses | $- | $- | $- | $- | $- |
| Operating Expenses | $73.17B | $38.55B | $38.89B | $38.30B | $5.41B |
| Cost and Expenses | $585.37B | $354.92B | $368.86B | $344.02B | $49.22B |
| Interest Income | $- | $- | $- | $- | $- |
| Interest Expense | $- | $- | $- | $- | $- |
| Depreciation and Amortization | $62.63B | $30.85B | $39.97B | $36.15B | $5.75B |
| EBITDA | $169.01B | $93.41B | $118.52B | $134.50B | $18.62B |
| EBITDA Ratio | 24.17% | 26.63% | 35.84% | 33.37% | 33.45% |
| Operating Income | $113.81B | $67.24B | $83.09B | $102.85B | $13.60B |
| Operating Income Ratio | 16.28% | 14.84% | 26.69% | 25.28% | 23.87% |
| Total Other Income Expenses Net | $135.75B | $-49.82B | $-48.83B | $-3.90B | $-747.92M |
| Income Before Tax | $249.55B | $17.42B | $34.26B | $98.95B | $12.86B |
| Income Before Tax Ratio | 35.69% | 4.13% | 7.58% | 22.14% | 20.46% |
| Income Tax Expense | $95.92B | $7.74B | $28.64B | $60.46B | $3.42B |
| Net Income | $153.81B | $10.31B | $6.04B | $39.95B | $17.13B |
| Net Income Ratio | 22.00% | 2.44% | 1.34% | 8.94% | 27.27% |
| EPS | $263.83 | $17.66 | $10.31 | $67.48 | $28.75 |
| EPS Diluted | $263.83 | $17.66 | $10.31 | $67.48 | $28.75 |
| Weighted Average Shares Outstanding | 583.00M | 583.54M | 585.32M | 592.05M | 596.03M |
| Weighted Average Shares Outstanding Diluted | 583.00M | 583.54M | 585.32M | 592.05M | 596.03M |
| SEC Filing | Source | Source | Source | Source | Source |
| Breakdown | December 31, 2024 | September 30, 2024 | June 30, 2024 | March 31, 2024 | December 31, 2023 | September 30, 2023 | June 30, 2023 | March 31, 2023 | December 31, 2022 |
|---|---|---|---|---|---|---|---|---|---|
| Revenue | $174.17B | $180.69B | $169.13B | $136.17B | $211.60B | $229.22B | $234.74B | $186.67B | $231.80B |
| Cost of Revenue | $117.44B | $139.91B | $123.82B | $101.82B | $157.87B | $175.92B | $178.36B | $135.51B | $169.59B |
| Gross Profit | $56.73B | $40.77B | $45.31B | $34.35B | $53.74B | $53.31B | $56.38B | $51.15B | $62.21B |
| Gross Profit Ratio | 32.57% | 22.60% | 27.00% | 25.30% | 25.40% | 23.30% | 23.70% | 27.50% | 26.70% |
| Research and Development Expenses | $- | $- | $- | $- | $- | $- | $- | $- | $- |
| General and Administrative Expenses | $- | $- | $15.39B | $13.93B | $18.82B | $- | $20.88B | $14.48B | $18.93B |
| Selling and Marketing Expenses | $- | $- | $723.44M | $1.69B | $1.07B | $- | $1.02B | $2.25B | $1.07B |
| Selling General and Administrative Expenses | $20.85B | $16.57B | $16.12B | $15.62B | $19.88B | $19.03B | $21.90B | $16.74B | $20.01B |
| Other Expenses | $- | $- | $- | $- | $- | $- | $- | $- | $- |
| Operating Expenses | $20.85B | $16.57B | $16.12B | $15.62B | $19.88B | $19.03B | $21.90B | $16.74B | $20.01B |
| Cost and Expenses | $138.29B | $156.48B | $139.94B | $117.44B | $177.75B | $194.94B | $200.26B | $152.25B | $189.60B |
| Interest Income | $- | $- | $- | $- | $- | $- | $- | $- | $- |
| Interest Expense | $- | $- | $- | $- | $- | $- | $- | $- | $- |
| Depreciation and Amortization | $12.12B | $20.64B | $15.32B | $9.80B | $14.62B | $21.63B | $17.13B | $12.62B | $19.30B |
| EBITDA | $46.09B | $44.22B | $42.40B | $27.06B | $45.90B | $54.27B | $48.76B | $45.04B | $59.43B |
| EBITDA Ratio | 26.46% | 37.06% | 57.31% | 108.12% | 58.68% | 61.90% | 43.50% | 46.44% | 43.89% |
| Operating Income | $35.89B | $24.21B | $29.19B | $18.73B | $33.85B | $34.28B | $34.48B | $34.41B | $42.20B |
| Operating Income Ratio | 20.60% | 12.39% | 53.78% | 99.35% | 51.33% | 54.03% | 35.68% | 38.42% | 16.79% |
| Total Other Income Expenses Net | $1.52B | $11.98B | $35.16B | $77.11B | $-42.43B | $-6.53B | $-13.77B | $-2.55B | $-9.84B |
| Income Before Tax | $37.40B | $36.18B | $64.36B | $95.84B | $-8.58B | $27.75B | $20.71B | $31.86B | $32.36B |
| Income Before Tax Ratio | 21.48% | 20.02% | 34.55% | 70.38% | -4.05% | 12.11% | 7.94% | 17.07% | 27.38% |
| Income Tax Expense | $15.29B | $15.03B | $23.89B | $35.73B | $1.23B | $4.57B | $7.63B | $7.91B | $15.27B |
| Net Income | $22.42B | $20.93B | $40.52B | $60.18B | $-9.32B | $22.86B | $13.54B | $24.24B | $16.94B |
| Net Income Ratio | 12.87% | 11.58% | 21.77% | 44.19% | -4.41% | 9.97% | 5.00% | 12.99% | 19.87% |
| EPS | $38.45 | $35.87 | $69.45 | $86.98 | $-15.98 | $39.21 | $23.21 | $35.04 | $28.77 |
| EPS Diluted | $38.45 | $35.87 | $69.45 | $86.98 | $-15.98 | $39.21 | $23.21 | $35.04 | $28.77 |
| Weighted Average Shares Outstanding | 583.00M | 583.47M | 583.48M | 583.00M | 583.48M | 583.00M | 583.41M | 584.00M | 588.68M |
| Weighted Average Shares Outstanding Diluted | 583.00M | 583.47M | 583.48M | 583.00M | 583.48M | 583.00M | 583.41M | 584.00M | 588.68M |
| SEC Filing | Source | Source | Source | Source | Source | Source | Source | Source | Source |
Annual Balance Sheet
| Breakdown | December 31, 2024 | December 31, 2023 | December 31, 2022 | December 31, 2021 | December 31, 2020 |
|---|---|---|---|---|---|
| Cash and Cash Equivalents | $7.97B | $5.02B | $2.07B | $644.24M | $402.45M |
| Short Term Investments | $578.00M | $1.71B | $13.22B | $9.62B | $6.20B |
| Cash and Short Term Investments | $8.55B | $6.73B | $15.29B | $10.27B | $6.60B |
| Net Receivables | $49.25B | $29.56B | $29.60B | $8.57B | $4.51B |
| Inventory | $201.76B | $76.49B | $63.54B | $16.94B | $8.29B |
| Other Current Assets | $13.83B | $14.96B | $17.09B | $1.46B | $1.84B |
| Total Current Assets | $273.40B | $127.73B | $125.52B | $37.24B | $21.24B |
| Property Plant Equipment Net | $1.06T | $484.67B | $481.19B | $158.96B | $81.52B |
| Goodwill | $692.00M | $317.88M | $317.88M | $102.08M | $52.40M |
| Intangible Assets | $2.90B | $1.59B | $1.46B | $563.12M | $290.31M |
| Goodwill and Intangible Assets | $3.59B | $1.90B | $1.78B | $665.19M | $342.71M |
| Long Term Investments | $69.00M | $31.87M | $31.87M | $10.23M | $5.25M |
| Tax Assets | $- | $- | $- | $- | $- |
| Other Non-Current Assets | $73.90B | $24.50B | $23.30B | $7.36B | $3.98B |
| Total Non-Current Assets | $1.13T | $511.11B | $506.31B | $167.00B | $85.84B |
| Other Assets | $- | $- | $- | $- | $- |
| Total Assets | $1.41T | $638.84B | $631.83B | $204.24B | $107.09B |
| Account Payables | $93.59B | $44.88B | $41.92B | $8.80B | $5.27B |
| Short Term Debt | $102.07B | $38.44B | $34.79B | $4.27B | $7.11B |
| Tax Payables | $- | $2.95B | $9.08B | $6.52B | $4.35B |
| Deferred Revenue | $- | $- | $- | $- | $- |
| Other Current Liabilities | $72.16B | $31.09B | $44.21B | $12.82B | $6.33B |
| Total Current Liabilities | $267.82B | $117.36B | $130.00B | $32.40B | $23.06B |
| Long Term Debt | $72.02B | $112.92B | $33.21B | $1.23B | $3.41B |
| Deferred Revenue Non-Current | $- | $- | $- | $- | $- |
| Deferred Tax Liabilities Non-Current | $- | $- | $- | $- | $- |
| Other Non-Current Liabilities | $275.37B | $114.35B | $107.55B | $29.36B | $12.10B |
| Total Non-Current Liabilities | $347.39B | $227.26B | $140.75B | $30.59B | $15.51B |
| Other Liabilities | $- | $- | $- | $- | $- |
| Total Liabilities | $615.21B | $344.62B | $270.76B | $63.00B | $38.57B |
| Preferred Stock | $- | $- | $- | $- | $- |
| Common Stock | $264.41B | $58.35M | $59.60M | $59.60M | $59.60M |
| Retained Earnings | $153.81B | $172.19B | $242.24B | $101.22B | $45.38B |
| Accumulated Other Comprehensive Income Loss | $375.13B | $58.00B | $58.71B | $18.78B | $9.57B |
| Other Total Stockholders Equity | $- | $63.98B | $59.45B | $20.86B | $13.10B |
| Total Stockholders Equity | $793.34B | $294.24B | $360.46B | $140.92B | $68.10B |
| Total Equity | $793.12B | $294.22B | $361.07B | $141.24B | $68.51B |
| Total Liabilities and Stockholders Equity | $1.41T | $638.84B | $631.83B | $204.24B | $107.09B |
| Minority Interest | $-222.00M | $-17.96M | $606.69M | $326.62M | $409.38M |
| Total Liabilities and Total Equity | $1.41T | $638.84B | $631.83B | $204.24B | $107.09B |
| Total Investments | $647.00M | $1.74B | $13.26B | $9.63B | $6.21B |
| Total Debt | $174.09B | $151.36B | $68.00B | $5.50B | $10.52B |
| Net Debt | $166.11B | $146.33B | $65.93B | $4.86B | $10.12B |
Balance Sheet Charts
| Breakdown | December 31, 2024 | September 30, 2024 | June 30, 2024 | March 31, 2024 | December 31, 2023 | September 30, 2023 | June 30, 2023 | March 31, 2023 | December 31, 2022 |
|---|---|---|---|---|---|---|---|---|---|
| Cash and Cash Equivalents | $7.97B | $7.92B | $2.85B | $3.93B | $5.02B | $11.76B | $23.60B | $1.28B | $2.07B |
| Short Term Investments | $578.00M | $5.79B | $228.04M | $1.88B | $1.71B | $9.15B | $493.33M | $18.14B | $13.22B |
| Cash and Short Term Investments | $8.55B | $13.72B | $3.08B | $5.81B | $6.73B | $20.91B | $24.09B | $19.42B | $15.29B |
| Net Receivables | $49.25B | $60.03B | $54.14B | $35.35B | $29.56B | $18.98B | $14.95B | $11.30B | $29.60B |
| Inventory | $201.76B | $166.07B | $165.85B | $139.59B | $76.49B | $44.40B | $35.05B | $24.98B | $63.54B |
| Other Current Assets | $13.83B | $8.50B | $8.98B | $20.57B | $14.96B | $9.92B | $2.81B | $5.80B | $17.09B |
| Total Current Assets | $273.40B | $248.31B | $232.05B | $201.31B | $127.73B | $94.21B | $76.90B | $61.50B | $125.52B |
| Property Plant Equipment Net | $1.06T | $972.77B | $867.37B | $731.15B | $484.67B | $309.29B | $229.39B | $186.51B | $481.19B |
| Goodwill | $692.00M | $640.78M | $571.46M | $481.97M | $317.88M | $207.37M | $153.81M | $124.26M | $317.88M |
| Intangible Assets | $2.90B | $2.66B | $2.50B | $2.19B | $1.59B | $984.66M | $757.26M | $553.22M | $1.46B |
| Goodwill and Intangible Assets | $3.59B | $3.30B | $3.07B | $2.67B | $1.90B | $1.19B | $911.08M | $677.48M | $1.78B |
| Long Term Investments | $69.00M | $64.24M | $57.29M | $48.32M | $31.87M | $20.79M | $15.42M | $12.46M | $31.87M |
| Tax Assets | $- | $- | $- | $- | $- | $- | $- | $- | $- |
| Other Non-Current Assets | $73.90B | $67.44B | $52.85B | $38.50B | $24.50B | $16.02B | $12.07B | $10.71B | $23.30B |
| Total Non-Current Assets | $1.13T | $1.04T | $923.36B | $772.36B | $511.11B | $326.52B | $242.39B | $197.91B | $506.31B |
| Other Assets | $- | $- | $- | $- | $- | $- | $- | $- | $- |
| Total Assets | $1.41T | $1.29T | $1.16T | $973.68B | $638.84B | $420.73B | $319.29B | $259.41B | $631.83B |
| Account Payables | $93.59B | $52.02B | $50.01B | $53.08B | $44.88B | $21.05B | $18.45B | $12.97B | $41.92B |
| Short Term Debt | $102.07B | $51.59B | $77.48B | $67.21B | $38.44B | $52.41B | $23.36B | $9.19B | $34.79B |
| Tax Payables | $- | $44.79B | $32.36B | $7.93B | $2.95B | $4.49B | $2.76B | $3.02B | $- |
| Deferred Revenue | $- | $- | $- | $- | $- | $- | $- | $- | $- |
| Other Current Liabilities | $72.16B | $44.54B | $30.34B | $40.55B | $31.09B | $18.22B | $25.92B | $11.40B | $53.29B |
| Total Current Liabilities | $267.82B | $192.94B | $190.19B | $168.78B | $117.36B | $96.16B | $70.50B | $36.59B | $130.00B |
| Long Term Debt | $72.02B | $137.05B | $126.55B | $119.94B | $112.92B | $45.48B | $49.81B | $34.28B | $33.21B |
| Deferred Revenue Non-Current | $- | $- | $- | $- | $- | $- | $- | $- | $- |
| Deferred Tax Liabilities Non-Current | $- | $- | $- | $- | $- | $- | $- | $- | $- |
| Other Non-Current Liabilities | $275.37B | $247.21B | $220.31B | $188.46B | $114.35B | $74.13B | $52.53B | $42.16B | $107.55B |
| Total Non-Current Liabilities | $347.39B | $384.26B | $346.87B | $308.41B | $227.26B | $119.61B | $102.34B | $76.44B | $140.75B |
| Other Liabilities | $- | $- | $- | $- | $- | $- | $- | $- | $- |
| Total Liabilities | $615.21B | $577.21B | $537.06B | $477.18B | $344.62B | $215.77B | $172.84B | $113.03B | $270.76B |
| Preferred Stock | $- | $- | $- | $- | $- | $- | $- | $- | $- |
| Common Stock | $264.41B | $58.35M | $58.35M | $58.35M | $58.35M | $58.35M | $58.35M | $59.60M | $59.60M |
| Retained Earnings | $153.81B | $468.74B | $399.36B | $311.84B | $172.19B | $125.24B | $87.40B | $99.97B | $242.24B |
| Accumulated Other Comprehensive Income Loss | $375.13B | $116.80B | $104.02B | $87.64B | $58.00B | $37.67B | $27.92B | $22.89B | $58.71B |
| Other Total Stockholders Equity | $- | $129.01B | $115.05B | $97.03B | $63.98B | $41.73B | $30.95B | $23.30B | $59.45B |
| Total Stockholders Equity | $793.34B | $714.60B | $618.49B | $496.57B | $294.24B | $204.70B | $146.33B | $146.21B | $360.46B |
| Total Equity | $793.12B | $714.67B | $618.35B | $496.49B | $294.22B | $204.96B | $146.45B | $146.38B | $361.07B |
| Total Liabilities and Stockholders Equity | $1.41T | $1.29T | $1.16T | $973.68B | $638.84B | $420.73B | $319.29B | $259.41B | $631.83B |
| Minority Interest | $-222.00M | $70.85M | $-136.40M | $-76.73M | $-17.96M | $254.43M | $113.05M | $173.08M | $606.69M |
| Total Liabilities and Total Equity | $1.41T | $1.29T | $1.16T | $973.68B | $638.84B | $420.73B | $319.29B | $259.41B | $631.83B |
| Total Investments | $647.00M | $5.86B | $285.34M | $1.93B | $1.74B | $9.17B | $508.75M | $18.15B | $13.26B |
| Total Debt | $174.09B | $188.65B | $204.04B | $187.15B | $151.36B | $97.89B | $73.17B | $43.48B | $68.00B |
| Net Debt | $166.11B | $180.72B | $201.18B | $183.22B | $146.33B | $86.13B | $49.57B | $42.20B | $65.93B |
Annual Cash Flow
| Breakdown | December 31, 2024 | December 31, 2023 | December 31, 2022 | December 31, 2021 | December 31, 2020 |
|---|---|---|---|---|---|
| Net Income | $153.81B | $10.31B | $6.04B | $39.95B | $17.13B |
| Depreciation and Amortization | $62.63B | $32.19B | $41.35B | $36.15B | $6.02B |
| Deferred Income Tax | $- | $- | $- | $- | $- |
| Stock Based Compensation | $683.00M | $395.93M | $197.24M | $241.85M | $- |
| Change in Working Capital | $-65.00B | $-29.77B | $-33.57B | $-7.37B | $2.25B |
| Accounts Receivables | $-39.85B | $-25.05B | $-22.25B | $-9.05B | $-817.25M |
| Inventory | $-46.09B | $-14.58B | $-9.86B | $1.75B | $1.19B |
| Accounts Payables | $- | $- | $- | $- | $- |
| Other Working Capital | $20.94B | $9.85B | $-1.46B | $-61.90M | $1.87B |
| Other Non Cash Items | $-27.40B | $71.91B | $83.65B | $22.32B | $-6.95B |
| Net Cash Provided by Operating Activities | $124.72B | $85.03B | $97.66B | $91.29B | $18.45B |
| Investments in Property Plant and Equipment | $-73.05B | $-36.05B | $-31.77B | $-43.00B | $-14.55B |
| Acquisitions Net | $- | $- | $- | $- | $- |
| Purchases of Investments | $- | $- | $- | $- | $- |
| Sales Maturities of Investments | $- | $- | $- | $- | $- |
| Other Investing Activities | $154.00M | $227.80M | $17.09B | $-10.66B | $12.18B |
| Net Cash Used for Investing Activities | $-72.89B | $-35.83B | $-14.69B | $-53.65B | $-2.36B |
| Debt Repayment | $13.92B | $100.13B | $11.14B | $-35.20B | $-7.44B |
| Common Stock Issued | $- | $- | $- | $- | $- |
| Common Stock Repurchased | $-595.00M | $- | $-5.60B | $-14.48B | $- |
| Dividends Paid | $- | $-86.84B | $-67.90B | $- | $-4.02B |
| Other Financing Activities | $-61.59B | $-54.37B | $-14.81B | $-3.46B | $-8.27B |
| Net Cash Used Provided by Financing Activities | $-48.27B | $-41.09B | $-77.17B | $-53.14B | $-19.74B |
| Effect of Forex Changes on Cash | $363.00M | $6.54B | $710.34M | $6.80B | $4.98B |
| Net Change in Cash | $1.82B | $-8.56B | $-4.76B | $13.45B | $3.92B |
| Cash at End of Period | $8.55B | $6.73B | $15.29B | $20.05B | $6.60B |
| Cash at Beginning of Period | $6.73B | $15.29B | $20.05B | $6.60B | $2.68B |
| Operating Cash Flow | $124.72B | $85.03B | $97.66B | $91.29B | $18.45B |
| Capital Expenditure | $-73.05B | $-36.05B | $-31.77B | $-43.00B | $-14.55B |
| Free Cash Flow | $51.67B | $48.98B | $65.89B | $48.30B | $3.90B |
Cash Flow Charts
| Breakdown | December 31, 2024 | September 30, 2024 | June 30, 2024 | March 31, 2024 | December 31, 2023 | September 30, 2023 | June 30, 2023 | March 31, 2023 | December 31, 2022 |
|---|---|---|---|---|---|---|---|---|---|
| Net Income | $22.42B | $20.93B | $40.52B | $60.18B | $-9.32B | $22.86B | $13.54B | $24.24B | $16.94B |
| Depreciation and Amortization | $12.12B | $21.00B | $15.68B | $10.07B | $15.56B | $21.63B | $17.13B | $12.62B | $20.68B |
| Deferred Income Tax | $- | $- | $- | $- | $- | $- | $- | $- | $- |
| Stock Based Compensation | $257.00M | $- | $180.96M | $213.23M | $289.32M | $- | $76.41M | $253.00M | $80.86M |
| Change in Working Capital | $-9.97B | $1.64B | $-24.39B | $-28.19B | $-14.66B | $-25.99B | $-11.41B | $-9.29B | $-17.88B |
| Accounts Receivables | $93.00M | $-9.17B | $-12.57B | $-15.24B | $-10.70B | $-22.59B | $-12.10B | $-9.63B | $-11.31B |
| Inventory | $-20.87B | $8.80B | $-10.01B | $-22.14B | $-10.18B | $4.40B | $-10.73B | $-7.24B | $-6.52B |
| Accounts Payables | $- | $- | $- | $- | $- | $- | $- | $- | $- |
| Other Working Capital | $10.80B | $2.01B | $-1.81B | $9.19B | $6.22B | $-7.80B | $11.43B | $7.59B | $-48.63M |
| Other Non Cash Items | $22.95B | $20.83B | $-17.43B | $-50.01B | $54.78B | $34.60B | $25.64B | $-7.31B | $36.99B |
| Net Cash Provided by Operating Activities | $47.78B | $64.40B | $14.56B | $-7.73B | $46.65B | $53.10B | $44.98B | $20.52B | $56.81B |
| Investments in Property Plant and Equipment | $-21.34B | $-21.17B | $-17.90B | $-8.80B | $-24.10B | $-17.75B | $-12.17B | $-7.00B | $-22.72B |
| Acquisitions Net | $- | $- | $- | $- | $- | $- | $- | $- | $- |
| Purchases of Investments | $- | $- | $- | $- | $- | $- | $- | $- | $- |
| Sales Maturities of Investments | $- | $- | $- | $- | $- | $- | $- | $- | $- |
| Other Investing Activities | $-94.00M | $293.98M | $-329.33M | $264.93M | $-290.88M | $2.05B | $-631.85M | $182.56M | $11.55B |
| Net Cash Used for Investing Activities | $-21.43B | $-20.88B | $-18.23B | $-8.53B | $-24.39B | $-15.70B | $-12.80B | $-6.82B | $-11.17B |
| Debt Repayment | $-25.01B | $-17.72B | $18.71B | $35.05B | $-136.02B | $50.37B | $109.90B | $75.89B | $-41.32B |
| Common Stock Issued | $- | $- | $- | $- | $- | $- | $- | $- | $- |
| Common Stock Repurchased | $-44.37M | $-59.57M | $-76.89M | $-414.16M | $- | $- | $- | $- | $-3.52B |
| Dividends Paid | $- | $- | $- | $- | $-30.20B | $-67.27B | $-91.23B | $-16.53B | $-23.61B |
| Other Financing Activities | $-6.14B | $-14.94B | $-17.77B | $-18.59B | $131.38B | $-39.77B | $-27.15B | $-13.51B | $26.59B |
| Net Cash Used Provided by Financing Activities | $-31.19B | $-32.72B | $862.21M | $16.05B | $-34.84B | $-56.67B | $-8.48B | $45.84B | $-41.85B |
| Effect of Forex Changes on Cash | $-226.00M | $151.52M | $109.13M | $285.19M | $4.80B | $2.75B | $2.06B | $571.24M | $462.56M |
| Net Change in Cash | $-5.17B | $10.64B | $-2.73B | $-923.43M | $-57.88B | $-24.90B | $14.19B | $60.03B | $7.04B |
| Cash at End of Period | $8.55B | $13.72B | $3.08B | $5.81B | $6.73B | $64.61B | $89.51B | $75.32B | $15.29B |
| Cash at Beginning of Period | $13.72B | $3.08B | $5.81B | $6.73B | $64.61B | $89.51B | $75.32B | $15.29B | $8.26B |
| Operating Cash Flow | $47.78B | $64.40B | $14.56B | $-7.73B | $46.65B | $53.10B | $44.98B | $20.52B | $56.81B |
| Capital Expenditure | $-21.34B | $-21.17B | $-17.90B | $-8.80B | $-24.10B | $-17.75B | $-12.17B | $-7.00B | $-22.72B |
| Free Cash Flow | $26.44B | $43.23B | $-3.34B | $-16.53B | $22.54B | $35.35B | $32.81B | $13.52B | $34.09B |
Loma Negra Compañía Industrial Argentina Sociedad Anónima Dividends
Explore Loma Negra Compañía Industrial Argentina Sociedad Anónima's dividend history, including dividend yield, payout ratio, and historical payments.
Dividend Yield
10.68%
Dividend Payout Ratio
842.73%
Dividend Paid & Capex Coverage Ratio
0.69x
Loma Negra Compañía Industrial Argentina Sociedad Anónima Dividend History
| Dividend | Adjusted Dividend | Date | Record Date | Payment Date | Declaration Date |
|---|---|---|---|---|---|
| $0.46482 | $0.46482 | June 30, 2023 | July 03, 2023 | July 12, 2023 | June 23, 2023 |
| $0.401 | $0.401 | May 12, 2023 | May 15, 2023 | May 18, 2023 | |
| $0.16 | $0.17193 | January 05, 2023 | January 06, 2023 | January 17, 2023 | December 27, 2022 |
Loma Negra Compañía Industrial Argentina Sociedad Anónima News
Read the latest news about Loma Negra Compañía Industrial Argentina Sociedad Anónima, including recent articles, headlines, and updates.
Loma Negra: Argentina's Cement Market Is Bleeding
Loma Negra Compañía Industrial Argentina Sociedad Anónima's Q4 results highlight a 15% YOY decline in cement volumes, reflecting Argentina's severe recession and weak construction sector. Despite flat adjusted EBITDA from aggressive pricing, the business remains fragile with no concrete recovery signs, making the stock unattractive at over 50x earnings. The company's reported debt reduction is misleading due to accounting adjustments; real debt levels remain unchanged in dollar terms.

Loma Negra Compañía Industrial Argentina Sociedad Anónima (LOMA) Q4 2024 Earnings Call Transcript
Loma Negra Compañía Industrial Argentina Sociedad Anónima (NYSE:LOMA ) Q4 2024 Earnings Conference Call March 7, 2025 10:00 AM ET Company Participants Diego Jalón - Head-Investor Relations Sergio Faifman - Chief Executive Officer Marcos Gradin - Chief Financial Officer Conference Call Participants Alejandra Obregon - Morgan Stanley Marcelo Furlan - Itau BBA Daniel Rojas - Bank of America Esteban Arietta - Balanz Operator Good morning, and welcome to the Loma Negra Fourth Quarter 2024 Conference Call and Webcast. All participants will be in listen-only mode.

Loma Negra Reports 4Q24 Results
BUENOS AIRES, ARGENTINA / ACCESS Newswire / March 6, 2025 / Loma Negra, (NYSE:LOMA)(BYMA:LOMA), ("Loma Negra" or the "Company"), the leading cement producer in Argentina, today announced results for the three-month period ended December 31, 2024 (our "4Q24 Results"). FY24 Key Highlights Net revenues reached Ps.


Stock Picks From Seeking Alpha's November 2024 New Analysts
Twenty-six new analysts joined Seeking Alpha in November, sharing diverse investment ideas highlighting their unique backgrounds and expertise. Top picks include U.S. Bancorp Preferred Series A, Hershey, and PepsiCo, emphasizing undervalued opportunities, dividend stability, and strategic growth potential. Analysts also spotlighted strong sell recommendations like BlackRock Science and Technology Trust and Luckin Coffee, citing fundamental flaws and competitive disadvantages.
Loma Negra Compañía Industrial Argentina Sociedad Anónima (LOMA) Q3 2024 Earnings Call Transcript
Loma Negra Compañía Industrial Argentina Sociedad Anónima (NYSE:LOMA ) Q3 2024 Results Conference Call November 7, 2024 11:00 AM ET Company Participants Diego Jalón - Head-Investor Relations Sergio Faifman - Chief Executive Officer Marcos Gradin - Chief Financial Officer Conference Call Participants Marina Mertens - Latin Securities Marcelo Furlan - Itau BBA Esteban Arietta - Balanz Daniel Rojas - Bank of America Operator Good morning, and welcome to the Loma Negra Third Quarter 2024 Conference Call and webcast. All participants will be in a listen-only mode.

Loma Negra: A Great Opportunity To Take Advantage Of The Argentine Economic Cycle
Loma is closely tied to Argentina's economic cycles, showing resilience with a 28.1% EBITDA margin despite a 33% YoY drop in net sales. Argentina's economic reforms under President Milei, including FX unification and fiscal adjustments, are expected to benefit LOMA, especially with increased private sector investments. LOMA's valuation, based on a DCF model with a 14% WACC, suggests potential growth, reflecting Argentina's long-term economic stability and recovery prospects.

Want To Invest In Argentina's Comeback? Buy Loma Negra
Argentina's economy is showing signs of recovery under President Javier Milei, who has implemented strict fiscal policies to curb overspending and inflation. Loma Negra, Argentina's largest cement producer, is well-positioned to benefit from the country's economic turnaround due to its market dominance and strong profit margin. The company's strong balance sheet and increased gross margins, despite economic challenges, highlight its resilience and potential for growth in a recovering economy.


Loma Negra Is Feeling The Argentinian Recession; The Stock Is Not An Opportunity
Loma Negra's 2Q24 results were poor, with a 30% drop in sold volumes, halted production, and a challenging Argentinian macroeconomy impacting performance. Despite the downturn, margins improved due to cost-cutting measures, but the long-term viability of halted production is questionable. Brazilian controller Intercement's financial troubles and potential sale of Loma's stake could spur interest from strategic players, but not likely to affect stock price.

Loma Negra Compañía Industrial Argentina Sociedad Anónima (LOMA) Q2 2024 Earnings Call Transcript
Loma Negra Compañía Industrial Argentina Sociedad Anónima (NYSE:LOMA ) Q2 2024 Earnings Conference Call August 8, 2024 10:00 AM ET Company Participants Diego Jalón – Head-Investor Relations Sergio Faifman – Chief Executive Officer Marcos Gradin – Chief Financial Officer Conference Call Participants Alberto Valerio – UBS Alejandra Obregon – Morgan Stanley Operator Good morning and welcome to the Loma Negra Second Quarter 2024 Conference Call And Webcast. All participants will be in a listen-only mode.

Loma Negra Compañía Industrial Argentina Sociedad Anónima (LOMA) Q1 2024 Earnings Call Transcript
Loma Negra Compañía Industrial Argentina Sociedad Anónima (NYSE:LOMA ) Q1 2024 Earnings Conference Call May 10, 2023 10:00 AM ET Company Participants Diego Jalon - Head of IR Sergio Faifman - CEO Marcos Gradin - CFO Conference Call Participants Alejandra Obregon - Alejandra Obregon Pedro Maulhardt - Latin Securities Daniel Rojas - Bank of America Operator Good morning, and welcome to the Loma Negra, First Quarter 2024 Conference Call and Webcast. All participants will be in listen-only mode.

Loma Negra Reports 1Q24 Results
BUENOS AIRES, ARGENTINA / ACCESSWIRE / May 9, 2024 / Loma Negra, (NYSE:LOMA)(BYMA:LOMA), ("Loma Negra" or the "Company"), the leading cement producer in Argentina, today announced results for the three-month period ended March 31, 2024 (our "1Q24 Results"). 1Q24 Key Highlights Net sales revenues stood at Ps.

Loma Negra Files Its Annual Report on Form 20-F
BUENOS AIRES, ARGENTINA / ACCESSWIRE / April 29, 2024 / Loma Negra (NYSE:LOMA)(BYMA:LOMA) ("Loma Negra" or the "Company"), the leading cement producer in Argentina, today announced that the Company filed its annual report for the fiscal year ended December 31, 2023 on Form 20-F (the "2023 Annual Report") with the U.S. Securities and Exchange Commission (the "SEC"). The 2023 Annual Report and audited financial statements can be accessed by visiting either the SEC's website at www.sec.gov or the Company's website at www.lomanegra.com.


Loma Negra Compañía Industrial Argentina Sociedad Anónima ADS EACH REPR 5 ORD SHS SPON (USD) (LOMA) Q4 2023 Earnings Call Transcript
Loma Negra Compañía Industrial Argentina Sociedad Anónima ADS EACH REPR 5 ORD SHS SPON (USD) (NYSE:LOMA ) Q4 2023 Earnings Call Transcript March 7, 2024 10:00 AM ET Company Participants Diego Jalon - Head of IR Sergio Faifman - CEO and VP of Board of Directors Marcos Gradin - CFO Conference Call Participants Daniel Rojas - Bank of America Jorge Vinas - Latin Securities Diego Jalon Thank you. Good morning and welcome to the Loma Negra's Earnings Conference Call.


Loma Negra Reports 4Q23 Results
BUENOS AIRES, ARGENTINA / ACCESSWIRE / March 6, 2024 / Loma Negra, (NYSE:LOMA)(BYMA:LOMA), ("Loma Negra" or the "Company"), the leading cement producer in Argentina, today announced results for the three-month period ended December 31, 2023 (our "4Q23 Results"). FY23 Key Highlights Net revenues decreased 6.6% YoY to Ps.


Loma Negra: A Speculative Play On Argentinian Income Recovery (Rating Upgrade)
Loma Negra, the largest cement manufacturer in Argentina, has seen its operating income fall due to price repression and currency depreciation. The company's profitability might be explained by real estate prices in Argentina, which have been in a downward trend since 2017-18. Despite the current challenges, LOMA has strong financials and the potential for income growth, making it an opportunity for investors.

Similar Companies
Related Metrics
Explore detailed financial metrics and analysis for LOMA.