LATAM Airlines Group S.A Key Executives
This section highlights LATAM Airlines Group S.A's key executives, including their titles and compensation details.
Find Contacts at LATAM Airlines Group S.A
(Showing 0 of )
LATAM Airlines Group S.A Earnings
This section highlights LATAM Airlines Group S.A's earnings, including key dates, EPS, earnings reports, and earnings call transcripts.
Next Earnings Date
Last Earnings Results
Earnings Call Transcripts
| Transcript | Quarter | Year | Date | Estimated EPS | Actual EPS |
|---|---|---|---|---|---|
| Read Transcript | Q4 | 2024 | 2025-01-31 | N/A | N/A |
| Read Transcript | Q1 | 2024 | 2024-05-03 | $0.28 | $0.00 |

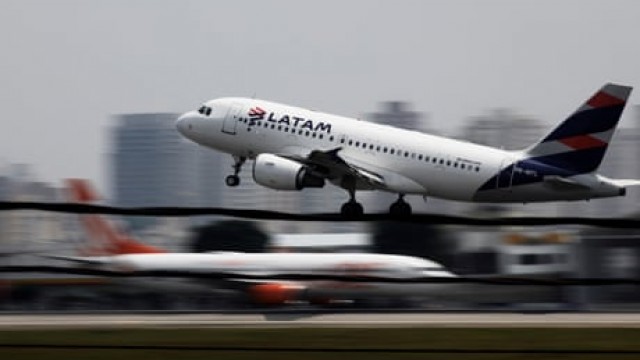
LATAM Airlines Group S.A., together with its subsidiaries, provides passenger and cargo air transportation services primarily in Chile, Peru, Ecuador, Colombia, Brazil, other Latin American countries, the Caribbean, North America, Europe, and Oceania. As of June 30, 2022, it provided passenger transport services to 133 destinations in 20 countries and cargo services to approximately 141 destinations in 23 countries, with an operating fleet of 300 aircraft and subleased one B767 cargo freighter to a third party. The company was formerly known as LAN Airlines S.A. and changed its name to LATAM Airlines Group S.A. in June 2012. LATAM Airlines Group S.A. was founded in 1929 and is headquartered in Santiago, Chile.
$0.05
Stock Price
$15.11M
Market Cap
37.35K
Employees
Santiago de Chile, None
Location
Financial Statements
Access annual & quarterly financial statements for LATAM Airlines Group S.A, including income statements, balance sheets, and cash flow statements..
Annual Income Statement
| Breakdown | December 31, 2023 | December 31, 2022 | December 31, 2021 | December 31, 2020 | December 31, 2019 |
|---|---|---|---|---|---|
| Revenue | $11.64B | $9.52B | $4.88B | $4.33B | $10.07B |
| Cost of Revenue | $8.87B | $7.03B | $4.96B | $4.78B | $7.95B |
| Gross Profit | $2.77B | $2.48B | $-79.47M | $-444.11M | $2.12B |
| Gross Profit Ratio | 23.80% | 26.11% | -1.60% | -10.25% | 21.04% |
| Research and Development Expenses | $- | $- | $- | $- | $- |
| General and Administrative Expenses | $683.31M | $1.21B | $439.49M | $499.51M | $735.22M |
| Selling and Marketing Expenses | $587.27M | $426.60M | $291.82M | $294.28M | $580.05M |
| Selling General and Administrative Expenses | $1.22B | $1.21B | $731.31M | $793.79M | $1.32B |
| Other Expenses | $-384.16M | $1.14B | $271.35M | $427.39M | $153.11M |
| Operating Expenses | $1.60B | $2.35B | $1.00B | $1.22B | $1.47B |
| Cost and Expenses | $10.47B | $9.38B | $5.97B | $6.00B | $9.42B |
| Interest Income | $- | $1.05B | $21.11M | $50.40M | $26.28M |
| Interest Expense | $708.37M | $942.40M | $748.02M | $586.98M | $569.44M |
| Depreciation and Amortization | $1.21B | $1.18B | $1.17B | $1.39B | $1.47B |
| EBITDA | $2.37B | $2.54B | $-1.13B | $-4.52B | $743.93M |
| EBITDA Ratio | 20.40% | 26.74% | -23.15% | -104.25% | 7.39% |
| Operating Income | $1.17B | $1.50B | $-3.43B | $-1.67B | $753.13M |
| Operating Income Ratio | 10.04% | 15.72% | -70.14% | -38.42% | 7.48% |
| Total Other Income Expenses Net | $-520.84M | $1.19B | $-3.00B | $-3.33B | $-611.21M |
| Income Before Tax | $596.49M | $1.60B | $-4.08B | $-5.11B | $141.92M |
| Income Before Tax Ratio | 5.12% | 16.84% | -83.62% | -117.79% | 1.41% |
| Income Tax Expense | $14.94M | $8.91M | $568.93M | $-550.19M | $-53.70M |
| Net Income | $581.83M | $1.34B | $-4.65B | $-4.56B | $190.43M |
| Net Income Ratio | 5.00% | 14.07% | -95.27% | -105.10% | 1.89% |
| EPS | $0.00 | $0.01 | $-0.42 | $-0.42 | $0.02 |
| EPS Diluted | $0.00 | $0.01 | $-0.42 | $-0.42 | $0.02 |
| Weighted Average Shares Outstanding | 604.44B | 96.61B | 10.95B | 10.95B | 10.95B |
| Weighted Average Shares Outstanding Diluted | 604.44B | 98.53B | 10.95B | 10.95B | 10.95B |
| SEC Filing | Source | Source | Source | Source | Source |
| Breakdown | June 30, 2024 | March 31, 2024 | December 31, 2023 | September 30, 2023 | June 30, 2023 | March 31, 2023 | December 31, 2022 | September 30, 2022 | June 30, 2022 | March 31, 2022 | December 31, 2021 | September 30, 2021 | June 30, 2021 | March 31, 2021 | December 31, 2020 | September 30, 2020 | June 30, 2020 | March 31, 2020 | December 31, 2019 | September 30, 2019 |
|---|---|---|---|---|---|---|---|---|---|---|---|---|---|---|---|---|---|---|---|---|
| Revenue | $3.02B | $3.27B | $3.21B | $3.02B | $2.68B | $2.81B | $2.74B | $2.56B | $2.23B | $1.92B | $2.00B | $1.28B | $825.85M | $842.20M | $897.53M | $405.00M | $883.35M | $2.35B | $2.87B | $2.59B |
| Cost of Revenue | $- | $2.41B | $2.44B | $2.29B | $2.08B | $2.24B | $1.90B | $2.18B | $2.07B | $1.76B | $1.67B | $1.36B | $1.02B | $1.04B | $1.19B | $798.87M | $785.81M | $1.93B | $2.17B | $1.94B |
| Gross Profit | $3.02B | $857.82M | $771.35M | $732.53M | $591.28M | $568.03M | $847.61M | $375.70M | $151.33M | $154.83M | $321.11M | $-81.14M | $-193.76M | $-201.60M | $-293.45M | $-393.87M | $97.54M | $425.05M | $703.73M | $655.45M |
| Gross Profit Ratio | 100.00% | 26.30% | 24.00% | 24.20% | 22.10% | 20.20% | 30.90% | 14.70% | 6.80% | 8.10% | 16.10% | -6.40% | -23.50% | -23.90% | -32.70% | -97.25% | 11.04% | 18.07% | 24.51% | 25.29% |
| Research and Development Expenses | $- | $- | $- | $- | $- | $- | $- | $- | $- | $- | $- | $- | $- | $- | $- | $- | $- | $- | $- | $- |
| General and Administrative Expenses | $- | $187.44M | $195.54M | $164.64M | $177.57M | $145.55M | $336.99M | $138.17M | $120.97M | $112.16M | $160.86M | $98.35M | $91.55M | $88.73M | $186.03M | $104.36M | $71.98M | $137.14M | $219.78M | $185.80M |
| Selling and Marketing Expenses | $- | $158.29M | $163.29M | $176.08M | $126.54M | $121.36M | $113.98M | $111.04M | $117.38M | $84.20M | $95.36M | $73.80M | $63.27M | $59.39M | $69.56M | $33.53M | $51.22M | $139.96M | $133.26M | $158.46M |
| Selling General and Administrative Expenses | $- | $330.21M | $348.44M | $311.21M | $304.11M | $266.91M | $336.99M | $249.21M | $224.32M | $196.36M | $256.22M | $172.15M | $154.82M | $148.13M | $255.58M | $137.89M | $123.21M | $277.11M | $353.05M | $344.26M |
| Other Expenses | $-345.00M | $-86.84M | $-119.03M | $-3.07M | $45.69M | $6.04M | $290.88M | $71.36M | $337.32M | $97.28M | $-1.38B | $-994.00K | $1.03M | $-1.22M | $-508.88M | $4.22M | $30.90M | $-1.90B | $1.31M | $22.38M |
| Operating Expenses | $-345.00M | $417.06M | $467.47M | $323.40M | $320.05M | $272.95M | $627.86M | $320.57M | $337.32M | $293.64M | $247.68M | $398.75M | $120.97M | $156.75M | $208.31M | $173.53M | $274.41M | $329.11M | $353.33M | $406.47M |
| Cost and Expenses | $345.00M | $2.83B | $2.91B | $2.62B | $2.40B | $2.51B | $2.52B | $2.50B | $2.41B | $2.06B | $1.92B | $1.76B | $1.14B | $1.20B | $1.40B | $972.40M | $1.06B | $2.26B | $2.52B | $2.34B |
| Interest Income | $31.00M | $31.45M | $29.50M | $32.67M | $45.26M | $17.92M | $1.02B | $24.26M | $5.67M | $4.56M | $6.26M | $3.02M | $4.36M | $7.47M | $8.26M | $29.10M | $5.95M | $7.09M | $10.02M | $4.06M |
| Interest Expense | $186.00M | $186.45M | $192.37M | $173.98M | $172.61M | $164.16M | $236.95M | $233.53M | $206.42M | $250.82M | $216.89M | $190.47M | $173.61M | $181.09M | $216.32M | $107.98M | $123.06M | $127.35M | $163.88M | $143.56M |
| Depreciation and Amortization | $345.00M | $332.82M | $322.95M | $316.96M | $287.40M | $278.05M | $300.36M | $303.44M | $283.46M | $292.25M | $312.53M | $290.86M | $268.80M | $293.21M | $201.47M | $606.61M | $125.25M | $258.18M | $95.52M | $357.53M |
| EBITDA | $3.02B | $773.58M | $626.83M | $438.73M | $362.19M | $310.38M | $2.95B | $-88.83M | $-315.89M | $-142.34M | $-1.30B | $-493.53M | $-324.62M | $-364.66M | $-1.00B | $-540.60M | $-679.06M | $-1.79B | $361.72M | $273.17M |
| EBITDA Ratio | 100.00% | 23.68% | 19.52% | 14.51% | 13.53% | 11.06% | 107.61% | -3.47% | -14.19% | -7.43% | -65.33% | -38.68% | -39.31% | -43.30% | -111.68% | -133.48% | -76.87% | -76.24% | 12.60% | 10.54% |
| Operating Income | $2.67B | $440.76M | $303.87M | $409.13M | $271.24M | $295.07M | $1.97B | $55.13M | $-185.99M | $-183.60M | $73.43M | $-657.13M | $-1.00B | $-450.90M | $-501.76M | $-616.90M | $-1.18B | $95.94M | $350.40M | $273.93M |
| Operating Income Ratio | 88.56% | 13.49% | 9.46% | 13.53% | 10.14% | 10.52% | 71.61% | 2.16% | -8.35% | -9.58% | 3.68% | -51.50% | -121.09% | -53.54% | -55.90% | -152.32% | -133.93% | 4.08% | 12.21% | 10.57% |
| Total Other Income Expenses Net | $-2.51B | $-119.23M | $-215.91M | $-179.73M | $-80.22M | $-129.17M | $1.99B | $-430.87M | $-318.61M | $-256.31M | $-1.59B | $-304.89M | $-814.10M | $-291.22M | $-716.95M | $-155.63M | $-558.44M | $-1.90B | $-152.55M | $-219.11M |
| Income Before Tax | $- | $275.10M | $106.06M | $264.75M | $189.57M | $146.22M | $2.72B | $-375.74M | $-522.31M | $-392.16M | $-1.52B | $-785.14M | $-1.13B | $-650.60M | $-1.22B | $-714.90M | $-1.25B | $-1.92B | $197.85M | $54.82M |
| Income Before Tax Ratio | 0.00% | 8.42% | 3.30% | 8.75% | 7.08% | 5.21% | 98.98% | -14.69% | -23.46% | -20.46% | -76.20% | -61.53% | -136.55% | -77.25% | -135.78% | -176.52% | -141.65% | -81.66% | 6.89% | 2.11% |
| Income Tax Expense | $11.00M | $15.14M | $22.41M | $-3.38M | $2.79M | $-6.88M | $97.10M | $-79.25M | $1.96M | $-10.89M | $1.23B | $-90.99M | $-355.39M | $-216.93M | $-254.40M | $-141.02M | $-357.44M | $202.68M | $-30.77M | $-32.20M |
| Net Income | $144.00M | $258.28M | $82.96M | $231.82M | $145.25M | $121.80M | $2.54B | $-296.49M | $-524.27M | $-381.26M | $-2.76B | $-691.87M | $-769.64M | $-430.87M | $-962.48M | $-573.12M | $-890.04M | $-2.12B | $227.06M | $86.27M |
| Net Income Ratio | 4.78% | 7.91% | 2.58% | 7.66% | 5.43% | 4.34% | 92.50% | -11.59% | -23.55% | -19.89% | -138.04% | -54.22% | -93.19% | -51.16% | -107.24% | -141.51% | -100.76% | -90.13% | 7.91% | 3.33% |
| EPS | $0.00 | $0.00 | $0.00 | $0.00 | $0.00 | $0.00 | $0.12 | $-0.03 | $-0.05 | $-0.04 | $-0.26 | $-0.06 | $-0.07 | $-0.04 | $-0.09 | $-0.05 | $-0.08 | $-0.20 | $0.02 | $0.01 |
| EPS Diluted | $0.00 | $0.00 | $0.00 | $0.00 | $0.00 | $0.00 | $0.12 | $-0.03 | $-0.05 | $-0.04 | $-0.25 | $-0.06 | $-0.07 | $-0.04 | $-0.09 | $-0.05 | $-0.08 | $-0.20 | $0.02 | $0.01 |
| Weighted Average Shares Outstanding | 604.44B | 604.44B | 604.44B | 604.44B | 604.44B | 604.44B | 605.23B | 10.87B | 10.87B | 10.87B | 10.71B | 10.87B | 10.87B | 10.87B | 10.70B | 10.87B | 10.87B | 10.87B | 10.87B | 10.87B |
| Weighted Average Shares Outstanding Diluted | 604.44B | 604.44B | 604.44B | 604.44B | 604.44B | 606.41B | 605.23B | 10.87B | 10.87B | 10.87B | 10.87B | 10.87B | 10.87B | 10.87B | 10.87B | 10.87B | 10.87B | 10.87B | 10.87B | 10.87B |
| SEC Filing | Source | Source | Source | Source | Source | Source | Source | Source | Source | Source | Source | Source | Source | Source | Source | Source | Source | Source | Source | Source |
Annual Balance Sheet
| Breakdown | December 31, 2023 | December 31, 2022 | December 31, 2021 | December 31, 2020 | December 31, 2019 |
|---|---|---|---|---|---|
| Cash and Cash Equivalents | $1.71B | $1.22B | $1.05B | $1.70B | $1.07B |
| Short Term Investments | $22.14M | $503.51M | $70.86M | $50.25M | $393.19M |
| Cash and Short Term Investments | $1.74B | $1.72B | $1.12B | $1.75B | $1.47B |
| Net Receivables | $1.50B | $1.06B | $1.03B | $641.86M | $1.55B |
| Inventory | $592.88M | $477.79M | $287.34M | $323.57M | $354.23M |
| Other Current Assets | $376.68M | $277.78M | $180.16M | $432.01M | $646.05M |
| Total Current Assets | $4.13B | $3.54B | $2.64B | $3.14B | $4.02B |
| Property Plant Equipment Net | $9.09B | $8.41B | $9.49B | $10.73B | $12.92B |
| Goodwill | $- | $- | $- | $- | $2.21B |
| Intangible Assets | $1.15B | $1.08B | $1.02B | $1.05B | $1.45B |
| Goodwill and Intangible Assets | $1.15B | $1.08B | $1.02B | $1.05B | $3.66B |
| Long Term Investments | $13.44M | $15.52M | $12.86M | $33.14M | $15.63M |
| Tax Assets | $4.78M | $5.92M | $15.29M | $564.82M | $235.58M |
| Other Non-Current Assets | $274.97M | $161.12M | $140.39M | $131.77M | $240.93M |
| Total Non-Current Assets | $10.54B | $9.67B | $10.68B | $12.51B | $17.07B |
| Other Assets | $1 | $- | $- | $- | $- |
| Total Assets | $14.67B | $13.21B | $13.31B | $15.65B | $21.09B |
| Account Payables | $1.18B | $1.63B | $921.15M | $2.32B | $1.72B |
| Short Term Debt | $596.06M | $802.84M | $4.45B | $3.05B | $1.84B |
| Tax Payables | $2.37M | $1.03M | $9.46M | $656.00K | $22.04M |
| Deferred Revenue | $3.04B | $2.53B | $2.27B | $2.04B | $2.69B |
| Other Current Liabilities | $868.05M | $123.75M | $4.66B | $82.17M | $699.32M |
| Total Current Liabilities | $5.69B | $5.09B | $12.34B | $7.49B | $6.96B |
| Long Term Debt | $2.88B | $5.98B | $5.95B | $7.80B | $8.53B |
| Deferred Revenue Non-Current | $348.94M | $420.21M | $512.06M | $702.01M | $851.38M |
| Deferred Tax Liabilities Non-Current | $382.36M | $344.62M | $341.01M | $384.28M | $616.80M |
| Other Non-Current Liabilities | $4.93B | $1.35B | $1.24B | $1.71B | $999.11M |
| Total Non-Current Liabilities | $8.54B | $8.09B | $8.04B | $10.60B | $11.00B |
| Other Liabilities | $1 | $- | $- | $- | $- |
| Total Liabilities | $14.23B | $13.18B | $20.38B | $18.09B | $17.96B |
| Preferred Stock | $- | $- | $- | $- | $- |
| Common Stock | $5.00B | $13.30B | $3.15B | $3.15B | $3.15B |
| Retained Earnings | $3.13B | $-7.50B | $-8.84B | $-4.19B | $352.27M |
| Accumulated Other Comprehensive Income Loss | $-7.68B | $-5.75B | $-1.36B | $-1.39B | $-367.58M |
| Other Total Stockholders Equity | $- | $-139.00K | $-178.00K | $-178.00K | $-178.00K |
| Total Stockholders Equity | $450.26M | $42.28M | $-7.06B | $-2.44B | $3.13B |
| Total Equity | $438.24M | $30.72M | $-7.07B | $-2.44B | $3.13B |
| Total Liabilities and Stockholders Equity | $14.67B | $13.21B | $13.31B | $15.65B | $21.09B |
| Minority Interest | $-12.03M | $-11.56M | $-10.36M | $-6.67M | $-1.60M |
| Total Liabilities and Total Equity | $14.67B | $13.21B | $13.31B | $15.65B | $21.09B |
| Total Investments | $35.58M | $126.35M | $83.72M | $83.39M | $408.83M |
| Total Debt | $6.94B | $6.78B | $10.40B | $10.85B | $10.37B |
| Net Debt | $5.22B | $5.57B | $9.35B | $9.16B | $9.29B |
Balance Sheet Charts
| Breakdown | March 31, 2024 | December 31, 2023 | September 30, 2023 | June 30, 2023 | March 31, 2023 | December 31, 2022 | September 30, 2022 | June 30, 2022 | March 31, 2022 | December 31, 2021 | September 30, 2021 | June 30, 2021 | March 31, 2021 | December 31, 2020 | September 30, 2020 | June 30, 2020 | March 31, 2020 | December 31, 2019 | September 30, 2019 | June 30, 2019 |
|---|---|---|---|---|---|---|---|---|---|---|---|---|---|---|---|---|---|---|---|---|
| Cash and Cash Equivalents | $1.85B | $1.71B | $1.63B | $1.53B | $1.42B | $1.22B | $897.18M | $1.13B | $1.18B | $1.05B | $930.18M | $1.53B | $1.33B | $1.70B | $853.47M | $1.33B | $1.51B | $1.07B | $947.44M | $1.06B |
| Short Term Investments | $40.31M | $22.14M | $225.41M | $114.57M | $502.25M | $503.51M | $108.21M | $155.19M | $82.80M | $70.86M | $62.27M | $47.46M | $47.97M | $50.25M | $73.20M | $122.27M | $263.03M | $393.19M | $465.85M | $396.75M |
| Cash and Short Term Investments | $1.89B | $1.74B | $1.85B | $1.64B | $1.92B | $1.72B | $1.01B | $1.29B | $1.26B | $1.12B | $992.45M | $1.58B | $1.38B | $1.75B | $926.66M | $1.46B | $1.77B | $1.47B | $1.41B | $1.46B |
| Net Receivables | $1.49B | $1.50B | $1.50B | $1.48B | $1.13B | $1.06B | $1.31B | $1.08B | $1.19B | $1.03B | $838.93M | $755.08M | $610.92M | $641.86M | $629.75M | $710.84M | $659.59M | $1.55B | $1.66B | $1.29B |
| Inventory | $585.32M | $592.88M | $551.98M | $531.23M | $505.31M | $477.79M | $391.10M | $341.55M | $338.25M | $287.34M | $274.46M | $294.84M | $297.41M | $323.57M | $313.93M | $356.93M | $360.43M | $354.23M | $368.01M | $335.91M |
| Other Current Assets | $370.36M | $376.68M | $273.88M | $162.20M | $233.10M | $277.78M | $210.57M | $306.46M | $202.25M | $201.07M | $274.63M | $275.53M | $254.61M | $432.01M | $47.87M | $47.58M | $713.25M | $646.05M | $480.82M | $332.85M |
| Total Current Assets | $4.27B | $4.13B | $4.18B | $3.82B | $3.79B | $3.54B | $2.92B | $3.01B | $2.99B | $2.64B | $2.38B | $2.91B | $2.54B | $3.14B | $1.92B | $2.57B | $3.51B | $4.02B | $3.92B | $3.42B |
| Property Plant Equipment Net | $9.23B | $9.09B | $8.75B | $8.47B | $8.35B | $8.41B | $9.45B | $9.48B | $9.58B | $9.49B | $9.62B | $9.54B | $10.42B | $10.73B | $11.59B | $11.83B | $12.60B | $12.92B | $12.36B | $12.58B |
| Goodwill | $- | $- | $- | $- | $- | $- | $- | $- | $- | $- | $- | $- | $- | $- | $- | $- | $- | $2.21B | $2.14B | $2.32B |
| Intangible Assets | $1.12B | $1.15B | $1.14B | $1.15B | $1.10B | $1.08B | $1.03B | $1.07B | $1.16B | $1.02B | $1.02B | $1.09B | $972.52M | $1.05B | $964.58M | $1.01B | $1.13B | $1.45B | $1.36B | $1.46B |
| Goodwill and Intangible Assets | $1.12B | $1.15B | $1.14B | $1.15B | $1.10B | $1.08B | $1.03B | $1.07B | $1.16B | $1.02B | $1.02B | $1.09B | $972.52M | $1.05B | $964.58M | $1.01B | $1.13B | $3.66B | $3.49B | $3.78B |
| Long Term Investments | $12.87M | $13.44M | $33.98M | $15.70M | $16.46M | $15.52M | $15.10M | $18.26M | $14.98M | $12.86M | $11.77M | $12.43M | $12.00M | $33.14M | $15.50M | $13.42M | $40.94M | $15.63M | $52.77M | $53.39M |
| Tax Assets | $4.37M | $4.78M | $7.91M | $3.84M | $5.29M | $5.92M | $48.76M | $29.12M | $26.32M | $15.29M | $1.26B | $1.13B | $781.31M | $564.82M | $314.05M | $191.32M | $17.38M | $235.58M | $255.64M | $278.38M |
| Other Non-Current Assets | $263.80M | $274.97M | $183.81M | $190.61M | $175.68M | $161.12M | $155.68M | $154.01M | $161.24M | $140.39M | $144.85M | $157.48M | $150.53M | $131.77M | $155.83M | $150.27M | $181.34M | $240.93M | $214.20M | $221.34M |
| Total Non-Current Assets | $10.63B | $10.54B | $10.11B | $9.82B | $9.65B | $9.67B | $10.71B | $10.75B | $10.94B | $10.68B | $12.06B | $11.93B | $12.34B | $12.51B | $13.04B | $13.19B | $13.97B | $17.07B | $16.38B | $16.91B |
| Other Assets | $1 | $1 | $- | $- | $- | $- | $- | $- | $- | $- | $- | $- | $- | $- | $- | $- | $- | $- | $- | $- |
| Total Assets | $14.90B | $14.67B | $14.29B | $13.64B | $13.44B | $13.21B | $13.62B | $13.76B | $13.94B | $13.31B | $14.44B | $14.83B | $14.88B | $15.65B | $14.96B | $15.76B | $17.48B | $21.09B | $20.29B | $20.33B |
| Account Payables | $1.23B | $1.18B | $1.77B | $803.65M | $1.67B | $1.63B | $842.96M | $5.24B | $1.04B | $921.15M | $1.30B | $1.28B | $1.63B | $2.32B | $1.51B | $871.82M | $1.98B | $1.72B | $1.27B | $962.45M |
| Short Term Debt | $676.64M | $596.06M | $599.95M | $534.02M | $876.95M | $802.84M | $5.54B | $5.45B | $4.92B | $4.45B | $4.41B | $5.14B | $3.80B | $3.05B | $2.75B | $2.32B | $1.11B | $1.84B | $2.09B | $2.31B |
| Tax Payables | $2.66M | $2.37M | $1.24M | $23.00M | $2.79M | $1.03M | $24.58M | $4.00M | $14.82M | $9.46M | $19.30M | $16.61M | $1.55M | $656.00K | $3.35M | $27.63M | $2.93M | $22.04M | $15.58M | $2.20M |
| Deferred Revenue | $2.91B | $3.04B | $2.94B | $2.90B | $2.53B | $2.53B | $2.55B | $2.50B | $2.33B | $2.27B | $2.24B | $2.11B | $617.42M | $2.04B | $602.62M | $1.94B | $-1.11B | $2.69B | $2.53B | $732.71M |
| Other Current Liabilities | $872.80M | $868.05M | $230.33M | $968.05M | $111.19M | $123.75M | $4.91B | $323.10M | $5.01B | $4.68B | $2.60B | $2.44B | $1.95B | $82.17M | $1.92B | $1.49B | $4.32B | $699.32M | $689.35M | $2.44B |
| Total Current Liabilities | $5.69B | $5.69B | $5.55B | $5.23B | $5.19B | $5.09B | $13.86B | $13.52B | $13.31B | $12.34B | $10.57B | $10.99B | $8.01B | $7.49B | $6.79B | $6.64B | $6.30B | $6.96B | $6.59B | $6.45B |
| Long Term Debt | $2.85B | $2.88B | $2.90B | $5.86B | $5.86B | $5.98B | $6.12B | $2.42B | $6.07B | $5.95B | $5.84B | $5.24B | $7.01B | $7.80B | $7.24B | $7.61B | $8.71B | $8.53B | $8.43B | $8.34B |
| Deferred Revenue Non-Current | $298.05M | $348.94M | $395.02M | $441.37M | $488.56M | $420.21M | $461.11M | $505.43M | $474.33M | $512.06M | $561.66M | $601.91M | $1.73B | $702.01M | $1.22B | $856.42M | $-8.71B | $851.38M | $738.45M | $925.12M |
| Deferred Tax Liabilities Non-Current | $372.45M | $382.36M | $360.96M | $372.60M | $358.28M | $344.62M | $335.27M | $348.05M | $384.83M | $341.01M | $356.98M | $377.36M | $356.52M | $384.28M | $371.66M | $392.87M | $577.03M | $616.80M | $705.67M | $772.88M |
| Other Non-Current Liabilities | $5.11B | $4.93B | $4.66B | $1.49B | $1.35B | $1.35B | $1.10B | $4.96B | $1.26B | $1.24B | $1.44B | $1.28B | $654.75M | $1.71B | $818.29M | $1.17B | $10.52B | $999.11M | $984.79M | $792.52M |
| Total Non-Current Liabilities | $8.63B | $8.54B | $8.31B | $8.16B | $8.06B | $8.09B | $8.02B | $8.23B | $8.19B | $8.04B | $8.20B | $7.51B | $9.75B | $10.60B | $9.65B | $10.02B | $11.10B | $11.00B | $10.86B | $10.83B |
| Other Liabilities | $- | $1 | $- | $- | $- | $- | $- | $- | $- | $- | $- | $- | $- | $- | $- | $- | $- | $- | $- | $- |
| Total Liabilities | $14.32B | $14.23B | $13.86B | $13.39B | $13.25B | $13.18B | $21.89B | $21.75B | $21.50B | $20.38B | $18.76B | $18.50B | $17.76B | $18.09B | $16.44B | $16.67B | $17.40B | $17.96B | $17.45B | $17.28B |
| Preferred Stock | $- | $- | $- | $- | $- | $- | $- | $- | $- | $- | $- | $- | $- | $- | $- | $- | $- | $- | $- | $- |
| Common Stock | $5.00B | $5.00B | $5.00B | $5.00B | $13.30B | $13.30B | $3.15B | $3.15B | $3.15B | $3.15B | $3.15B | $3.15B | $3.15B | $3.15B | $3.15B | $3.15B | $3.15B | $3.15B | $3.15B | $3.15B |
| Retained Earnings | $3.31B | $3.13B | $406.34M | $244.06M | $-7.32B | $-7.50B | $-10.04B | $-9.74B | $-9.22B | $-8.84B | $-6.09B | $-5.39B | $-4.62B | $-4.19B | $-3.23B | $-2.66B | $-1.77B | $352.27M | $182.34M | $96.08M |
| Accumulated Other Comprehensive Income Loss | $-7.72B | $-7.69B | $-4.97B | $-4.99B | $-5.78B | $-5.75B | $-1.36B | $-1.39B | $-1.48B | $-1.36B | $-1.37B | $-1.40B | $-1.39B | $-1.39B | $-1.39B | $-1.39B | $-1.30B | $-367.58M | $-482.51M | $-211.53M |
| Other Total Stockholders Equity | $2.62M | $2.62M | $39.00K | $39.00K | $-139.00K | $-139.00K | $-178.00K | $-178.00K | $-178.00K | $-178.00K | $-178.00K | $-178.00K | $-178.00K | $-178.00K | $-178.00K | $-178.00K | $-178.00K | $-178.00K | $-178.00K | $-178.00K |
| Total Stockholders Equity | $598.68M | $450.26M | $437.43M | $259.80M | $201.86M | $42.28M | $-8.25B | $-7.98B | $-7.55B | $-7.06B | $-4.31B | $-3.65B | $-2.87B | $-2.44B | $-1.47B | $-899.20M | $82.40M | $3.13B | $2.85B | $3.03B |
| Total Equity | $588.01M | $438.24M | $429.80M | $246.33M | $189.32M | $30.72M | $-8.26B | $-7.99B | $-7.56B | $-7.07B | $-4.33B | $-3.66B | $-2.88B | $-2.44B | $-1.48B | $-903.72M | $81.01M | $3.13B | $2.84B | $3.05B |
| Total Liabilities and Stockholders Equity | $14.90B | $14.67B | $14.29B | $13.64B | $13.44B | $13.21B | $13.62B | $13.76B | $13.94B | $13.31B | $14.44B | $14.83B | $14.88B | $15.65B | $14.96B | $15.76B | $17.48B | $21.09B | $20.29B | $20.33B |
| Minority Interest | $-10.66M | $-12.03M | $-7.63M | $-13.47M | $-12.54M | $-11.56M | $-13.38M | $-8.26M | $-7.91M | $-10.36M | $-13.87M | $-10.47M | $-8.66M | $-6.67M | $-5.21M | $-4.52M | $-1.39M | $-1.60M | $-5.22M | $19.81M |
| Total Liabilities and Total Equity | $14.90B | $14.67B | $14.29B | $13.64B | $13.44B | $13.21B | $13.62B | $13.76B | $13.94B | $13.31B | $14.44B | $14.83B | $14.88B | $15.65B | $14.96B | $15.76B | $17.48B | $21.09B | $20.29B | $20.33B |
| Total Investments | $53.17M | $35.58M | $259.39M | $130.27M | $518.71M | $126.35M | $123.32M | $173.44M | $97.78M | $83.72M | $74.03M | $59.89M | $59.97M | $55.11M | $88.70M | $135.69M | $303.96M | $408.83M | $518.61M | $450.14M |
| Total Debt | $7.08B | $6.94B | $6.68B | $6.40B | $6.74B | $6.78B | $11.66B | $11.65B | $10.99B | $10.40B | $10.24B | $10.38B | $10.81B | $10.85B | $9.99B | $9.93B | $9.82B | $10.37B | $10.52B | $10.66B |
| Net Debt | $5.23B | $5.22B | $5.05B | $4.87B | $5.32B | $5.57B | $10.76B | $10.52B | $9.81B | $9.35B | $9.31B | $8.85B | $9.48B | $9.16B | $9.14B | $8.59B | $8.31B | $9.29B | $9.57B | $9.59B |
Annual Cash Flow
| Breakdown | December 31, 2023 | December 31, 2022 | December 31, 2021 | December 31, 2020 | December 31, 2019 |
|---|---|---|---|---|---|
| Net Income | $581.83M | $1.60B | $-4.65B | $-4.55B | $190.43M |
| Depreciation and Amortization | $1.21B | $1.18B | $1.17B | $1.39B | $1.47B |
| Deferred Income Tax | $- | $- | $- | $- | $- |
| Stock Based Compensation | $- | $- | $- | $- | $3.30M |
| Change in Working Capital | $- | $- | $- | $- | $- |
| Accounts Receivables | $- | $- | $- | $- | $- |
| Inventory | $- | $- | $- | $- | $- |
| Accounts Payables | $- | $- | $- | $- | $- |
| Other Working Capital | $- | $- | $- | $- | $- |
| Other Non Cash Items | $-19.32M | $-361.59B | $3.30B | $2.66B | $1.16B |
| Net Cash Provided by Operating Activities | $1.77B | $-358.82B | $-184.10M | $-494.70M | $2.83B |
| Investments in Property Plant and Equipment | $-863.84M | $-830.65M | $-675.76M | $-399.70M | $-1.42B |
| Acquisitions Net | $46.52M | $56.38M | $752.00K | $36.99M | $-72.03M |
| Purchases of Investments | $- | $-331.00K | $-208.00K | $-1.14B | $-4.13B |
| Sales Maturities of Investments | $- | $417.00K | $35.00K | $1.46B | $4.06B |
| Other Investing Activities | $59.26M | $25.23M | $132.53M | $73.24M | $137.92M |
| Net Cash Used for Investing Activities | $-758.06M | $-748.96M | $-542.65M | $33.61M | $-1.42B |
| Debt Repayment | $- | $- | $- | $- | $- |
| Common Stock Issued | $- | $549.04M | $- | $- | $- |
| Common Stock Repurchased | $- | $- | $- | $- | $- |
| Dividends Paid | $- | $- | $- | $-571.00K | $-54.58M |
| Other Financing Activities | $-1.15B | $854.96M | $109.64M | $1.12B | $-1.29B |
| Net Cash Used Provided by Financing Activities | $-555.98M | $854.96M | $109.64M | $1.12B | $-1.34B |
| Effect of Forex Changes on Cash | $44.24M | $-32.95M | $-31.90M | $-36.48M | $-73.00M |
| Net Change in Cash | $158.08M | $169.84M | $-649.01M | $623.26M | $-9.06M |
| Cash at End of Period | $1.71B | $1.22B | $1.05B | $1.70B | $1.07B |
| Cash at Beginning of Period | $1.56B | $1.05B | $1.70B | $1.07B | $1.08B |
| Operating Cash Flow | $1.77B | $-358.82B | $-184.10M | $-494.70M | $2.83B |
| Capital Expenditure | $-863.84M | $-830.65M | $-675.76M | $-399.70M | $-1.42B |
| Free Cash Flow | $904.05M | $-359.65B | $-859.86M | $-894.39M | $1.41B |
Cash Flow Charts
| Breakdown | March 31, 2024 | December 31, 2023 | September 30, 2023 | June 30, 2023 | March 31, 2023 | December 31, 2022 | September 30, 2022 | June 30, 2022 | March 31, 2022 | December 31, 2021 | September 30, 2021 | June 30, 2021 | March 31, 2021 | December 31, 2020 | September 30, 2020 | June 30, 2020 | March 31, 2020 | December 31, 2019 | September 30, 2019 | June 30, 2019 |
|---|---|---|---|---|---|---|---|---|---|---|---|---|---|---|---|---|---|---|---|---|
| Net Income | $258.28M | $82.96M | $231.82M | $145.25M | $153.84M | $2.46B | $-296.49M | $-524.27M | $-381.26M | $-2.75B | $-694.15M | $-772.28M | $-433.67M | $-964.30M | $-573.88M | $-893.85M | $-2.12B | $227.06M | $86.27M | $-63.43M |
| Depreciation and Amortization | $332.82M | $322.95M | $316.96M | $287.40M | $278.05M | $300.36M | $303.44M | $283.46M | $292.25M | $312.53M | $290.86M | $268.80M | $293.21M | $154.48M | $389.81M | $235.43M | $364.81M | $204.36M | $357.53M | $334.31M |
| Deferred Income Tax | $- | $- | $- | $- | $- | $- | $- | $- | $- | $- | $- | $- | $- | $- | $- | $- | $- | $- | $- | $- |
| Stock Based Compensation | $- | $- | $- | $- | $- | $- | $- | $- | $- | $- | $- | $- | $- | $- | $- | $- | $- | $- | $- | $652.00K |
| Change in Working Capital | $- | $- | $- | $- | $- | $- | $- | $- | $- | $- | $- | $- | $- | $- | $- | $- | $- | $- | $- | $- |
| Accounts Receivables | $- | $- | $- | $- | $- | $- | $- | $- | $- | $- | $- | $- | $- | $- | $- | $- | $- | $- | $- | $- |
| Inventory | $- | $- | $- | $- | $- | $- | $- | $- | $- | $- | $- | $- | $- | $- | $- | $- | $- | $- | $- | $- |
| Accounts Payables | $- | $- | $- | $- | $- | $- | $- | $- | $- | $- | $- | $- | $- | $- | $- | $- | $- | $- | $- | $- |
| Other Working Capital | $- | $- | $- | $- | $- | $- | $- | $- | $- | $- | $- | $- | $- | $- | $- | $- | $- | $- | $- | $- |
| Other Non Cash Items | $440.57M | $127.48M | $39.61M | $95.28M | $-278.05M | $-361.58B | $-303.44M | $-283.46M | $381.26M | $2.75B | $694.15M | $772.28M | $433.67M | $964.30M | $573.88M | $893.85M | $2.12B | $-227.06M | $-86.27M | $63.43M |
| Net Cash Provided by Operating Activities | $366.03M | $533.39M | $588.39M | $527.93M | $153.84M | $-358.82B | $-296.49M | $-524.27M | $-381.26M | $-2.75B | $-694.15M | $-772.28M | $-433.67M | $-964.30M | $-573.88M | $-893.85M | $-2.12B | $227.06M | $86.27M | $-63.43M |
| Investments in Property Plant and Equipment | $-115.78M | $-377.12M | $-200.52M | $-174.72M | $-111.48M | $-333.96M | $-257.46M | $-141.84M | $-97.39M | $-254.92M | $-312.20M | $-74.31M | $-34.34M | $-87.03M | $696.70M | $-1.02B | $-148.69M | $-765.78M | $-203.37M | $-247.31M |
| Acquisitions Net | $19.97M | $- | $- | $4.17M | $42.35M | $37.55M | $- | $18.82M | $- | $60.18M | $3.48M | $- | $- | $-27.12M | $- | $- | $54.24M | $294.11M | $-294.10M | $-6.00K |
| Purchases of Investments | $- | $- | $- | $- | $- | $331.00K | $- | $-17.00K | $-314.00K | $-3.00K | $-7.00K | $-116.00K | $-82.00K | $-56.24M | $- | $- | $-682.40M | $-920.58M | $-1.17B | $-1.22B |
| Sales Maturities of Investments | $- | $- | $- | $- | $- | $-417.00K | $- | $127.00K | $290.00K | $14.00K | $21.00K | $- | $- | $88.67M | $180.07M | $338.90M | $856.36M | $996.99M | $1.01B | $1.33B |
| Other Investing Activities | $27.59M | $20.98M | $33.32M | $25.50M | $43.38M | $8.94M | $9.73M | $6.48M | $173.00K | $4.82M | $58.76M | $751.00K | $5.29M | $29.64M | $-845.80M | $645.50M | $12.68M | $53.81M | $300.90M | $-296.22M |
| Net Cash Used for Investing Activities | $-68.23M | $-356.14M | $-167.20M | $-145.05M | $-25.75M | $-287.56M | $-247.73M | $-116.42M | $-97.25M | $-189.90M | $-249.95M | $-73.67M | $-29.13M | $-52.08M | $30.97M | $-37.47M | $92.20M | $-341.45M | $-355.83M | $-433.41M |
| Debt Repayment | $- | $- | $- | $- | $- | $- | $- | $- | $- | $- | $- | $- | $- | $- | $- | $- | $- | $- | $- | $- |
| Common Stock Issued | $- | $- | $- | $- | $- | $3.75B | $- | $- | $- | $- | $- | $- | $- | $- | $- | $- | $- | $- | $- | $- |
| Common Stock Repurchased | $- | $- | $- | $- | $- | $- | $- | $- | $- | $- | $- | $- | $- | $- | $- | $- | $- | $- | $- | $- |
| Dividends Paid | $-289.00K | $- | $- | $- | $- | $- | $- | $- | $- | $- | $- | $- | $- | $- | $- | $- | $-571.00K | $- | $- | $-55.12M |
| Other Financing Activities | $-266.18M | $-318.07M | $-298.54M | $-307.31M | $-226.29M | $961.13M | $-196.25M | $-124.72M | $214.79M | $144.88M | $-347.66M | $437.23M | $-124.80M | $1.06B | $-31.74M | $-129.97M | $225.13M | $-816.90M | $-437.77M | $-154.20M |
| Net Cash Used Provided by Financing Activities | $-136.96M | $-111.54M | $-298.54M | $-307.31M | $-226.29M | $961.13M | $-196.25M | $-124.72M | $214.79M | $144.88M | $-347.66M | $437.23M | $-124.80M | $1.06B | $-31.74M | $-129.97M | $224.56M | $-816.90M | $-437.77M | $-209.32M |
| Effect of Forex Changes on Cash | $-24.24M | $19.55M | $-18.39M | $34.24M | $8.85M | $6.20M | $-18.39M | $-39.19M | $18.43M | $-14.00M | $-14.87M | $9.15M | $-12.18M | $3.88M | $20.78M | $-1.27M | $-59.87M | $106.42M | $-120.61M | $-43.01M |
| Net Change in Cash | $136.61M | $85.27M | $104.27M | $109.81M | $198.75M | $319.49M | $-236.17M | $-45.56M | $132.07M | $116.65M | $-604.78M | $204.53M | $-365.41M | $842.37M | $-480.67M | $-176.66M | $438.22M | $125.14M | $-113.91M | $-62.98M |
| Cash at End of Period | $1.85B | $1.71B | $1.63B | $1.53B | $1.42B | $1.22B | $897.18M | $1.13B | $1.18B | $1.05B | $930.18M | $1.53B | $1.33B | $1.70B | $853.47M | $1.33B | $1.51B | $1.07B | $947.44M | $1.06B |
| Cash at Beginning of Period | $1.71B | $1.63B | $1.53B | $1.42B | $1.22B | $897.18M | $1.13B | $1.18B | $1.05B | $930.18M | $1.53B | $1.33B | $1.70B | $853.47M | $1.33B | $1.51B | $1.07B | $947.44M | $1.06B | $1.12B |
| Operating Cash Flow | $366.03M | $533.39M | $588.39M | $527.93M | $153.84M | $-358.82B | $-296.49M | $-524.27M | $-381.26M | $-2.75B | $-694.15M | $-772.28M | $-433.67M | $-964.30M | $-573.88M | $-893.85M | $-2.12B | $227.06M | $86.27M | $-63.43M |
| Capital Expenditure | $-115.78M | $-377.12M | $-200.52M | $-174.72M | $-111.48M | $-333.96M | $-257.46M | $-141.84M | $-97.39M | $-254.92M | $-312.20M | $-74.31M | $-34.34M | $-87.03M | $696.70M | $-1.02B | $-148.69M | $-765.78M | $-203.37M | $-247.31M |
| Free Cash Flow | $250.25M | $156.28M | $387.87M | $353.21M | $42.36M | $-359.15B | $-553.95M | $-666.11M | $-478.66M | $-3.01B | $-1.01B | $-846.59M | $-468.01M | $-1.05B | $122.81M | $-1.92B | $-2.27B | $-538.73M | $-117.11M | $-310.74M |
LATAM Airlines Group S.A Dividends
Explore LATAM Airlines Group S.A's dividend history, including dividend yield, payout ratio, and historical payments.
Dividend Yield
2.10%
Dividend Payout Ratio
17.90%
Dividend Paid & Capex Coverage Ratio
2.07x
LATAM Airlines Group S.A Dividend History
| Dividend | Adjusted Dividend | Date | Record Date | Payment Date | Declaration Date |
|---|---|---|---|---|---|
| $0.0003 | $0.5902 | May 09, 2024 | May 10, 2024 | May 31, 2024 | April 30, 2024 |
| $0.0066 | $13.1084 | October 28, 2022 | October 31, 2022 | November 07, 2022 | |
| $0 | $0.094 | May 21, 2020 | |||
| $0.0885 | $176.976 | May 09, 2019 | May 10, 2019 | May 24, 2019 | |
| $0.0754 | $150.732 | May 10, 2018 | May 11, 2018 | May 25, 2018 | |
| $0.0343 | $68.574 | May 10, 2017 | May 12, 2017 | May 26, 2017 | |
| $0.0067 | $13.46387 | May 08, 2013 | |||
| $0.0115 | $22.96777 | January 31, 2013 | |||
| $0.0516 | $103.28964 | May 09, 2012 | |||
| $0.2569 | $513.70392 | January 05, 2012 | |||
| $0.1601 | $320.28165 | September 08, 2011 | |||
| $0.0301 | $60.29833 | May 11, 2011 | |||
| $0.3709 | $741.87488 | January 05, 2011 | |||
| $0.1404 | $280.76123 | August 11, 2010 | |||
| $0.0206 | $41.11231 | May 12, 2010 | |||
| $0.122 | $243.99101 | January 13, 2010 | |||
| $0.0672 | $134.33177 | August 11, 2009 | |||
| $0.1939 | $387.74551 | January 07, 2009 | |||
| $0.185 | $369.97913 | August 12, 2008 | |||
| $0.0111 | $22.11638 | May 01, 2008 |
LATAM Airlines Group S.A News
Read the latest news about LATAM Airlines Group S.A, including recent articles, headlines, and updates.


LATAM Airlines: Back From The Grave
LTM was relisted on the NYSE with the correct share count and price transparency vs the OTC listing. LTM emerged from Chapter 11 with a de-risked balance sheet, far more efficient operation, and is executing above target that should drive EBITDA growth of 17%. At a target multiple of 5x EV/EBITDA, LTM shares have 64% upside potential with solid growth and cash flow prospects.

LATAM Airlines mulls possible purchase of up to 30 Embraer jets, Brazil minister says
LATAM Airlines could potentially buy as many as 30 aircraft from Brazilian planemaker Embraer as the carrier looks to expand operations in Latin America's largest economy, Brazil's ports and airports minister said on Tuesday.


U.S. IPO Weekly Recap: Insurance And Healthcare Lead A 4 IPO Week
A handful of IPOs priced this past week, led by three sizable names. One large issuer joined both the pipeline and the calendar - Chile-based LATAM Airlines Group. Six IPOs are scheduled to list in the week ahead and are set to raise a combined $5.1 billion, the most for any week so far this year. One SPAC is also set to debut.


LATAM Airlines Group S.A. (LTMAY) Q1 2024 Earnings Call Transcript
LATAM Airlines Group S.A. (OTCPK:LTMAY) Q1 2024 Earnings Conference Call May 3, 2024 9:00 AM ET Company Participants Ramiro Alfonsin - Chief Financial Officer Roberto Alvo - Chief Executive Officer Conference Call Participants Victor Mizusaki - Bradesco BBI Stephen Trent - Citi Guilherme Mendes - JPMorgan Operator Good day and thank you for standing by.

LATAM scraps plan to acquire Boeing B737s after talks end with bankrupt Gol
LATAM Airlines said on Wednesday that it was no longer seeking to acquire Boeing B737 planes either from bankrupt Brazilian carrier Gol or other sources, opting to look for alternative narrowbody aircraft after talks failed.


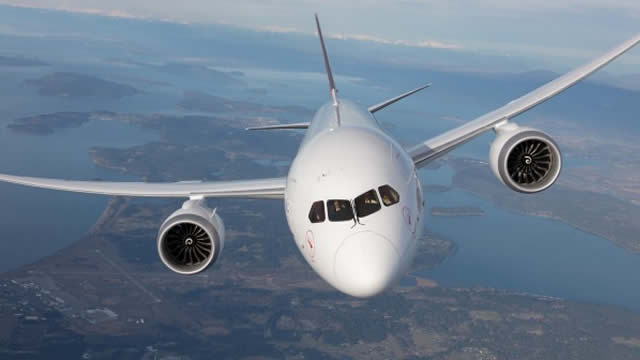
Pilot seat movement a focus of probe into LATAM Boeing flight, report says
The movement of a flight deck seat is a key focus of the probe into a sudden mid-air dive by a LATAM Airlines Boeing 787 plane that left more than 50 people injured, aviation industry publication the Air Current reported on Wednesday.


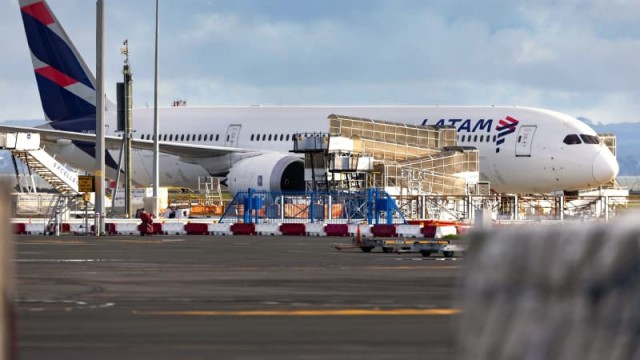
New Zealand Authorities Seize LATAM Boeing 787's Black Boxes After Incident Injures Over 50 Onboard
Authorities in New Zealand said Tuesday they were seizing the so-called black boxes of the LATAM Airlines Boeing 787 plane, which faced a mid-flight technical issue that resulted in more than 50 passengers and crew getting injured a day earlier.
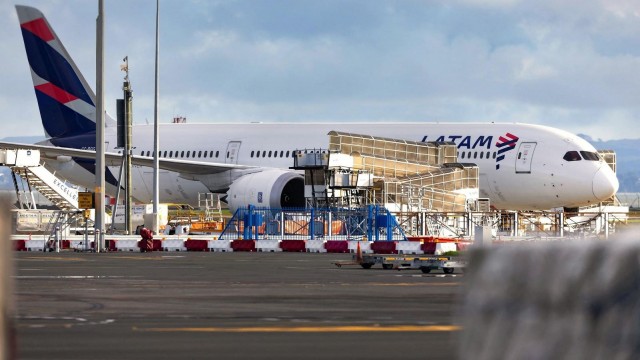
At Least 50 Injured On LATAM Airlines Boeing 787 After Technical Problem Causes Sudden Drop In Altitude
At least 50 people were injured on board a Boeing 787-9 flight from Sydney to Auckland operated by Chilean airline LATAM after the aircraft experienced a technical issue that caused it to suddenly lose altitude.
Similar Companies
International Consolidated Airlines Group S.A.
BABWF
Price: $3.50
Market Cap: $16.60B
Controladora Vuela Compañía de Aviación, S.A.B. de C.V.
VLRS
Price: $3.94
Market Cap: $469.52M
Related Metrics
Explore detailed financial metrics and analysis for LTMAY.