MDU Resources Group Key Executives
This section highlights MDU Resources Group's key executives, including their titles and compensation details.
Find Contacts at MDU Resources Group
(Showing 0 of )
MDU Resources Group Earnings
This section highlights MDU Resources Group's earnings, including key dates, EPS, earnings reports, and earnings call transcripts.
Next Earnings Date
Last Earnings Results
Earnings Call Transcripts
| Transcript | Quarter | Year | Date | Estimated EPS | Actual EPS |
|---|---|---|---|---|---|
| Read Transcript | Q4 | 2024 | 2025-02-06 | $0.31 | $0.34 |
| Read Transcript | Q3 | 2024 | 2024-11-07 | $0.26 | $0.32 |
| Read Transcript | Q2 | 2024 | 2024-08-08 | $0.22 | $0.32 |
| Read Transcript | Q1 | 2024 | 2024-05-02 | $0.47 | $0.52 |
| Read Transcript | Q4 | 2023 | 2024-02-08 | $0.49 | $0.48 |
| Read Transcript | Q3 | 2023 | 2023-11-02 | $0.25 | $0.29 |
| Read Transcript | Q2 | 2023 | 2023-08-03 | $0.35 | $0.29 |
| Read Transcript | Q1 | 2023 | 2023-05-04 | $0.20 | $0.23 |

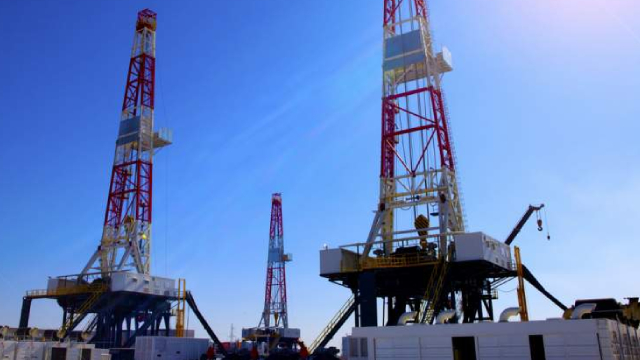
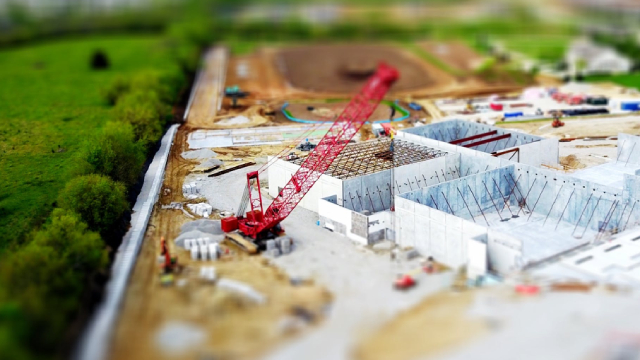
MDU Resources Group, Inc. engages in the regulated energy delivery, and construction materials and services businesses in the United States. The company's Electric segment generates, transmits, and distributes electricity for residential, commercial, industrial, and municipal customers in Montana, North Dakota, South Dakota, and Wyoming, as well as operates 3,500 miles of transmission lines and 4,800 miles of distribution lines. Its Natural Gas Distribution segment distributes natural gas for residential, commercial, and industrial customers in Idaho, Minnesota, Montana, North Dakota, Oregon, South Dakota, Washington, and Wyoming; and offers supply-related value-added services. The company's Pipeline segment provides natural gas transportation and underground storage services through a regulated pipeline system primarily in the Rocky Mountain and northern Great Plains regions; and cathodic protection and other energy-related services. Its Construction Materials and Contracting segment mines, processes, and sells construction aggregates; produces and sells asphalt mix; and supplies ready-mixed concrete. This segment is also involved in the sale of cement, finished concrete products, and other building materials and related contracting services. The company's Construction Services segment designs, constructs, and maintains electrical and communication wiring and infrastructure, fire suppression systems, mechanical piping and services; overhead and underground electrical, gas, and communication infrastructure; and manufactures and distributes transmission lines construction equipment. It serves manufacturing, commercial, industrial, transportation, institutional, and renewable and government customers, as well as utilities. The company was founded in 1924 and is headquartered in Bismarck, North Dakota.
$16.98
Stock Price
$3.47B
Market Cap
2.05K
Employees
Bismarck, ND
Location
Financial Statements
Access annual & quarterly financial statements for MDU Resources Group, including income statements, balance sheets, and cash flow statements..
Annual Income Statement
| Breakdown | December 31, 2024 | December 31, 2023 | December 31, 2022 | December 31, 2021 | December 31, 2020 |
|---|---|---|---|---|---|
| Revenue | $1.76B | $4.66B | $6.97B | $5.68B | $5.53B |
| Cost of Revenue | $1.19B | $4.04B | $5.83B | $4.64B | $4.49B |
| Gross Profit | $571.96M | $622.04M | $1.15B | $1.04B | $1.05B |
| Gross Profit Ratio | 32.53% | 13.36% | 16.42% | 18.39% | 18.93% |
| Research and Development Expenses | $- | $- | $- | $- | $- |
| General and Administrative Expenses | $- | $- | $- | $- | $- |
| Selling and Marketing Expenses | $- | $- | $- | $- | $- |
| Selling General and Administrative Expenses | $- | $-213.60M | $182.72M | $6.20M | $4.22M |
| Other Expenses | $306.29M | $409.64M | $388.38M | $510.70M | $502.40M |
| Operating Expenses | $306.29M | $196.05M | $571.10M | $510.70M | $502.40M |
| Cost and Expenses | $1.49B | $4.23B | $6.40B | $5.15B | $4.99B |
| Interest Income | $- | $- | $119.27M | $93.98M | $96.52M |
| Interest Expense | $108.35M | $114.31M | $119.30M | $94.00M | $96.50M |
| Depreciation and Amortization | $200.08M | $213.60M | $210.03M | $299.21M | $285.10M |
| EBITDA | $507.09M | $867.71M | $590.66M | $859.26M | $856.14M |
| EBITDA Ratio | 28.84% | 18.63% | 8.47% | 15.13% | 15.47% |
| Operating Income | $265.64M | $425.98M | $574.00M | $534.20M | $544.90M |
| Operating Income Ratio | 15.11% | 9.15% | 8.23% | 9.40% | 9.85% |
| Total Other Income Expenses Net | $-66.98M | $113.92M | $-69.47M | $-67.60M | $-69.81M |
| Income Before Tax | $198.66M | $539.90M | $462.10M | $466.60M | $475.10M |
| Income Before Tax Ratio | 11.30% | 11.59% | 6.63% | 8.21% | 8.59% |
| Income Tax Expense | $17.59M | $59.47M | $94.80M | $88.90M | $84.60M |
| Net Income | $281.11M | $414.71M | $367.49M | $378.13M | $390.20M |
| Net Income Ratio | 15.99% | 8.90% | 5.27% | 6.66% | 7.05% |
| EPS | $1.38 | $2.04 | $1.81 | $1.87 | $1.95 |
| EPS Diluted | $1.37 | $2.03 | $1.81 | $1.87 | $1.95 |
| Weighted Average Shares Outstanding | 203.87M | 203.64M | 203.36M | 202.08M | 200.50M |
| Weighted Average Shares Outstanding Diluted | 204.70M | 203.94M | 203.46M | 202.38M | 200.57M |
| SEC Filing | Source | Source | Source | Source | Source |
| Breakdown | December 31, 2024 | September 30, 2024 | June 30, 2024 | March 31, 2024 | December 31, 2023 | September 30, 2023 | June 30, 2023 | March 31, 2023 | December 31, 2022 | September 30, 2022 | June 30, 2022 | March 31, 2022 | December 31, 2021 | September 30, 2021 | June 30, 2021 | March 31, 2021 | December 31, 2020 | September 30, 2020 | June 30, 2020 | March 31, 2020 |
|---|---|---|---|---|---|---|---|---|---|---|---|---|---|---|---|---|---|---|---|---|
| Revenue | $535.50M | $1.05B | $1.05B | $1.21B | $1.14B | $1.00B | $1.09B | $1.74B | $1.86B | $1.98B | $1.72B | $1.42B | $1.44B | $1.59B | $1.42B | $1.23B | $1.39B | $1.59B | $1.36B | $1.20B |
| Cost of Revenue | $105.70M | $865.22M | $913.18M | $1.02B | $955.00M | $823.60M | $905.90M | $1.50B | $1.54B | $1.63B | $1.45B | $1.20B | $1.20B | $1.27B | $1.16B | $1.01B | $1.12B | $1.26B | $1.10B | $1.01B |
| Gross Profit | $429.80M | $185.29M | $134.36M | $194.94M | $180.30M | $177.20M | $185.20M | $237.20M | $314.90M | $348.41M | $266.90M | $214.95M | $246.40M | $312.50M | $264.60M | $221.42M | $268.30M | $326.30M | $262.40M | $190.40M |
| Gross Profit Ratio | 80.26% | 17.64% | 12.83% | 16.06% | 15.88% | 17.71% | 16.97% | 13.65% | 16.94% | 17.62% | 15.51% | 15.17% | 17.07% | 19.70% | 18.59% | 18.03% | 19.37% | 20.56% | 19.25% | 15.90% |
| Research and Development Expenses | $- | $- | $- | $- | $- | $- | $- | $- | $- | $- | $- | $- | $- | $- | $- | $- | $- | $- | $- | $- |
| General and Administrative Expenses | $- | $- | $- | $- | $- | $- | $- | $- | $- | $- | $- | $- | $- | $- | $- | $- | $- | $- | $- | $- |
| Selling and Marketing Expenses | $- | $- | $- | $- | $- | $- | $- | $- | $- | $- | $- | $- | $- | $- | $- | $- | $- | $- | $- | $- |
| Selling General and Administrative Expenses | $- | $- | $89.24M | $1.27M | $3.64M | $681.00K | $693.00K | $564.00K | $3.81M | $1.41M | $25.80K | $1.39M | $3.61M | $864.00K | $862.00K | $1.55M | $3.73M | $6.00K | $586.00K | $845.00K |
| Other Expenses | $441.00M | $94.49M | $-44.62M | $-58.99M | $-39.50M | $8.80M | $10.00M | $162.70M | $138.70M | $138.56M | $146.27M | $147.60M | $8.10M | $5.90M | $9.00M | $3.35M | $13.00M | $4.60M | $10.00M | $-1.00M |
| Operating Expenses | $441.00M | $94.49M | $44.62M | $58.99M | $39.50M | $92.60M | $103.20M | $162.70M | $138.70M | $138.56M | $146.30M | $147.60M | $124.20M | $123.30M | $126.90M | $136.26M | $122.40M | $122.60M | $124.10M | $133.30M |
| Cost and Expenses | $546.70M | $959.71M | $957.80M | $1.08B | $994.50M | $916.20M | $1.01B | $1.66B | $1.68B | $1.77B | $1.60B | $1.35B | $1.32B | $1.40B | $1.29B | $1.14B | $1.24B | $1.38B | $1.22B | $1.14B |
| Interest Income | $- | $- | $- | $- | $- | $32.13M | $26.46M | $23.95M | $34.53M | $20.20M | $- | $- | $40.00K | $- | $- | $- | $13.00K | $- | $- | $- |
| Interest Expense | $21.57M | $29.47M | $28.61M | $28.71M | $31.70M | $32.10M | $26.50M | $38.00M | $34.50M | $31.37M | $28.10M | $25.26M | $23.80M | $23.40M | $23.40M | $23.45M | $23.40M | $23.70M | $24.80M | $24.60M |
| Depreciation and Amortization | $32.29M | $56.16M | $55.88M | $55.75M | $54.70M | $53.15M | $53.50M | $81.86M | $80.70M | $82.29M | $84.76M | $80.12M | $76.60M | $75.23M | $73.66M | $73.72M | $72.27M | $72.08M | $71.51M | $69.24M |
| EBITDA | $-19.49M | $160.80M | $160.29M | $205.48M | $224.11M | $176.82M | $285.51M | $181.13M | $265.95M | $114.25M | $201.10M | $145.06M | $206.75M | $270.33M | $220.38M | $162.24M | $231.20M | $280.41M | $219.82M | $125.30M |
| EBITDA Ratio | -3.64% | 15.31% | 15.30% | 16.93% | 19.74% | 17.67% | 26.17% | 10.43% | 14.30% | 5.78% | 11.69% | 10.24% | 14.33% | 17.04% | 15.48% | 13.21% | 16.69% | 17.67% | 16.13% | 10.46% |
| Operating Income | $-50.85M | $90.80M | $89.75M | $135.95M | $140.80M | $84.60M | $82.00M | $74.50M | $176.20M | $209.85M | $120.60M | $67.34M | $122.20M | $189.20M | $137.70M | $85.16M | $145.90M | $203.70M | $138.30M | $57.10M |
| Operating Income Ratio | -9.50% | 8.64% | 8.57% | 11.20% | 12.40% | 8.45% | 7.52% | 4.29% | 9.48% | 10.61% | 7.01% | 4.75% | 8.47% | 11.93% | 9.67% | 6.94% | 10.53% | 12.83% | 10.15% | 4.77% |
| Total Other Income Expenses Net | $-22.49M | $-15.63M | $-13.95M | $-14.92M | $-2.92M | $6.94M | $123.52M | $-71.22M | $-25.30M | $-26.60M | $25.70M | $-27.66M | $-19.26M | $-17.46M | $-14.35M | $-20.10M | $-15.28M | $-19.15M | $-14.76M | $-25.56M |
| Income Before Tax | $-73.34M | $75.18M | $75.80M | $121.03M | $137.90M | $91.50M | $205.50M | $47.30M | $150.90M | $183.25M | $88.20M | $39.68M | $106.50M | $171.70M | $123.30M | $65.06M | $135.50M | $184.60M | $123.50M | $31.50M |
| Income Before Tax Ratio | -13.70% | 7.16% | 7.24% | 9.97% | 12.15% | 9.14% | 18.83% | 2.72% | 8.12% | 9.27% | 5.13% | 2.80% | 7.38% | 10.83% | 8.66% | 5.30% | 9.78% | 11.63% | 9.06% | 2.63% |
| Income Tax Expense | $-30.78M | $10.56M | $15.22M | $20.13M | $-32.80M | $13.30M | $57.90M | $9.00M | $33.90M | $35.32M | $17.50M | $7.95M | $20.10M | $32.70M | $23.10M | $12.95M | $23.40M | $31.60M | $23.70M | $6.00M |
| Net Income | $55.16M | $64.61M | $60.44M | $100.90M | $170.73M | $74.93M | $130.69M | $38.35M | $117.09M | $147.97M | $70.70M | $31.76M | $86.50M | $139.30M | $100.20M | $52.13M | $112.30M | $153.10M | $99.70M | $25.10M |
| Net Income Ratio | 10.30% | 6.15% | 5.77% | 8.31% | 15.04% | 7.49% | 11.98% | 2.21% | 6.30% | 7.48% | 4.11% | 2.24% | 5.99% | 8.78% | 7.04% | 4.25% | 8.11% | 9.65% | 7.32% | 2.10% |
| EPS | $0.27 | $0.32 | $0.30 | $0.50 | $0.84 | $0.37 | $0.64 | $0.19 | $0.58 | $0.73 | $0.35 | $0.16 | $0.42 | $0.68 | $0.50 | $0.26 | $0.56 | $0.76 | $0.50 | $0.13 |
| EPS Diluted | $0.27 | $0.32 | $0.30 | $0.49 | $0.84 | $0.37 | $0.64 | $0.19 | $0.57 | $0.73 | $0.35 | $0.16 | $0.42 | $0.68 | $0.50 | $0.26 | $0.56 | $0.76 | $0.50 | $0.13 |
| Weighted Average Shares Outstanding | 203.90M | 203.89M | 203.89M | 203.78M | 203.70M | 203.64M | 203.63M | 203.62M | 203.40M | 203.35M | 203.35M | 203.35M | 203.40M | 202.90M | 201.30M | 200.71M | 200.50M | 200.50M | 200.50M | 200.40M |
| Weighted Average Shares Outstanding Diluted | 205.20M | 204.68M | 204.58M | 204.19M | 204.10M | 203.89M | 203.88M | 203.91M | 203.90M | 203.64M | 203.40M | 203.39M | 203.80M | 203.20M | 201.70M | 200.95M | 200.90M | 200.60M | 200.50M | 200.50M |
| SEC Filing | Source | Source | Source | Source | Source | Source | Source | Source | Source | Source | Source | Source | Source | Source | Source | Source | Source | Source | Source | Source |
Annual Balance Sheet
| Breakdown | December 31, 2024 | December 31, 2023 | December 31, 2022 | December 31, 2021 | December 31, 2020 |
|---|---|---|---|---|---|
| Cash and Cash Equivalents | $66.90M | $48.88M | $80.52M | $54.16M | $59.55M |
| Short Term Investments | $- | $- | $- | $- | $- |
| Cash and Short Term Investments | $66.90M | $48.88M | $80.52M | $54.16M | $59.55M |
| Net Receivables | $274.30M | $942.78M | $1.06B | $946.74M | $873.99M |
| Inventory | $44.94M | $87.39M | $387.52M | $335.61M | $291.17M |
| Other Current Assets | $280.11M | $284.67M | $848.33M | $214.43M | $112.65M |
| Total Current Assets | $666.26M | $1.36B | $2.01B | $1.55B | $1.34B |
| Property Plant Equipment Net | $5.34B | $5.20B | $6.21B | $5.88B | $5.29B |
| Goodwill | $345.74M | $488.96M | $763.50M | $765.39M | $714.96M |
| Intangible Assets | $- | $2.00M | $17.53M | $22.58M | $25.50M |
| Goodwill and Intangible Assets | $345.74M | $490.96M | $781.03M | $787.96M | $740.46M |
| Long Term Investments | $115.46M | $124.23M | $161.91M | $175.48M | $165.02M |
| Tax Assets | $- | $- | $631.30M | $591.96M | $516.10M |
| Other Non-Current Assets | $567.07M | $658.96M | $-136.13M | $-76.44M | $7.39M |
| Total Non-Current Assets | $6.37B | $6.47B | $7.65B | $7.36B | $6.72B |
| Other Assets | $- | $- | $- | $- | $- |
| Total Assets | $7.04B | $7.83B | $9.66B | $8.91B | $8.05B |
| Account Payables | $150.07M | $247.61M | $525.56M | $478.93M | $426.26M |
| Short Term Debt | $161.70M | $202.09M | $107.63M | $218.79M | $118.86M |
| Tax Payables | $43.37M | $58.11M | $70.81M | $80.37M | $88.84M |
| Deferred Revenue | $- | $- | $208.20M | $413.58M | $420.60M |
| Other Current Liabilities | $323.46M | $567.93M | $775.61M | $314.15M | $329.55M |
| Total Current Liabilities | $678.60M | $1.08B | $1.48B | $1.09B | $963.52M |
| Long Term Debt | $2.13B | $2.29B | $2.37B | $2.77B | $2.30B |
| Deferred Revenue Non-Current | $- | $291.00K | $6.00K | $458.06M | $440.36M |
| Deferred Tax Liabilities Non-Current | $441.32M | $458.55M | $631.30M | $591.96M | $516.10M |
| Other Non-Current Liabilities | $1.10B | $1.10B | $2.22B | $1.07B | $1.71B |
| Total Non-Current Liabilities | $3.67B | $3.85B | $4.59B | $4.44B | $4.01B |
| Other Liabilities | $- | $- | $- | $- | $- |
| Total Liabilities | $4.35B | $4.93B | $6.07B | $5.53B | $4.97B |
| Preferred Stock | $- | $- | $- | $- | $- |
| Common Stock | $203.94M | $203.69M | $204.16M | $203.89M | $201.06M |
| Retained Earnings | $1.03B | $1.25B | $1.95B | $1.76B | $1.56B |
| Accumulated Other Comprehensive Income Loss | $-16.80M | $-18.38M | $-30.58M | $-41.00M | $-48.08M |
| Other Total Stockholders Equity | $1.47B | $1.47B | $1.46B | $1.46B | $1.37B |
| Total Stockholders Equity | $2.69B | $2.91B | $3.59B | $3.38B | $3.08B |
| Total Equity | $2.69B | $2.91B | $3.59B | $3.38B | $3.08B |
| Total Liabilities and Stockholders Equity | $7.04B | $7.83B | $9.66B | $8.91B | $8.05B |
| Minority Interest | $- | $- | $- | $- | $- |
| Total Liabilities and Total Equity | $7.04B | $7.83B | $9.66B | $8.91B | $8.05B |
| Total Investments | $115.46M | $124.23M | $161.91M | $175.48M | $165.02M |
| Total Debt | $2.29B | $2.47B | $3.21B | $2.87B | $2.38B |
| Net Debt | $2.23B | $2.42B | $3.13B | $2.81B | $2.32B |
Balance Sheet Charts
| Breakdown | December 31, 2024 | September 30, 2024 | June 30, 2024 | March 31, 2024 | December 31, 2023 | September 30, 2023 | June 30, 2023 | March 31, 2023 | December 31, 2022 | September 30, 2022 | June 30, 2022 | March 31, 2022 | December 31, 2021 | September 30, 2021 | June 30, 2021 | March 31, 2021 | December 31, 2020 | September 30, 2020 | June 30, 2020 | March 31, 2020 |
|---|---|---|---|---|---|---|---|---|---|---|---|---|---|---|---|---|---|---|---|---|
| Cash and Cash Equivalents | $50.20M | $104.02M | $94.44M | $89.30M | $48.88M | $32.49M | $50.78M | $93.19M | $80.52M | $74.62M | $65.39M | $64.90M | $54.16M | $57.24M | $57.95M | $55.09M | $59.55M | $66.07M | $64.36M | $116.53M |
| Short Term Investments | $- | $- | $- | $- | $- | $276.21M | $246.06M | $- | $- | $- | $- | $- | $- | $- | $- | $- | $- | $- | $- | $- |
| Cash and Short Term Investments | $50.20M | $104.02M | $94.44M | $89.30M | $48.88M | $308.71M | $296.84M | $93.19M | $80.52M | $74.62M | $65.39M | $64.90M | $54.16M | $57.24M | $57.95M | $55.09M | $59.55M | $66.07M | $64.36M | $116.53M |
| Net Receivables | $274.30M | $934.47M | $926.80M | $932.15M | $942.78M | $893.02M | $934.17M | $1.29B | $1.31B | $1.30B | $1.18B | $948.02M | $946.74M | $979.86M | $903.83M | $784.58M | $873.99M | $1.01B | $920.82M | $835.47M |
| Inventory | $44.94M | $91.89M | $69.74M | $57.43M | $87.39M | $80.23M | $60.15M | $425.83M | $387.52M | $398.64M | $401.43M | $380.32M | $335.61M | $312.29M | $316.33M | $316.74M | $291.17M | $286.22M | $302.84M | $305.96M |
| Other Current Assets | $296.81M | $337.44M | $306.06M | $241.07M | $284.67M | $233.05M | $253.66M | $297.74M | $238.06M | $253.01M | $314.04M | $178.66M | $214.43M | $216.50M | $258.10M | $166.86M | $112.65M | $202.54M | $156.94M | $115.44M |
| Total Current Assets | $666.26M | $1.47B | $1.40B | $1.32B | $1.36B | $1.52B | $1.54B | $2.11B | $2.01B | $2.02B | $1.86B | $1.57B | $1.55B | $1.57B | $1.46B | $1.32B | $1.34B | $1.50B | $1.40B | $1.37B |
| Property Plant Equipment Net | $5.34B | $5.47B | $5.35B | $5.26B | $5.20B | $5.10B | $5.00B | $6.27B | $6.21B | $6.11B | $6.00B | $5.92B | $5.88B | $5.57B | $5.40B | $5.31B | $5.29B | $5.21B | $5.11B | $5.08B |
| Goodwill | $345.74M | $488.96M | $488.96M | $488.96M | $488.96M | $488.96M | $488.96M | $763.50M | $763.50M | $763.26M | $763.26M | $763.26M | $765.39M | $717.65M | $717.86M | $714.96M | $714.96M | $712.68M | $708.66M | $713.53M |
| Intangible Assets | $- | $466.00K | $960.00K | $1.48M | $2.00M | $491.49M | $3.05M | $16.33M | $17.53M | $18.75M | $20.04M | $21.39M | $22.58M | $22.24M | $23.40M | $23.96M | $25.50M | $26.38M | $31.52M | $34.25M |
| Goodwill and Intangible Assets | $345.74M | $489.43M | $489.92M | $490.44M | $490.96M | $980.45M | $492.01M | $779.83M | $781.03M | $782.01M | $783.30M | $784.65M | $787.96M | $739.89M | $741.26M | $738.92M | $740.46M | $739.05M | $740.18M | $747.78M |
| Long Term Investments | $115.46M | $130.60M | $123.39M | $119.40M | $124.23M | $139.33M | $139.57M | $172.47M | $161.91M | $157.86M | $161.25M | $174.56M | $175.48M | $171.86M | $173.16M | $167.74M | $165.02M | $158.44M | $154.78M | $145.24M |
| Tax Assets | $- | $- | $454.83M | $461.81M | $142.38M | $526.65M | $515.66M | $642.07M | $631.30M | $618.00M | $597.73M | $587.94M | $591.96M | $557.58M | $538.63M | $528.55M | $516.10M | $533.52M | $516.76M | $515.71M |
| Other Non-Current Assets | $567.07M | $613.66M | $147.01M | $193.26M | $516.59M | $-388.19M | $-4.57M | $-131.26M | $-136.13M | $-88.46M | $-77.00M | $-68.69M | $-76.44M | $-34.77M | $-17.07M | $1.61M | $7.39M | $-16.55M | $-11.71M | $-14.51M |
| Total Non-Current Assets | $6.37B | $6.70B | $6.56B | $6.52B | $6.47B | $6.35B | $6.14B | $7.73B | $7.65B | $7.58B | $7.47B | $7.40B | $7.36B | $7.00B | $6.84B | $6.75B | $6.72B | $6.62B | $6.51B | $6.48B |
| Other Assets | $182.00K | $- | $- | $- | $-159.00K | $- | $- | $- | $- | $- | $- | $- | $- | $- | $- | $- | $- | $-499.00K | $-132.00K | $484.00K |
| Total Assets | $7.04B | $8.17B | $7.96B | $7.84B | $7.83B | $7.87B | $7.68B | $9.84B | $9.66B | $9.61B | $9.33B | $8.97B | $8.91B | $8.57B | $8.30B | $8.07B | $8.05B | $8.12B | $7.91B | $7.85B |
| Account Payables | $150.07M | $489.10M | $442.57M | $420.17M | $475.21M | $205.32M | $187.76M | $547.19M | $412.22M | $630.70M | $367.33M | $251.38M | $478.93M | $525.70M | $431.88M | $379.35M | $426.26M | $436.72M | $433.36M | $384.34M |
| Short Term Debt | $- | $246.91M | $242.80M | $83.83M | $202.09M | $413.94M | $391.65M | $649.48M | $380.35M | $383.59M | $381.70M | $317.15M | $218.79M | $112.55M | $115.12M | $116.68M | $118.86M | $144.10M | $155.53M | $78.84M |
| Tax Payables | $43.37M | $61.88M | $63.03M | $81.97M | $58.11M | $49.50M | $60.28M | $73.91M | $70.81M | $93.56M | $84.97M | $90.57M | $80.37M | $87.45M | $78.81M | $88.71M | $88.84M | $96.71M | $80.88M | $58.74M |
| Deferred Revenue | $- | $- | $193.30M | $-187.74M | $350.55M | $183.71M | $60.28M | $202.79M | $208.20M | $618.00M | $597.73M | $154.14M | $413.58M | $448.67M | $405.69M | $402.31M | $420.60M | $480.11M | $394.81M | $332.37M |
| Other Current Liabilities | $485.16M | $483.49M | $401.46M | $336.85M | $340.32M | $504.89M | $492.07M | $365.75M | $616.22M | $360.45M | $546.67M | $507.63M | $314.15M | $347.21M | $318.55M | $315.30M | $329.55M | $389.47M | $329.94M | $302.56M |
| Total Current Liabilities | $678.60M | $1.28B | $1.15B | $922.82M | $1.08B | $1.17B | $1.13B | $1.64B | $1.48B | $1.47B | $1.38B | $1.17B | $1.09B | $1.07B | $944.36M | $900.04M | $963.52M | $1.07B | $999.72M | $824.48M |
| Long Term Debt | $2.29B | $2.30B | $2.27B | $2.38B | $2.29B | $2.33B | $2.35B | $2.94B | $2.82B | $2.95B | $2.88B | $2.69B | $2.77B | $2.49B | $2.50B | $2.42B | $2.30B | $2.44B | $2.43B | $2.61B |
| Deferred Revenue Non-Current | $- | $- | $2.13M | $2.16M | $279.92M | $-435.00K | $380.06M | $442.00K | $6.00K | $12.00K | $19.00K | $40.00K | $591.96M | $455.52M | $450.62M | $445.17M | $440.36M | $425.57M | $422.17M | $417.47M |
| Deferred Tax Liabilities Non-Current | $- | $- | $454.83M | $461.81M | $458.55M | $526.65M | $515.66M | $642.07M | $631.30M | $618.00M | $597.73M | $587.94M | $591.96M | $557.58M | $538.63M | $528.55M | $516.10M | $533.52M | $516.76M | $515.71M |
| Other Non-Current Liabilities | $1.38B | $1.54B | $1.07B | $1.09B | $1.56B | $1.08B | $980.47M | $1.05B | $1.78B | $1.08B | $1.08B | $1.17B | $1.07B | $1.12B | $1.12B | $1.12B | $1.71B | $1.07B | $1.06B | $1.07B |
| Total Non-Current Liabilities | $3.67B | $3.83B | $3.79B | $3.94B | $3.85B | $3.94B | $3.85B | $4.63B | $4.59B | $4.65B | $4.56B | $4.44B | $4.44B | $4.16B | $4.16B | $4.07B | $4.01B | $4.05B | $4.01B | $4.19B |
| Other Liabilities | $-244.00K | $- | $- | $- | $- | $- | $- | $- | $- | $- | $- | $- | $- | $- | $- | $- | $- | $-734.00K | $-445.00K | $76.00K |
| Total Liabilities | $4.35B | $5.11B | $4.94B | $4.86B | $4.93B | $5.11B | $4.98B | $6.27B | $6.07B | $6.12B | $5.94B | $5.61B | $5.53B | $5.24B | $5.10B | $4.97B | $4.97B | $5.11B | $5.01B | $5.01B |
| Preferred Stock | $- | $- | $- | $- | $- | $- | $- | $- | $- | $- | $- | $- | $- | $- | $- | $- | $- | $235.00K | $313.00K | $803.00K |
| Common Stock | $- | $203.89M | $203.89M | $203.89M | $203.69M | $203.64M | $203.64M | $204.16M | $204.16M | $203.89M | $203.89M | $203.89M | $203.89M | $203.89M | $202.82M | $201.73M | $201.06M | $201.06M | $201.06M | $201.06M |
| Retained Earnings | $- | $1.40B | $1.36B | $1.33B | $1.25B | $1.11B | $1.06B | $1.94B | $1.95B | $1.88B | $1.78B | $1.75B | $1.76B | $1.72B | $1.62B | $1.57B | $1.56B | $1.49B | $1.38B | $1.32B |
| Accumulated Other Comprehensive Income Loss | $-16.80M | $-17.89M | $-18.17M | $-18.31M | $-18.38M | $-17.76M | $-17.70M | $-30.37M | $-30.58M | $-43.25M | $-43.53M | $-40.73M | $-41.00M | $-46.42M | $-46.97M | $-47.51M | $-48.08M | $-40.25M | $-40.81M | $-41.40M |
| Other Total Stockholders Equity | $2.71B | $1.47B | $1.47B | $1.47B | $1.47B | $1.46B | $1.46B | $1.46B | $1.46B | $1.45B | $1.45B | $1.45B | $1.46B | $1.45B | $1.42B | $1.38B | $1.37B | $1.36B | $1.36B | $1.36B |
| Total Stockholders Equity | $2.69B | $3.06B | $3.02B | $2.98B | $2.90B | $2.76B | $2.71B | $3.58B | $3.59B | $3.49B | $3.39B | $3.36B | $3.38B | $3.33B | $3.20B | $3.10B | $3.08B | $3.01B | $2.90B | $2.84B |
| Total Equity | $2.69B | $3.06B | $3.02B | $2.98B | $2.90B | $2.76B | $2.71B | $3.58B | $3.59B | $3.49B | $3.39B | $3.36B | $3.38B | $3.33B | $3.20B | $3.10B | $3.08B | $3.01B | $2.90B | $2.84B |
| Total Liabilities and Stockholders Equity | $7.04B | $8.17B | $7.96B | $7.84B | $7.83B | $7.87B | $7.68B | $9.84B | $9.66B | $9.61B | $9.33B | $8.97B | $8.91B | $8.57B | $8.30B | $8.07B | $8.05B | $8.12B | $7.91B | $7.85B |
| Minority Interest | $- | $- | $- | $- | $- | $- | $- | $- | $- | $- | $- | $- | $- | $- | $- | $- | $- | $- | $- | $- |
| Total Liabilities and Total Equity | $7.04B | $8.17B | $7.96B | $7.84B | $7.83B | $7.87B | $7.68B | $9.84B | $9.66B | $9.61B | $9.33B | $8.97B | $8.91B | $8.57B | $8.30B | $8.07B | $8.05B | $8.12B | $7.91B | $7.85B |
| Total Investments | $115.46M | $130.60M | $123.39M | $119.40M | $124.23M | $415.54M | $139.57M | $172.47M | $161.91M | $157.86M | $161.25M | $174.56M | $175.48M | $171.86M | $173.16M | $167.74M | $165.02M | $158.44M | $154.78M | $145.24M |
| Total Debt | $2.29B | $2.54B | $2.48B | $2.46B | $2.39B | $2.72B | $2.67B | $3.47B | $3.21B | $3.21B | $3.14B | $2.97B | $2.87B | $2.49B | $2.50B | $2.42B | $2.38B | $2.47B | $2.47B | $2.57B |
| Net Debt | $2.24B | $2.44B | $2.39B | $2.37B | $2.34B | $2.69B | $2.62B | $3.37B | $3.13B | $3.13B | $3.08B | $2.90B | $2.81B | $2.43B | $2.44B | $2.37B | $2.32B | $2.40B | $2.41B | $2.45B |
Annual Cash Flow
| Breakdown | December 31, 2024 | December 31, 2023 | December 31, 2022 | December 31, 2021 | December 31, 2020 |
|---|---|---|---|---|---|
| Net Income | $281.11M | $414.71M | $367.28M | $377.73M | $390.53M |
| Depreciation and Amortization | $200.08M | $213.60M | $327.83M | $274.31M | $285.10M |
| Deferred Income Tax | $-16.08M | $-4.41M | $23.33M | $60.25M | $-1.80M |
| Stock Based Compensation | $8.42M | $6.31M | $8.98M | $12.86M | $13.10M |
| Change in Working Capital | $- | $-10.04M | $-205.97M | $-176.69M | $83.72M |
| Accounts Receivables | $-30.31M | $110.43M | $-363.31M | $-94.27M | $62.79M |
| Inventory | $246.00K | $-27.59M | $-46.59M | $-42.30M | $-7.22M |
| Accounts Payables | $-443.00K | $-76.68M | $186.28M | $15.25M | $15.96M |
| Other Working Capital | $- | $-16.20M | $17.65M | $-55.37M | $12.20M |
| Other Non Cash Items | $-61.72M | $-287.53M | $-12.72M | $-54.51M | $-2.24M |
| Net Cash Provided by Operating Activities | $411.81M | $332.63M | $510.00M | $495.80M | $768.40M |
| Investments in Property Plant and Equipment | $-522.82M | $-519.73M | $-656.59M | $-659.42M | $-558.01M |
| Acquisitions Net | $- | $- | $1.75M | $-237.72M | $-105.98M |
| Purchases of Investments | $- | $- | $-6.48M | $-3.97M | $-1.81M |
| Sales Maturities of Investments | $- | $16.30M | $6.48M | $659.42M | $558.01M |
| Other Investing Activities | $-29.86M | $-37.37M | $15.94M | $-644.21M | $-522.41M |
| Net Cash Used for Investing Activities | $-552.68M | $-540.79M | $-638.90M | $-885.90M | $-630.20M |
| Debt Repayment | $31.46M | $282.80M | $345.78M | $197.28M | $18.82M |
| Common Stock Issued | $-50.00K | $- | $- | $88.77M | $3.38M |
| Common Stock Repurchased | $- | $-4.81M | $-7.55M | $-6.70M | $- |
| Dividends Paid | $-102.94M | $-161.32M | $-176.91M | $-171.35M | $-166.41M |
| Other Financing Activities | $111.77M | $87.95M | $-6.14M | $276.72M | $-839.00K |
| Net Cash Used Provided by Financing Activities | $40.30M | $204.62M | $155.20M | $384.71M | $-145.10M |
| Effect of Forex Changes on Cash | $- | $- | $- | $- | $- |
| Net Change in Cash | $-10.07M | $-3.54M | $26.30M | $-5.40M | $-6.90M |
| Cash at End of Period | $66.90M | $76.97M | $80.50M | $54.20M | $59.60M |
| Cash at Beginning of Period | $76.97M | $80.52M | $54.20M | $59.60M | $66.50M |
| Operating Cash Flow | $411.81M | $332.63M | $510.00M | $495.80M | $768.40M |
| Capital Expenditure | $-522.82M | $-519.73M | $-656.59M | $-659.42M | $-558.01M |
| Free Cash Flow | $-111.01M | $-187.10M | $-146.59M | $-163.62M | $210.39M |
Cash Flow Charts
| Breakdown | December 31, 2024 | September 30, 2024 | June 30, 2024 | March 31, 2024 | December 31, 2023 | September 30, 2023 | June 30, 2023 | March 31, 2023 | December 31, 2022 | September 30, 2022 | June 30, 2022 | March 31, 2022 | December 31, 2021 | September 30, 2021 | June 30, 2021 | March 31, 2021 | December 31, 2020 | September 30, 2020 | June 30, 2020 | March 31, 2020 |
|---|---|---|---|---|---|---|---|---|---|---|---|---|---|---|---|---|---|---|---|---|
| Net Income | $-42.56M | $64.48M | $60.57M | $100.90M | $170.70M | $78.22M | $193.16M | $38.34M | $116.98M | $147.93M | $70.63M | $31.73M | $86.48M | $138.96M | $100.17M | $52.12M | $112.13M | $153.01M | $99.84M | $25.54M |
| Depreciation and Amortization | $- | $56.16M | $55.88M | $55.75M | $54.70M | $53.15M | $-274.58M | $81.86M | $80.65M | $82.29M | $164.88M | $82.37M | $76.60M | $75.23M | $73.66M | $-73.72M | $72.27M | $72.08M | $71.51M | $69.24M |
| Deferred Income Tax | $-3.79M | $-3.71M | $-9.64M | $1.06M | $-68.16M | $8.27M | $46.62M | $8.86M | $4.58M | $17.28M | $7.93M | $-6.47M | $29.90M | $15.86M | $4.66M | $9.84M | $-18.21M | $13.53M | $1.07M | $1.81M |
| Stock Based Compensation | $1.36M | $1.95M | $1.95M | $3.17M | $2.37M | $2.20M | $-915.00K | $2.65M | $3.77M | $1.11M | $2.69M | $2.69M | $3.06M | $2.92M | $6.15M | $2.57M | $13.10M | $- | $- | $-362.00K |
| Change in Working Capital | $-54.23M | $-36.04M | $29.23M | $6.82M | $36.78M | $-8.89M | $140.96M | $-161.06M | $22.43M | $-68.82M | $-160.33M | $754.00K | $-23.79M | $-29.84M | $-84.08M | $-38.98M | $98.76M | $-18.75M | $20.91M | $-17.19M |
| Accounts Receivables | $-44.82M | $-9.62M | $11.84M | $12.28M | $-50.93M | $37.06M | $109.34M | $14.97M | $-16.43M | $-104.63M | $-242.25M | $-5.72M | $44.98M | $-53.60M | $-115.30M | $29.64M | $77.23M | $-41.97M | $-8.40M | $35.92M |
| Inventory | $6.55M | $-23.15M | $-11.28M | $28.13M | $-7.90M | $-21.12M | $42.31M | $-40.88M | $14.08M | $3.17M | $-19.76M | $-44.08M | $-20.90M | $3.93M | $283.00K | $-25.61M | $2.36M | $16.70M | $3.06M | $-29.34M |
| Accounts Payables | $-7.62M | $43.03M | $5.62M | $-41.47M | $55.64M | $4.99M | $-43.76M | $-93.55M | $37.83M | $44.01M | $101.47M | $2.98M | $-17.93M | $37.02M | $38.12M | $-41.97M | $-3.17M | $5.74M | $37.49M | $-24.11M |
| Other Working Capital | $-8.34M | $-46.30M | $23.05M | $7.87M | $39.97M | $-29.82M | $33.07M | $119.47M | $-13.05M | $-11.37M | $212.00K | $41.85M | $15.04M | $-70.79M | $-122.48M | $28.59M | $99.57M | $-41.19M | $-19.65M | $36.25M |
| Other Non Cash Items | $159.75M | $55.07M | $-1.52M | $113.13M | $-38.70M | $-31.13M | $11.95M | $-14.71M | $-3.34M | $-12.31M | $-80.76M | $1.33M | $37.41M | $58.02M | $66.43M | $72.65M | $94.01M | $72.51M | $60.28M | $69.14M |
| Net Cash Provided by Operating Activities | $60.53M | $137.90M | $136.47M | $165.10M | $157.69M | $101.81M | $116.75M | $-43.60M | $225.07M | $167.48M | $5.04M | $112.41M | $130.00M | $183.00M | $87.18M | $95.62M | $286.70M | $220.30M | $182.10M | $79.30M |
| Investments in Property Plant and Equipment | $-121.83M | $-157.53M | $-117.25M | $-126.21M | $-149.14M | $-138.45M | $-78.09M | $-154.05M | $-193.59M | $-172.86M | $-139.86M | $-150.29M | $-231.31M | $-166.18M | $-150.85M | $-111.09M | $-144.16M | $-165.04M | $-109.31M | $-139.49M |
| Acquisitions Net | $- | $-5.42M | $2.60M | $2.82M | $3.24M | $-294.00K | $6.25M | $7.28M | $1.29M | $974.00K | $-262.00K | $-524.00K | $-224.00M | $552.00K | $-12.70M | $-1.02M | $-34.50M | $-750.00K | $-3.14M | $-67.59M |
| Purchases of Investments | $- | $3.31M | $-399.00K | $-2.91M | $3.34M | $-365.00K | $1.28M | $-4.26M | $-2.07M | $269.00K | $-238.00K | $-4.44M | $-196.00K | $-533.00K | $4.00K | $-3.25M | $- | $- | $- | $- |
| Sales Maturities of Investments | $- | $- | $- | $- | $16.30M | $659.00K | $-7.53M | $-3.02M | $2.07M | $-269.00K | $500.00K | $- | $- | $- | $- | $- | $- | $- | $- | $- |
| Other Investing Activities | $-38.44M | $3.20M | $-3.65M | $9.03M | $1.16M | $-659.00K | $-47.49M | $3.05M | $18.74M | $-2.44M | $-500.00K | $144.00K | $-229.30M | $-166.10M | $-147.47M | $-105.30M | $-133.90M | $-164.55M | $-90.86M | $-134.91M |
| Net Cash Used for Investing Activities | $-160.28M | $-156.45M | $-118.70M | $-117.26M | $-125.10M | $-139.11M | $-125.58M | $-151.00M | $-173.55M | $-174.32M | $-140.36M | $-150.67M | $-453.30M | $-166.10M | $-160.17M | $-106.33M | $-168.40M | $-165.30M | $-94.00M | $-202.50M |
| Debt Repayment | $-28.20M | $52.10M | $14.00M | $-6.95M | $37.99M | $55.00M | $-72.50M | $129.01M | $-1.47M | $59.23M | $180.41M | $106.38M | $364.37M | $-8.94M | $83.62M | $40.00M | $-83.09M | $-11.75M | $-98.60M | $211.78M |
| Common Stock Issued | $- | $-15.00K | $- | $-35.00K | $- | $- | $- | $- | $- | $1.07M | $- | $- | $- | $34.18M | $34.95M | $19.70M | $-25.00K | $- | $- | $3.41M |
| Common Stock Repurchased | $- | $50.00K | $- | $-35.00K | $- | $- | $- | $-4.81M | $- | $1.00K | $-1.00K | $-12.30M | $- | $- | $- | $-6.70M | $- | $- | $- | $- |
| Dividends Paid | $-26.02M | $-25.51M | $-25.50M | $-25.90M | $-25.45M | $-45.31M | $-45.31M | $-45.25M | $-44.23M | $-44.23M | $-44.23M | $-44.23M | $-43.21M | $-42.79M | $-42.74M | $-42.61M | $-41.61M | $-41.61M | $-41.61M | $-41.58M |
| Other Financing Activities | $116.86M | $-779.00K | $-1.12M | $-2.66M | $-677.00K | $-771.00K | $94.30M | $128.39M | $- | $1.07M | $-350.00K | $-5.62M | $-918.00K | $- | $- | $-4.13M | $- | $- | $- | $-362.00K |
| Net Cash Used Provided by Financing Activities | $62.63M | $25.81M | $-12.63M | $-35.51M | $11.94M | $8.92M | $-23.54M | $207.30M | $-45.67M | $16.07M | $135.81M | $49.00M | $320.17M | $-17.55M | $75.83M | $6.25M | $-124.80M | $-53.30M | $-140.20M | $173.20M |
| Effect of Forex Changes on Cash | $- | $- | $- | $- | $-43.00K | $10.09M | $-10.12M | $- | $39.00K | $- | $- | $- | $- | $- | $- | $- | $- | $- | $- | $- |
| Net Change in Cash | $-37.11M | $9.58M | $5.14M | $12.32M | $44.48M | $-18.29M | $-42.49M | $12.70M | $5.88M | $9.23M | $490.00K | $10.74M | $-3.10M | $-700.00K | $2.91M | $-4.45M | $-6.50M | $1.70M | $-52.10M | $50.00M |
| Cash at End of Period | $66.90M | $104.02M | $94.44M | $89.30M | $76.97M | $32.49M | $50.70M | $93.20M | $80.50M | $74.62M | $65.39M | $64.90M | $54.20M | $57.30M | $58.00M | $55.09M | $59.60M | $66.10M | $64.40M | $116.50M |
| Cash at Beginning of Period | $104.02M | $94.44M | $89.30M | $76.97M | $32.49M | $50.78M | $93.19M | $80.50M | $74.62M | $65.39M | $64.90M | $54.16M | $57.30M | $58.00M | $55.09M | $59.55M | $66.10M | $64.40M | $116.50M | $66.50M |
| Operating Cash Flow | $60.53M | $137.90M | $136.47M | $165.10M | $157.69M | $101.81M | $116.75M | $-43.60M | $225.07M | $167.48M | $5.04M | $112.41M | $130.00M | $183.00M | $87.18M | $95.62M | $286.70M | $220.30M | $182.10M | $79.30M |
| Capital Expenditure | $-121.83M | $-157.53M | $-117.25M | $-126.21M | $-149.14M | $-138.45M | $-78.09M | $-154.05M | $-193.59M | $-172.86M | $-139.86M | $-150.29M | $-231.31M | $-166.18M | $-150.85M | $-111.09M | $-144.16M | $-165.04M | $-109.31M | $-139.49M |
| Free Cash Flow | $-61.30M | $-19.63M | $19.23M | $38.89M | $8.54M | $-36.63M | $38.66M | $-197.65M | $31.48M | $-5.37M | $-134.82M | $-37.88M | $-101.31M | $16.82M | $-63.67M | $-15.47M | $142.53M | $55.26M | $72.78M | $-60.19M |
MDU Resources Group Dividends
Explore MDU Resources Group's dividend history, including dividend yield, payout ratio, and historical payments.
Dividend Yield
2.80%
Dividend Payout Ratio
36.62%
Dividend Paid & Capex Coverage Ratio
0.66x
MDU Resources Group Dividend History
| Dividend | Adjusted Dividend | Date | Record Date | Payment Date | Declaration Date |
|---|---|---|---|---|---|
| $0.13 | $0.13 | March 13, 2025 | March 13, 2025 | April 01, 2025 | February 13, 2025 |
| $0.13 | $0.07150000000000001 | December 12, 2024 | December 12, 2024 | January 01, 2025 | November 14, 2024 |
| $0.2346 | $0.13 | September 12, 2024 | September 12, 2024 | October 01, 2024 | August 15, 2024 |
| $0.2256 | $0.125 | June 13, 2024 | June 13, 2024 | July 01, 2024 | May 15, 2024 |
| $0.125 | $0.069252 | March 13, 2024 | March 14, 2024 | April 01, 2024 | February 15, 2024 |
| $0.2256 | $0.125 | December 13, 2023 | December 14, 2023 | January 01, 2024 | November 16, 2023 |
| $0.2256 | $0.125 | September 13, 2023 | September 14, 2023 | October 01, 2023 | August 03, 2023 |
| $0.4016 | $0.2225 | June 12, 2023 | June 13, 2023 | July 01, 2023 | May 04, 2023 |
| $0.5851 | $0.2225 | March 08, 2023 | March 09, 2023 | April 01, 2023 | February 16, 2023 |
| $0.5851 | $0.2225 | December 07, 2022 | December 08, 2022 | January 01, 2023 | November 17, 2022 |
| $0.572 | $0.2175 | September 07, 2022 | September 08, 2022 | October 01, 2022 | August 11, 2022 |
| $0.572 | $0.2175 | June 08, 2022 | June 09, 2022 | July 01, 2022 | May 11, 2022 |
| $0.572 | $0.2175 | March 09, 2022 | March 10, 2022 | April 01, 2022 | February 17, 2022 |
| $0.572 | $0.2175 | December 08, 2021 | December 09, 2021 | January 01, 2022 | November 11, 2021 |
| $0.3845 | $0.14619 | September 08, 2021 | September 09, 2021 | October 01, 2021 | August 12, 2021 |
| $0.3845 | $0.14619 | June 09, 2021 | June 10, 2021 | July 01, 2021 | May 12, 2021 |
| $0.2125 | $0.080992 | March 10, 2021 | March 11, 2021 | April 01, 2021 | February 11, 2021 |
| $0.3845 | $0.14619 | December 09, 2020 | December 10, 2020 | January 01, 2021 | November 12, 2020 |
| $0.207 | $0.079091 | September 09, 2020 | September 10, 2020 | October 01, 2020 | August 13, 2020 |
| $0.2075 | $0.079091 | June 10, 2020 | June 11, 2020 | July 01, 2020 | May 13, 2020 |
MDU Resources Group News
Read the latest news about MDU Resources Group, including recent articles, headlines, and updates.
ECG Investors Have Opportunity to Lead Everus Construction Group, Inc. Securities Fraud Lawsuit
NEW YORK , April 28, 2025 /PRNewswire/ -- Rosen Law Firm, a global investor rights law firm, reminds purchasers of common stock of Everus Construction Group, Inc. (NYSE: ECG) between October 31, 2024 and February 11, 2025, both dates inclusive (the "Class Period"), including investors who held MDU Resources Group, Inc. ("MDU Resources") common stock as of October 21, 2024 and acquired Everus Construction common stock issued in connection with the spinoff of Everus Construction on or about October 31, 2024 (the "Spinoff"), of the important June 3, 2025 lead plaintiff deadline. So What: If you purchased Everus Construction common stock during the Class Period and/or held MDU Resources common stock and acquired Everus Construction common stock in connection with the Spinoff you may be entitled to compensation without payment of any out of pocket fees or costs through a contingency fee arrangement.


ROSEN, GLOBAL INVESTOR COUNSEL, Encourages Everus Construction Group, Inc. Investors to Secure Counsel Before Important Deadline in Securities Class Action – ECG
NEW YORK, NY / ACCESS Newswire / April 16, 2025 / WHY: Rosen Law Firm, a global investor rights law firm, reminds purchasers of common stock of Everus Construction Group, Inc. (NYSE:ECG) between October 31, 2024 and February 11, 2025, both dates inclusive (the "Class Period"), including investors who held MDU Resources Group, Inc. ("MDU Resources") common stock as of October 21, 2024 and acquired Everus Construction common stock issued in connection with the spinoff of Everus Construction on or about October 31, 2024 (the "Spinoff"), of the important June 3, 2025 lead plaintiff deadline. SO WHAT: If you purchased Everus Construction common stock during the Class Period and/or held MDU Resources common stock and acquired Everus Construction common stock in connection with the Spinoff you may be entitled to compensation without payment of any out of pocket fees or costs through a contingency fee arrangement.

MDU Resources: Powerful Tailwinds, And The Market Knows It
MDU Resources, a regulated utility, serves sparsely populated regions but offers a 3.15% yield, higher than the S&P 500 and U.S. Utilities Index. Despite a lower yield compared to peers, MDU Resources has historically outperformed in total return, partly due to its past construction business. The recent spin-off of construction businesses makes MDU Resources a pure-play utility, potentially enhancing stability in the face of an economic downturn.

MDU Resources Announces Plans to Invest in Badger Wind Farm
BISMARCK, N.D. , Feb. 14, 2025 /PRNewswire/ -- MDU Resources Group, Inc. (NYSE: MDU) is pleased to announce that its subsidiary, Montana-Dakota Utilities Co. (MDU), has signed a purchase agreement to acquire a 49% ownership interest in the Badger Wind Farm.


MDU Resources Group, Inc. (MDU) Q4 2024 Earnings Call Transcript
MDU Resources Group, Inc. (NYSE:MDU ) Q4 2024 Earnings Conference Call February 6, 2025 2:00 PM ET Company Participants Jason Vollmer - Chief Financial Officer Nicole Kivisto - President & Chief Executive Officer Rob Johnson - President, WBI Energy Conference Call Participants Ryan Levine - Citi Operator Hello. My name is Constantine, and I will be your conference facilitator.


MDU Resources: Power-Packed Opportunity For Income And Growth Investors
MDU Resources, now a pure-play regulated energy delivery business, has shown strong financial performance post-spin-offs. MDU benefits from strategic rate adjustments, infrastructure investments, and expanding data center agreements, positioning it for continued growth. MDU's solid balance sheet, investment-grade credit rating, and potential 4% dividend yield, combined with 6-8% annual EPS growth guidance, offer a balanced mix of income and growth.


3 Gas Distribution Stocks to Watch From a Flourishing Industry
Increased natural gas export volumes and regular investment in pipelines are driving the Zacks Gas Distribution industry's near-term prospects. Utilities with stable infrastructure like ATO, MDU and NJR can provide reliable services to customers and benefit from a positive industry outlook.
MDU Resources initiated with a Hold at Jefferies
Jefferies initiated coverage of MDU Resources with a Hold rating and $18 price target. MDU Resources is an upper-midwest, pacific northwest electric/gas utility and pipeline operator that is pursuing its pure-play regulated growth story, says the analyst, who models 8.3% EPS compound annual growth at the high-end of the 6-8% EPS CAGR target. The stock's premium to electric/gas peers reflect diversified utilities, data center exposure, and the pipeline outlook, the analyst tells investors.


NorthWestern Energy Welcomes New Board Member
BUTTE, Mont. & SIOUX FALLS, S.D.--(BUSINESS WIRE)--NorthWestern Energy Group, Inc. d/b/a NorthWestern Energy (Nasdaq: NWE) today announced that its board of directors recently elected David L. Goodin as a director to a term commencing Dec. 1, 2024. Goodin brings extensive utility operations and executive experience to the independent board. Goodin has over 40 years of experience in the utility industry with MDU Resources Group, Inc. (NYSE: MDU). On Jan. 5, 2024, he retired as MDU's president an.


Everus Construction Group Set to Join S&P SmallCap 600
NEW YORK , Oct. 29, 2024 /PRNewswire/ -- Everus Construction Group Inc. (NYSE: ECG) will be added to the S&P SmallCap 600 effective prior to the opening of trading on Friday, November 1, replacing Clearwater Paper Corp. (NYSE: CLW), which will be removed from the S&P SmallCap 600 effective prior to the opening of trading on Monday, November 4. S&P SmallCap 600 constituent MDU Resources Group Inc. (NYSE: MDU) is spinning off Everus Construction Group in a transaction expected to be completed on November 1.

Similar Companies
Related Metrics
Explore detailed financial metrics and analysis for MDU.