MP Materials Key Executives
This section highlights MP Materials's key executives, including their titles and compensation details.
Find Contacts at MP Materials
(Showing 0 of )
MP Materials Earnings
This section highlights MP Materials's earnings, including key dates, EPS, earnings reports, and earnings call transcripts.
Next Earnings Date
Last Earnings Results
Earnings Call Transcripts
| Transcript | Quarter | Year | Date | Estimated EPS | Actual EPS |
|---|---|---|---|---|---|
| Read Transcript | Q4 | 2024 | 2025-02-20 | $-0.09 | $-0.12 |
| Read Transcript | Q3 | 2024 | 2024-11-07 | $-0.11 | $-0.12 |
| Read Transcript | Q2 | 2024 | 2024-08-01 | $-0.10 | $-0.17 |
| Read Transcript | Q1 | 2024 | 2024-05-02 | $-0.02 | $-0.04 |
| Read Transcript | Q4 | 2023 | 2024-02-22 | $-0.01 | $-0.02 |
| Read Transcript | Q3 | 2023 | 2023-11-02 | $0.00 | $0.04 |
| Read Transcript | Q2 | 2023 | 2023-08-03 | $0.07 | $0.09 |
| Read Transcript | Q1 | 2023 | 2023-05-04 | $0.18 | $0.27 |
Financial Statements
Access annual & quarterly financial statements for MP Materials, including income statements, balance sheets, and cash flow statements..
Annual Income Statement
| Breakdown | December 31, 2024 | December 31, 2023 | December 31, 2022 | December 31, 2021 | December 31, 2020 |
|---|---|---|---|---|---|
| Revenue | $203.85M | $253.44M | $527.51M | $331.95M | $134.31M |
| Cost of Revenue | $270.64M | $148.42M | $110.57M | $100.64M | $102.40M |
| Gross Profit | $-66.79M | $105.02M | $416.94M | $231.32M | $31.91M |
| Gross Profit Ratio | -32.76% | 41.44% | 79.04% | 69.68% | 23.76% |
| Research and Development Expenses | $9.31M | $3.50M | $11.82M | $4.57M | $140.00K |
| General and Administrative Expenses | $- | $- | $75.84M | $57.22M | $27.01M |
| Selling and Marketing Expenses | $- | $- | $- | $- | $- |
| Selling General and Administrative Expenses | $83.30M | $79.25M | $75.84M | $57.22M | $27.01M |
| Other Expenses | $10.03M | $- | $1.48M | $2.38M | $2.25M |
| Operating Expenses | $102.64M | $82.74M | $89.13M | $64.16M | $29.26M |
| Cost and Expenses | $373.28M | $231.16M | $199.71M | $164.80M | $102.40M |
| Interest Income | $- | $326.00K | $19.83M | $353.00K | $163.00K |
| Interest Expense | $23.01M | $5.58M | $5.79M | $8.90M | $5.01M |
| Depreciation and Amortization | $78.06M | $56.62M | $19.83M | $26.76M | $9.19M |
| EBITDA | $7.72M | $94.95M | $366.77M | $195.86M | $-25.27M |
| EBITDA Ratio | 3.79% | 37.46% | 69.53% | 59.00% | -18.81% |
| Operating Income | $-169.43M | $22.28M | $327.41M | $165.34M | $25.23M |
| Operating Income Ratio | -83.11% | 8.79% | 62.07% | 49.81% | 18.79% |
| Total Other Income Expenses Net | $76.08M | $10.79M | $13.74M | $-5.15M | $-4.76M |
| Income Before Tax | $-93.35M | $33.08M | $341.15M | $160.19M | $-39.46M |
| Income Before Tax Ratio | -45.79% | 13.05% | 64.67% | 48.26% | -29.38% |
| Income Tax Expense | $-27.92M | $8.77M | $52.15M | $25.16M | $-17.64M |
| Net Income | $-65.42M | $24.31M | $289.00M | $135.04M | $-21.82M |
| Net Income Ratio | -32.09% | 9.59% | 54.79% | 40.68% | -16.25% |
| EPS | $-0.20 | $0.14 | $1.64 | $0.78 | $-0.27 |
| EPS Diluted | $-0.20 | $0.14 | $1.52 | $0.73 | $-0.27 |
| Weighted Average Shares Outstanding | 166.84M | 177.18M | 176.52M | 173.47M | 79.69M |
| Weighted Average Shares Outstanding Diluted | 169.88M | 178.15M | 193.45M | 189.84M | 79.69M |
| SEC Filing | Source | Source | Source | Source | Source |
| Breakdown | December 31, 2024 | September 30, 2024 | June 30, 2024 | March 31, 2024 | December 31, 2023 | September 30, 2023 | June 30, 2023 | March 31, 2023 | December 31, 2022 | September 30, 2022 | June 30, 2022 | March 31, 2022 | December 31, 2021 | September 30, 2021 | June 30, 2021 | March 31, 2021 | December 31, 2020 | September 30, 2020 | June 30, 2020 | March 31, 2020 |
|---|---|---|---|---|---|---|---|---|---|---|---|---|---|---|---|---|---|---|---|---|
| Revenue | $60.99M | $62.93M | $31.26M | $48.68M | $41.20M | $52.52M | $64.02M | $95.70M | $93.25M | $124.44M | $143.56M | $166.26M | $99.11M | $99.75M | $73.12M | $59.97M | $42.18M | $41.02M | $30.39M | $20.72M |
| Cost of Revenue | $80.38M | $654.00K | $59.90M | $53.98M | $656.00K | $38.97M | $34.91M | $32.34M | $30.13M | $24.51M | $27.50M | $28.43M | $23.07M | $28.86M | $24.62M | $38.26M | $34.44M | $24.87M | $18.61M | $14.43M |
| Gross Profit | $-19.39M | $62.27M | $-28.64M | $-5.29M | $40.55M | $13.55M | $29.12M | $63.36M | $63.12M | $99.93M | $116.06M | $137.82M | $76.04M | $70.90M | $48.50M | $21.71M | $7.74M | $16.15M | $11.78M | $6.29M |
| Gross Profit Ratio | -31.80% | 98.96% | -91.64% | -10.88% | 98.41% | 25.80% | 45.48% | 66.21% | 67.69% | 80.30% | 80.85% | 82.90% | 76.72% | 71.07% | 66.33% | 36.20% | 18.35% | 39.38% | 38.75% | 30.38% |
| Research and Development Expenses | $1.16M | $- | $1.00M | $409.00K | $-10.78M | $10.21M | $7.22M | $8.28M | $5.59M | $2.74M | $1.77M | $1.82M | $2.14M | $1.33M | $984.00K | $125.00K | $11.00K | $11.00K | $- | $- |
| General and Administrative Expenses | $- | $- | $- | $- | $19.40M | $- | $- | $19.40M | $19.71M | $17.60M | $18.22M | $20.57M | $16.23M | $14.88M | $13.63M | $13.58M | $12.53M | $5.63M | $5.84M | $3.08M |
| Selling and Marketing Expenses | $- | $- | $- | $- | $2.01M | $- | $- | $- | $- | $- | $-102.00K | $- | $- | $- | $- | $- | $-14.48M | $- | $- | $- |
| Selling General and Administrative Expenses | $19.07M | $21.52M | $21.43M | $21.27M | $21.42M | $19.56M | $18.86M | $19.40M | $19.71M | $17.60M | $18.12M | $20.57M | $16.23M | $14.88M | $13.63M | $13.58M | $12.53M | $5.63M | $5.84M | $3.08M |
| Other Expenses | $4.33M | $80.29M | $230.00K | $12.66M | $52.76M | $14.46M | $13.82M | $227.00K | $222.00K | $418.00K | $2.21M | $418.00K | $98.00K | $97.00K | $3.50M | $55.00K | $-47.00K | $61.00K | $155.00K | $82.00K |
| Operating Expenses | $24.57M | $101.81M | $22.21M | $21.68M | $74.18M | $30.00M | $26.31M | $27.91M | $25.52M | $20.77M | $20.31M | $22.80M | $18.96M | $16.80M | $14.22M | $14.18M | $13.00M | $6.21M | $6.41M | $3.65M |
| Cost and Expenses | $104.95M | $102.47M | $82.11M | $75.66M | $74.83M | $68.97M | $61.22M | $60.25M | $55.65M | $45.28M | $47.81M | $51.23M | $42.03M | $45.66M | $38.84M | $38.26M | $34.44M | $24.87M | $25.02M | $18.07M |
| Interest Income | $- | $- | $- | $- | $14.03M | $14.46M | $13.82M | $13.30M | $10.95M | $6.17M | $- | $- | $- | $- | $- | $- | $163.00K | $31.95K | $36.88K | $- |
| Interest Expense | $6.76M | $6.65M | $6.75M | $2.86M | $1.11M | $1.40M | $1.39M | $1.36M | $1.33M | $1.22M | $1.33M | $1.91M | $2.49M | $2.62M | $2.64M | $1.15M | $1.43M | $1.71M | $1.07M | $803.00K |
| Depreciation and Amortization | $22.12M | $19.34M | $18.44M | $18.62M | $18.86M | $16.98M | $12.43M | $8.35M | $5.82M | $2.51M | $5.83M | $5.68M | $5.21M | $7.55M | $7.26M | $6.74M | $2.10M | $2.18M | $1.38M | $1.27M |
| EBITDA | $-18.61M | $-8.88M | $-22.97M | $45.11M | $-690.00K | $13.90M | $26.73M | $55.00M | $54.23M | $87.85M | $103.79M | $120.90M | $62.39M | $61.74M | $43.23M | $28.51M | $9.79M | $18.39M | $-59.71M | $4.00M |
| EBITDA Ratio | -30.51% | -14.11% | -73.48% | 92.65% | -1.67% | 26.46% | 41.76% | 57.48% | 58.16% | 70.59% | 72.30% | 72.72% | 62.95% | 61.89% | 59.12% | 47.53% | 23.22% | 44.84% | -196.46% | 19.30% |
| Operating Income | $-43.96M | $-39.54M | $-50.85M | $-26.97M | $-33.63M | $-17.54M | $483.00K | $32.96M | $37.47M | $79.17M | $95.75M | $115.02M | $57.08M | $54.09M | $32.47M | $21.71M | $7.74M | $16.15M | $-61.24M | $2.65M |
| Operating Income Ratio | -72.09% | -62.83% | -162.68% | -55.40% | -81.61% | -33.39% | 0.75% | 34.44% | 40.18% | 63.62% | 66.70% | 69.18% | 57.59% | 54.23% | 44.40% | 36.20% | 18.35% | 39.38% | -201.52% | 12.77% |
| Total Other Income Expenses Net | $10.00M | $4.67M | $2.70M | $56.06M | $12.97M | $13.06M | $12.43M | $12.33M | $9.62M | $4.94M | $886.00K | $-1.71M | $-2.39M | $-2.53M | $865.00K | $-1.10M | $-1.47M | $-1.65M | $-61.80M | $-721.00K |
| Income Before Tax | $-33.96M | $-34.87M | $-48.15M | $23.63M | $-20.66M | $-4.48M | $12.91M | $45.30M | $47.09M | $84.11M | $96.64M | $113.31M | $54.69M | $51.57M | $33.33M | $20.61M | $6.27M | $14.50M | $-62.16M | $1.93M |
| Income Before Tax Ratio | -55.69% | -55.41% | -154.05% | 48.54% | -50.13% | -8.52% | 20.17% | 47.33% | 50.50% | 67.59% | 67.32% | 68.15% | 55.18% | 51.69% | 45.58% | 34.37% | 14.86% | 35.35% | -204.52% | 9.29% |
| Income Tax Expense | $11.62M | $-9.35M | $-14.10M | $7.14M | $4.40M | $-200.00K | $5.52M | $7.85M | $-19.92M | $20.93M | $23.37M | $27.76M | $5.70M | $8.80M | $6.16M | $4.49M | $-17.85M | $-125.00K | $336.00K | $-1.27M |
| Net Income | $-22.34M | $-25.52M | $-34.05M | $16.49M | $-16.26M | $-4.28M | $7.39M | $37.45M | $67.01M | $63.18M | $73.27M | $85.55M | $48.99M | $42.76M | $27.17M | $16.12M | $24.11M | $14.63M | $-62.49M | $1.93M |
| Net Income Ratio | -36.63% | -40.55% | -108.95% | 33.87% | -39.46% | -8.14% | 11.55% | 39.13% | 71.86% | 50.77% | 51.04% | 51.46% | 49.43% | 42.87% | 37.15% | 26.88% | 57.17% | 35.66% | -205.62% | 9.29% |
| EPS | $-0.14 | $-0.16 | $-0.21 | $0.09 | $-0.09 | $-0.02 | $0.04 | $0.21 | $0.38 | $0.33 | $0.42 | $0.45 | $0.28 | $0.24 | $0.16 | $0.10 | $0.22 | $0.20 | $-0.92 | $0.03 |
| EPS Diluted | $-0.14 | $-0.16 | $-0.21 | $-0.08 | $-0.09 | $-0.02 | $0.04 | $0.19 | $0.35 | $0.33 | $0.38 | $0.44 | $0.26 | $0.23 | $0.15 | $0.09 | $0.20 | $0.20 | $-0.92 | $0.03 |
| Weighted Average Shares Outstanding | 163.38M | 164.15M | 165.34M | 174.56M | 177.62M | 177.23M | 176.98M | 176.88M | 176.65M | 190.44M | 176.53M | 191.28M | 176.12M | 176.05M | 172.68M | 168.92M | 111.90M | 71.94M | 68.10M | 71.94M |
| Weighted Average Shares Outstanding Diluted | 163.38M | 164.15M | 165.34M | 186.79M | 177.62M | 177.23M | 177.86M | 193.61M | 193.49M | 193.41M | 193.41M | 193.49M | 193.39M | 193.22M | 193.15M | 179.32M | 123.01M | 71.94M | 68.10M | 71.94M |
| SEC Filing | Source | Source | Source | Source | Source | Source | Source | Source | Source | Source | Source | Source | Source | Source | Source | Source | Source | Source | Source | Source |
Annual Balance Sheet
| Breakdown | December 31, 2024 | December 31, 2023 | December 31, 2022 | December 31, 2021 | December 31, 2020 |
|---|---|---|---|---|---|
| Cash and Cash Equivalents | $282.44M | $263.35M | $136.63M | $1.18B | $519.65M |
| Short Term Investments | $568.43M | $734.49M | $1.05B | $- | $- |
| Cash and Short Term Investments | $850.87M | $997.84M | $1.18B | $1.18B | $519.65M |
| Net Receivables | $18.87M | $29.33M | $32.86M | $51.01M | $3.59M |
| Inventory | $107.91M | $95.18M | $57.55M | $38.69M | $32.27M |
| Other Current Assets | $53.67M | $8.82M | $21.07M | $7.81M | $5.53M |
| Total Current Assets | $1.03B | $1.13B | $1.29B | $1.28B | $561.05M |
| Property Plant Equipment Net | $1.26B | $1.17B | $935.74M | $611.37M | $503.00M |
| Goodwill | $- | $- | $-684.00K | $- | $- |
| Intangible Assets | $7.37M | $8.88M | $89.00K | $- | $- |
| Goodwill and Intangible Assets | $7.37M | $8.88M | $-595.00K | $-516.00K | $-9.10M |
| Long Term Investments | $- | $9.67M | $595.00K | $516.00K | $9.10M |
| Tax Assets | $- | $- | $122.35M | $104.50M | $87.47M |
| Other Non-Current Assets | $34.69M | $18.01M | $-114.14M | $-103.01M | $-77.23M |
| Total Non-Current Assets | $1.30B | $1.21B | $943.96M | $612.86M | $513.24M |
| Other Assets | $- | $- | $- | $- | $- |
| Total Assets | $2.33B | $2.34B | $2.24B | $1.89B | $1.07B |
| Account Payables | $23.56M | $28.00M | $15.33M | $35.73M | $16.16M |
| Short Term Debt | $- | $- | $2.39M | $16.34M | $24.74M |
| Tax Payables | $4.04M | $- | $21.16M | $3.46M | $- |
| Deferred Revenue | $56.88M | $- | $122.35M | $3.46M | $-16.16M |
| Other Current Liabilities | $79.54M | $80.56M | $58.60M | $4.01M | $2.16M |
| Total Current Liabilities | $164.02M | $108.55M | $97.48M | $59.54M | $43.06M |
| Long Term Debt | $11.60M | $688.81M | $678.46M | $675.48M | $46.08M |
| Deferred Revenue Non-Current | $25.50M | $17.43M | $- | $34.21M | $42.17M |
| Deferred Tax Liabilities Non-Current | $85.31M | $130.79M | $122.35M | $104.50M | $87.47M |
| Other Non-Current Liabilities | $1.02B | $25.09M | $26.86M | $145.91M | $43.80M |
| Total Non-Current Liabilities | $1.11B | $862.12M | $827.67M | $821.39M | $177.35M |
| Other Liabilities | $- | $- | $- | $- | $- |
| Total Liabilities | $1.28B | $970.67M | $925.15M | $880.93M | $220.41M |
| Preferred Stock | $- | $- | $- | $- | $0 |
| Common Stock | $18.00K | $17.00K | $18.00K | $18.00K | $17.00K |
| Retained Earnings | $320.30M | $385.73M | $361.42M | $72.42M | $-62.62M |
| Accumulated Other Comprehensive Income Loss | $173.00K | $145.00K | $189.00K | $-0 | $-0 |
| Other Total Stockholders Equity | $734.39M | $979.89M | $951.01M | $936.30M | $916.48M |
| Total Stockholders Equity | $1.05B | $1.37B | $1.31B | $1.01B | $853.88M |
| Total Equity | $1.05B | $1.37B | $1.31B | $1.01B | $853.88M |
| Total Liabilities and Stockholders Equity | $2.33B | $2.34B | $2.24B | $1.89B | $1.07B |
| Minority Interest | $- | $- | $- | $- | $- |
| Total Liabilities and Total Equity | $2.33B | $2.34B | $2.24B | $1.89B | $1.07B |
| Total Investments | $568.43M | $744.17M | $1.05B | $516.00K | $9.10M |
| Total Debt | $5.80M | $688.81M | $678.44M | $691.82M | $70.82M |
| Net Debt | $-276.64M | $425.46M | $541.82M | $-487.48M | $-448.84M |
Balance Sheet Charts
| Breakdown | December 31, 2024 | September 30, 2024 | June 30, 2024 | March 31, 2024 | December 31, 2023 | September 30, 2023 | June 30, 2023 | March 31, 2023 | December 31, 2022 | September 30, 2022 | June 30, 2022 | March 31, 2022 | December 31, 2021 | September 30, 2021 | June 30, 2021 | March 31, 2021 | December 31, 2020 | September 30, 2020 | June 30, 2020 | March 31, 2020 |
|---|---|---|---|---|---|---|---|---|---|---|---|---|---|---|---|---|---|---|---|---|
| Cash and Cash Equivalents | $282.44M | $284.43M | $296.69M | $297.16M | $264.64M | $547.67M | $927.25M | $651.22M | $136.63M | $427.97M | $664.46M | $1.23B | $1.18B | $1.18B | $1.20B | $1.18B | $519.65M | $30.24M | $38.55M | $-2.76M |
| Short Term Investments | $568.43M | $582.06M | $641.40M | $650.30M | $734.49M | $536.99M | $200.83M | $517.83M | $1.05B | $836.29M | $599.67M | $- | $- | $- | $- | $- | $- | $- | $- | $5.51M |
| Cash and Short Term Investments | $850.87M | $866.49M | $938.09M | $947.46M | $999.13M | $1.08B | $1.13B | $1.17B | $1.18B | $1.26B | $1.26B | $1.23B | $1.18B | $1.18B | $1.20B | $1.18B | $519.65M | $30.24M | $38.55M | $2.76M |
| Net Receivables | $18.87M | $22.39M | $27.83M | $40.90M | $29.33M | $17.31M | $15.23M | $22.97M | $32.86M | $19.88M | $37.02M | $37.11M | $51.01M | $37.09M | $8.18M | $13.93M | $3.59M | $3.57M | $183.00K | $- |
| Inventory | $107.91M | $116.70M | $115.38M | $108.51M | $95.18M | $77.18M | $67.78M | $61.80M | $57.55M | $61.65M | $42.24M | $39.62M | $38.69M | $34.13M | $35.50M | $35.10M | $32.27M | $31.04M | $29.71M | $- |
| Other Current Assets | $53.67M | $11.60M | $10.42M | $10.02M | $8.82M | $9.16M | $12.79M | $13.57M | $21.07M | $11.00M | $5.49M | $6.45M | $7.81M | $4.95M | $11.12M | $8.58M | $5.53M | $9.14M | $2.69M | $- |
| Total Current Assets | $1.03B | $1.02B | $1.09B | $1.11B | $1.13B | $1.19B | $1.22B | $1.27B | $1.29B | $1.36B | $1.35B | $1.32B | $1.28B | $1.26B | $1.25B | $1.24B | $561.05M | $73.67M | $70.69M | $2.76M |
| Property Plant Equipment Net | $1.26B | $1.24B | $1.23B | $1.21B | $1.17B | $1.11B | $1.05B | $1.00B | $935.74M | $830.03M | $749.85M | $668.49M | $611.37M | $583.68M | $561.50M | $533.48M | $503.00M | $57.33M | $49.30M | $- |
| Goodwill | $- | $- | $- | $- | $- | $- | $- | $- | $-24.38M | $- | $- | $- | $- | $- | $- | $- | $- | $- | $- | $- |
| Intangible Assets | $7.37M | $7.97M | $8.28M | $8.58M | $8.88M | $9.18M | $- | $- | $89.00K | $- | $- | $- | $- | $- | $- | $- | $- | $- | $- | $- |
| Goodwill and Intangible Assets | $7.37M | $7.97M | $8.28M | $8.58M | $8.88M | $9.18M | $-350.00K | $-599.00K | $-24.29M | $-5.92M | $-147.21M | $-528.00K | $-26.25M | $-9.12M | $-9.12M | $-9.12M | $- | $- | $- | $- |
| Long Term Investments | $- | $- | $9.69M | $9.98M | $10.02M | $-135.44M | $350.00K | $599.00K | $595.00K | $5.92M | $600.00K | $528.00K | $516.00K | $9.12M | $9.12M | $9.12M | $- | $- | $- | $- |
| Tax Assets | $- | $- | $107.70M | $121.88M | $56.64M | $135.44M | $135.59M | $129.71M | $23.69M | $167.03M | $146.61M | $127.98M | $25.73M | $98.44M | $95.58M | $91.64M | $- | $- | $- | $- |
| Other Non-Current Assets | $34.69M | $35.61M | $-78.89M | $-99.33M | $17.66M | $16.66M | $-125.00M | $-118.24M | $8.22M | $-164.68M | $-144.69M | $-126.26M | $-24.76M | $-97.34M | $-94.35M | $-90.82M | $10.24M | $26.19M | $27.62M | $-2.76M |
| Total Non-Current Assets | $1.30B | $1.28B | $1.27B | $1.25B | $1.26B | $1.13B | $1.07B | $1.01B | $943.96M | $832.38M | $752.37M | $670.74M | $612.86M | $593.91M | $571.84M | $543.40M | $513.24M | $83.52M | $76.92M | $-2.76M |
| Other Assets | $- | $- | $- | $- | $- | $- | $- | $- | $- | $- | $- | $- | $- | $- | $- | $- | $- | $- | $- | $- |
| Total Assets | $2.33B | $2.30B | $2.36B | $2.35B | $2.39B | $2.32B | $2.29B | $2.28B | $2.24B | $2.19B | $2.10B | $1.99B | $1.89B | $1.85B | $1.82B | $1.78B | $1.07B | $157.19M | $147.60M | $- |
| Account Payables | $23.56M | $21.71M | $19.75M | $26.14M | $28.00M | $92.10M | $71.66M | $68.57M | $15.33M | $70.24M | $62.10M | $41.65M | $35.73M | $27.84M | $37.73M | $27.50M | $16.16M | $18.85M | $13.79M | $- |
| Short Term Debt | $- | $- | $1.19M | $1.17M | $1.15M | $728.00K | $309.00K | $2.33M | $2.39M | $2.42M | $2.44M | $2.48M | $16.34M | $31.19M | $46.05M | $41.84M | $24.74M | $40.30M | $37.62M | $- |
| Tax Payables | $4.04M | $4.93M | $3.39M | $839.00K | $- | $- | $- | $21.16M | $21.16M | $- | $- | $5.25M | $3.46M | $8.10M | $- | $- | $- | $- | $- | $- |
| Deferred Revenue | $56.88M | $50.00M | $50.00M | $- | $- | $- | $- | $-2.33M | $122.35M | $167.03M | $-2.44M | $-2.48M | $104.50M | $8.10M | $-37.73M | $-27.50M | $87.47M | $- | $-13.79M | $- |
| Other Current Liabilities | $79.54M | $70.15M | $83.75M | $79.40M | $79.40M | $4.19M | $3.80M | $1.81M | $58.60M | $2.08M | $1.61M | $2.19M | $4.01M | $3.64M | $6.50M | $3.58M | $2.16M | $6.67M | $18.02M | $- |
| Total Current Liabilities | $164.02M | $146.79M | $158.08M | $107.55M | $108.55M | $97.01M | $75.77M | $93.87M | $97.48M | $74.75M | $66.15M | $51.58M | $59.54M | $70.77M | $90.29M | $72.92M | $43.06M | $65.83M | $55.64M | $- |
| Long Term Debt | $11.60M | $943.65M | $943.21M | $942.49M | $689.20M | $691.69M | $687.26M | $679.33M | $678.46M | $677.56M | $676.68M | $675.80M | $675.48M | $674.67M | $673.81M | $691.00M | $46.08M | $54.43M | $70.14M | $- |
| Deferred Revenue Non-Current | $25.50M | $19.84M | $18.76M | $18.35M | $17.43M | $22.02M | $21.97M | $- | $- | $- | $34.75M | $- | $34.21M | $43.45M | $43.10M | $42.54M | $42.17M | $- | $- | $- |
| Deferred Tax Liabilities Non-Current | $85.31M | $98.54M | $107.70M | $121.88M | $187.44M | $135.44M | $135.59M | $129.71M | $122.35M | $167.03M | $146.61M | $127.98M | $104.50M | $98.44M | $95.58M | $91.64M | $87.47M | $- | $- | $- |
| Other Non-Current Liabilities | $1.02B | $46.77M | $27.53M | $26.02M | $24.70M | $22.02M | $25.89M | $26.39M | $26.86M | $27.52M | $41.07M | $41.48M | $145.91M | $51.37M | $51.65M | $51.81M | $43.80M | $47.04M | $46.56M | $- |
| Total Non-Current Liabilities | $1.11B | $1.09B | $1.10B | $1.11B | $918.77M | $849.14M | $848.74M | $835.42M | $827.67M | $872.11M | $864.36M | $845.27M | $821.39M | $824.49M | $821.04M | $834.45M | $177.35M | $101.47M | $116.71M | $- |
| Other Liabilities | $- | $- | $- | $- | $- | $- | $- | $- | $- | $- | $- | $- | $- | $- | $- | $- | $- | $- | $- | $- |
| Total Liabilities | $1.28B | $1.24B | $1.26B | $1.22B | $1.03B | $946.15M | $924.51M | $929.30M | $925.15M | $946.86M | $930.50M | $896.84M | $880.93M | $895.26M | $911.33M | $907.37M | $220.41M | $167.30M | $172.35M | $- |
| Preferred Stock | $- | $- | $- | $- | $- | $- | $- | $- | $- | $- | $1 | $- | $- | $- | $- | $- | $0 | $56.12M | $2.27M | $- |
| Common Stock | $18.00K | $18.00K | $18.00K | $18.00K | $17.00K | $17.00K | $17.00K | $17.00K | $18.00K | $18.00K | $18.00K | $18.00K | $18.00K | $18.00K | $18.00K | $17.00K | $17.00K | $20.50M | $20.50M | $- |
| Retained Earnings | $320.30M | $342.64M | $368.16M | $402.21M | $385.73M | $401.99M | $406.26M | $398.87M | $361.42M | $294.41M | $231.24M | $157.97M | $72.42M | $23.43M | $-19.34M | $-46.50M | $-62.62M | $-86.74M | $-101.36M | $- |
| Accumulated Other Comprehensive Income Loss | $173.00K | $296.00K | $-90.00K | $-130.00K | $145.00K | $-32.00K | $-166.00K | $131.00K | $189.00K | $-97.00K | $-416.00K | $-0 | $-0 | $0 | $0 | $-21.04M | $-0 | $43.12M | $- | $-18.02M |
| Other Total Stockholders Equity | $734.39M | $721.58M | $740.95M | $735.65M | $979.89M | $974.10M | $958.82M | $952.79M | $951.01M | $947.97M | $939.90M | $932.38M | $936.30M | $930.75M | $925.94M | $921.64M | $916.48M | $-43.12M | $53.85M | $- |
| Total Stockholders Equity | $1.05B | $1.06B | $1.11B | $1.14B | $1.37B | $1.38B | $1.36B | $1.35B | $1.31B | $1.24B | $1.17B | $1.09B | $1.01B | $954.20M | $906.62M | $875.16M | $853.88M | $-10.12M | $-24.74M | $-18.02M |
| Total Equity | $1.05B | $1.06B | $1.11B | $1.14B | $1.37B | $1.38B | $1.36B | $1.35B | $1.31B | $1.24B | $1.17B | $1.09B | $1.01B | $954.20M | $906.62M | $875.16M | $853.88M | $-10.12M | $-24.74M | $-18.02M |
| Total Liabilities and Stockholders Equity | $2.33B | $2.30B | $2.36B | $2.35B | $2.39B | $2.32B | $2.29B | $2.28B | $2.24B | $2.19B | $2.10B | $1.99B | $1.89B | $1.85B | $1.82B | $1.78B | $1.07B | $157.19M | $147.60M | $-18.02M |
| Minority Interest | $- | $- | $- | $- | $- | $- | $- | $- | $- | $- | $- | $- | $- | $- | $- | $- | $- | $- | $- | $- |
| Total Liabilities and Total Equity | $2.33B | $2.30B | $2.36B | $2.35B | $2.39B | $2.32B | $2.29B | $2.28B | $2.24B | $2.19B | $2.10B | $1.99B | $1.89B | $1.85B | $1.82B | $1.78B | $1.07B | $157.19M | $147.60M | $-18.02M |
| Total Investments | $568.43M | $582.06M | $651.09M | $660.28M | $744.51M | $536.99M | $200.83M | $517.83M | $1.05B | $836.29M | $599.67M | $528.00K | $516.00K | $9.12M | $9.12M | $9.12M | $- | $- | $- | $5.51M |
| Total Debt | $5.80M | $943.65M | $944.40M | $943.66M | $690.35M | $688.84M | $687.57M | $679.33M | $678.44M | $677.56M | $676.68M | $675.80M | $691.82M | $705.87M | $719.87M | $732.84M | $70.82M | $94.73M | $107.77M | $- |
| Net Debt | $-276.64M | $659.22M | $647.71M | $646.50M | $425.71M | $141.17M | $-239.68M | $28.11M | $541.82M | $249.59M | $12.23M | $-557.50M | $-487.48M | $-473.50M | $-477.01M | $-448.67M | $-448.84M | $64.49M | $69.22M | $2.76M |
Annual Cash Flow
| Breakdown | December 31, 2024 | December 31, 2023 | December 31, 2022 | December 31, 2021 | December 31, 2020 |
|---|---|---|---|---|---|
| Net Income | $-65.42M | $24.31M | $289.00M | $135.04M | $-21.82M |
| Depreciation and Amortization | $78.06M | $56.62M | $18.36M | $24.38M | $6.93M |
| Deferred Income Tax | $-27.77M | $8.46M | $17.79M | $17.43M | $-17.79M |
| Stock Based Compensation | $23.18M | $25.24M | $31.78M | $22.93M | $5.01M |
| Change in Working Capital | $- | $-32.23M | $4.21M | $-34.29M | $-37.65M |
| Accounts Receivables | $-8.85M | $3.52M | $18.15M | $-47.42M | $-3.22M |
| Inventory | $21.53M | $2.29M | $-24.31M | $-8.23M | $-9.22M |
| Accounts Payables | $1.33M | $11.30M | $1.96M | $5.53M | $-3.85M |
| Other Working Capital | $- | $-49.34M | $8.41M | $15.83M | $-21.36M |
| Other Non Cash Items | $5.31M | $-19.69M | $-17.62M | $-63.52M | $68.60M |
| Net Cash Provided by Operating Activities | $13.35M | $62.70M | $343.51M | $101.97M | $3.28M |
| Investments in Property Plant and Equipment | $-186.42M | $-261.90M | $-326.60M | $-123.87M | $-22.37M |
| Acquisitions Net | $- | $-9.67M | $- | $125.00K | $- |
| Purchases of Investments | $-1.57B | $-1.20B | $-2.78B | $- | $- |
| Sales Maturities of Investments | $1.76B | $1.52B | $1.74B | $- | $- |
| Other Investing Activities | $96.00K | $12.49M | $5.13M | $4.38M | $- |
| Net Cash Used for Investing Activities | $10.06M | $68.70M | $-1.36B | $-119.36M | $-22.37M |
| Debt Repayment | $316.37M | $-2.73M | $-5.83M | $687.57M | $18.63M |
| Common Stock Issued | $- | $- | $- | $- | $544.71M |
| Common Stock Repurchased | $-225.07M | $-7.18M | $-18.36M | $-3.33M | $- |
| Dividends Paid | $- | $- | $- | $- | $- |
| Other Financing Activities | $-96.09M | $-7.18M | $-18.36M | $-21.46M | $-41.38M |
| Net Cash Used Provided by Financing Activities | $-4.79M | $-9.92M | $-24.19M | $666.11M | $521.96M |
| Effect of Forex Changes on Cash | $- | $- | $- | $- | $- |
| Net Change in Cash | $18.61M | $121.48M | $-1.04B | $648.72M | $502.87M |
| Cash at End of Period | $283.60M | $264.99M | $143.51M | $1.18B | $532.44M |
| Cash at Beginning of Period | $264.99M | $143.51M | $1.18B | $532.44M | $29.57M |
| Operating Cash Flow | $13.35M | $62.70M | $343.51M | $101.97M | $3.28M |
| Capital Expenditure | $-186.42M | $-261.90M | $-326.60M | $-123.87M | $-22.37M |
| Free Cash Flow | $-173.07M | $-199.20M | $16.92M | $-21.90M | $-19.09M |
Cash Flow Charts
| Breakdown | December 31, 2024 | September 30, 2024 | June 30, 2024 | March 31, 2024 | December 31, 2023 | September 30, 2023 | June 30, 2023 | March 31, 2023 | December 31, 2022 | September 30, 2022 | June 30, 2022 | March 31, 2022 | December 31, 2021 | September 30, 2021 | June 30, 2021 | March 31, 2021 | December 31, 2020 | September 30, 2020 | June 30, 2020 | March 31, 2020 |
|---|---|---|---|---|---|---|---|---|---|---|---|---|---|---|---|---|---|---|---|---|
| Net Income | $-22.34M | $-25.52M | $-34.05M | $16.49M | $-16.26M | $-4.28M | $7.39M | $37.45M | $67.01M | $63.18M | $73.27M | $85.55M | $48.99M | $42.76M | $27.17M | $16.12M | $24.11M | $14.63M | $-62.49M | $1.93M |
| Depreciation and Amortization | $- | $18.88M | $18.44M | $18.62M | $18.86M | $13.66M | $7.22M | $8.12M | $7.69M | $2.10M | $5.83M | $5.26M | $4.62M | $6.95M | $6.67M | $6.15M | $5.55M | $2.18M | $1.38M | $1.27M |
| Deferred Income Tax | $-11.54M | $-9.29M | $-14.10M | $7.14M | $-4.70M | $-200.00K | $5.98M | $7.38M | $-24.32M | $20.45M | $18.63M | $23.48M | $17.43M | $182.00K | $-1.42M | $4.16M | $-17.79M | $- | $- | $- |
| Stock Based Compensation | $4.56M | $5.45M | $5.70M | $7.47M | $6.20M | $6.30M | $5.73M | $7.01M | $6.76M | $7.81M | $7.44M | $9.77M | $8.21M | $4.55M | $4.50M | $5.67M | $5.01M | $- | $- | $- |
| Change in Working Capital | $40.55M | $-6.48M | $49.51M | $-43.03M | $-12.46M | $-5.57M | $-17.47M | $3.27M | $-63.25M | $23.09M | $-6.14M | $31.88M | $-17.28M | $-18.69M | $10.54M | $-8.86M | $-23.01M | $-6.99M | $-7.38M | $-265.00K |
| Accounts Receivables | $-39.12M | $-1.25M | $9.92M | $-13.19M | $-14.22M | $-2.07M | $10.14M | $11.61M | $-16.84M | $16.73M | $4.36M | $13.90M | $-13.91M | $-28.92M | $5.75M | $-10.34M | $-15.00K | $-3.39M | $228.00K | $-41.00K |
| Inventory | $1.31M | $-1.31M | $-20.60M | $-20.94M | $-21.60M | $-14.09M | $-6.38M | $-5.02M | $-1.93M | $-18.83M | $-2.62M | $-927.00K | $-4.57M | $1.38M | $-2.21M | $-2.83M | $-1.23M | $-1.33M | $-2.80M | $-3.86M |
| Accounts Payables | $2.63M | $5.56M | $771.00K | $-7.63M | $2.70M | $8.35M | $3.84M | $-3.59M | $3.23M | $4.21M | $1.70M | $-7.18M | $1.23M | $5.69M | $3.06M | $3.06M | $-974.00K | $-2.27M | $228.00K | $-908.00K |
| Other Working Capital | $75.72M | $-9.48M | $59.42M | $-1.27M | $20.66M | $2.25M | $-25.06M | $-3.00M | $-47.72M | $20.99M | $18.63M | $26.09M | $-22.00K | $3.16M | $3.94M | $1.25M | $-20.79M | $-1.00K | $-5.04M | $4.54M |
| Other Non Cash Items | $19.25M | $10.10M | $57.83M | $38.65M | $-5.41M | $1.11M | $1.11M | $-7.74M | $35.21M | $-22.07M | $1.30M | $-34.98M | $-30.45M | $-13.26M | $-8.81M | $-13.91M | $9.72M | $-12.37M | $67.00M | $803.00K |
| Net Cash Provided by Operating Activities | $30.48M | $-6.84M | $30.84M | $-41.13M | $-13.78M | $11.02M | $9.97M | $55.49M | $29.09M | $94.56M | $98.89M | $120.97M | $31.51M | $22.50M | $38.63M | $9.34M | $3.60M | $-2.56M | $-1.49M | $3.73M |
| Investments in Property Plant and Equipment | $-41.65M | $-46.44M | $-46.49M | $-51.84M | $-72.97M | $-58.69M | $-55.77M | $-74.46M | $-112.26M | $-91.75M | $-67.65M | $-54.93M | $-37.45M | $-41.73M | $-25.39M | $-19.30M | $-12.68M | $-4.87M | $-4.21M | $-618.00K |
| Acquisitions Net | $- | $- | $- | $- | $18.00K | $- | $- | $-536.65M | $852.46M | $-525.87M | $- | $5.13M | $-2.62M | $2.62M | $- | $125.00K | $- | $- | $- | $- |
| Purchases of Investments | $-417.37M | $-316.90M | $-443.10M | $-390.61M | $-489.91M | $-384.36M | $- | $-320.88M | $-1.42B | $-759.20M | $-599.20M | $- | $- | $- | $- | $- | $- | $- | $- | $- |
| Sales Maturities of Investments | $437.38M | $384.07M | $459.84M | $483.06M | $291.98M | $51.72M | $321.70M | $857.53M | $1.22B | $525.87M | $- | $- | $- | $- | $- | $- | $- | $- | $- | $- |
| Other Investing Activities | $- | $- | $16.74M | $96.00K | $1.75M | $1.05M | $321.70M | $536.65M | $-852.46M | $525.87M | $-599.20M | $5.13M | $1.77M | $2.62M | $- | $125.00K | $-22.37M | $- | $- | $- |
| Net Cash Used for Investing Activities | $-21.64M | $20.73M | $-29.74M | $40.71M | $-269.13M | $-390.28M | $265.93M | $462.19M | $-315.24M | $-325.08M | $-666.85M | $-49.80M | $-35.68M | $-39.11M | $-25.39M | $-19.17M | $-12.68M | $-4.87M | $-4.21M | $-618.00K |
| Debt Repayment | $-794.00K | $-541.00K | $-1.38M | $318.09M | $-631.00K | $-634.00K | $-621.00K | $-846.00K | $-695.00K | $-651.00K | $-671.00K | $-3.82M | $-728.00K | $-717.00K | $-714.00K | $689.72M | $-19.13M | $-963.00K | $-190.78K | $-210.00K |
| Common Stock Issued | $- | $- | $- | $- | $- | $- | $- | $- | $- | $- | $- | $- | $- | $- | $- | $- | $- | $- | $- | $- |
| Common Stock Repurchased | $- | $-24.30M | $-175.00K | $-200.76M | $-709.00K | $-344.00K | $-156.00K | $-5.98M | $-4.06M | $- | $-202.00K | $-14.09M | $-2.77M | $-36.00K | $-193.00K | $-334.00K | $-996.00K | $- | $- | $- |
| Dividends Paid | $- | $- | $- | $- | $- | $- | $- | $- | $- | $- | $- | $- | $- | $- | $- | $- | $- | $- | $- | $- |
| Other Financing Activities | $-10.03M | $-484.00K | $-175.00K | $-84.41M | $-709.00K | $-344.00K | $-156.00K | $-5.98M | $-4.06M | $- | $-202.00K | $-14.09M | $-2.77M | $-163.00K | $-589.00K | $-17.93M | $504.91M | $-1.58M | $39.13M | $- |
| Net Cash Used Provided by Financing Activities | $-10.83M | $-25.33M | $-1.55M | $32.92M | $-1.34M | $-978.00K | $-777.00K | $-6.82M | $-4.76M | $-651.00K | $-873.00K | $-17.91M | $-3.50M | $-880.00K | $-1.30M | $671.79M | $485.77M | $-2.54M | $38.94M | $-210.00K |
| Effect of Forex Changes on Cash | $- | $- | $- | $- | $306.66M | $380.24M | $- | $- | $- | $- | $- | $- | $- | $- | $- | $- | $- | $- | $- | $- |
| Net Change in Cash | $-1.99M | $-11.10M | $-469.00K | $32.52M | $-284.25M | $-380.24M | $275.12M | $510.86M | $-290.90M | $-231.17M | $-568.83M | $53.26M | $-7.68M | $-17.50M | $11.94M | $661.96M | $476.69M | $-9.97M | $33.24M | $2.91M |
| Cash at End of Period | $283.60M | $285.59M | $296.69M | $297.16M | $264.64M | $549.24M | $929.48M | $654.37M | $143.51M | $434.41M | $665.59M | $1.23B | $1.18B | $1.19B | $1.21B | $1.19B | $532.44M | $55.74M | $65.71M | $32.48M |
| Cash at Beginning of Period | $285.59M | $296.69M | $297.16M | $264.64M | $548.90M | $929.48M | $654.37M | $143.51M | $434.41M | $665.59M | $1.23B | $1.18B | $1.19B | $1.21B | $1.19B | $532.44M | $55.74M | $65.71M | $32.48M | $29.57M |
| Operating Cash Flow | $30.48M | $-6.84M | $30.84M | $-41.13M | $-13.78M | $11.02M | $9.97M | $55.49M | $29.09M | $94.56M | $98.89M | $120.97M | $31.51M | $22.50M | $38.63M | $9.34M | $3.60M | $-2.56M | $-1.49M | $3.73M |
| Capital Expenditure | $-41.65M | $-46.44M | $-46.49M | $-51.84M | $-72.97M | $-58.69M | $-55.77M | $-74.46M | $-112.26M | $-91.75M | $-67.65M | $-54.93M | $-37.45M | $-41.73M | $-25.39M | $-19.30M | $-12.68M | $-4.87M | $-4.21M | $-618.00K |
| Free Cash Flow | $-11.17M | $-53.29M | $-15.65M | $-92.96M | $-86.75M | $-47.67M | $-45.81M | $-18.97M | $-83.17M | $2.81M | $31.24M | $66.04M | $-5.94M | $-19.23M | $13.24M | $-9.96M | $-9.08M | $-7.43M | $-5.70M | $3.12M |

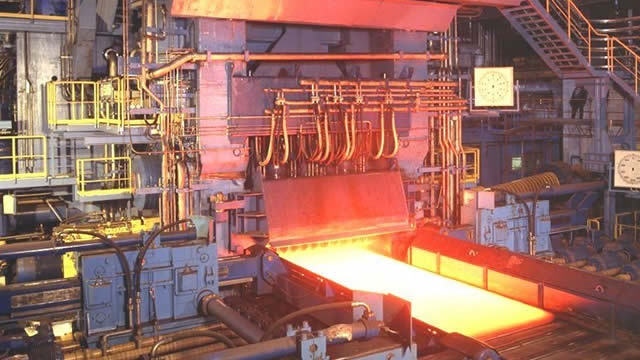
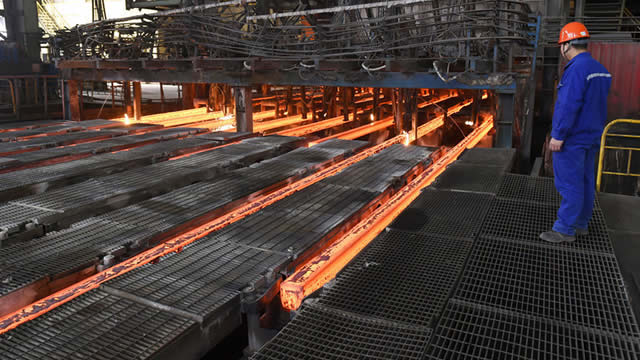
MP Materials Corp. owns and operates rare earth mining and processing facilities. It owns and operates the Mountain Pass Rare Earth mine located in the Western Hemisphere. The company holds the mineral rights to the Mountain Pass mine and surrounding areas, as well as intellectual property rights related to the processing and development of rare earth minerals. It offers cerium, lanthanum, neodymium, praseodymium, and samarium. The company was founded in 2017 and is headquartered in Las Vegas, Nevada.
$24.58
Stock Price
$4.02B
Market Cap
804
Employees
Las Vegas, NV
Location
Revenue (FY 2024)
$203.85M
-19.6% YoY
Net Income (FY 2024)
$-65.42M
-369.2% YoY
EPS (FY 2024)
$-0.20
-242.9% YoY
Free Cash Flow (FY 2024)
$-173.07M
13.1% YoY
Profitability
Gross Margin
-32.8%
Net Margin
-32.1%
ROE
-6.2%
ROA
-2.8%
Valuation
P/E Ratio
-39.78
P/S Ratio
12.77
EV/EBITDA
301.30
Market Cap
$4.02B
Revenue & Net Income
Profit Margins
Cash Flow Summary
Operating Cash Flow
$13.35M
-78.7% YoY
Free Cash Flow
$-173.07M
13.1% YoY
Balance Sheet Summary
Total Assets
$2.33B
-0.1% YoY
Total Debt
$5.80M
99.2% YoY
Shareholder Equity
$1.05B
-18.0% YoY
Dividend Overview
No Dividend Data
MP Materials Corp. doesn't currently pay dividends.
MP Materials Dividends
Explore MP Materials's dividend history, including dividend yield, payout ratio, and historical payments.
MP Materials News
Read the latest news about MP Materials, including recent articles, headlines, and updates.
MP Materials: An Unusual Momentum Play
Average trading volume for the past 10 days vs the past 3 months is up by over 140%. MP Materials is America's best chance to regain control over the rare earth elements supply chain, especially after the trade tensions between China and the US have recently escalated. The chart looks compelling, showing a clear turnaround since August 2024. The RSI is in the 50s (very attractive as well).

Why MP Materials Stock Crashed on Monday
Reversing course after a terrific week preholiday, shares of rare-earth minerals miner MP Materials (MP -14.34%) gave back most of last week's gains on Monday, sinking 12.2% through 11:40 a.m. ET and returning its share price to where it sat roughly 10 days ago.


Why MP Materials Stock Was a Massive Winner This Week
Rare earth miner and processor MP Materials (MP -4.88%) had quite the week to remember, both operationally and on the stock market. On the back of some quite favorable news, the company's shares raced more than 16% higher over the course of the week, according to data compiled by S&P Global Market Intelligence.

MP Materials Accelerates Strategy to Reindustrialize the Rare Earth Supply Chain
LAS VEGAS--(BUSINESS WIRE)---- $MP #rareearth--In response to China's retaliatory tariffs and export controls, MP Materials (NYSE: MP) has ceased shipments of rare earth concentrate to China. Selling our valuable critical materials under 125% tariffs is neither commercially rational nor aligned with America's national interest. We have been preparing for this moment since day one. Our mission, capital strategy, and execution reflect a long-term vision built to withstand short-term dislocation and emerge stronger.


Make America Mine Again - MP Materials Is Just Getting Started
MP Materials is poised for long-term growth due to its unique position in the rare earth supply chain and geopolitical advantages. The company's vertically integrated model and strong ties to the U.S. government make it a critical player in economic security and national defense. Despite cyclical headwinds, MP Materials' strong balance sheet and strategic partnerships position it well for future demand and potential growth.


Why MP Materials Stock Is Skyrocketing Today
The trade war between the United States and China is heating up and is leading investors to gobble up rare earth mineral stock MP Materials (MP 18.50%), which operates the only rare earth mine and processing facility in the United States. As of 11:25 a.m.

MP Materials Announces Date for First Quarter 2025 Financial Results and Webcast
LAS VEGAS--(BUSINESS WIRE)---- $MP #rareearth--MP Materials Corp. (NYSE: MP) will release its financial results for the first quarter ended March 31, 2025, after the U.S. markets close on Thursday, May 8, 2025. MP Materials' management will host a conference call and webcast that afternoon at 2:00 p.m. Pacific Time (5:00 p.m. Eastern Time). Prior to the conference call and webcast, MP Materials will issue a press release and post a slide presentation at https://investors.mpmaterials.com/. Conference Call Details.


MP Materials: A Rare Opportunity In The Rare Earths Supply Chain
MP Materials Corp. is strategically positioned to benefit from rising rare earth metals demand, driven by industries like EVs, wind turbines, and defense technology. MP Materials aims to control the entire rare earth value chain, from mining to magnet production, reducing U.S. reliance on China. The company reported a net loss in Q4 2024 due to high production costs but expects significant growth and profitability by 2026.


MP Materials CEO: There's concern China may gain AI advantage as Ukraine-U.S. mineral deal stalls
James Litinsky, MP Materials chairman and CEO, joins CNBC's 'Squawk on the Street' to break down the details behind the U.S.-Ukraine mineral deal, the critical role of rare earths in AI and defense, and more.

MP Materials: Ready For A Bright Future
MP is completing its full integration this FY25, from the mining to the magnet production. Financial engineering has been exemplary: cash preservation helped by prepayments from future customers, stock buybacks done at low prices, and debt refinancing completed. Margins should increase significantly over the next two years as NdPr metal production reaches its full target, while magnets should enjoy premium prices.

MP Materials Corp. (MP) Canaccord Genuity Sustainability Virtual Summit (Transcript)
MP Materials Corp. (NYSE:MP ) Canaccord Genuity Sustainability Virtual Summit February 26, 2025 2:20 PM ET Company Participants Ryan Corbett - Chief Financial Officer Conference Call Participants George Gianarikas - Canaccord Genuity George Gianarikas Hey, everyone, this is George Gianarikas, one of Canaccord Genuity's Sustainability Analyst. Welcome again to our 2025 Sustainability Summit.


MP Materials Corp. (MP) Q4 2024 Earnings Call Transcript
MP Materials Corp. (NYSE:MP ) Q4 2024 Earnings Conference Call February 20, 2025 5:00 PM ET Company Participants Martin Sheehan - Head, Investor Relations Jim Litinsky - Founder, Chairman & Chief Executive Officer Ryan Corbett - Chief Financial Officer Michael Rosenthal - Founder & Chief Operating Officer Conference Call Participants Matt Summerville - DA Davidson Corinne Blanchard - Deutsche Bank Greg Jones - BMO Carlos De Alba - Morgan Stanley Bill Peterson - JPMorgan Ben Kallo - Baird Laurence Alexander - Jefferies Leanne Hayden - Canaccord Operator Hello, and welcome to the MP Materials Fourth Quarter 2024 Earnings Call. We ask that you please hold all questions until the completion of the formal remarks, at which time, you'll be given instructions for the question-and-answer session.


MP Materials Reports Fourth Quarter and Full Year 2024 Results
LAS VEGAS--(BUSINESS WIRE)---- $MP #rareearth--MP Materials Corp. (NYSE: MP) (“MP Materials” or the “Company”), today announced its financial results for the fourth quarter and full year ended December 31, 2024. Fourth Quarter 2024 Highlights Commenced commercial production of NdPr metal at Independence Began trial production of automotive-grade magnets Produced 11,478 metric tons of rare earth oxides (“REO”) in concentrate, a record for a quarter with a planned maintenance shutdown and sold 7,803 metric tons Pro.


MP Materials Announces Date for Fourth Quarter 2024 Financial Results and Webcast
LAS VEGAS--(BUSINESS WIRE)---- $MP #rareearth--MP Materials Corp. (NYSE: MP) will release its financial results for the fourth quarter ended December 31, 2024, after the U.S. markets close on Thursday, February 20, 2025. MP Materials' management will host a conference call and webcast that afternoon at 2:00 p.m. Pacific Time (5:00 p.m. Eastern Time). Prior to the conference call and webcast, MP Materials will issue a press release and post a slide presentation at https://investors.mpmaterials.com/. Conference Cal.

As China Tightens Rare Earth Exports, These 3 Stocks Are in Focus
The China rare earth minerals ban on Dec 3, 2024, was a retaliatory move aimed at diluting the United States' efforts to accelerate certain technologies in the computer & technology sector and the aerospace sector. Namely, Chinese exports of antimony, germanium, and gallium to the United States were immediately cut off.

MP Materials: Rare Earth Elements Powering the EV Boom
Investors and consumers are captivated by the potential of battery technology as the electric vehicle (EV) revolution advances. Lithium has become a popular term, but rare earth elements (REEs), like those mined by MP Materials Corp NYSE: MP, are essential for high-performance EV motors.

MP Materials Restores U.S. Rare Earth Magnet Production
FORT WORTH, Texas--(BUSINESS WIRE)---- $MP #rareearth--MP Materials (NYSE: MP) has reached a pivotal milestone in restoring the U.S. rare earth magnet supply chain. The company's flagship Independence facility in Fort Worth, Texas, has commenced commercial production of neodymium-praseodymium (NdPr) metal and trial production of automotive-grade, sintered neodymium-iron-boron (NdFeB) magnets. These achievements bring the U.S. closer to reestablishing a fully integrated, domestic supply chain for these critical co.

Similar Companies
Related Metrics
Explore detailed financial metrics and analysis for MP.