Middlesex Water Key Executives
This section highlights Middlesex Water's key executives, including their titles and compensation details.
Find Contacts at Middlesex Water
(Showing 0 of )
Middlesex Water Earnings
This section highlights Middlesex Water's earnings, including key dates, EPS, earnings reports, and earnings call transcripts.
Next Earnings Date
Last Earnings Results
Earnings Call Transcripts
| Transcript | Quarter | Year | Date | Estimated EPS | Actual EPS |
|---|

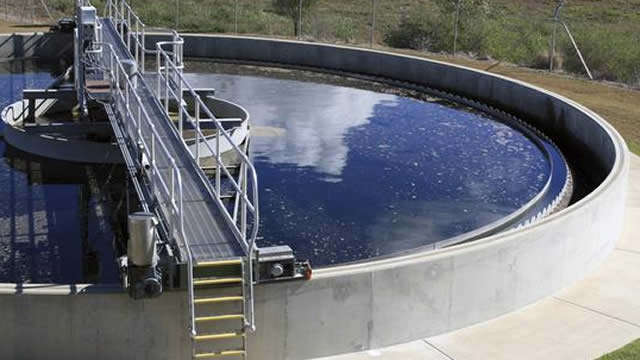
Middlesex Water Company owns and operates regulated water utility and wastewater systems. It operates in two segments, Regulated and Non-Regulated. The Regulated segment collects, treats, and distributes water on a retail and wholesale basis to residential, commercial, industrial, and fire protection customers, as well as provides regulated wastewater systems in New Jersey and Delaware. The Non-Regulated segment provides non-regulated contract services for the operation and maintenance of municipal and private water and wastewater systems in New Jersey and Delaware. The company was incorporated in 1896 and is headquartered in Iselin, New Jersey.
$63.48
Stock Price
$1.14B
Market Cap
360
Employees
Iselin, NJ
Location
Financial Statements
Access annual & quarterly financial statements for Middlesex Water, including income statements, balance sheets, and cash flow statements..
Annual Income Statement
| Breakdown | December 31, 2024 | December 31, 2023 | December 31, 2022 | December 31, 2021 | December 31, 2020 |
|---|---|---|---|---|---|
| Revenue | $191.88M | $166.27M | $162.43M | $143.14M | $141.59M |
| Cost of Revenue | $- | $83.11M | $79.10M | $73.67M | $70.80M |
| Gross Profit | $191.88M | $83.16M | $83.34M | $69.47M | $70.80M |
| Gross Profit Ratio | 100.00% | 50.00% | 51.31% | 48.50% | 50.00% |
| Research and Development Expenses | $- | $- | $- | $- | $- |
| General and Administrative Expenses | $- | $- | $- | $- | $- |
| Selling and Marketing Expenses | $- | $- | $- | $- | $- |
| Selling General and Administrative Expenses | $- | $2.60M | $4.55M | $2.03M | $279.00K |
| Other Expenses | $138.67M | $41.34M | $38.92M | $36.26M | $29.36M |
| Operating Expenses | $138.67M | $43.94M | $38.92M | $36.26M | $29.36M |
| Cost and Expenses | $138.67M | $127.05M | $118.02M | $109.93M | $100.16M |
| Interest Income | $- | $- | $9.37M | $8.11M | $7.49M |
| Interest Expense | $12.77M | $10.71M | $9.37M | $8.11M | $7.49M |
| Depreciation and Amortization | $28.04M | $29.44M | $27.48M | $26.80M | $20.84M |
| EBITDA | $92.06M | $72.72M | $74.12M | $62.04M | $58.54M |
| EBITDA Ratio | 47.98% | 43.73% | 44.84% | 40.26% | 44.24% |
| Operating Income | $53.21M | $39.22M | $47.33M | $33.21M | $37.42M |
| Operating Income Ratio | 27.73% | 23.59% | 29.14% | 23.20% | 26.43% |
| Total Other Income Expenses Net | $-1.95M | $-6.66M | $-1.66M | $-2.16M | $-3.11M |
| Income Before Tax | $51.26M | $32.56M | $45.67M | $31.05M | $34.31M |
| Income Before Tax Ratio | 26.71% | 19.59% | 28.12% | 21.70% | 24.23% |
| Income Tax Expense | $6.91M | $1.04M | $3.24M | $-5.49M | $-4.12M |
| Net Income | $44.35M | $31.52M | $42.43M | $36.54M | $38.42M |
| Net Income Ratio | 23.11% | 18.96% | 26.12% | 25.53% | 27.14% |
| EPS | $2.49 | $1.77 | $2.40 | $2.08 | $2.19 |
| EPS Diluted | $2.48 | $1.76 | $2.39 | $2.07 | $2.18 |
| Weighted Average Shares Outstanding | 17.83M | 17.73M | 17.60M | 17.49M | 17.46M |
| Weighted Average Shares Outstanding Diluted | 17.95M | 17.85M | 17.71M | 17.61M | 17.57M |
| SEC Filing | Source | Source | Source | Source | Source |
| Breakdown | December 31, 2024 | September 30, 2024 | June 30, 2024 | March 31, 2024 | December 31, 2023 | September 30, 2023 | June 30, 2023 | March 31, 2023 | December 31, 2022 | September 30, 2022 | June 30, 2022 | March 31, 2022 | December 31, 2021 | September 30, 2021 | June 30, 2021 | March 31, 2021 | December 31, 2020 | September 30, 2020 | June 30, 2020 | March 31, 2020 |
|---|---|---|---|---|---|---|---|---|---|---|---|---|---|---|---|---|---|---|---|---|
| Revenue | $47.11M | $55.10M | $49.15M | $40.52M | $38.60M | $46.72M | $42.80M | $38.16M | $38.82M | $47.73M | $39.68M | $36.20M | $34.02M | $39.87M | $36.70M | $32.54M | $34.63M | $39.92M | $35.28M | $31.77M |
| Cost of Revenue | $24.71M | $25.36M | $28.13M | $25.86M | $25.72M | $22.58M | $21.20M | $20.26M | $20.09M | $20.31M | $19.56M | $19.14M | $18.41M | $18.95M | $17.96M | $18.36M | $18.04M | $17.95M | $17.62M | $17.19M |
| Gross Profit | $22.39M | $29.74M | $21.02M | $14.66M | $12.88M | $24.13M | $21.60M | $17.90M | $18.73M | $27.42M | $20.13M | $17.06M | $15.62M | $20.92M | $18.74M | $14.19M | $16.59M | $21.97M | $17.66M | $14.58M |
| Gross Profit Ratio | 47.54% | 54.00% | 42.80% | 36.20% | 33.40% | 51.70% | 50.50% | 46.90% | 48.30% | 57.40% | 50.70% | 47.10% | 45.90% | 52.50% | 51.10% | 43.60% | 47.92% | 55.04% | 50.05% | 45.88% |
| Research and Development Expenses | $- | $- | $- | $- | $- | $- | $- | $- | $- | $- | $- | $- | $- | $- | $- | $- | $- | $- | $- | $- |
| General and Administrative Expenses | $- | $- | $- | $- | $- | $- | $- | $- | $- | $- | $- | $- | $- | $- | $- | $- | $- | $- | $- | $- |
| Selling and Marketing Expenses | $- | $- | $- | $- | $- | $- | $- | $- | $- | $- | $- | $- | $- | $- | $- | $- | $- | $- | $- | $- |
| Selling General and Administrative Expenses | $- | $- | $1.26M | $1.26M | $1.30M | $652.00K | $652.00K | $652.00K | $1.14M | $1.14M | $1.14M | $1.14M | $508.00K | $507.00K | $507.00K | $507.00K | $46.00K | $77.00K | $77.00K | $77.00K |
| Other Expenses | $11.86M | $12.24M | $-5.70M | $-4.80M | $-4.64M | $936.00K | $1.29M | $10.41M | $9.83M | $10.22M | $9.49M | $9.39M | $994.00K | $744.00K | $790.00K | $775.00K | $-801.00K | $444.00K | $334.00K | $385.00K |
| Operating Expenses | $11.86M | $12.24M | $5.70M | $4.80M | $4.64M | $11.31M | $10.93M | $10.41M | $9.83M | $10.22M | $9.49M | $9.39M | $9.28M | $9.16M | $8.16M | $7.29M | $7.12M | $7.84M | $8.27M | $6.93M |
| Cost and Expenses | $36.58M | $37.60M | $33.83M | $30.66M | $30.36M | $33.89M | $32.13M | $30.67M | $29.92M | $30.53M | $29.05M | $28.53M | $27.69M | $28.11M | $26.12M | $25.64M | $25.15M | $25.79M | $25.89M | $24.12M |
| Interest Income | $- | $354.00K | $- | $- | $- | $- | $3.25M | $2.60M | $2.79M | $2.35M | $548.00K | $377.00K | $- | $344.00K | $- | $1.26M | $1.15M | $953.00K | $- | $1.12M |
| Interest Expense | $2.83M | $3.41M | $4.04M | $3.27M | $3.89M | $3.02M | $2.40M | $2.60M | $2.79M | $2.35M | $2.37M | $1.85M | $1.93M | $2.10M | $2.07M | $1.74M | $1.97M | $1.91M | $1.15M | $1.67M |
| Depreciation and Amortization | $7.81M | $7.22M | $7.03M | $5.98M | $7.34M | $7.56M | $7.34M | $7.20M | $7.34M | $6.73M | $6.58M | $6.83M | $9.55M | $4.35M | $8.07M | $6.30M | $5.24M | $5.29M | $4.63M | $5.11M |
| EBITDA | $19.95M | $26.69M | $25.00M | $17.11M | $16.23M | $21.04M | $18.66M | $16.40M | $17.45M | $24.45M | $17.80M | $15.25M | $16.39M | $16.28M | $19.44M | $12.44M | $13.62M | $18.55M | $14.66M | $11.71M |
| EBITDA Ratio | 42.35% | 48.44% | 45.46% | 39.10% | 40.36% | 45.64% | 42.39% | 37.67% | 41.30% | 53.10% | 46.89% | 43.85% | 37.97% | 45.18% | 48.98% | 42.92% | 40.20% | 49.76% | 40.67% | 41.37% |
| Operating Income | $10.53M | $17.50M | $15.31M | $9.87M | $8.24M | $12.82M | $10.67M | $7.49M | $8.15M | $16.57M | $10.09M | $9.05M | $6.34M | $11.42M | $9.81M | $5.63M | $8.33M | $13.18M | $9.38M | $6.53M |
| Operating Income Ratio | 22.35% | 31.76% | 31.16% | 24.34% | 21.35% | 27.45% | 24.93% | 19.63% | 20.98% | 34.73% | 25.42% | 24.99% | 18.63% | 28.65% | 26.74% | 17.31% | 24.06% | 33.01% | 26.60% | 20.55% |
| Total Other Income Expenses Net | $-1.22M | $-1.44M | $-1.39M | $2.10M | $-2.58M | $-2.09M | $-1.11M | $-884.00K | $-828.00K | $-316.00K | $-425.00K | $-94.00K | $-931.00K | $-1.01M | $-512.00K | $300.00K | $-1.63M | $-509.00K | $-817.00K | $-161.00K |
| Income Before Tax | $9.31M | $16.06M | $13.93M | $11.96M | $5.67M | $10.74M | $9.56M | $6.61M | $7.32M | $16.26M | $9.66M | $12.43M | $5.41M | $10.41M | $9.30M | $5.93M | $6.70M | $12.67M | $8.57M | $6.37M |
| Income Before Tax Ratio | 19.76% | 29.14% | 28.34% | 29.52% | 14.68% | 22.98% | 22.34% | 17.31% | 18.85% | 34.06% | 24.35% | 34.34% | 15.89% | 26.11% | 25.35% | 18.24% | 19.36% | 31.73% | 24.29% | 20.04% |
| Income Tax Expense | $503.00K | $1.74M | $3.38M | $1.28M | $-102.00K | $746.00K | $-341.00K | $738.00K | $148.00K | $1.97M | $795.00K | $329.00K | $-1.83M | $-1.06M | $-1.62M | $-973.00K | $-1.60M | $-69.00K | $-1.15M | $-1.30M |
| Net Income | $8.80M | $14.32M | $10.55M | $10.68M | $5.76M | $9.99M | $9.90M | $5.87M | $7.17M | $14.29M | $8.87M | $12.10M | $7.24M | $11.48M | $10.92M | $6.91M | $8.31M | $12.74M | $9.71M | $7.67M |
| Net Income Ratio | 18.69% | 25.99% | 21.46% | 26.36% | 14.93% | 21.38% | 23.13% | 15.38% | 18.47% | 29.94% | 22.35% | 33.43% | 21.27% | 28.78% | 29.76% | 21.23% | 23.99% | 31.91% | 27.53% | 24.14% |
| EPS | $-1.99 | $0.80 | $0.59 | $0.60 | $0.32 | $0.56 | $0.56 | $0.33 | $0.40 | $0.81 | $0.50 | $0.69 | $0.42 | $0.65 | $0.62 | $0.39 | $0.48 | $0.73 | $0.55 | $0.44 |
| EPS Diluted | $-1.98 | $0.80 | $0.59 | $0.59 | $0.32 | $0.56 | $0.55 | $0.33 | $0.40 | $0.81 | $0.50 | $0.69 | $0.41 | $0.65 | $0.62 | $0.39 | $0.48 | $0.72 | $0.55 | $0.44 |
| Weighted Average Shares Outstanding | 17.83M | 17.83M | 17.83M | 17.82M | 17.82M | 17.76M | 17.71M | 17.65M | 17.64M | 17.63M | 17.58M | 17.54M | 17.16M | 17.49M | 17.49M | 17.48M | 17.47M | 17.47M | 17.46M | 17.44M |
| Weighted Average Shares Outstanding Diluted | 17.95M | 17.95M | 17.94M | 17.93M | 17.82M | 17.87M | 17.83M | 17.77M | 17.64M | 17.74M | 17.70M | 17.65M | 17.58M | 17.61M | 17.60M | 17.59M | 17.47M | 17.58M | 17.58M | 17.55M |
| SEC Filing | Source | Source | Source | Source | Source | Source | Source | Source | Source | Source | Source | Source | Source | Source | Source | Source | Source | Source | Source | Source |
Annual Balance Sheet
| Breakdown | December 31, 2024 | December 31, 2023 | December 31, 2022 | December 31, 2021 | December 31, 2020 |
|---|---|---|---|---|---|
| Cash and Cash Equivalents | $4.23M | $2.39M | $3.83M | $3.53M | $4.49M |
| Short Term Investments | $- | $- | $- | $- | $- |
| Cash and Short Term Investments | $4.23M | $2.39M | $3.83M | $3.53M | $4.49M |
| Net Receivables | $18.84M | $97.34M | $24.68M | $22.58M | $21.63M |
| Inventory | $- | $6.97M | $6.18M | $5.36M | $5.11M |
| Other Current Assets | $19.91M | $1.83M | $2.62M | $2.88M | $2.89M |
| Total Current Assets | $42.97M | $108.54M | $37.31M | $34.35M | $34.12M |
| Property Plant Equipment Net | $2.57M | $1.01B | $924.35M | $869.87M | $801.81M |
| Goodwill | $- | $- | $- | $- | $- |
| Intangible Assets | $- | $- | $- | $- | $- |
| Goodwill and Intangible Assets | $- | $- | $- | $- | $-5.91M |
| Long Term Investments | $- | $- | $- | $- | $5.91M |
| Tax Assets | $- | $- | $77.78M | $69.50M | $61.30M |
| Other Non-Current Assets | $1.21B | $114.47M | $34.98M | $46.29M | $79.24M |
| Total Non-Current Assets | $1.21B | $1.13B | $1.04B | $985.66M | $942.35M |
| Other Assets | $- | $- | $26.00K | $- | $- |
| Total Assets | $1.26B | $1.24B | $1.07B | $1.02B | $976.47M |
| Account Payables | $28.05M | $27.62M | $24.85M | $21.12M | $30.44M |
| Short Term Debt | $- | $51.09M | $72.96M | $19.73M | $9.26M |
| Tax Payables | $11.98M | $10.54M | $12.16M | $8.62M | $10.14M |
| Deferred Revenue | $1.48M | $1.39M | $1.36M | $1.33M | $1.25M |
| Other Current Liabilities | $41.39M | $13.20M | $6.52M | $5.81M | $5.76M |
| Total Current Liabilities | $82.89M | $103.83M | $117.86M | $56.62M | $56.85M |
| Long Term Debt | $375.82M | $361.22M | $293.99M | $310.89M | $278.29M |
| Deferred Revenue Non-Current | $- | $21.31M | $21.38M | $23.53M | $23.40M |
| Deferred Tax Liabilities Non-Current | $101.23M | $88.74M | $77.78M | $69.50M | $61.30M |
| Other Non-Current Liabilities | $249.97M | $235.88M | $161.03M | $189.67M | $208.34M |
| Total Non-Current Liabilities | $727.02M | $707.15M | $554.18M | $593.59M | $571.33M |
| Other Liabilities | $- | $- | $- | $- | $- |
| Total Liabilities | $809.91M | $810.98M | $672.04M | $650.21M | $628.18M |
| Preferred Stock | $1.64M | $2.08M | $2.08M | $2.08M | $2.08M |
| Common Stock | $248.20M | $246.76M | $233.05M | $221.92M | $217.45M |
| Retained Earnings | $197.06M | $176.23M | $167.27M | $145.81M | $128.76M |
| Accumulated Other Comprehensive Income Loss | $- | $- | $-233.05M | $-221.92M | $-217.45M |
| Other Total Stockholders Equity | $-1.64M | $- | $- | $- | $- |
| Total Stockholders Equity | $445.26M | $425.07M | $402.41M | $369.81M | $348.29M |
| Total Equity | $445.26M | $425.07M | $402.41M | $369.81M | $348.29M |
| Total Liabilities and Stockholders Equity | $1.26B | $1.24B | $1.07B | $1.02B | $976.47M |
| Minority Interest | $- | $- | $- | $- | $- |
| Total Liabilities and Total Equity | $1.26B | $1.24B | $1.07B | $1.02B | $976.47M |
| Total Investments | $- | $- | $- | $- | $5.91M |
| Total Debt | $375.82M | $412.31M | $366.95M | $330.62M | $287.54M |
| Net Debt | $371.60M | $409.92M | $363.12M | $327.08M | $283.05M |
Balance Sheet Charts
| Breakdown | December 31, 2024 | September 30, 2024 | June 30, 2024 | March 31, 2024 | December 31, 2023 | September 30, 2023 | June 30, 2023 | March 31, 2023 | December 31, 2022 | September 30, 2022 | June 30, 2022 | March 31, 2022 | December 31, 2021 | September 30, 2021 | June 30, 2021 | March 31, 2021 | December 31, 2020 | September 30, 2020 | June 30, 2020 | March 31, 2020 |
|---|---|---|---|---|---|---|---|---|---|---|---|---|---|---|---|---|---|---|---|---|
| Cash and Cash Equivalents | $4.23M | $6.34M | $8.03M | $2.85M | $2.39M | $2.97M | $4.38M | $4.86M | $3.83M | $2.91M | $4.32M | $3.29M | $3.53M | $5.28M | $6.03M | $4.05M | $4.49M | $5.35M | $13.20M | $15.42M |
| Short Term Investments | $- | $- | $- | $- | $- | $- | $- | $- | $- | $- | $- | $- | $- | $- | $- | $- | $- | $- | $- | $- |
| Cash and Short Term Investments | $4.23M | $6.34M | $8.03M | $2.85M | $2.39M | $2.97M | $4.38M | $4.86M | $3.83M | $2.91M | $4.32M | $3.29M | $3.53M | $5.28M | $6.03M | $4.05M | $4.49M | $5.35M | $13.20M | $15.42M |
| Net Receivables | $29.61M | $36.12M | $102.58M | $96.92M | $97.34M | $123.47M | $26.30M | $24.19M | $24.68M | $29.10M | $24.92M | $21.63M | $22.58M | $26.10M | $22.10M | $19.92M | $21.63M | $24.39M | $21.56M | $17.52M |
| Inventory | $6.72M | $6.55M | $6.48M | $7.07M | $6.97M | $6.41M | $6.43M | $6.56M | $6.18M | $5.79M | $5.71M | $5.37M | $5.36M | $5.16M | $4.66M | $5.19M | $5.11M | $4.76M | $5.27M | $5.28M |
| Other Current Assets | $2.42M | $3.13M | $3.92M | $4.37M | $1.83M | $2.92M | $3.47M | $3.91M | $2.62M | $3.67M | $4.08M | $2.57M | $2.88M | $4.03M | $4.46M | $2.22M | $2.89M | $3.37M | $3.96M | $1.79M |
| Total Current Assets | $42.97M | $52.15M | $121.00M | $111.21M | $108.54M | $135.76M | $40.57M | $39.52M | $37.31M | $41.47M | $39.02M | $32.87M | $34.35M | $40.57M | $37.24M | $31.38M | $34.12M | $37.87M | $43.99M | $40.01M |
| Property Plant Equipment Net | $1.06B | $2.72M | $1.03B | $1.02B | $1.01B | $988.84M | $970.61M | $945.65M | $924.35M | $903.85M | $883.09M | $862.37M | $869.87M | $854.59M | $840.29M | $820.21M | $801.81M | $771.43M | $751.73M | $732.31M |
| Goodwill | $- | $- | $- | $- | $- | $- | $- | $- | $- | $- | $- | $- | $- | $- | $- | $- | $- | $- | $- | $- |
| Intangible Assets | $- | $- | $- | $- | $- | $- | $- | $- | $- | $- | $- | $- | $- | $- | $- | $- | $- | $- | $- | $- |
| Goodwill and Intangible Assets | $- | $- | $- | $- | $- | $- | $- | $- | $- | $- | $- | $- | $- | $- | $-163.00K | $-163.00K | $- | $- | $- | $- |
| Long Term Investments | $- | $- | $- | $- | $- | $- | $- | $- | $- | $- | $- | $- | $- | $- | $163.00K | $163.00K | $- | $- | $- | $- |
| Tax Assets | $- | $95.41M | $91.80M | $89.69M | $88.74M | $87.76M | $85.20M | $79.05M | $- | $76.98M | $74.47M | $72.00M | $69.50M | $63.35M | $62.06M | $61.47M | $61.30M | $58.97M | $57.35M | $55.58M |
| Other Non-Current Assets | $154.26M | $1.08B | $27.05M | $25.10M | $25.73M | $31.05M | $31.21M | $34.69M | $112.77M | $42.37M | $41.44M | $42.34M | $46.29M | $71.09M | $75.39M | $73.14M | $79.24M | $91.57M | $97.80M | $107.42M |
| Total Non-Current Assets | $1.21B | $1.18B | $1.15B | $1.14B | $1.13B | $1.11B | $1.09B | $1.06B | $1.04B | $1.02B | $999.00M | $976.72M | $985.66M | $989.02M | $977.73M | $954.83M | $942.35M | $921.97M | $906.88M | $895.31M |
| Other Assets | $-33.00K | $- | $- | $- | $1 | $- | $- | $- | $26.00K | $- | $- | $- | $- | $- | $- | $- | $- | $- | $- | $- |
| Total Assets | $1.26B | $1.23B | $1.27B | $1.25B | $1.24B | $1.24B | $1.13B | $1.10B | $1.07B | $1.06B | $1.04B | $1.01B | $1.02B | $1.03B | $1.01B | $986.21M | $976.47M | $959.83M | $950.87M | $935.32M |
| Account Payables | $28.05M | $32.35M | $25.22M | $23.24M | $27.62M | $28.60M | $28.27M | $27.62M | $24.85M | $25.87M | $24.25M | $18.06M | $21.12M | $17.34M | $23.10M | $24.41M | $30.44M | $24.86M | $22.80M | $24.12M |
| Short Term Debt | $30.71M | $25.25M | $80.22M | $65.83M | $51.69M | $49.69M | $40.96M | $45.95M | $72.96M | $48.07M | $35.31M | $21.71M | $19.73M | $56.81M | $38.67M | $20.16M | $9.26M | $43.74M | $44.84M | $40.67M |
| Tax Payables | $11.98M | $13.41M | $14.24M | $14.72M | $10.54M | $8.14M | $10.34M | $16.00M | $12.16M | $12.59M | $12.51M | $14.03M | $8.62M | $12.69M | $12.22M | $14.03M | $10.14M | $10.64M | $10.11M | $11.16M |
| Deferred Revenue | $1.48M | $1.55M | $1.69M | $1.36M | $1.39M | $1.46M | $1.48M | $1.31M | $1.36M | $1.48M | $1.50M | $1.32M | $1.33M | $1.39M | $1.40M | $1.24M | $1.25M | $1.31M | $1.33M | $1.21M |
| Other Current Liabilities | $10.68M | $7.35M | $13.01M | $11.40M | $12.60M | $33.40M | $6.52M | $5.10M | $6.52M | $4.96M | $5.26M | $4.55M | $5.81M | $4.27M | $5.35M | $5.97M | $5.76M | $4.80M | $5.22M | $3.38M |
| Total Current Liabilities | $82.89M | $79.91M | $134.98M | $117.16M | $103.83M | $121.30M | $87.56M | $95.98M | $117.86M | $92.97M | $78.83M | $59.67M | $56.62M | $92.49M | $80.75M | $65.80M | $56.85M | $85.35M | $84.29M | $80.54M |
| Long Term Debt | $355.25M | $354.87M | $358.72M | $359.86M | $361.22M | $357.50M | $353.83M | $333.18M | $293.99M | $305.11M | $309.45M | $310.72M | $310.89M | $271.02M | $277.21M | $277.54M | $278.29M | $239.70M | $243.27M | $240.35M |
| Deferred Revenue Non-Current | $22.63M | $21.54M | $21.14M | $21.09M | $21.31M | $21.46M | $21.03M | $22.30M | $21.38M | $22.43M | $22.92M | $23.01M | $23.53M | $23.55M | $23.63M | $23.29M | $23.40M | $25.10M | $24.34M | $24.15M |
| Deferred Tax Liabilities Non-Current | $101.23M | $95.41M | $91.80M | $89.69M | $88.74M | $87.76M | $85.20M | $79.05M | $77.78M | $76.98M | $74.47M | $72.00M | $69.50M | $63.35M | $62.06M | $61.47M | $61.30M | $58.97M | $57.35M | $55.58M |
| Other Non-Current Liabilities | $246.27M | $234.05M | $233.03M | $232.53M | $235.88M | $233.72M | $166.41M | $162.97M | $161.03M | $167.03M | $164.70M | $164.22M | $189.67M | $214.76M | $214.15M | $207.18M | $208.34M | $206.52M | $206.16M | $205.22M |
| Total Non-Current Liabilities | $725.39M | $705.88M | $704.69M | $703.17M | $707.15M | $700.45M | $626.46M | $597.50M | $554.18M | $571.54M | $571.54M | $569.95M | $593.59M | $572.67M | $577.05M | $569.48M | $571.33M | $530.29M | $531.12M | $525.29M |
| Other Liabilities | $- | $- | $- | $- | $- | $- | $- | $- | $- | $- | $- | $- | $- | $- | $- | $- | $- | $- | $- | $- |
| Total Liabilities | $808.28M | $785.79M | $839.68M | $820.33M | $810.98M | $821.75M | $714.02M | $693.48M | $672.04M | $664.51M | $650.37M | $629.62M | $650.21M | $665.17M | $657.79M | $635.28M | $628.18M | $615.64M | $615.41M | $605.83M |
| Preferred Stock | $1.64M | $1.89M | $2.08M | $2.08M | $2.08M | $2.08M | $2.08M | $2.08M | $2.08M | $2.08M | $2.08M | $2.08M | $2.08M | $2.08M | $2.08M | $2.08M | $2.08M | $2.08M | $2.08M | $2.08M |
| Common Stock | $248.20M | $247.58M | $247.01M | $246.55M | $246.76M | $243.25M | $239.54M | $235.76M | $233.05M | $232.42M | $229.04M | $225.09M | $221.92M | $218.66M | $218.10M | $217.98M | $217.45M | $216.87M | $216.37M | $215.60M |
| Retained Earnings | $197.06M | $194.36M | $185.86M | $181.14M | $176.23M | $176.33M | $171.93M | $167.60M | $167.27M | $165.65M | $156.53M | $152.79M | $145.81M | $143.68M | $137.00M | $130.87M | $128.76M | $125.24M | $117.01M | $111.80M |
| Accumulated Other Comprehensive Income Loss | $- | $- | $-0 | $-246.55M | $-246.76M | $-243.25M | $2.08M | $-235.76M | $-233.05M | $-232.42M | $-229.04M | $-225.09M | $-221.92M | $-0 | $-191.51M | $-188.56M | $0 | $-181.66M | $-177.57M | $-173.51M |
| Other Total Stockholders Equity | $- | $- | $- | $- | $- | $- | $- | $- | $- | $- | $- | $- | $- | $- | $- | $- | $- | $- | $- | $- |
| Total Stockholders Equity | $446.90M | $443.82M | $434.96M | $429.78M | $425.07M | $421.67M | $413.56M | $405.44M | $402.41M | $400.16M | $387.65M | $379.97M | $369.81M | $364.42M | $357.18M | $350.93M | $348.29M | $344.19M | $335.46M | $329.48M |
| Total Equity | $446.90M | $443.82M | $434.96M | $429.78M | $425.07M | $421.67M | $413.56M | $405.44M | $402.41M | $400.16M | $387.65M | $379.97M | $369.81M | $364.42M | $357.18M | $350.93M | $348.29M | $344.19M | $335.46M | $329.48M |
| Total Liabilities and Stockholders Equity | $1.26B | $1.23B | $1.27B | $1.25B | $1.24B | $1.24B | $1.13B | $1.10B | $1.07B | $1.06B | $1.04B | $1.01B | $1.02B | $1.03B | $1.01B | $986.21M | $976.47M | $959.83M | $950.87M | $935.32M |
| Minority Interest | $- | $- | $- | $- | $- | $- | $- | $- | $- | $- | $- | $- | $- | $- | $- | $- | $- | $- | $- | $- |
| Total Liabilities and Total Equity | $1.26B | $1.23B | $1.27B | $1.25B | $1.24B | $1.24B | $1.13B | $1.10B | $1.07B | $1.06B | $1.04B | $1.01B | $1.02B | $1.03B | $1.01B | $986.21M | $976.47M | $959.83M | $950.87M | $935.32M |
| Total Investments | $- | $- | $- | $- | $- | $- | $- | $- | $- | $- | $- | $- | $- | $- | $163.00K | $163.00K | $- | $- | $- | $- |
| Total Debt | $385.96M | $380.12M | $439.54M | $426.30M | $412.31M | $407.19M | $394.79M | $379.13M | $366.95M | $353.18M | $344.76M | $332.43M | $330.62M | $327.82M | $315.88M | $297.69M | $287.54M | $283.44M | $288.11M | $281.02M |
| Net Debt | $381.74M | $373.77M | $431.51M | $423.44M | $409.92M | $404.22M | $390.41M | $374.27M | $363.12M | $350.27M | $340.44M | $329.13M | $327.08M | $322.54M | $309.85M | $293.65M | $283.05M | $278.10M | $274.91M | $265.60M |
Annual Cash Flow
| Breakdown | December 31, 2024 | December 31, 2023 | December 31, 2022 | December 31, 2021 | December 31, 2020 |
|---|---|---|---|---|---|
| Net Income | $44.35M | $31.52M | $42.43M | $36.54M | $38.42M |
| Depreciation and Amortization | $28.04M | $29.44M | $27.48M | $26.80M | $20.84M |
| Deferred Income Tax | $- | $-5.60M | $-5.33M | $-10.99M | $-13.49M |
| Stock Based Compensation | $1.54M | $2.21M | $1.63M | $1.34M | $1.10M |
| Change in Working Capital | $- | $-3.04M | $1.38M | $-19.02M | $9.38M |
| Accounts Receivables | $-670.00K | $-2.79M | $-707.00K | $-742.00K | $-2.66M |
| Inventory | $- | $-795.00K | $-819.00K | $-246.00K | $333.00K |
| Accounts Payables | $2.57M | $2.77M | $3.72M | $-9.32M | $7.14M |
| Other Working Capital | $- | $-2.23M | $-817.00K | $-8.72M | $4.57M |
| Other Non Cash Items | $-15.20M | $-1.76M | $-6.22M | $-1.64M | $-2.89M |
| Net Cash Provided by Operating Activities | $58.73M | $52.78M | $61.36M | $33.03M | $53.35M |
| Investments in Property Plant and Equipment | $- | $-90.18M | $-91.33M | $-79.38M | $-105.62M |
| Acquisitions Net | $- | $- | $3.12M | $- | $- |
| Purchases of Investments | $- | $- | $- | $- | $- |
| Sales Maturities of Investments | $- | $- | $- | $- | $- |
| Other Investing Activities | $-74.62M | $- | $3.12M | $-105.62M | $-105.62M |
| Net Cash Used for Investing Activities | $-74.62M | $-90.18M | $-88.21M | $-79.38M | $-105.62M |
| Debt Repayment | $- | $45.60M | $37.74M | $44.90M | $24.84M |
| Common Stock Issued | $974.00K | $12.12M | $10.34M | $3.84M | $1.23M |
| Common Stock Repurchased | $- | $- | $- | $- | $- |
| Dividends Paid | $-23.41M | $-22.56M | $-20.93M | $-19.49M | $-18.30M |
| Other Financing Activities | $40.16M | $806.00K | $3.00K | $14.07M | $8.39M |
| Net Cash Used Provided by Financing Activities | $17.73M | $35.96M | $27.15M | $39.48M | $16.17M |
| Effect of Forex Changes on Cash | $- | $- | $- | $- | $- |
| Net Change in Cash | $1.84M | $-1.44M | $295.00K | $-6.87M | $-36.09M |
| Cash at End of Period | $4.23M | $2.39M | $3.83M | $3.53M | $10.40M |
| Cash at Beginning of Period | $2.39M | $3.83M | $3.53M | $10.40M | $46.50M |
| Operating Cash Flow | $58.73M | $52.78M | $61.36M | $33.03M | $53.35M |
| Capital Expenditure | $- | $-90.18M | $-91.33M | $-79.38M | $-105.62M |
| Free Cash Flow | $58.73M | $-37.40M | $-29.97M | $-46.35M | $-52.26M |
Cash Flow Charts
| Breakdown | December 31, 2024 | September 30, 2024 | June 30, 2024 | March 31, 2024 | December 31, 2023 | September 30, 2023 | June 30, 2023 | March 31, 2023 | December 31, 2022 | September 30, 2022 | June 30, 2022 | March 31, 2022 | December 31, 2021 | September 30, 2021 | June 30, 2021 | March 31, 2021 | December 31, 2020 | September 30, 2020 | June 30, 2020 | March 31, 2020 |
|---|---|---|---|---|---|---|---|---|---|---|---|---|---|---|---|---|---|---|---|---|
| Net Income | $8.80M | $14.32M | $10.55M | $10.68M | $5.77M | $9.99M | $9.90M | $5.87M | $7.17M | $14.29M | $8.87M | $12.10M | $7.24M | $11.48M | $10.92M | $6.91M | $8.31M | $12.74M | $9.71M | $7.67M |
| Depreciation and Amortization | $7.81M | $7.22M | $7.03M | $5.98M | $7.34M | $7.56M | $7.34M | $7.20M | $7.34M | $6.73M | $6.58M | $6.83M | $9.55M | $4.35M | $6.60M | $6.30M | $5.24M | $5.29M | $5.20M | $5.11M |
| Deferred Income Tax | $-2.01M | $-1.72M | $340.00K | $1.38M | $-914.00K | $-1.69M | $-2.38M | $-611.00K | $-1.02M | $-1.06M | $-1.12M | $-2.14M | $812.00K | $-3.95M | $-5.49M | $-2.36M | $-2.50M | $-3.79M | $-3.78M | $-3.43M |
| Stock Based Compensation | $310.00K | $155.00K | $1.54M | $-465.00K | $424.00K | $424.00K | $1.01M | $360.00K | $360.00K | $361.00K | $642.00K | $267.00K | $305.00K | $273.00K | $557.00K | $203.00K | $276.00K | $188.00K | $470.00K | $162.00K |
| Change in Working Capital | $6.75M | $-596.00K | $-7.99M | $-10.71M | $499.00K | $-5.37M | $-1.88M | $3.70M | $3.82M | $-2.60M | $-2.01M | $2.17M | $-3.32M | $-7.92M | $-6.88M | $-900.00K | $5.68M | $2.77M | $-6.18M | $7.12M |
| Accounts Receivables | $6.51M | $703.00K | $-5.66M | $425.00K | $2.84M | $-3.76M | $296.00K | $492.00K | $2.06M | $-3.45M | $-1.15M | $1.83M | $1.72M | $-3.75M | $-571.00K | $1.86M | $998.00K | $-2.95M | $-1.80M | $1.08M |
| Inventory | $- | $-495.00K | $595.00K | $-100.00K | $-567.00K | $21.00K | $133.00K | $-382.00K | $-385.00K | $-85.00K | $-338.00K | $-11.00K | $-202.00K | $-495.00K | $532.00K | $-81.00K | $-350.00K | $512.00K | $2.00K | $169.00K |
| Accounts Payables | $-2.16M | $7.13M | $1.98M | $-4.38M | $-986.00K | $339.00K | $642.00K | $2.78M | $-1.03M | $1.62M | $6.19M | $-3.07M | $3.79M | $-5.76M | $-1.31M | $-6.03M | $5.58M | $2.06M | $-1.31M | $810.00K |
| Other Working Capital | $2.40M | $-7.94M | $-4.90M | $-6.66M | $-785.00K | $-1.97M | $-2.95M | $814.00K | $3.17M | $-683.00K | $-6.71M | $3.41M | $-8.62M | $2.08M | $-5.52M | $3.35M | $-554.00K | $3.15M | $-3.08M | $5.05M |
| Other Non Cash Items | $-268.00K | $77.00K | $18.44M | $15.33M | $-316.00K | $-223.00K | $-673.00K | $-548.00K | $-546.00K | $-353.00K | $-72.00K | $-5.25M | $-188.00K | $-173.00K | $-575.00K | $-705.00K | $-939.00K | $-726.00K | $-740.00K | $-489.00K |
| Net Cash Provided by Operating Activities | $21.39M | $19.46M | $11.23M | $6.65M | $12.80M | $10.70M | $13.32M | $15.97M | $17.12M | $17.38M | $12.89M | $13.97M | $14.39M | $4.06M | $5.14M | $9.44M | $16.07M | $16.47M | $4.68M | $16.14M |
| Investments in Property Plant and Equipment | $-25.14M | $28.74M | $-14.35M | $-14.39M | $-17.11M | $-22.44M | $-26.12M | $-24.52M | $-25.40M | $-26.60M | $-22.71M | $-16.63M | $-18.13M | $-14.74M | $-24.47M | $-22.03M | $-34.83M | $-25.37M | $-20.27M | $-25.15M |
| Acquisitions Net | $- | $- | $- | $- | $- | $- | $- | $- | $-3.12M | $- | $- | $3.12M | $- | $- | $- | $- | $- | $- | $- | $- |
| Purchases of Investments | $- | $- | $- | $- | $- | $- | $- | $- | $- | $- | $- | $- | $- | $- | $- | $- | $- | $- | $- | $- |
| Sales Maturities of Investments | $- | $- | $- | $- | $- | $- | $- | $- | $- | $- | $- | $- | $- | $- | $- | $- | $- | $- | $- | $- |
| Other Investing Activities | $- | $-49.48M | $-14.35M | $-14.39M | $-90.18M | $- | $- | $-24.52M | $3.12M | $- | $- | $3.12M | $-64.63M | $- | $- | $-22.03M | $-105.62M | $- | $- | $-25.15M |
| Net Cash Used for Investing Activities | $-25.14M | $-20.74M | $-14.35M | $-14.39M | $-17.11M | $-22.44M | $-26.12M | $-24.52M | $-25.40M | $-26.60M | $-22.71M | $-13.51M | $-18.13M | $-14.74M | $-24.47M | $-22.03M | $-34.83M | $-25.37M | $-20.27M | $-25.15M |
| Debt Repayment | $6.00M | $-58.68M | $13.43M | $14.14M | $4.67M | $12.60M | $15.91M | $12.42M | $13.97M | $9.14M | $12.60M | $2.02M | $3.96M | $12.18M | $18.40M | $10.36M | $4.42M | $-4.50M | $7.36M | $17.57M |
| Common Stock Issued | $234.00K | $235.00K | $253.00K | $252.00K | $3.09M | $3.28M | $3.40M | $2.34M | $271.00K | $3.02M | $4.13M | $2.91M | $2.95M | $289.00K | $274.00K | $322.00K | $309.00K | $313.00K | $295.00K | $313.00K |
| Common Stock Repurchased | $- | $- | $- | $- | $- | $- | $- | $- | $- | $- | $- | $- | $- | $- | $- | $- | $- | $- | $- | $- |
| Dividends Paid | $-6.10M | $-5.82M | $-5.82M | $-5.77M | $-5.87M | $-5.58M | $-5.57M | $-5.54M | $-5.54M | $-5.14M | $-5.13M | $-5.12M | $-5.11M | $-4.80M | $-4.79M | $-4.79M | $-4.79M | $-4.51M | $-4.50M | $-4.50M |
| Other Financing Activities | $1.50M | $63.87M | $429.00K | $-418.00K | $4.93M | $31.00K | $-1.43M | $2.70M | $494.00K | $782.00K | $-757.00K | $-516.00K | $3.14M | $2.40M | $7.70M | $825.00K | $1.36M | $3.65M | $1.27M | $2.43M |
| Net Cash Used Provided by Financing Activities | $1.63M | $-394.00K | $8.29M | $8.20M | $3.73M | $10.33M | $12.32M | $9.58M | $9.20M | $7.80M | $10.85M | $-705.00K | $1.99M | $9.78M | $21.31M | $6.40M | $986.00K | $-5.05M | $4.42M | $15.81M |
| Effect of Forex Changes on Cash | $- | $- | $- | $- | $- | $- | $- | $- | $- | $- | $- | $- | $-5.12M | $-2.00K | $2.00K | $- | $- | $- | $- | $- |
| Net Change in Cash | $-2.12M | $-1.68M | $5.17M | $465.00K | $-580.00K | $-1.41M | $-485.00K | $1.03M | $920.00K | $-1.41M | $1.03M | $-239.00K | $-1.75M | $-907.00K | $1.98M | $-6.20M | $-17.78M | $-13.95M | $-11.17M | $6.80M |
| Cash at End of Period | $4.23M | $6.34M | $8.03M | $2.85M | $2.39M | $2.97M | $4.38M | $4.86M | $3.83M | $2.91M | $4.32M | $3.29M | $3.53M | $5.28M | $6.19M | $4.21M | $10.40M | $28.19M | $42.13M | $53.30M |
| Cash at Beginning of Period | $6.34M | $8.03M | $2.85M | $2.39M | $2.97M | $4.38M | $4.86M | $3.83M | $2.91M | $4.32M | $3.29M | $3.53M | $5.28M | $6.19M | $4.21M | $10.40M | $28.19M | $42.13M | $53.30M | $46.50M |
| Operating Cash Flow | $21.39M | $19.46M | $11.23M | $6.65M | $12.80M | $10.70M | $13.32M | $15.97M | $17.12M | $17.38M | $12.89M | $13.97M | $14.39M | $4.06M | $5.14M | $9.44M | $16.07M | $16.47M | $4.68M | $16.14M |
| Capital Expenditure | $-25.14M | $28.74M | $-14.35M | $-14.39M | $-17.11M | $-22.44M | $-26.12M | $-24.52M | $-25.40M | $-26.60M | $-22.71M | $-16.63M | $-18.13M | $-14.74M | $-24.47M | $-22.03M | $-34.83M | $-25.37M | $-20.27M | $-25.15M |
| Free Cash Flow | $-3.75M | $48.19M | $-3.12M | $-7.74M | $-4.31M | $-11.74M | $-12.80M | $-8.54M | $-8.28M | $-9.22M | $-9.83M | $-2.66M | $-3.74M | $-10.69M | $-19.33M | $-12.59M | $-18.77M | $-8.90M | $-15.59M | $-9.01M |
Middlesex Water Dividends
Explore Middlesex Water's dividend history, including dividend yield, payout ratio, and historical payments.
Dividend Yield
2.49%
Dividend Payout Ratio
52.78%
Dividend Paid & Capex Coverage Ratio
2.51x
Middlesex Water Dividend History
| Dividend | Adjusted Dividend | Date | Record Date | Payment Date | Declaration Date |
|---|---|---|---|---|---|
| $0.34 | $0.34 | February 18, 2025 | February 18, 2025 | March 03, 2025 | January 28, 2025 |
| $0.34 | $0.34 | November 15, 2024 | November 15, 2024 | December 02, 2024 | October 24, 2024 |
| $0.325 | $0.325 | August 15, 2024 | August 15, 2024 | September 03, 2024 | July 24, 2024 |
| $0.325 | $0.325 | May 14, 2024 | May 15, 2024 | June 03, 2024 | April 25, 2024 |
| $0.325 | $0.325 | February 14, 2024 | February 15, 2024 | March 01, 2024 | January 29, 2024 |
| $0.325 | $0.325 | November 15, 2023 | November 16, 2023 | December 01, 2023 | October 20, 2023 |
| $0.3125 | $0.3125 | August 10, 2023 | August 11, 2023 | September 01, 2023 | July 20, 2023 |
| $0.3125 | $0.3125 | May 11, 2023 | May 12, 2023 | June 01, 2023 | April 28, 2023 |
| $0.313 | $0.3125 | February 13, 2023 | February 14, 2023 | March 01, 2023 | February 03, 2023 |
| $0.313 | $0.3125 | November 15, 2022 | November 16, 2022 | December 01, 2022 | October 21, 2022 |
| $0.29 | $0.29 | August 11, 2022 | August 12, 2022 | September 01, 2022 | July 22, 2022 |
| $0.29 | $0.29 | May 12, 2022 | May 13, 2022 | June 01, 2022 | April 22, 2022 |
| $0.29 | $0.29 | February 11, 2022 | February 14, 2022 | March 01, 2022 | January 27, 2022 |
| $0.29 | $0.29 | November 15, 2021 | November 16, 2021 | December 01, 2021 | October 20, 2021 |
| $0.273 | $0.2725 | August 12, 2021 | August 13, 2021 | September 01, 2021 | July 23, 2021 |
| $0.2725 | $0.2725 | May 13, 2021 | May 14, 2021 | June 01, 2021 | April 23, 2021 |
| $0.2725 | $0.2725 | February 11, 2021 | February 12, 2021 | March 01, 2021 | January 28, 2021 |
| $0.2725 | $0.2725 | November 12, 2020 | November 13, 2020 | December 01, 2020 | October 21, 2020 |
| $0.25625 | $0.25625 | August 13, 2020 | August 14, 2020 | September 01, 2020 | July 24, 2020 |
| $0.25625 | $0.25625 | May 14, 2020 | May 15, 2020 | June 01, 2020 | April 21, 2020 |
Middlesex Water News
Read the latest news about Middlesex Water, including recent articles, headlines, and updates.
2025 Dividend Kings: Strong Run Continues
The Dividend Kings are outperforming the S&P 500 in 2025 by 4.57%. Top performers include National Fuel & Gas (+30.21%), Consolidated Edison (+22.66%), and AbbVie (+20.40%). Promising Dividend Kings identified in February showed relative outperformance, averaging -0.38% vs. -1.58% for all Kings and -3.34% for SPY.


Middlesex Water Company Reports 2024 Financial Results
Diluted earnings per share (“EPS”) of $2.47 for 2024, compared to 2023 earnings of $1.76 Invested $75 million in capital expenditures in 2024 to upgrade, replace and enhance the resiliency of its water and wastewater utility infrastructure Utility infrastructure investment of $387 million planned from 2025 through 2027 ISELIN, N.J., Feb. 28, 2025 (GLOBE NEWSWIRE) -- Middlesex Water Company (“Middlesex” or the “Company”) (NASDAQ: MSEX) today announced financial results for the fourth quarter and year end 2024.

Buy 3 "Safer" Dividend Kings Of 24 Out Of 52 For February
Seven of the top-ten Dividend Kings by yield offer annual dividends from a $1K investment exceeding their single share prices, making them attractive buys. Six Dividend Kings, including Altria Group and Hormel Foods, are currently fair-priced, with dividends meeting or exceeding their single-share prices. Analysts predict net gains between 15% and 45.53% for the top-ten Dividend Kings by February 2026, based on target prices.

Middlesex Water Company Announces Appointment of Brian Hague as new Vice President of Communications & Corporate Affairs
ISELIN, N.J., Feb. 05, 2025 (GLOBE NEWSWIRE) -- Middlesex Water Company (NASDAQ: MSEX) today announced the hiring of Brian Hague as its Vice President of Communications and Corporate Affairs, where he will focus on internal and external communications, crisis management, government affairs, and community outreach.

Middlesex Water Company to Report 2024 Earnings on February 28, 2025
ISELIN, N.J., Feb. 03, 2025 (GLOBE NEWSWIRE) -- Middlesex Water Company (NASDAQ:MSEX), a provider of water, wastewater and related utility services, plans to announce its financial results for the fourth quarter and 2024 earnings on February 28, 2025 after the market closes.

Middlesex Water Company Declares Quarterly Cash Dividend
ISELIN, N.J., Jan. 28, 2025 (GLOBE NEWSWIRE) -- Middlesex Water Company (NASDAQ: MSEX) announced today that its Board of Directors has declared a quarterly cash dividend of $0.34 per share on its common stock, payable March 3, 2025, to shareholders of record as of February 18, 2025.


Buy 3 'Safer' Dividend Kings Of 25 From 53 For January
“A Dividend King [is] a stock with 50 or more consecutive years of dividend increases.”—suredividend.com. 53 Divided Kings, screened as of January 10, 2025, represented all eleven Morningstar Sectors. Broker-estimated top-ten net-gains ranged 22.84%-62.53% topped-by SJW & SCL. By yield, MO topped all the Kings. Top-ten Yields from KVUE, SWK, UBSI, FTS, FRT, BKH, NWN, CDUAF, UVV, & MO, averaged 5.04%.


Buy 6 December Dividend Kings But Watch 22 With 'Safer' Dividends
"A Dividend King [is] a stock with 50 or more consecutive years of dividend increases." - suredividend.com. 53 Divided Kings, screened as of December 11, 2024, represented all eleven Morningstar Sectors. Broker-estimated top-ten net gains ranged from 14.79% to 25.23%, topped by SJW and SWK. By yield, MO topped all the Kings. Top-ten yields from ABBV, ADM, SWK, FRT, FTS, BKH, NWN, CDUAF, UVV, and MO averaged 4.67%.


Middlesex Water Announces Retirement of G. Christian Andreasen, Vice President, Enterprise Engineering
ISELIN, N.J., Nov. 26, 2024 (GLOBE NEWSWIRE) -- Middlesex Water Company (the “Company” or “Middlesex”), (Nasdaq:MSEX), a provider of water and wastewater and related services primarily in New Jersey and Delaware, today announced that G.

Middlesex Water Names Gregory Sorensen Vice President and Chief Operating Officer
ISELIN, N.J., Nov. 26, 2024 (GLOBE NEWSWIRE) -- Middlesex Water Company (Nasdaq:MSEX), a provider of water and wastewater and related services primarily in New Jersey and Delaware, today announced that Gregory Sorensen has been named as its Vice President and Chief Operating Officer, effective December 16, 2024, as part of ongoing strategic succession planning and organizational realignment efforts.

17 Upcoming Dividend Increases
This week, 17 companies with an average dividend increase of 8.3% are highlighted, emphasizing consistent dividend growth and outperforming benchmarks. My investment strategy focuses on buying, holding, and adding companies with consistent dividend increases and superior performance compared to benchmarks. The list is created using data from the "U.S. Dividend Champions" spreadsheet and NASDAQ, featuring companies with at least five years of dividend growth.


Middlesex Water Company Increases Common Dividend by 4.62%
ISELIN, N.J., Oct. 24, 2024 (GLOBE NEWSWIRE) -- Middlesex Water Company (NASDAQ: MSEX) announced today that its Board of Directors has declared a quarterly cash dividend of $0.34 per share on its common stock, a 4.62% increase from the $0.325 per share dividend last declared in July 2024.

Middlesex Water to Report 3rd Quarter 2024 Earnings on October 31
ISELIN, N.J., Oct. 21, 2024 (GLOBE NEWSWIRE) -- Middlesex Water Company (NASDAQ:MSEX), a provider of water, wastewater and related utility services, plans to announce its financial results for the third quarter ended September 30, 2024 on October 31, 2024 after the market closes. The press release and the company's 10-Q filing will be available in the Investors section of the Company's website.

Buy 7 October Dividend Kings, Watch 10 More
A Dividend King is a stock with 50 or more consecutive years of dividend increases per suredividend.com. The 53 Dividend Kings, screened as of October 8, represented 8 of 11 Morningstar Sectors. Broker-targeted top-ten net-gains ranged 13.99%-20.65% topped by Northwest Natural and United Bankshares. By yield, Altria tops all. Top-ten October dogs: HRL, KVUE, FRT, UBSI, FTS, BKH, NWN, CDUAF, UVV, and MO averaged 4.87% in yield.

Middlesex Water Company Announces Retirement of Bernadette Sohler, VP of Corporate Affairs
ISELIN, N.J., Oct. 09, 2024 (GLOBE NEWSWIRE) -- Middlesex Water Company (the “Company” or “Middlesex”), (Nasdaq:MSEX), a provider of water and wastewater and related services primarily in New Jersey and Delaware, today announced that Bernadette M.


Similar Companies
Related Metrics
Explore detailed financial metrics and analysis for MSEX.