Materion Key Executives
This section highlights Materion's key executives, including their titles and compensation details.
Find Contacts at Materion
(Showing 0 of )
Materion Earnings
This section highlights Materion's earnings, including key dates, EPS, earnings reports, and earnings call transcripts.
Next Earnings Date
Last Earnings Results
Earnings Call Transcripts
| Transcript | Quarter | Year | Date | Estimated EPS | Actual EPS |
|---|---|---|---|---|---|
| Read Transcript | Q4 | 2024 | 2025-02-19 | $1.43 | $1.55 |
| Read Transcript | Q3 | 2024 | 2024-10-30 | $1.41 | $1.41 |
| Read Transcript | Q1 | 2024 | 2024-05-02 | N/A | N/A |
| Read Transcript | Q4 | 2023 | 2024-02-15 | $1.38 | $1.41 |
| Read Transcript | Q3 | 2023 | 2023-11-02 | N/A | N/A |
| Read Transcript | Q2 | 2023 | 2023-08-02 | $1.36 | $1.38 |
| Read Transcript | Q1 | 2023 | 2023-05-06 | N/A | N/A |
Financial Statements
Access annual & quarterly financial statements for Materion, including income statements, balance sheets, and cash flow statements..
Annual Income Statement
| Breakdown | December 31, 2024 | December 31, 2023 | December 31, 2022 | December 31, 2021 | December 31, 2020 |
|---|---|---|---|---|---|
| Revenue | $1.68B | $1.67B | $1.76B | $1.51B | $1.18B |
| Cost of Revenue | $1.36B | $1.32B | $1.41B | $1.23B | $983.64M |
| Gross Profit | $325.99M | $349.04M | $343.88M | $283.76M | $192.63M |
| Gross Profit Ratio | 19.35% | 20.96% | 19.57% | 18.78% | 16.38% |
| Research and Development Expenses | $29.03M | $27.54M | $28.98M | $26.57M | $20.28M |
| General and Administrative Expenses | $- | $- | $- | $- | $- |
| Selling and Marketing Expenses | $- | $- | $- | $- | $- |
| Selling General and Administrative Expenses | $145.59M | $157.91M | $169.34M | $163.78M | $133.96M |
| Other Expenses | $104.15M | $27.15M | $24.24M | $16.74M | $8.46M |
| Operating Expenses | $278.76M | $209.89M | $222.55M | $207.09M | $162.71M |
| Cost and Expenses | $1.53B | $1.53B | $1.64B | $1.43B | $1.15B |
| Interest Income | $- | $- | $21.91M | $4.90M | $3.88M |
| Interest Expense | $34.76M | $31.32M | $21.91M | $4.90M | $3.88M |
| Depreciation and Amortization | $68.68M | $61.64M | $53.44M | $44.14M | $42.38M |
| EBITDA | $113.46M | $200.80M | $178.69M | $126.36M | $54.54M |
| EBITDA Ratio | 6.73% | 12.06% | 10.17% | 8.36% | 4.64% |
| Operating Income | $47.22M | $139.12M | $119.75M | $77.11M | $33.86M |
| Operating Income Ratio | 2.80% | 8.35% | 6.82% | 5.10% | 2.88% |
| Total Other Income Expenses Net | $-32.32M | $-31.29M | $-16.66M | $214.00K | $60.00K |
| Income Before Tax | $14.90M | $107.83M | $103.10M | $77.33M | $8.28M |
| Income Before Tax Ratio | 0.88% | 6.48% | 5.87% | 5.12% | 0.70% |
| Income Tax Expense | $9.01M | $12.13M | $17.11M | $4.85M | $-7.19M |
| Net Income | $5.89M | $95.70M | $85.99M | $72.47M | $15.46M |
| Net Income Ratio | 0.35% | 5.75% | 4.89% | 4.80% | 1.31% |
| EPS | $0.28 | $4.64 | $4.19 | $3.55 | $0.76 |
| EPS Diluted | $0.28 | $4.58 | $4.14 | $3.50 | $0.75 |
| Weighted Average Shares Outstanding | 20.73M | 20.62M | 20.51M | 20.42M | 20.34M |
| Weighted Average Shares Outstanding Diluted | 20.93M | 20.91M | 20.76M | 20.69M | 20.60M |
| SEC Filing | Source | Source | Source | Source | Source |
| Breakdown | December 31, 2024 | September 27, 2024 | June 28, 2024 | March 29, 2024 | December 31, 2023 | September 29, 2023 | June 30, 2023 | March 31, 2023 | December 31, 2022 | September 30, 2022 | July 01, 2022 | April 01, 2022 | December 31, 2021 | October 01, 2021 | July 02, 2021 | April 02, 2021 | December 31, 2020 | September 25, 2020 | June 26, 2020 | March 27, 2020 |
|---|---|---|---|---|---|---|---|---|---|---|---|---|---|---|---|---|---|---|---|---|
| Revenue | $436.87M | $436.71M | $425.67M | $385.29M | $421.11M | $403.07M | $398.55M | $442.53M | $434.58M | $428.19M | $445.30M | $449.05M | $397.23M | $388.03M | $371.00M | $354.39M | $339.69M | $287.17M | $271.47M | $277.95M |
| Cost of Revenue | $343.89M | $355.78M | $347.93M | $314.07M | $345.30M | $314.13M | $309.50M | $351.19M | $336.16M | $345.45M | $357.87M | $373.75M | $324.16M | $313.71M | $301.42M | $287.59M | $283.89M | $240.53M | $223.38M | $232.37M |
| Gross Profit | $92.98M | $80.94M | $77.74M | $71.21M | $75.82M | $88.94M | $89.06M | $91.34M | $98.42M | $82.74M | $87.43M | $75.29M | $73.07M | $74.31M | $69.58M | $66.80M | $55.80M | $46.64M | $48.09M | $45.58M |
| Gross Profit Ratio | 21.28% | 18.53% | 18.26% | 18.48% | 18.00% | 22.06% | 22.34% | 20.64% | 22.65% | 19.32% | 19.63% | 16.77% | 18.40% | 19.15% | 18.76% | 18.85% | 16.43% | 16.24% | 17.71% | 16.40% |
| Research and Development Expenses | $6.32M | $7.87M | $7.70M | $7.14M | $6.44M | $6.32M | $7.15M | $7.62M | $6.88M | $7.43M | $7.59M | $7.07M | $7.41M | $6.35M | $6.60M | $6.21M | $6.18M | $5.42M | $4.50M | $4.18M |
| General and Administrative Expenses | $- | $- | $- | $- | $- | $- | $- | $- | $- | $- | $- | $- | $- | $- | $- | $- | $- | $- | $- | $- |
| Selling and Marketing Expenses | $- | $- | $- | $- | $- | $- | $- | $- | $- | $- | $- | $- | $- | $- | $- | $- | $- | $- | $- | $- |
| Selling General and Administrative Expenses | $41.13M | $35.01M | $33.60M | $35.84M | $39.86M | $38.81M | $38.91M | $40.34M | $46.67M | $38.96M | $42.05M | $41.66M | $45.75M | $43.20M | $38.06M | $36.78M | $34.67M | $35.70M | $32.85M | $30.74M |
| Other Expenses | $83.87M | $6.80M | $-1.08M | $-434.00K | $-3.52M | $685.00K | $726.00K | $6.44M | $5.66M | $6.54M | $1.17M | $1.17M | $1.28M | $1.28M | $1.28M | $1.28M | $1.07M | $1.08M | $874.00K | $1.07M |
| Operating Expenses | $131.32M | $49.68M | $42.38M | $42.99M | $49.83M | $51.34M | $52.26M | $54.40M | $59.22M | $52.93M | $55.51M | $54.95M | $57.62M | $52.69M | $48.87M | $46.59M | $45.17M | $43.33M | $39.50M | $37.35M |
| Cost and Expenses | $391.35M | $405.46M | $390.31M | $357.06M | $395.12M | $365.47M | $361.75M | $405.59M | $395.37M | $398.38M | $413.38M | $428.71M | $381.78M | $366.41M | $350.29M | $334.19M | $329.06M | $283.87M | $262.88M | $269.72M |
| Interest Income | $- | $- | $- | $- | $- | $7.68M | $7.64M | $- | $7.58M | $5.89M | $- | $- | $- | $- | $- | $- | $- | $- | $- | $- |
| Interest Expense | $8.84M | $8.84M | $8.80M | $8.28M | $15.97M | $7.68M | $7.64M | $7.50M | $7.58M | $5.89M | $4.70M | $3.73M | $2.42M | $861.00K | $858.00K | $761.00K | $1.04M | $1.33M | $1.26M | $246.00K |
| Depreciation and Amortization | $17.39M | $18.59M | $16.51M | $16.18M | $15.12M | $15.08M | $16.35M | $15.09M | $14.21M | $13.15M | $12.89M | $13.18M | $11.66M | $13.41M | $10.46M | $8.60M | $10.34M | $8.52M | $9.25M | $14.27M |
| EBITDA | $-21.47M | $49.20M | $47.91M | $37.81M | $50.79M | $51.15M | $51.39M | $52.76M | $55.15M | $43.31M | $45.92M | $33.95M | $28.45M | $35.85M | $32.46M | $29.59M | $18.24M | $10.31M | $18.80M | $10.65M |
| EBITDA Ratio | -4.92% | 11.27% | 11.26% | 9.81% | 12.06% | 12.69% | 12.90% | 11.92% | 12.69% | 10.11% | 10.31% | 7.56% | 7.16% | 9.24% | 8.75% | 8.35% | 5.37% | 3.59% | 6.93% | 3.83% |
| Operating Income | $-38.35M | $31.26M | $35.35M | $28.23M | $25.99M | $-36.52M | $35.34M | $36.94M | $26.73M | $29.10M | $31.86M | $19.61M | $15.51M | $21.16M | $20.72M | $19.72M | $6.83M | $713.00K | $8.71M | $-4.56M |
| Operating Income Ratio | -8.78% | 7.16% | 8.31% | 7.33% | 6.17% | -9.06% | 8.87% | 8.35% | 6.15% | 6.80% | 7.15% | 4.37% | 3.90% | 5.45% | 5.59% | 5.56% | 2.01% | 0.25% | 3.21% | -1.64% |
| Total Other Income Expenses Net | $-8.33M | $-8.20M | $-8.16M | $-7.64M | $-7.93M | $-6.99M | $-6.92M | $-6.77M | $-5.84M | $-4.71M | $-3.53M | $-2.57M | $-1.14M | $418.00K | $419.00K | $515.00K | $-5.88M | $-258.00K | $-408.00K | $698.00K |
| Income Before Tax | $-46.67M | $23.06M | $23.90M | $14.61M | $19.71M | $29.53M | $28.43M | $30.17M | $33.35M | $24.38M | $28.33M | $17.04M | $14.37M | $21.58M | $21.14M | $20.23M | $6.86M | $455.00K | $8.30M | $-3.87M |
| Income Before Tax Ratio | -10.68% | 5.28% | 5.61% | 3.79% | 4.68% | 7.33% | 7.13% | 6.82% | 7.67% | 5.69% | 6.36% | 3.79% | 3.62% | 5.56% | 5.70% | 5.71% | 2.02% | 0.16% | 3.06% | -1.39% |
| Income Tax Expense | $2.18M | $768.00K | $4.86M | $1.20M | $238.00K | $2.96M | $4.35M | $4.58M | $4.58M | $4.43M | $5.07M | $3.02M | $-5.31M | $3.42M | $3.27M | $3.47M | $-1.21M | $-6.04M | $1.62M | $-762.00K |
| Net Income | $-48.85M | $22.29M | $19.04M | $13.41M | $19.47M | $26.56M | $24.08M | $25.59M | $28.76M | $19.95M | $23.25M | $14.02M | $19.68M | $18.16M | $17.87M | $16.77M | $8.07M | $6.50M | $6.68M | $-3.10M |
| Net Income Ratio | -11.18% | 5.10% | 4.47% | 3.48% | 4.62% | 6.59% | 6.04% | 5.78% | 6.62% | 4.66% | 5.22% | 3.12% | 4.96% | 4.68% | 4.82% | 4.73% | 2.37% | 2.26% | 2.46% | -1.12% |
| EPS | $-2.35 | $1.07 | $0.92 | $0.65 | $0.94 | $1.29 | $1.17 | $1.24 | $1.40 | $0.97 | $1.13 | $0.69 | $0.96 | $0.89 | $0.87 | $0.82 | $0.40 | $0.27 | $0.29 | $-0.15 |
| EPS Diluted | $-2.33 | $1.07 | $0.91 | $0.64 | $0.93 | $1.27 | $1.15 | $1.23 | $1.38 | $0.96 | $1.12 | $0.68 | $0.95 | $0.88 | $0.87 | $0.81 | $0.39 | $0.27 | $0.28 | $-0.15 |
| Weighted Average Shares Outstanding | 20.76M | 20.75M | 20.74M | 20.68M | 20.64M | 20.64M | 20.62M | 20.57M | 20.54M | 20.53M | 20.52M | 20.46M | 20.45M | 20.44M | 20.43M | 20.37M | 20.33M | 20.32M | 20.32M | 20.38M |
| Weighted Average Shares Outstanding Diluted | 20.92M | 20.92M | 20.91M | 20.97M | 20.94M | 20.91M | 20.90M | 20.89M | 20.79M | 20.78M | 20.72M | 20.72M | 20.78M | 20.66M | 20.65M | 20.63M | 20.63M | 20.59M | 20.55M | 20.38M |
| SEC Filing | Source | Source | Source | Source | Source | Source | Source | Source | Source | Source | Source | Source | Source | Source | Source | Source | Source | Source | Source | Source |
Annual Balance Sheet
| Breakdown | December 31, 2024 | December 31, 2023 | December 31, 2022 | December 31, 2021 | December 31, 2020 |
|---|---|---|---|---|---|
| Cash and Cash Equivalents | $16.71M | $13.29M | $13.10M | $14.46M | $25.88M |
| Short Term Investments | $- | $- | $3.11M | $- | $- |
| Cash and Short Term Investments | $16.71M | $13.29M | $13.10M | $14.46M | $25.88M |
| Net Receivables | $193.79M | $192.75M | $215.21M | $223.55M | $166.45M |
| Inventory | $441.30M | $441.60M | $423.08M | $361.12M | $250.78M |
| Other Current Assets | $72.42M | $61.74M | $39.06M | $28.12M | $41.79M |
| Total Current Assets | $724.22M | $709.38M | $690.45M | $627.25M | $464.00M |
| Property Plant Equipment Net | $575.25M | $572.33M | $513.01M | $472.07M | $371.77M |
| Goodwill | $263.74M | $320.87M | $319.50M | $318.62M | $144.92M |
| Intangible Assets | $109.29M | $130.97M | $143.22M | $156.74M | $54.67M |
| Goodwill and Intangible Assets | $373.03M | $451.84M | $462.72M | $475.36M | $199.59M |
| Long Term Investments | $19.00K | $558.00K | $4.75M | $2.00K | $- |
| Tax Assets | $2.96M | $4.91M | $3.27M | $5.43M | $3.13M |
| Other Non-Current Assets | $22.14M | $23.71M | $17.79M | $27.37M | $19.36M |
| Total Non-Current Assets | $973.41M | $1.05B | $1.00B | $980.23M | $593.86M |
| Other Assets | $- | $- | $- | $- | $- |
| Total Assets | $1.70B | $1.76B | $1.69B | $1.61B | $1.06B |
| Account Payables | $105.90M | $125.66M | $107.90M | $86.24M | $55.64M |
| Short Term Debt | $34.27M | $38.60M | $21.11M | $15.36M | $1.94M |
| Tax Payables | $4.91M | $5.21M | $3.93M | $4.21M | $1.90M |
| Deferred Revenue | $13.19M | $13.84M | $15.50M | $7.77M | $7.71M |
| Other Current Liabilities | $68.46M | $71.69M | $90.54M | $90.93M | $59.70M |
| Total Current Liabilities | $226.73M | $255.00M | $238.96M | $204.51M | $126.88M |
| Long Term Debt | $482.76M | $455.14M | $483.81M | $507.81M | $113.84M |
| Deferred Revenue Non-Current | $75.77M | $103.98M | $107.74M | $97.96M | $86.76M |
| Deferred Tax Liabilities Non-Current | $3.24M | $20.11M | $28.21M | $27.22M | $15.86M |
| Other Non-Current Liabilities | $40.24M | $43.45M | $33.27M | $49.54M | $58.88M |
| Total Non-Current Liabilities | $602.02M | $622.68M | $653.02M | $682.53M | $275.35M |
| Other Liabilities | $1 | $- | $- | $- | $- |
| Total Liabilities | $828.75M | $877.67M | $891.99M | $887.04M | $402.23M |
| Preferred Stock | $- | $- | $- | $- | $- |
| Common Stock | $- | $309.49M | $288.10M | $271.98M | $258.64M |
| Retained Earnings | $849.11M | $854.33M | $769.42M | $693.76M | $631.06M |
| Accumulated Other Comprehensive Income Loss | $- | $-41.03M | $-41.91M | $-40.17M | $-38.64M |
| Other Total Stockholders Equity | $19.77M | $-237.75M | $-220.86M | $-209.92M | $-195.43M |
| Total Stockholders Equity | $868.88M | $885.05M | $799.99M | $720.44M | $655.63M |
| Total Equity | $868.88M | $885.05M | $799.99M | $720.44M | $655.63M |
| Total Liabilities and Stockholders Equity | $1.70B | $1.76B | $1.69B | $1.61B | $1.06B |
| Minority Interest | $- | $- | $- | $- | $- |
| Total Liabilities and Total Equity | $1.70B | $1.76B | $1.69B | $1.61B | $1.06B |
| Total Investments | $19.00K | $558.00K | $4.75M | $2.00K | $- |
| Total Debt | $517.04M | $493.73M | $504.91M | $523.17M | $115.78M |
| Net Debt | $500.32M | $480.44M | $491.81M | $508.71M | $89.90M |
Balance Sheet Charts
| Breakdown | December 31, 2024 | September 27, 2024 | June 28, 2024 | March 29, 2024 | December 31, 2023 | September 29, 2023 | June 30, 2023 | March 31, 2023 | December 31, 2022 | September 30, 2022 | July 01, 2022 | April 01, 2022 | December 31, 2021 | October 01, 2021 | July 02, 2021 | April 02, 2021 | December 31, 2020 | September 25, 2020 | June 26, 2020 | March 27, 2020 |
|---|---|---|---|---|---|---|---|---|---|---|---|---|---|---|---|---|---|---|---|---|
| Cash and Cash Equivalents | $16.71M | $17.87M | $17.10M | $13.10M | $13.29M | $16.40M | $16.57M | $15.24M | $13.10M | $20.68M | $32.17M | $20.24M | $14.46M | $18.01M | $24.34M | $18.93M | $25.88M | $117.75M | $265.07M | $107.58M |
| Short Term Investments | $- | $- | $4.61M | $4.71M | $3.66M | $5.05M | $4.92M | $- | $3.11M | $2.80M | $1.33M | $120.00K | $- | $- | $- | $- | $- | $- | $- | $- |
| Cash and Short Term Investments | $16.71M | $17.87M | $17.10M | $13.10M | $13.29M | $16.40M | $16.57M | $15.24M | $13.10M | $20.68M | $32.17M | $20.24M | $14.46M | $18.01M | $24.34M | $18.93M | $25.88M | $117.75M | $265.07M | $107.58M |
| Net Receivables | $193.79M | $214.58M | $185.24M | $188.28M | $192.75M | $186.18M | $188.17M | $208.00M | $215.21M | $238.97M | $222.81M | $237.71M | $223.55M | $190.60M | $179.33M | $180.54M | $166.45M | $150.45M | $146.53M | $138.80M |
| Inventory | $441.30M | $476.60M | $462.96M | $466.57M | $441.60M | $452.04M | $455.34M | $434.49M | $423.08M | $420.30M | $422.38M | $386.99M | $361.12M | $311.75M | $290.74M | $272.83M | $250.78M | $211.70M | $209.85M | $204.70M |
| Other Current Assets | $72.42M | $86.31M | $73.81M | $71.75M | $61.74M | $54.97M | $37.75M | $42.13M | $39.06M | $59.42M | $59.21M | $55.94M | $28.12M | $72.28M | $44.31M | $44.90M | $41.79M | $49.03M | $35.00M | $27.70M |
| Total Current Assets | $724.22M | $795.36M | $739.12M | $739.71M | $709.38M | $709.59M | $697.83M | $699.85M | $690.45M | $709.66M | $706.97M | $672.91M | $627.25M | $556.49M | $516.57M | $494.75M | $464.00M | $504.42M | $656.44M | $478.78M |
| Property Plant Equipment Net | $575.25M | $584.93M | $588.29M | $586.50M | $572.33M | $554.58M | $553.32M | $531.91M | $513.01M | $491.82M | $492.54M | $487.79M | $472.07M | $410.99M | $408.39M | $388.90M | $371.77M | $356.91M | $288.21M | $271.44M |
| Goodwill | $263.74M | $321.15M | $319.75M | $319.94M | $320.87M | $319.44M | $320.23M | $320.27M | $319.50M | $318.57M | $319.99M | $317.90M | $318.62M | $140.99M | $142.05M | $140.39M | $144.92M | $143.12M | $70.00M | $69.83M |
| Intangible Assets | $109.29M | $124.28M | $126.02M | $129.05M | $133.56M | $134.59M | $137.94M | $140.43M | $143.22M | $145.09M | $148.36M | $152.92M | $156.74M | $49.01M | $50.85M | $51.50M | $54.67M | $54.45M | $5.73M | $5.97M |
| Goodwill and Intangible Assets | $373.03M | $445.43M | $445.77M | $449.00M | $454.44M | $454.03M | $458.17M | $460.70M | $462.72M | $463.66M | $468.36M | $470.82M | $475.36M | $190.00M | $192.91M | $191.90M | $199.59M | $197.57M | $75.73M | $75.80M |
| Long Term Investments | $-235.00K | $1.33M | $2.83M | $3.41M | $558.00K | $5.45M | $4.83M | $- | $4.75M | $5.89M | $2.89M | $3.11M | $2.00K | $- | $- | $- | $- | $- | $- | $- |
| Tax Assets | $2.96M | $4.91M | $4.78M | $4.75M | $4.91M | $3.21M | $3.25M | $3.33M | $3.27M | $4.70M | $5.02M | $5.32M | $5.43M | $1.91M | $1.91M | $1.93M | $3.13M | $5.16M | $1.67M | $1.65M |
| Other Non-Current Assets | $22.14M | $25.05M | $23.09M | $21.82M | $21.11M | $21.74M | $20.31M | $22.18M | $17.79M | $26.58M | $27.34M | $26.96M | $27.37M | $23.27M | $21.72M | $20.79M | $19.36M | $20.75M | $19.17M | $18.40M |
| Total Non-Current Assets | $973.39M | $1.06B | $1.06B | $1.07B | $1.05B | $1.04B | $1.04B | $1.02B | $1.00B | $992.66M | $996.15M | $994.00M | $980.23M | $626.17M | $624.93M | $603.52M | $593.86M | $580.39M | $384.78M | $367.29M |
| Other Assets | $19.00K | $- | $1 | $- | $- | $- | $- | $- | $- | $- | $- | $- | $- | $- | $- | $0 | $- | $- | $- | $- |
| Total Assets | $1.70B | $1.86B | $1.80B | $1.81B | $1.76B | $1.75B | $1.74B | $1.72B | $1.69B | $1.70B | $1.70B | $1.67B | $1.61B | $1.18B | $1.14B | $1.10B | $1.06B | $1.08B | $1.04B | $846.08M |
| Account Payables | $105.90M | $130.31M | $117.27M | $134.54M | $125.66M | $93.10M | $123.86M | $126.87M | $107.90M | $96.48M | $113.71M | $103.44M | $86.24M | $71.58M | $80.60M | $72.49M | $55.64M | $56.52M | $52.09M | $54.15M |
| Short Term Debt | $34.27M | $37.54M | $38.77M | $46.57M | $46.16M | $38.63M | $27.47M | $27.73M | $21.11M | $19.75M | $15.33M | $15.35M | $15.36M | $529.00K | $435.00K | $1.54M | $1.94M | $131.70M | $153.04M | $877.00K |
| Tax Payables | $4.91M | $1.17M | $1.53M | $2.08M | $5.21M | $2.00M | $2.56M | $4.67M | $3.93M | $1.54M | $1.70M | $5.62M | $4.21M | $439.00K | $4.84M | $5.10M | $1.90M | $1.44M | $1.78M | $1.39M |
| Deferred Revenue | $13.19M | $15.50M | $15.86M | $14.79M | $13.84M | $15.08M | $15.31M | $20.29M | $15.50M | $6.60M | $8.10M | $7.41M | $7.77M | $8.31M | $10.92M | $8.57M | $7.71M | $4.36M | $3.00M | $2.32M |
| Other Current Liabilities | $68.46M | $68.31M | $54.06M | $56.63M | $64.13M | $68.40M | $64.05M | $66.26M | $90.54M | $77.92M | $71.39M | $69.64M | $90.93M | $91.92M | $64.44M | $59.73M | $59.70M | $90.37M | $58.62M | $54.94M |
| Total Current Liabilities | $226.73M | $252.83M | $227.48M | $254.62M | $255.00M | $217.21M | $233.25M | $245.82M | $238.96M | $202.29M | $210.22M | $201.46M | $204.51M | $172.77M | $161.23M | $147.44M | $126.88M | $251.63M | $268.53M | $113.67M |
| Long Term Debt | $482.76M | $527.89M | $517.12M | $501.84M | $455.14M | $557.14M | $482.51M | $476.97M | $483.81M | $620.79M | $635.63M | $639.34M | $507.81M | $217.96M | $203.13M | $198.47M | $113.84M | $161.24M | $123.54M | $99.18M |
| Deferred Revenue Non-Current | $75.77M | $81.55M | $89.42M | $95.98M | $103.98M | $109.08M | $111.60M | $109.88M | $107.74M | $110.72M | $108.13M | $96.97M | $97.96M | $93.06M | $95.29M | $92.30M | $86.76M | $72.63M | $57.80M | $39.09M |
| Deferred Tax Liabilities Non-Current | $3.24M | $19.61M | $21.37M | $20.41M | $20.11M | $27.80M | $28.16M | $27.51M | $28.21M | $30.43M | $28.77M | $27.56M | $27.22M | $14.12M | $14.82M | $14.82M | $15.86M | $11.34M | $2.17M | $1.19M |
| Other Non-Current Liabilities | $40.24M | $43.24M | $41.41M | $42.42M | $43.45M | $-34.59M | $35.08M | $35.80M | $33.27M | $-28.59M | $-28.79M | $-29.39M | $49.54M | $-12.67M | $-14.67M | $-16.09M | $58.88M | $-23.80M | $-15.76M | $-3.53M |
| Total Non-Current Liabilities | $602.02M | $672.29M | $669.31M | $660.65M | $622.68M | $659.42M | $657.34M | $650.17M | $653.02M | $733.36M | $743.74M | $734.48M | $682.53M | $312.46M | $298.57M | $289.50M | $275.35M | $221.41M | $167.75M | $135.93M |
| Other Liabilities | $1 | $- | $- | $- | $- | $- | $- | $- | $- | $- | $- | $- | $- | $- | $- | $- | $- | $- | $- | $- |
| Total Liabilities | $828.75M | $925.12M | $896.79M | $915.26M | $877.67M | $876.63M | $890.59M | $895.99M | $891.99M | $935.65M | $953.96M | $935.94M | $887.04M | $485.23M | $459.80M | $436.94M | $402.23M | $473.03M | $436.28M | $249.60M |
| Preferred Stock | $- | $- | $- | $565.43M | $- | $- | $- | $- | $- | $- | $- | $- | $- | $- | $- | $- | $- | $- | $- | $- |
| Common Stock | $- | $331.65M | $328.84M | $324.49M | $309.49M | $306.59M | $303.39M | $297.80M | $288.10M | $284.02M | $281.30M | $278.59M | $271.98M | $269.72M | $268.20M | $264.94M | $258.64M | $257.02M | $256.76M | $253.97M |
| Retained Earnings | $- | $900.76M | $881.28M | $865.04M | $854.33M | $837.60M | $813.79M | $792.42M | $769.42M | $743.28M | $725.92M | $705.25M | $693.76M | $676.53M | $660.85M | $645.47M | $631.06M | $592.98M | $588.80M | $584.50M |
| Accumulated Other Comprehensive Income Loss | $- | $-47.82M | $-44.45M | $-49.32M | $-41.03M | $-40.83M | $-39.44M | $-41.63M | $-41.91M | $-46.58M | $-44.62M | $-40.19M | $-40.17M | $-44.55M | $-43.08M | $-46.09M | $-38.64M | $-42.78M | $-45.57M | $-47.17M |
| Other Total Stockholders Equity | $- | $-252.69M | $-258.58M | $-250.29M | $-237.75M | $-231.40M | $-236.42M | $-226.60M | $-215.62M | $-214.05M | $-213.44M | $-212.69M | $-209.92M | $-204.26M | $-204.27M | $-202.99M | $-195.43M | $-195.44M | $-195.05M | $-194.82M |
| Total Stockholders Equity | $868.88M | $931.89M | $907.09M | $889.92M | $885.05M | $871.97M | $847.12M | $821.99M | $799.99M | $766.68M | $749.15M | $730.96M | $720.44M | $697.43M | $681.70M | $661.34M | $655.63M | $611.78M | $604.94M | $596.48M |
| Total Equity | $868.88M | $931.89M | $907.09M | $889.92M | $885.05M | $871.97M | $847.12M | $821.99M | $799.99M | $766.68M | $749.15M | $730.96M | $720.44M | $697.43M | $681.70M | $661.34M | $655.63M | $611.78M | $604.94M | $596.48M |
| Total Liabilities and Stockholders Equity | $1.70B | $1.86B | $1.80B | $1.81B | $1.76B | $1.75B | $1.74B | $1.72B | $1.69B | $1.70B | $1.70B | $1.67B | $1.61B | $1.18B | $1.14B | $1.10B | $1.06B | $1.08B | $1.04B | $846.08M |
| Minority Interest | $- | $- | $- | $- | $- | $- | $- | $- | $- | $- | $- | $- | $- | $- | $- | $- | $- | $- | $- | $- |
| Total Liabilities and Total Equity | $1.70B | $1.86B | $1.80B | $1.81B | $1.76B | $1.75B | $1.74B | $1.72B | $1.69B | $1.70B | $1.70B | $1.67B | $1.61B | $1.18B | $1.14B | $1.10B | $1.06B | $1.08B | $1.04B | $846.08M |
| Total Investments | $-19.00K | $1.33M | $2.83M | $3.41M | $558.00K | $5.45M | $4.83M | $- | $4.75M | $5.89M | $4.22M | $3.23M | $2.00K | $- | $- | $- | $- | $- | $- | $- |
| Total Debt | $517.04M | $565.43M | $555.88M | $548.41M | $501.29M | $528.38M | $509.98M | $504.70M | $504.91M | $567.28M | $574.13M | $574.93M | $523.17M | $149.03M | $131.42M | $126.48M | $115.78M | $206.02M | $214.81M | $51.03M |
| Net Debt | $500.32M | $547.56M | $538.79M | $535.30M | $488.00M | $511.98M | $493.40M | $489.46M | $491.81M | $546.60M | $541.96M | $554.70M | $508.71M | $131.02M | $107.07M | $107.54M | $89.90M | $88.27M | $-50.26M | $-56.55M |
Annual Cash Flow
| Breakdown | December 31, 2024 | December 31, 2023 | December 31, 2022 | December 31, 2021 | December 31, 2020 |
|---|---|---|---|---|---|
| Net Income | $5.89M | $95.70M | $85.99M | $72.47M | $15.46M |
| Depreciation and Amortization | $68.68M | $61.64M | $53.44M | $44.29M | $53.27M |
| Deferred Income Tax | $-16.60M | $-7.00M | $1.73M | $-12.96M | $-9.85M |
| Stock Based Compensation | $10.56M | $10.09M | $8.81M | $6.52M | $5.53M |
| Change in Working Capital | $- | $-16.57M | $-34.80M | $-23.95M | $35.48M |
| Accounts Receivables | $-3.72M | $23.36M | $-4.38M | $-30.49M | $-707.00K |
| Inventory | $-468.00K | $- | $-63.99M | $-43.46M | $-1.29M |
| Accounts Payables | $-15.76M | $6.63M | $12.86M | $40.22M | $-21.88M |
| Other Working Capital | $- | $-46.56M | $20.70M | $9.78M | $59.36M |
| Other Non Cash Items | $19.29M | $556.00K | $790.00K | $3.86M | $1.17M |
| Net Cash Provided by Operating Activities | $87.82M | $144.41M | $115.96M | $90.24M | $101.06M |
| Investments in Property Plant and Equipment | $-80.81M | $-119.88M | $-77.61M | $-102.91M | $-67.27M |
| Acquisitions Net | $- | $- | $-2.97M | $-392.24M | $-130.72M |
| Purchases of Investments | $- | $- | $- | $- | $-3.22M |
| Sales Maturities of Investments | $- | $- | $- | $- | $3.25M |
| Other Investing Activities | $1.20M | $654.00K | $850.00K | $881.00K | $3.25M |
| Net Cash Used for Investing Activities | $-79.61M | $-119.22M | $-79.73M | $-494.27M | $-194.71M |
| Debt Repayment | $14.67M | $-8.99M | $-21.80M | $413.42M | $11.15M |
| Common Stock Issued | $- | $- | $3.59M | $3.32M | $- |
| Common Stock Repurchased | $- | $-5.23M | $-3.59M | $-3.32M | $-6.77M |
| Dividends Paid | $-11.09M | $-10.62M | $-10.16M | $-9.70M | $-9.26M |
| Other Financing Activities | $-7.77M | $-5.23M | $-3.59M | $-10.72M | $-2.22M |
| Net Cash Used Provided by Financing Activities | $-4.19M | $-24.85M | $-35.56M | $393.01M | $-7.09M |
| Effect of Forex Changes on Cash | $-607.00K | $-149.00K | $-2.03M | $-394.00K | $1.61M |
| Net Change in Cash | $3.42M | $193.00K | $-1.36M | $-11.42M | $-99.13M |
| Cash at End of Period | $16.71M | $13.29M | $13.10M | $14.46M | $25.88M |
| Cash at Beginning of Period | $13.29M | $13.10M | $14.46M | $25.88M | $125.01M |
| Operating Cash Flow | $87.82M | $144.41M | $115.96M | $90.24M | $101.06M |
| Capital Expenditure | $-80.81M | $-119.88M | $-77.61M | $-102.91M | $-67.27M |
| Free Cash Flow | $7.01M | $24.54M | $38.35M | $-12.67M | $33.78M |
Cash Flow Charts
| Breakdown | December 31, 2024 | September 27, 2024 | June 28, 2024 | March 29, 2024 | December 31, 2023 | September 29, 2023 | June 30, 2023 | March 31, 2023 | December 31, 2022 | September 30, 2022 | July 01, 2022 | April 01, 2022 | December 31, 2021 | October 01, 2021 | July 02, 2021 | April 02, 2021 | December 31, 2020 | September 25, 2020 | June 26, 2020 | March 27, 2020 |
|---|---|---|---|---|---|---|---|---|---|---|---|---|---|---|---|---|---|---|---|---|
| Net Income | $-48.85M | $22.29M | $19.04M | $13.41M | $19.47M | $26.56M | $24.08M | $25.59M | $28.76M | $19.95M | $23.25M | $14.02M | $19.68M | $18.16M | $17.87M | $16.77M | $5.39M | $6.50M | $6.68M | $-3.10M |
| Depreciation and Amortization | $- | $18.59M | $16.51M | $16.18M | $15.12M | $15.08M | $16.30K | $- | $14.19M | $2.40K | $12.89M | $13.18M | $11.81M | $13.41M | $10.46M | $8.60M | $10.36M | $8.52M | $9.34M | $25.04M |
| Deferred Income Tax | $-16.59M | $-935.00K | $1.18M | $-253.00K | $-6.86M | $17.00K | $-114.00K | $-52.00K | $-92.00K | $-141.00K | $1.56M | $401.00K | $-12.69M | $-630.00K | $-15.00K | $382.00K | $-4.66M | $-4.95M | $993.00K | $-1.23M |
| Stock Based Compensation | $2.85M | $2.38M | $2.84M | $2.50M | $2.51M | $2.54M | $2.79M | $2.25M | $2.82M | $2.30M | $2.00M | $1.70M | $1.59M | $1.41M | $2.04M | $1.47M | $1.54M | $23.00K | $2.47M | $1.49M |
| Change in Working Capital | $39.27M | $-31.24M | $-19.71M | $-46.07M | $30.39M | $-25.87M | $-13.86M | $-677.00K | $42.23M | $-24.75M | $-6.46M | $-45.83M | $27.99M | $-38.18M | $-1.94M | $-11.81M | $1.68M | $36.44M | $15.48M | $-18.12M |
| Accounts Receivables | $18.20M | $-27.20M | $2.54M | $2.73M | $-4.47M | $946.00K | $19.35M | $7.54M | $16.59M | $-18.40M | $12.48M | $-15.04M | $-4.45M | $-12.10M | $1.76M | $-15.70M | $-14.61M | $8.57M | $-5.72M | $11.05M |
| Inventory | $33.75M | $-9.90M | $2.23M | $-26.54M | $12.17M | $5.58M | $-24.37M | $-12.08M | $846.00K | $2.47M | $-39.17M | $-28.13M | $18.89M | $-21.70M | $-17.43M | $-23.22M | $8.60M | $10.70M | $-3.86M | $-16.72M |
| Accounts Payables | $-19.46M | $24.57M | $-15.67M | $-5.19M | $32.16M | $-14.95M | $-8.68M | $-1.90M | $14.64M | $-10.68M | $13.07M | $-4.18M | $25.36M | $-13.54M | $9.18M | $19.22M | $-12.12M | $-2.12M | $5.37M | $-13.00M |
| Other Working Capital | $6.79M | $-18.71M | $-8.82M | $-17.07M | $-9.47M | $-17.45M | $-162.00K | $5.77M | $10.15M | $1.86M | $7.17M | $1.53M | $-11.82M | $9.16M | $4.56M | $7.88M | $19.81M | $19.29M | $19.69M | $557.00K |
| Other Non Cash Items | $99.57M | $-6.01M | $47.19M | $64.30M | $-728.00K | $-4.34M | $19.50M | $11.00M | $-6.15M | $15.42M | $2.47M | $2.22M | $13.15M | $15.70M | $10.66M | $8.64M | $17.66M | $5.01M | $1.68M | $30.09M |
| Net Cash Provided by Operating Activities | $76.25M | $5.09M | $20.28M | $-13.80M | $59.91M | $13.98M | $32.42M | $38.10M | $81.75M | $12.79M | $35.72M | $-14.30M | $49.72M | $-3.55M | $28.61M | $15.45M | $21.61M | $43.01M | $27.30M | $9.13M |
| Investments in Property Plant and Equipment | $-19.70M | $-12.32M | $-22.14M | $-26.65M | $-25.30M | $-31.49M | $-33.07M | $-30.01M | $-23.37M | $-16.51M | $-18.75M | $-18.98M | $-25.27M | $-19.93M | $-26.46M | $-31.25M | $-20.99M | $-14.25M | $-17.25M | $-14.79M |
| Acquisitions Net | $- | $- | $179.00K | $348.00K | $237.00K | $8.00K | $197.00K | $- | $23.00K | $722.00K | $-2.88M | $11.00K | $-392.24M | $83.00K | $28.00K | $575.00K | $- | $-130.72M | $- | $- |
| Purchases of Investments | $- | $- | $- | $- | $- | $- | $- | $- | $- | $- | $- | $- | $- | $- | $- | $- | $- | $- | $- | $- |
| Sales Maturities of Investments | $- | $- | $- | $- | $- | $- | $- | $- | $- | $- | $- | $- | $- | $- | $- | $- | $- | $- | $- | $- |
| Other Investing Activities | $642.00K | $34.00K | $179.00K | $348.00K | $237.00K | $8.00K | $197.00K | $212.00K | $23.00K | $722.00K | $94.00K | $11.00K | $195.00K | $83.00K | $28.00K | $575.00K | $-2.00K | $-127.46M | $23.00K | $10.00K |
| Net Cash Used for Investing Activities | $-19.06M | $-12.29M | $-21.96M | $-26.30M | $-25.06M | $-31.48M | $-32.88M | $-29.80M | $-23.35M | $-15.78M | $-21.63M | $-18.97M | $-417.31M | $-19.84M | $-26.43M | $-30.68M | $-20.99M | $-141.72M | $-17.22M | $-14.78M |
| Debt Repayment | $-53.13M | $9.70M | $9.09M | $49.00M | $-35.77M | $20.48M | $6.40M | $-106.00K | $-63.79M | $-4.35M | $1.80M | $44.54M | $374.37M | $19.72M | $5.43M | $13.90M | $-91.05M | $-46.74M | $149.32M | $-375.00K |
| Common Stock Issued | $- | $- | $- | $- | $- | $229.00K | $1.26M | $- | $537.00K | $244.00K | $- | $- | $- | $- | $- | $- | $- | $- | $- | $- |
| Common Stock Repurchased | $- | $6.40M | $-389.00K | $-6.01M | $-133.00K | $-229.00K | $-1.26M | $- | $-537.00K | $-244.00K | $-95.00K | $-2.72M | $-285.00K | $-12.00K | $-183.00K | $-2.84M | $-9.00K | $-187.00K | $-10.00K | $-6.77M |
| Dividends Paid | $-2.79M | $-2.80M | $-2.80M | $-2.69M | $-2.68M | $-2.68M | $-2.68M | $-2.57M | $-2.58M | $-2.47M | $-2.59M | $-2.52M | $-2.45M | $-2.45M | $-2.45M | $-2.34M | $-2.34M | $-2.34M | $-2.34M | $-2.25M |
| Other Financing Activities | $-1.19M | $-173.00K | $-389.00K | $-6.01M | $-133.00K | $-229.00K | $-1.26M | $-3.61M | $-537.00K | $-244.00K | $-95.00K | $-2.72M | $-7.69M | $-12.00K | $-183.00K | $-2.84M | $-9.00K | $-187.00K | $-10.00K | $-2.02M |
| Net Cash Used Provided by Financing Activities | $-57.11M | $6.73M | $5.90M | $40.30M | $-38.59M | $17.57M | $2.46M | $-6.29M | $-66.91M | $-7.07M | $-887.00K | $39.30M | $364.23M | $17.26M | $2.79M | $8.73M | $-93.40M | $-49.27M | $146.97M | $-11.40M |
| Effect of Forex Changes on Cash | $-1.24M | $1.25M | $-230.00K | $-383.00K | $631.00K | $-243.00K | $-667.00K | $130.00K | $921.00K | $-1.43M | $-1.26M | $-260.00K | $-182.00K | $-201.00K | $435.00K | $-446.00K | $898.00K | $658.00K | $437.00K | $-381.00K |
| Net Change in Cash | $-1.16M | $776.00K | $3.99M | $-190.00K | $-3.11M | $-173.00K | $1.33M | $2.14M | $-7.58M | $-11.49M | $11.94M | $5.78M | $-3.55M | $-6.34M | $5.41M | $-6.94M | $-91.88M | $-147.31M | $157.49M | $-17.43M |
| Cash at End of Period | $16.71M | $17.87M | $17.10M | $13.10M | $13.29M | $16.40M | $16.57M | $15.24M | $13.10M | $20.68M | $32.17M | $20.24M | $14.46M | $18.01M | $24.34M | $18.93M | $25.88M | $117.75M | $265.07M | $107.58M |
| Cash at Beginning of Period | $17.87M | $17.10M | $13.10M | $13.29M | $16.40M | $16.57M | $15.24M | $13.10M | $20.68M | $32.17M | $20.24M | $14.46M | $18.01M | $24.34M | $18.93M | $25.88M | $117.75M | $265.07M | $107.58M | $125.01M |
| Operating Cash Flow | $76.25M | $5.09M | $20.28M | $-13.80M | $59.91M | $13.98M | $32.42M | $38.10M | $81.75M | $12.79M | $35.72M | $-14.30M | $49.72M | $-3.55M | $28.61M | $15.45M | $21.61M | $43.01M | $27.30M | $9.13M |
| Capital Expenditure | $-19.70M | $-12.32M | $-22.14M | $-26.65M | $-25.30M | $-31.49M | $-33.07M | $-30.01M | $-23.37M | $-16.51M | $-18.75M | $-18.98M | $-25.27M | $-19.93M | $-26.46M | $-31.25M | $-20.99M | $-14.25M | $-17.25M | $-14.79M |
| Free Cash Flow | $56.55M | $-7.23M | $-1.86M | $-40.45M | $34.61M | $-17.51M | $-655.00K | $8.09M | $58.38M | $-3.72M | $16.97M | $-33.28M | $24.45M | $-23.48M | $2.15M | $-15.80M | $624.00K | $28.76M | $10.06M | $-5.66M |
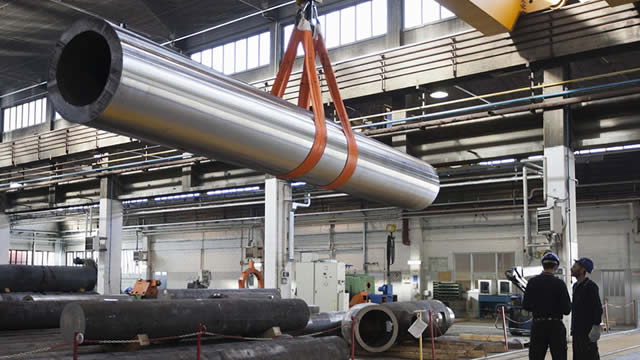
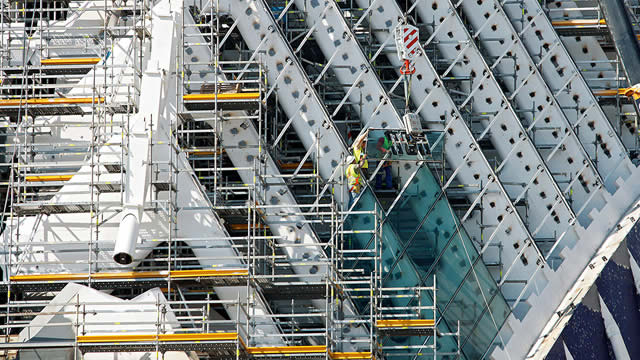
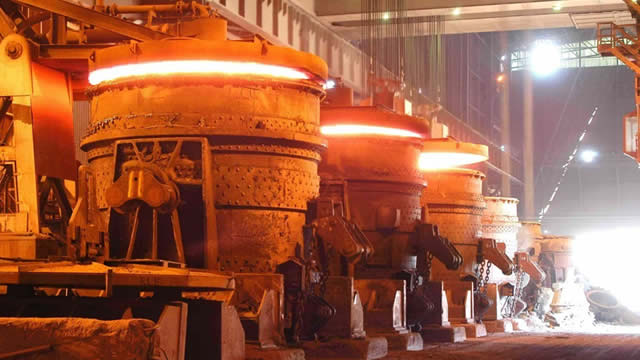
Materion Corporation, through with its subsidiaries, produces advanced engineered materials used in semiconductor, industrial, aerospace and defense, automotive, energy, consumer electronics, and telecom and data center in the United States, Asia, Europe, and internationally. It operates through Performance Alloys and Composites, Advanced Materials, and Precision Optics segments. The Performance Alloys and Composites segment offers advanced engineered solutions comprising beryllium and non-beryllium containing alloy systems and custom engineered parts in strip, bulk, rod, plate, bar, tube, and other customized shapes. This segment operates the bertrandite ore mine and refinery located in Utah that provides feedstock hydroxide for its beryllium businesses and external sale. The Advances Materials segment produces advanced chemicals, microelectronics packaging, precious metal, non-precious metal, and specialty metal products, including vapor deposition targets, frame lid assemblies, clad and precious metal pre-forms, high temperature braze materials, and ultra-pure wire. This segment offers its products from its facilities, as well as through direct sales offices and independent sales representatives. The Precision Optics segment designs and produces precision thin film coatings, optical filters, and assemblies. This segment sells its directly from its facilities, as well as through direct sales offices and independent sales representatives throughout the world. The company was formerly known as Brush Engineered Materials Inc. and changed its name to Materion Corporation in 2011. Materion Corporation was incorporated in 1931 and is headquartered in Mayfield Heights, Ohio.
$83.01
Stock Price
$1.73B
Market Cap
3.04K
Employees
Mayfield Heights, OH
Location
Revenue (FY 2024)
$1.68B
1.2% YoY
Net Income (FY 2024)
$5.89M
-93.8% YoY
EPS (FY 2024)
$0.28
-93.9% YoY
Free Cash Flow (FY 2024)
$7.01M
-71.4% YoY
Profitability
Gross Margin
19.3%
Net Margin
0.3%
ROE
0.7%
ROA
0.3%
Valuation
P/E Ratio
348.16
P/S Ratio
1.22
EV/EBITDA
22.48
Market Cap
$1.73B
Revenue & Net Income
Profit Margins
Cash Flow Summary
Operating Cash Flow
$87.82M
-39.2% YoY
Free Cash Flow
$7.01M
-71.4% YoY
Balance Sheet Summary
Total Assets
$1.70B
-3.7% YoY
Total Debt
$517.04M
4.7% YoY
Shareholder Equity
$868.88M
-2.4% YoY
Dividend Overview
$0.14
Latest Dividend
%
Dividend Yield
%
Payout Ratio
Recent Dividend History
| Date | Amount | Type |
|---|---|---|
| 2025-02-20 | $0.14 | February 20, 25 |
| 2024-11-14 | $0.14 | November 14, 24 |
| 2024-08-23 | $0.14 | August 23, 24 |
| 2024-05-22 | $0.14 | May 22, 24 |
| 2024-02-21 | $0.13 | February 21, 24 |
| 2023-11-15 | $0.13 | November 15, 23 |
| 2023-08-24 | $0.13 | August 24, 23 |
| 2023-05-30 | $0.13 | May 30, 23 |
| 2023-02-22 | $0.13 | February 22, 23 |
| 2022-11-15 | $0.13 | November 15, 22 |
Materion Dividends
Explore Materion's dividend history, including dividend yield, payout ratio, and historical payments.
Dividend Yield
0.54%
Dividend Payout Ratio
188.30%
Dividend Paid & Capex Coverage Ratio
0.96x
Materion Dividend History
| Dividend | Adjusted Dividend | Date | Record Date | Payment Date | Declaration Date |
|---|---|---|---|---|---|
| $0.135 | $0.135 | February 20, 2025 | February 20, 2025 | March 07, 2025 | January 29, 2025 |
| $0.135 | $0.135 | November 14, 2024 | November 14, 2024 | December 06, 2024 | October 23, 2024 |
| $0.135 | $0.135 | August 23, 2024 | August 23, 2024 | September 06, 2024 | August 08, 2024 |
| $0.135 | $0.135 | May 22, 2024 | May 23, 2024 | June 07, 2024 | May 09, 2024 |
| $0.13 | $0.13 | February 21, 2024 | February 22, 2024 | March 08, 2024 | January 31, 2024 |
| $0.13 | $0.13 | November 15, 2023 | November 16, 2023 | December 08, 2023 | October 25, 2023 |
| $0.13 | $0.13 | August 24, 2023 | August 25, 2023 | September 07, 2023 | August 09, 2023 |
| $0.13 | $0.13 | May 30, 2023 | May 31, 2023 | June 15, 2023 | May 17, 2023 |
| $0.125 | $0.125 | February 22, 2023 | February 23, 2023 | March 10, 2023 | February 01, 2023 |
| $0.125 | $0.125 | November 15, 2022 | November 16, 2022 | December 08, 2022 | October 28, 2022 |
| $0.125 | $0.125 | August 23, 2022 | August 24, 2022 | September 08, 2022 | August 11, 2022 |
| $0.125 | $0.125 | May 26, 2022 | May 27, 2022 | June 16, 2022 | May 04, 2022 |
| $0.12 | $0.12 | February 24, 2022 | February 24, 2022 | March 11, 2022 | February 01, 2022 |
| $0.12 | $0.12 | November 10, 2021 | November 12, 2021 | December 03, 2021 | October 28, 2021 |
| $0.12 | $0.12 | August 19, 2021 | August 20, 2021 | September 03, 2021 | August 05, 2021 |
| $0.12 | $0.12 | May 26, 2021 | May 27, 2021 | June 11, 2021 | May 06, 2021 |
| $0.115 | $0.115 | February 16, 2021 | February 17, 2021 | March 05, 2021 | February 04, 2021 |
| $0.115 | $0.115 | November 04, 2020 | November 05, 2020 | November 30, 2020 | October 22, 2020 |
| $0.115 | $0.115 | August 17, 2020 | August 18, 2020 | September 04, 2020 | August 03, 2020 |
| $0.115 | $0.115 | May 28, 2020 | May 29, 2020 | June 10, 2020 | May 14, 2020 |
Materion News
Read the latest news about Materion, including recent articles, headlines, and updates.
Materion Corporation Reports First Quarter 2025 Financial Results
MAYFIELD HEIGHTS, Ohio--(BUSINESS WIRE)--Materion Corporation (NYSE: MTRN) today reported first quarter 2025 financial results and provided an update to the full year outlook. Financial Summary Net sales were $420.3 million; value-added sales1 were $259.3 million Net income of $17.7 million, or $0.85 per share, diluted, versus net income of $13.4 million, or $0.64 per share, in the prior year quarter; adjusted earnings of $1.13 per share versus $0.96 in the prior year quarter Operating profit o.

Materion's Advanced Materials Selected for New U.S. Army Tiltrotor Aircraft Prototypes
CLEVELAND--(BUSINESS WIRE)--Materion Corporation (NYSE: MTRN), a global leader in advanced materials solutions, will supply its SupremEX® metal matrix composite for components on the U.S. Army Future Long-Range Assault Aircraft (FLRAA) prototypes. The high-strength, lightweight composite was selected by Bell Textron Inc., a Textron Inc. company, which designed the FLRAA configuration and will build the prototypes. The new tiltrotor model can reach greater speeds and carry increased payloads of.

Rockland Resources Begins Trading on OTCQB (BERLF) and Frankfurt Exchange (GB2)
Vancouver, British Columbia – TheNewswire - April 22, 2025, Rockland Resources Ltd. (the “Company” or "Rockland") ( CSE: RKL ) ( OTCQB: BERLF ) ( FSE: GB2) , announces common shares in the Company have successfully begun trading on the OTCQB Venture Market in the United States under the new trading symbol BERLF, as well as on the Frankfurt Stock Exchange under the symbol GB2, effective immediately. The company will continue to trade on the Canadian Securities Exchange. Mike England, Rockland CEO states, “Listing Rockland's common shares on both the OTCQB and the Frankfurt Stock Exchange significantly expands our visibility and accessibility to a broader investor base. These listings provide valuable exposure to U.S. and European markets, allowing us to engage with a vastly increased audience of institutional and retail investors.”

Materion Corporation to Announce First Quarter 2025 Financial Results on May 1
MAYFIELD HEIGHTS, Ohio--(BUSINESS WIRE)--Materion Corporation (NYSE: MTRN) is scheduled to release its first quarter 2025 financial results on May 1, 2025, before the opening of the New York Stock Exchange. The company will hold a conference call with investors at 10:00 AM ET that morning. Jugal Vijayvargiya, President and Chief Executive Officer, and Shelly Chadwick, Vice President, Finance and Chief Financial Officer, will represent Materion Corporation on the call. Conference Call and Slide.

Rockland Expands Critical Minerals Position with New Beryllium and Tungsten Claims at Meteor Project in Utah
Applauds President Trump's Executive Order to Ensure National Security through the Assessment of and Securing of Domestic Critical Minerals Vancouver, British Columbia – TheNewswire - April 17 th , 2025, Rockland Resources Ltd. (the “Company” or "Rockland") (CSE: RKL) (OTCQB: BERLF), announces the acquisition of the Meteor Beryllium and Tungsten Project, located 25 kilometres west of the Company's keystone Beryllium Butte project in Juab County, Utah. The project comprises 28 unpatented mining claims covering 525.2 acres (212.5 ha) that include the historic East Apex Mine, Hornet Mine, Eastern Trout Creek Mine, and the MacMillan and Meteor Prospects. An image showing the location of the Meteor Project relative to the other beryllium assets of Rockland is shown below.

Rockland Announces New Board Member
Vancouver, British Columbia – TheNewswire - April 15 th , 2025 - Rockland Resources Ltd. (the “Company” or "Rockland") ( CSE: RKL ) ( OTCQB: BERLF ), is pleased to announce the addition of Tracy Hughes to the Board of Directors. Ms. Hughes is a seasoned entrepreneur and influential capital markets leader with over 30 years of professional experience. Tracy founded and serves as Executive Director of the Critical Minerals Institute (CMI), an influential think-tank known for its weekly Technology Metals Report and annual CMI Summit, which fosters collaboration and strategic alignment among industry leaders and policymakers worldwide. She also serves as Founder, CEO, and Director of InvestorNews Inc. (1) a premier digital media platform that attracts over 120 million annual hits and has worked with thousands of publicly traded companies across North America, Australia, and the United Kingdom. Ms. Hughes leverages extensive expertise gained from previous roles, including co-founding REE Stocks PLC, a FTSE-recognized rare earth indices company, and serving as a principal partner at boutique investment bank Weslosky & Cowans Ltd. Tracy is widely recognized for advancing innovation and strategic partnerships within the global investment community.

Rockland Resources Announces Advisor Chris Dorn as Incoming Chair of the BHSC and Reports on the International Beryllium Meetings Recently Held in Cobourg, Ontario
Vancouver, British Columbia, April 11, 2025 – TheNewswire - Rockland Resources Ltd. (the “Company” or "Rockland") ( CSE: RKL )( OTCQB:BERLF ), is pleased to report on its experience at the Beryllium Health and Safety Committee (BHSC) Meeting that was held March 25-26 th in Cobourg, Ontario. These international meetings are held semi-annually and focus on the safe handling and use of beryllium, including future applications in the clean energy sector. Representatives of Rockland in attendance included Mr. Chris Dorn, the incoming Chair of the BHSC and a member of the Rockland Advisory Board ( see news release, March 3, 2025 ). Mr. Dorn states “The BHSC 2025 Spring Meeting had over 110 in-person and virtual participants from across the world. Beryllium will play an increasingly important role in the development of clean energy, and the BHSC is committed to ensuring that its future applications happen in a safe and responsible way. As the incoming Chair of the BHSC, and as an Advisor to Rockland, I am excited to be a part of that process for beryllium, from its discovery in the ground to its ultimate use for a safer and more energy efficient world.”

Rockland Resources Acquires the Claybank Beryllium Project Near the Spor Mountain Beryllium Mine
Vancouver, British Columbia – TheNewswire - March 25, 2025, Rockland Resources Ltd. (the “Company” or "Rockland") ( CSE: RKL ), is pleased to announce the acquisition of the Claybank Beryllium Project in Juab County, Utah, located five kilometers northeast of Spor Mountain, the largest global beryllium producer operated by Materion Corp. (NYSE: MTRN) (1) . Claybank connects via a 4.5km spur to the paved Brush Highway that is used to ship ore from Spor Mountain's mining operations to their treatment plant located 15 kilometers northeast of Delta, Utah. The location of Claybank relative to Spor Mountain and to Rockland's Beryllium Butte Project is provided below. Click Image To View Full Size

Materion Looking Toward The Early Stages Of A Multi-Market Recovery In 2025 (Rating Upgrade)
Materion has faced two years of revenue and margin pressure from broad end-market weakness, but margins have proven resilient and volumes should start to improve in 2025. The overall outlook for 2025 is still uncertain, but aerospace/defense and semiconductor markets present strong growth opportunities, while industrial markets should also show some improvement. Auto and energy markets could disappoint in 2025, and destocking in clad strips will be a headwind for revenue and margins.
Materion Corporation to Hold Annual Shareholder's Meeting May 7
MAYFIELD HEIGHTS, Ohio--(BUSINESS WIRE)--Materion Corporation (NYSE: MTRN) will hold its annual shareholder's meeting (the Annual Meeting) on May 7, 2025, at 8 a.m. EDT at the Atlanta Airport Marriott Gateway, 2020 Convention Center Concourse, Atlanta, Georgia. About Materion Materion Corporation is a global leader in advanced materials solutions for high-performance industries including semiconductor, industrial, aerospace & defense, energy and automotive. With nearly 100 years of expertis.


Materion Corporation Reports Fourth Quarter and Full-Year 2024 Results, Provides 2025 Outlook and Establishes New Mid-Term Profitability Target
MAYFIELD HEIGHTS, Ohio--(BUSINESS WIRE)--Materion Corporation (NYSE: MTRN) today reported fourth quarter and full-year 2024 financial results, provided 2025 earnings guidance and announced a new mid-term profitability target. Fourth Quarter 2024 Financial Summary Net sales were $436.9 million; value-added sales1 were $296.1 million Net loss of $48.8 million, or $2.33 loss per share, diluted, versus net income of $19.5 million, or $0.93 per share, in the prior year quarter; record quarterly adju.

Materion (MTRN) Q4 Earnings Preview: What You Should Know Beyond the Headline Estimates
Get a deeper insight into the potential performance of Materion (MTRN) for the quarter ended December 2024 by going beyond Wall Street's top -and-bottom-line estimates and examining the estimates for some of its key metrics.

Materion Corporation to Announce Fourth Quarter and Full Year 2024 Financial Results on February 19
MAYFIELD HEIGHTS, Ohio--(BUSINESS WIRE)--Materion Corporation (NYSE: MTRN) is scheduled to release its fourth quarter and full year 2024 financial results on February 19, 2025, before the opening of the New York Stock Exchange. The company will hold a conference call with investors at 10:00 AM ET that morning. Jugal Vijayvargiya, President and Chief Executive Officer, and Shelly Chadwick, Vice President, Finance and Chief Financial Officer, will represent Materion Corporation on the call. Confe.

Materion Corporation Declares Quarterly Cash Dividend
MAYFIELD HEIGHTS, Ohio--(BUSINESS WIRE)--Materion Corporation (NYSE: MTRN) announced today that its Board of Directors declared a first-quarter 2025 dividend of $0.135 per share of common stock. The dividend is payable on March 7, 2025, to shareholders of record at the close of business on February 20, 2025. About Materion Materion Corporation is a global leader in advanced materials solutions for high-performance industries including semiconductor, industrial, aerospace & defense, energy a.

Materion Corporation (MTRN) Q3 2024 Earnings Call Transcript
Materion Corporation (NYSE:MTRN ) Q3 2024 Earnings Conference Call October 30, 2024 10:00 AM ET Company Participants Kyle Kelleher - Manager, IR Jugal Vijayvargiya - President & CEO Shelly Chadwick - VP & CFO Conference Call Participants Mike Harrison - Seaport Research Partners Daniel Moore - CJS Securities Philip Gibbs - KeyBanc Capital Markets Kevin Holder - CL King David Storms - Stonegate Operator Welcome to the Materion Third Quarter 2024 Earnings Conference Call. [Operator Instructions].


Materion Corporation Reports Third Quarter 2024 Financial Results
MAYFIELD HEIGHTS, Ohio--(BUSINESS WIRE)--Materion Corporation (NYSE: MTRN) today reported third quarter 2024 financial results. Financial Summary Net sales were $436.7 million; value-added sales1 were $263.8 million Net income was $22.3 million, or $1.07 per share, diluted; adjusted earnings of $1.41 per share Operating profit of $31.3 million; record third quarter adjusted EBITDA2 of $56.7 million versus $55.4 million in the prior year quarter Business Highlights Delivered record quarterly adj.

Materion Corporation to Announce Third Quarter 2024 Financial Results on October 30
MAYFIELD HEIGHTS, Ohio--(BUSINESS WIRE)--Materion Corporation (NYSE: MTRN) is scheduled to release its third quarter 2024 financial results on October 30, 2024, before the opening of the New York Stock Exchange. The company will hold a conference call with investors at 10:00 AM ET that morning. Jugal Vijayvargiya, President and Chief Executive Officer, and Shelly Chadwick, Vice President, Finance and Chief Financial Officer, will represent Materion Corporation on the call. Conference Call and S.

Rockland Resources Looks to Drill the Permitted Beryllium Butte Project, Utah
VANCOUVER, BC / ACCESSWIRE / October 8, 2024 / Rockland Resources Ltd. (the "Company" or "Rockland") (CSE:RKL) is pleased to announce it has received drill permits for its Beryllium Butte Project located in Juab County, Utah.


Materion Names Jason Moore President of Precision Optics Business
MAYFIELD HEIGHTS, Ohio--(BUSINESS WIRE)--Materion Corporation (NYSE: MTRN), a global leader in advanced materials solutions, announced today the appointment of Jason Moore as President of Precision Optics. In this role, Jason will lead the Precision Optics business segment, which produces customized optical and thin-film coatings and components that enable advances across several megatrend-aligned industries including space and defense, life sciences, industrial, semiconductor and automotive. M.

Similar Companies
Related Metrics
Explore detailed financial metrics and analysis for MTRN.