BlackRock Municipal Income Fund Key Executives
This section highlights BlackRock Municipal Income Fund's key executives, including their titles and compensation details.
Find Contacts at BlackRock Municipal Income Fund
(Showing 0 of )
BlackRock Municipal Income Fund Earnings
This section highlights BlackRock Municipal Income Fund's earnings, including key dates, EPS, earnings reports, and earnings call transcripts.
Next Earnings Date
Last Earnings Results
Earnings Call Transcripts
| Transcript | Quarter | Year | Date | Estimated EPS | Actual EPS |
|---|

BlackRock Muni Intermediate Duration Fund, Inc. is a closed ended fixed income mutual fund launched by BlackRock, Inc. It is managed by BlackRock Advisors, LLC. The fund invests in fixed income markets. It primarily invests in investment grade municipal bonds exempt from federal income taxes and with a duration of three to ten years at the time of investment. BlackRock Muni Intermediate Duration Fund, Inc. was formed on August 1, 2003 and is domiciled in United States.
$12.09
Stock Price
$870.38M
Market Cap
-
Employees
New York, NY
Location
Financial Statements
Access annual & quarterly financial statements for BlackRock Municipal Income Fund, including income statements, balance sheets, and cash flow statements..
Annual Income Statement
| Breakdown | July 31, 2023 | April 30, 2022 | April 30, 2021 | April 30, 2020 | April 30, 2019 |
|---|---|---|---|---|---|
| Revenue | $3.55M | $-95.08M | $81.85M | $-9.06M | $40.40M |
| Cost of Revenue | $- | $- | $47.81M | $- | $3.86M |
| Gross Profit | $3.55M | $-95.08M | $34.05M | $-9.06M | $36.54M |
| Gross Profit Ratio | 1883.32% | 100.00% | 41.59% | -392.53% | 90.44% |
| Research and Development Expenses | $- | $- | $- | $- | $- |
| General and Administrative Expenses | $873.57K | $336.80K | $483.01K | $400.22K | $487.06K |
| Selling and Marketing Expenses | $- | $- | $- | $- | $- |
| Selling General and Administrative Expenses | $873.57K | $336.80K | $483.01K | $400.22K | $487.06K |
| Other Expenses | $- | $434 | $48.03K | $42.59K | $44.65K |
| Operating Expenses | $928.44K | $337.23K | $531.05K | $442.81K | $531.71K |
| Cost and Expenses | $-41.58M | $50.53M | $47.41M | $-43.75M | $4.76M |
| Interest Income | $66.50M | $33.16M | $34.05M | $35.54M | $36.49M |
| Interest Expense | $23.16M | $4.06M | $3.59M | $8.09M | $9.31M |
| Depreciation and Amortization | $-57.01M | $-51.66M | $-28.10M | $-29.72M | $-30.75M |
| EBITDA | $-77.03M | $39.96M | $53.08M | $-40.55M | $7.69M |
| EBITDA Ratio | -2170.41% | -42.03% | 64.85% | 447.55% | 19.02% |
| Operating Income | $57.01M | $51.66M | $28.10M | $29.72M | $30.75M |
| Operating Income Ratio | 1606.22% | -54.33% | 34.33% | -328.09% | 76.12% |
| Total Other Income Expenses Net | $-54.39M | $50.61M | $53.22M | $-39.23M | $9.12M |
| Income Before Tax | $2.62M | $-95.83M | $81.32M | $-9.50M | $39.87M |
| Income Before Tax Ratio | 73.84% | 100.79% | 99.35% | 104.89% | 98.68% |
| Income Tax Expense | $-77.03M | $238.05M | $53.08M | $-40.55M | $7.69M |
| Net Income | $2.62M | $-95.83M | $81.32M | $-9.50M | $39.87M |
| Net Income Ratio | 73.84% | 100.79% | 99.35% | 104.89% | 98.68% |
| EPS | $0.04 | $-1.30 | $2.12 | $-0.25 | $1.03 |
| EPS Diluted | $0.04 | $-1.30 | $2.12 | $-0.25 | $1.03 |
| Weighted Average Shares Outstanding | 72.87M | 73.87M | 38.30M | 38.01M | 38.30M |
| Weighted Average Shares Outstanding Diluted | 72.87M | 73.87M | 38.36M | 38.01M | 38.71M |
| SEC Filing | Source | Source | Source | Source | Source |
| Breakdown | July 31, 2023 | April 30, 2023 | January 31, 2023 | October 31, 2022 | July 31, 2022 | April 30, 2022 | January 31, 2022 | October 31, 2021 | July 31, 2021 | April 30, 2021 | January 31, 2021 | October 31, 2020 | July 31, 2020 | April 30, 2020 | January 31, 2020 | October 31, 2019 | July 31, 2019 | April 30, 2019 | January 31, 2019 | October 31, 2018 |
|---|---|---|---|---|---|---|---|---|---|---|---|---|---|---|---|---|---|---|---|---|
| Revenue | $16.95M | $16.95M | $16.47M | $16.47M | $25.87M | $8.52M | $8.52M | $8.06M | $8.06M | $8.44M | $8.44M | $8.58M | $8.58M | $17.54M | $8.77M | $18.02M | $9.01M | $18.31M | $9.16M | $18.23M |
| Cost of Revenue | $- | $- | $- | $- | $- | $- | $- | $- | $- | $- | $- | $- | $- | $6.23M | $- | $7.25M | $- | $7.53M | $- | $7.04M |
| Gross Profit | $16.95M | $16.95M | $16.47M | $16.47M | $25.87M | $8.52M | $8.52M | $8.06M | $8.06M | $8.44M | $8.44M | $8.58M | $8.58M | $11.31M | $8.77M | $10.77M | $9.01M | $10.79M | $9.16M | $11.19M |
| Gross Profit Ratio | 100.00% | 100.00% | 100.00% | 100.00% | 100.00% | 100.00% | 100.00% | 100.00% | 100.00% | 100.00% | 100.00% | 100.00% | 100.00% | 64.46% | 100.00% | 59.75% | 100.00% | 58.90% | 100.00% | 61.37% |
| Research and Development Expenses | $- | $- | $- | $- | $- | $- | $- | $- | $- | $- | $- | $- | $- | $- | $- | $- | $- | $- | $- | $- |
| General and Administrative Expenses | $2.45M | $2.45M | $2.47M | $2.47M | $285.60K | $1.65M | $1.65M | $1.54M | $1.54M | $1.51M | $1.51M | $1.47M | $1.47M | $174.15K | $1.42M | $233.58K | $1.50M | $245.29K | $1.45M | $206.15K |
| Selling and Marketing Expenses | $- | $- | $- | $- | $- | $- | $- | $- | $- | $- | $- | $- | $- | $1.28K | $- | $33.79K | $- | $37.53K | $- | $42.74K |
| Selling General and Administrative Expenses | $2.45M | $2.45M | $2.47M | $2.47M | $285.60K | $1.65M | $1.65M | $1.54M | $1.54M | $1.51M | $1.51M | $1.47M | $1.47M | $175.43K | $1.42M | $267.37K | $1.50M | $282.82K | $1.45M | $248.89K |
| Other Expenses | $- | $- | $- | $- | $- | $- | $- | $- | $- | $- | $- | $- | $- | $- | $- | $- | $- | $- | $- | $- |
| Operating Expenses | $11.32M | $11.32M | $9.47M | $9.47M | $303.60K | $57.21M | $57.21M | $7.29M | $7.29M | $5.44M | $5.44M | $18.26M | $18.26M | $175.43K | $28.29M | $267.37K | $6.42M | $282.82K | $9.34M | $248.89K |
| Cost and Expenses | $-11.32M | $-11.32M | $-9.47M | $-9.47M | $303.60K | $-57.21M | $-57.21M | $-7.29M | $-7.29M | $5.44M | $5.44M | $18.26M | $18.26M | $6.41M | $-28.29M | $7.52M | $6.42M | $7.81M | $9.34M | $7.29M |
| Interest Income | $- | $- | $- | $- | $15.59M | $874.41K | $874.41K | $- | $- | $845.44K | $845.44K | $- | $- | $- | $1.61M | $- | $- | $- | $1.48M | $- |
| Interest Expense | $6.17M | $6.17M | $5.15M | $5.15M | $2.89M | $- | $- | $874.41K | $874.41K | $- | $- | $911.92K | $911.92K | $- | $- | $15.83M | $2.27M | $29.46M | $- | $- |
| Depreciation and Amortization | $-14.51M | $-14.51M | $-14.00M | $-14.00M | $60.46K | $-6.88M | $-6.88M | $-6.52M | $-6.52M | $-6.94M | $-6.94M | $-7.11M | $-7.11M | $-93.94M | $-7.35M | $31.66M | $-7.52M | $58.92M | $-7.71M | $-22.06M |
| EBITDA | $-21.22M | $-21.22M | $-17.30M | $-17.30M | $25.57M | $-54.69M | $-54.69M | $-7.50M | $-7.50M | $7.79M | $7.79M | $17.90M | $17.90M | $-82.80M | $-25.26M | $42.17M | $3.39M | $69.42M | $12.27M | $-11.13M |
| EBITDA Ratio | -125.16% | -125.16% | -105.04% | -105.04% | 98.83% | -641.74% | -641.74% | -93.07% | -93.07% | 92.31% | 92.31% | 208.65% | 208.65% | -472.10% | -288.08% | 233.95% | 37.56% | 379.14% | 134.04% | -61.04% |
| Operating Income | $14.51M | $14.51M | $14.00M | $14.00M | $25.57M | $6.88M | $6.88M | $6.52M | $6.52M | $6.94M | $6.94M | $7.11M | $7.11M | $11.13M | $7.35M | $10.50M | $7.52M | $10.50M | $7.71M | $10.94M |
| Operating Income Ratio | 85.57% | 85.57% | 84.99% | 84.99% | 98.83% | 80.69% | 80.69% | 80.94% | 80.94% | 82.17% | 82.17% | 82.91% | 82.91% | 63.46% | 83.76% | 58.27% | 83.41% | 57.36% | 84.21% | 60.01% |
| Total Other Income Expenses Net | $-15.04M | $-15.04M | $-12.15M | $-12.15M | $- | $-54.69M | $-54.69M | $-6.62M | $-6.62M | $7.79M | $7.79M | $18.82M | $18.82M | $-46.97M | $-25.26M | $15.83M | $5.65M | $29.46M | $12.27M | $-11.03M |
| Income Before Tax | $-537.08K | $-537.08K | $1.85M | $1.85M | $25.57M | $-47.81M | $-47.81M | $-103.15K | $-103.15K | $14.73M | $14.73M | $25.93M | $25.93M | $-35.84M | $-17.92M | $26.33M | $13.17M | $39.96M | $19.98M | $-94.33K |
| Income Before Tax Ratio | -3.17% | -3.17% | 11.22% | 11.22% | 98.83% | -561.05% | -561.05% | -1.28% | -1.28% | 174.48% | 174.48% | 302.18% | 302.18% | -204.32% | -204.32% | 146.11% | 146.11% | 218.25% | 218.25% | -0.52% |
| Income Tax Expense | $-21.22M | $-21.22M | $-17.30M | $-17.30M | $- | $-54.69M | $-54.69M | $-7.50M | $-7.50M | $7.79M | $7.79M | $17.90M | $17.90M | $- | $-25.26M | $- | $3.39M | $- | $12.27M | $- |
| Net Income | $-537.08K | $-537.08K | $1.85M | $1.85M | $25.57M | $-47.81M | $-47.81M | $-103.15K | $-103.15K | $14.73M | $14.73M | $25.93M | $25.93M | $-35.84M | $-17.92M | $26.33M | $13.17M | $39.96M | $19.98M | $-94.33K |
| Net Income Ratio | -3.17% | -3.17% | 11.22% | 11.22% | 98.83% | -561.05% | -561.05% | -1.28% | -1.28% | 174.48% | 174.48% | 302.18% | 302.18% | -204.32% | -204.32% | 146.11% | 146.11% | 218.25% | 218.25% | -0.52% |
| EPS | $-0.01 | $-0.01 | $0.03 | $0.03 | $0.35 | $-0.65 | $-0.65 | $0.00 | $0.00 | $0.38 | $0.38 | $0.68 | $0.68 | $-0.94 | $-0.47 | $0.69 | $0.34 | $1.04 | $0.52 | $0.00 |
| EPS Diluted | $-0.01 | $-0.01 | $0.03 | $0.03 | $0.35 | $-0.65 | $-0.65 | $0.00 | $0.00 | $0.38 | $0.38 | $0.68 | $0.68 | $-0.94 | $-0.47 | $0.69 | $0.34 | $1.04 | $0.52 | $0.00 |
| Weighted Average Shares Outstanding | 72.87M | 72.87M | 73.58M | 73.58M | 73.05M | 73.87M | 73.87M | 38.30M | 38.30M | 38.30M | 38.30M | 38.30M | 38.30M | 38.30M | 38.30M | 38.30M | 38.30M | 38.30M | 38.30M | 38.30M |
| Weighted Average Shares Outstanding Diluted | 72.87M | 72.87M | 73.58M | 73.58M | 73.87M | 73.87M | 73.87M | 38.30M | 38.30M | 38.30M | 38.30M | 38.30M | 38.30M | 38.30M | 38.30M | 38.30M | 38.30M | 38.30M | 38.30M | 38.30M |
| SEC Filing | Source | Source | Source | Source | Source | Source | Source | Source | Source | Source | Source | Source | Source | Source | Source | Source | Source | Source | Source | Source |
Annual Balance Sheet
| Breakdown | July 31, 2023 | April 30, 2022 | April 30, 2021 | April 30, 2020 | April 30, 2019 |
|---|---|---|---|---|---|
| Cash and Cash Equivalents | $- | $617.29K | $36.78K | $- | $125.70K |
| Short Term Investments | $-150.29M | $-301.62M | $-160.13M | $-154.86M | $-158.35M |
| Cash and Short Term Investments | $-150.29M | $617.29K | $36.78K | $-154.86M | $125.70K |
| Net Receivables | $15.83M | $43.32M | $14.58M | $14.30M | $14.61M |
| Inventory | $- | $- | $- | $- | $- |
| Other Current Assets | $- | $- | $- | $- | $- |
| Total Current Assets | $16.90M | $26.77M | $15.14M | $14.33M | $15.35M |
| Property Plant Equipment Net | $- | $- | $- | $- | $- |
| Goodwill | $- | $- | $- | $- | $- |
| Intangible Assets | $- | $- | $- | $- | $- |
| Goodwill and Intangible Assets | $- | $- | $- | $- | $- |
| Long Term Investments | $1.61B | $1.74B | $985.27M | $935.23M | $958.31M |
| Tax Assets | $- | $- | $- | $- | $- |
| Other Non-Current Assets | $-150.29M | $-301.62M | $-160.13M | $-154.86M | $-158.35M |
| Total Non-Current Assets | $1.46B | $1.43B | $825.14M | $780.36M | $799.96M |
| Other Assets | $150.29M | $322.25M | $160.13M | $154.86M | $158.35M |
| Total Assets | $1.62B | $1.78B | $1.00B | $949.55M | $973.66M |
| Account Payables | $14.80M | $37.91M | $2.09M | $9.05M | $2.08M |
| Short Term Debt | $- | $- | $- | $- | $- |
| Tax Payables | $- | $- | $- | $- | $- |
| Deferred Revenue | $- | $- | $- | $- | $- |
| Other Current Liabilities | $631.41M | $695.08M | $379.19M | $371.52M | $379.61M |
| Total Current Liabilities | $661.01M | $770.90M | $383.37M | $389.62M | $383.77M |
| Long Term Debt | $122.62K | $- | $- | $74.48K | $- |
| Deferred Revenue Non-Current | $- | $- | $- | $- | $- |
| Deferred Tax Liabilities Non-Current | $- | $- | $- | $- | $- |
| Other Non-Current Liabilities | $-122.62K | $- | $- | $91.94M | $93.42M |
| Total Non-Current Liabilities | $122.62K | $- | $- | $92.01M | $93.42M |
| Other Liabilities | $-122.62K | $788.90M | $383.37M | $-92.01M | $-93.42M |
| Total Liabilities | $661.01M | $788.90M | $383.37M | $389.62M | $383.77M |
| Preferred Stock | $- | $- | $- | $- | $- |
| Common Stock | $1.04B | $1.06B | $543.45M | $543.45M | $543.45M |
| Retained Earnings | $-79.39M | $-62.57M | $73.58M | $16.48M | $46.43M |
| Accumulated Other Comprehensive Income Loss | $- | $- | $- | $- | $- |
| Other Total Stockholders Equity | $-963.90M | $- | $-617.03M | $-559.93M | $-589.89M |
| Total Stockholders Equity | $963.90M | $993.66M | $617.03M | $559.93M | $589.89M |
| Total Equity | $963.90M | $993.66M | $617.03M | $559.93M | $589.89M |
| Total Liabilities and Stockholders Equity | $1.62B | $1.78B | $1.00B | $949.55M | $973.66M |
| Minority Interest | $- | $- | $- | $- | $- |
| Total Liabilities and Total Equity | $1.62B | $1.78B | $1.00B | $949.55M | $973.66M |
| Total Investments | $1.46B | $1.43B | $825.14M | $780.36M | $799.96M |
| Total Debt | $122.62K | $- | $- | $74.48K | $93.42M |
| Net Debt | $122.62K | $-617.29K | $-36.78K | $74.48K | $93.30M |
Balance Sheet Charts
| Breakdown | July 31, 2023 | April 30, 2023 | January 31, 2023 | October 31, 2022 | July 31, 2022 | April 30, 2022 | January 31, 2022 | October 31, 2021 | July 31, 2021 | April 30, 2021 | January 31, 2021 | October 31, 2020 | July 31, 2020 | April 30, 2020 | January 31, 2020 | October 31, 2019 | July 31, 2019 | April 30, 2019 | January 31, 2019 | October 31, 2018 |
|---|---|---|---|---|---|---|---|---|---|---|---|---|---|---|---|---|---|---|---|---|
| Cash and Cash Equivalents | $- | $- | $172.74K | $172.74K | $- | $617.29K | $617.29K | $159.19K | $159.19K | $36.78K | $36.78K | $- | $- | $- | $- | $- | $- | $125.70K | $125.70K | $129.79K |
| Short Term Investments | $-150.29M | $- | $- | $- | $- | $- | $- | $- | $- | $- | $- | $- | $- | $- | $- | $- | $- | $- | $- | $- |
| Cash and Short Term Investments | $-150.29M | $- | $172.74K | $172.74K | $- | $617.29K | $617.29K | $159.19K | $159.19K | $36.78K | $36.78K | $- | $- | $- | $- | $- | $- | $125.70K | $125.70K | $129.79K |
| Net Receivables | $15.83M | $- | $16.07M | $- | $23.10M | $43.32M | $- | $13.60M | $- | $14.58M | $- | $12.87M | $- | $14.30M | $- | $14.86M | $- | $14.61M | $- | $16.19M |
| Inventory | $- | $- | $- | $- | $- | $- | $- | $- | $- | $- | $- | $- | $- | $- | $- | $- | $- | $- | $- | $- |
| Other Current Assets | $- | $- | $- | $- | $- | $- | $- | $- | $- | $- | $- | $- | $- | $- | $- | $- | $- | $- | $- | $- |
| Total Current Assets | $16.90M | $16.90M | $16.24M | $20.36M | $23.10M | $43.93M | $47.40M | $13.76M | $14.39M | $14.62M | $15.14M | $12.87M | $13.36M | $14.30M | $14.33M | $14.86M | $15.05M | $14.73M | $15.35M | $16.32M |
| Property Plant Equipment Net | $- | $- | $- | $- | $- | $- | $- | $- | $- | $- | $- | $- | $- | $- | $- | $- | $- | $- | $- | $- |
| Goodwill | $- | $- | $- | $- | $- | $- | $- | $- | $- | $- | $- | $- | $- | $- | $- | $- | $- | $- | $- | $- |
| Intangible Assets | $- | $- | $- | $- | $- | $- | $- | $- | $- | $- | $- | $- | $- | $- | $- | $- | $- | $- | $- | $- |
| Goodwill and Intangible Assets | $- | $- | $- | $- | $- | $- | $- | $- | $- | $- | $- | $- | $- | $- | $- | $- | $- | $- | $- | $- |
| Long Term Investments | $1.61B | $1.46B | $1.64B | $1.49B | $1.75B | $1.74B | $1.41B | $987.53M | $846.01M | $985.27M | $825.14M | $974.67M | $814.71M | $935.23M | $780.36M | $974.68M | $815.11M | $958.31M | $799.96M | $933.89M |
| Tax Assets | $- | $- | $- | $- | $- | $- | $- | $- | $- | $- | $- | $- | $- | $- | $- | $- | $- | $- | $- | $- |
| Other Non-Current Assets | $-150.29M | $-1.46B | $-1.64B | $-1.49B | $-1.75B | $-1.74B | $-1.41B | $-987.53M | $-846.01M | $-985.27M | $-825.14M | $-974.67M | $-814.71M | $-935.23M | $-780.36M | $-974.68M | $-815.11M | $-958.31M | $-799.96M | $-933.89M |
| Total Non-Current Assets | $1.46B | $1.46B | $1.64B | $1.49B | $1.75B | $1.74B | $1.41B | $987.53M | $846.01M | $985.27M | $825.14M | $974.67M | $814.71M | $935.23M | $780.36M | $974.68M | $815.11M | $958.31M | $799.96M | $933.89M |
| Other Assets | $150.29M | $150.29M | $4.11M | $159.38M | $3.67M | $3.46M | $324.20M | $634.46K | $141.53M | $519.65K | $160.13M | $491.65K | $159.96M | $23.08K | $154.86M | $191.10K | $159.58M | $612.40K | $158.35M | $276.94K |
| Total Assets | $1.62B | $1.62B | $1.66B | $1.66B | $1.78B | $1.78B | $1.78B | $1.00B | $1.00B | $1.00B | $1.00B | $988.03M | $988.03M | $949.55M | $949.55M | $989.73M | $989.73M | $973.66M | $973.66M | $950.49M |
| Account Payables | $14.80M | $14.13M | $25.49M | $22.54M | $34.65M | $37.91M | $33.81M | $25.86M | $23.77M | $2.09M | $- | $6.29M | $4.19M | $9.05M | $7.06M | $2.68M | $651.90K | $2.08M | $- | $7.53M |
| Short Term Debt | $- | $- | $- | $- | $- | $- | $- | $- | $- | $- | $- | $- | $- | $- | $- | $- | $- | $- | $- | $- |
| Tax Payables | $- | $- | $- | $- | $- | $- | $- | $- | $- | $- | $- | $- | $- | $- | $- | $- | $- | $- | $- | $- |
| Deferred Revenue | $- | $- | $- | $- | $- | $- | $- | $- | $- | $- | $- | $- | $- | $- | $- | $- | $- | $- | $- | $- |
| Other Current Liabilities | $631.41M | $632.75M | $-50.97M | $631.78M | $-69.30M | $-75.83M | $721.28M | $-51.72M | $349.96M | $-4.18M | $- | $-12.59M | $379.67M | $-7.60M | $375.50M | $-1.33M | $382.43M | $-906.63K | $- | $-6.49M |
| Total Current Liabilities | $661.01M | $661.01M | $25.49M | $676.86M | $34.65M | $37.91M | $788.90M | $25.86M | $397.51M | $2.09M | $383.37M | $6.29M | $388.05M | $10.51M | $389.62M | $4.02M | $383.74M | $3.25M | $383.77M | $8.56M |
| Long Term Debt | $122.62K | $- | $- | $- | $8.16K | $- | $- | $- | $- | $- | $- | $324.89K | $- | $74.48K | $- | $185.66K | $- | $- | $- | $- |
| Deferred Revenue Non-Current | $- | $- | $- | $- | $- | $- | $- | $- | $- | $- | $- | $- | $- | $- | $- | $- | $- | $- | $- | $- |
| Deferred Tax Liabilities Non-Current | $- | $- | $- | $- | $- | $- | $- | $- | $- | $- | $- | $- | $- | $- | $- | $- | $- | $- | $- | $- |
| Other Non-Current Liabilities | $-122.62K | $- | $- | $- | $-8.16K | $37.91M | $- | $- | $- | $- | $- | $-324.89K | $- | $91.94M | $- | $92.43M | $- | $93.42M | $- | $93.38M |
| Total Non-Current Liabilities | $122.62K | $- | $- | $- | $8.16K | $37.91M | $- | $- | $- | $- | $- | $324.89K | $- | $92.01M | $- | $92.61M | $- | $93.42M | $- | $93.38M |
| Other Liabilities | $-122.62K | $- | $- | $- | $736.24M | $713.07M | $- | $397.51M | $- | $383.37M | $- | $381.43M | $- | $287.10M | $- | $287.10M | $- | $287.10M | $- | $287.10M |
| Total Liabilities | $661.01M | $661.01M | $25.49M | $676.86M | $770.90M | $788.90M | $788.90M | $397.51M | $397.51M | $383.37M | $383.37M | $388.05M | $388.05M | $389.62M | $389.62M | $383.74M | $383.74M | $383.77M | $383.77M | $389.04M |
| Preferred Stock | $- | $- | $- | $- | $- | $- | $- | $- | $- | $- | $- | $- | $- | $- | $- | $- | $- | $- | $- | $- |
| Common Stock | $1.04B | $1.04B | $1.05B | $1.05B | $1.06B | $1.06B | $1.06B | $543.45M | $543.45M | $543.45M | $543.45M | $543.45M | $543.45M | $543.45M | $543.45M | $543.45M | $543.45M | $543.45M | $543.45M | $543.45M |
| Retained Earnings | $-79.39M | $-79.39M | $-64.67M | $-64.67M | $-48.97M | $-62.57M | $-62.57M | $60.96M | $60.96M | $73.58M | $73.58M | $56.53M | $56.53M | $16.48M | $16.48M | $62.54M | $62.54M | $46.43M | $46.43M | $18.00M |
| Accumulated Other Comprehensive Income Loss | $- | $- | $- | $- | $- | $- | $- | $- | $- | $- | $- | $- | $- | $- | $- | $- | $- | $- | $- | $- |
| Other Total Stockholders Equity | $-963.90M | $-963.90M | $- | $-988.07M | $- | $- | $-993.66M | $- | $-604.42M | $- | $-617.03M | $- | $-599.98M | $- | $-559.93M | $- | $-606.00M | $- | $-589.89M | $- |
| Total Stockholders Equity | $963.90M | $963.90M | $988.07M | $988.07M | $1.01B | $993.66M | $993.66M | $604.42M | $604.42M | $617.03M | $617.03M | $599.98M | $599.98M | $559.93M | $559.93M | $606.00M | $606.00M | $589.89M | $589.89M | $561.45M |
| Total Equity | $963.90M | $963.90M | $988.07M | $988.07M | $1.01B | $993.66M | $993.66M | $604.42M | $604.42M | $617.03M | $617.03M | $599.98M | $599.98M | $559.93M | $559.93M | $606.00M | $606.00M | $589.89M | $589.89M | $561.45M |
| Total Liabilities and Stockholders Equity | $1.62B | $- | $1.66B | $- | $1.78B | $1.78B | $- | $1.00B | $- | $1.00B | $- | $988.03M | $- | $949.55M | $- | $989.73M | $- | $973.66M | $- | $950.49M |
| Minority Interest | $- | $- | $- | $- | $- | $- | $- | $- | $- | $- | $- | $- | $- | $- | $- | $- | $- | $- | $- | $- |
| Total Liabilities and Total Equity | $1.62B | $- | $1.66B | $- | $1.78B | $1.78B | $- | $1.00B | $- | $1.00B | $- | $988.03M | $- | $949.55M | $- | $989.73M | $- | $973.66M | $- | $950.49M |
| Total Investments | $1.46B | $1.46B | $1.64B | $1.49B | $1.75B | $1.74B | $1.41B | $987.53M | $846.01M | $985.27M | $825.14M | $974.67M | $814.71M | $935.23M | $780.36M | $974.68M | $815.11M | $958.31M | $799.96M | $933.89M |
| Total Debt | $122.62K | $- | $- | $- | $8.16K | $- | $- | $- | $- | $- | $- | $324.89K | $- | $74.48K | $- | $185.66K | $- | $93.42M | $- | $93.38M |
| Net Debt | $122.62K | $- | $-172.74K | $-172.74K | $8.16K | $-617.29K | $-617.29K | $-159.19K | $-159.19K | $-36.78K | $-36.78K | $324.89K | $- | $74.48K | $- | $185.66K | $- | $93.30M | $-125.70K | $93.25M |
Annual Cash Flow
| Breakdown | July 31, 2023 | April 30, 2022 | April 30, 2021 | April 30, 2020 | April 30, 2019 |
|---|---|---|---|---|---|
| Net Income | $2.62M | $-95.83M | $81.32M | $-9.50M | $39.87M |
| Depreciation and Amortization | $- | $- | $- | $- | $- |
| Deferred Income Tax | $- | $- | $- | $- | $- |
| Stock Based Compensation | $- | $- | $- | $- | $- |
| Change in Working Capital | $461.76K | $-1.56M | $-249.20K | $716.11K | $-652.54K |
| Accounts Receivables | $921.46K | $31.65M | $275.28K | $589.44K | $-953.96K |
| Inventory | $- | $- | $- | $- | $- |
| Accounts Payables | $- | $- | $- | $- | $- |
| Other Working Capital | $-459.70K | $-33.21M | $-524.48K | $126.67K | $301.41K |
| Other Non Cash Items | $128.95M | $114.06M | $-57.66M | $29.86M | $-22.89M |
| Net Cash Provided by Operating Activities | $132.03M | $16.66M | $23.42M | $21.07M | $16.33M |
| Investments in Property Plant and Equipment | $- | $- | $- | $- | $- |
| Acquisitions Net | $- | $- | $- | $- | $- |
| Purchases of Investments | $- | $- | $- | $- | $- |
| Sales Maturities of Investments | $- | $- | $- | $- | $- |
| Other Investing Activities | $- | $- | $- | $- | $- |
| Net Cash Used for Investing Activities | $- | $- | $- | $- | $- |
| Debt Repayment | $- | $- | $- | $- | $- |
| Common Stock Issued | $4.11M | $- | $- | $- | $- |
| Common Stock Repurchased | $-11.36M | $-138 | $- | $- | $- |
| Dividends Paid | $-38.20M | $-24.82M | $-23.86M | $-20.45M | $-21.75M |
| Other Financing Activities | $-81.01M | $6.05M | $1.06M | $3.33M | $5.82M |
| Net Cash Used Provided by Financing Activities | $-134.57M | $-18.77M | $-22.88M | $-21.78M | $-15.93M |
| Effect of Forex Changes on Cash | $- | $- | $- | $- | $- |
| Net Change in Cash | $-2.54M | $-2.10M | $537.78K | $-710.60K | $395.70K |
| Cash at End of Period | $883.00K | $4.07M | $537.78K | $- | $710.60K |
| Cash at Beginning of Period | $3.42M | $6.17M | $- | $710.60K | $314.90K |
| Operating Cash Flow | $132.03M | $16.66M | $23.42M | $21.07M | $16.33M |
| Capital Expenditure | $- | $- | $- | $- | $- |
| Free Cash Flow | $132.03M | $16.66M | $23.42M | $21.07M | $16.33M |
Cash Flow Charts
| Breakdown | July 31, 2023 | April 30, 2023 | January 31, 2023 | October 31, 2022 | July 31, 2022 | April 30, 2022 | January 31, 2022 | October 31, 2021 | July 31, 2021 | April 30, 2021 | January 31, 2021 | October 31, 2020 | July 31, 2020 | April 30, 2020 | January 31, 2020 | October 31, 2019 | July 31, 2019 | April 30, 2019 | January 31, 2019 | October 31, 2018 |
|---|---|---|---|---|---|---|---|---|---|---|---|---|---|---|---|---|---|---|---|---|
| Net Income | $-537.08K | $-537.08K | $1.85M | $1.85M | $25.57M | $-47.81M | $-47.81M | $-103.15K | $-103.15K | $14.73M | $14.73M | $25.93M | $25.93M | $-35.84M | $-17.92M | $26.33M | $13.17M | $39.96M | $19.98M | $-94.33K |
| Depreciation and Amortization | $- | $- | $- | $- | $- | $- | $- | $- | $- | $- | $- | $- | $- | $- | $- | $- | $- | $- | $- | $- |
| Deferred Income Tax | $- | $- | $- | $- | $- | $- | $- | $- | $- | $- | $- | $- | $- | $- | $- | $- | $- | $- | $- | $- |
| Stock Based Compensation | $- | $- | $- | $- | $- | $- | $- | $- | $- | $- | $- | $- | $- | $- | $- | $- | $- | $- | $- | $- |
| Change in Working Capital | $339.17K | $339.17K | $121.56K | $121.56K | $9.01M | $-568.09K | $-568.09K | $182.79K | $182.79K | $54.95K | $54.95K | $82.69K | $82.69K | $-436.18K | $220.21K | $-1.35M | $74.52K | $-133.22K | $-267.30K | $-10.44M |
| Accounts Receivables | $339.17K | $339.17K | $121.56K | $121.56K | $- | $-568.09K | $-568.09K | $182.79K | $182.79K | $54.95K | $54.95K | $82.69K | $82.69K | $110.53K | $220.21K | $-386.36K | $74.52K | $2.03M | $-267.30K | $28.64M |
| Inventory | $- | $- | $- | $- | $- | $- | $- | $- | $- | $- | $- | $- | $- | $- | $- | $- | $- | $0 | $- | $- |
| Accounts Payables | $- | $- | $- | $- | $- | $- | $- | $- | $- | $- | $- | $- | $- | $-6.65M | $- | $-698.88K | $- | $5.38M | $- | $8.88M |
| Other Working Capital | $- | $- | $- | $- | $- | $- | $- | $- | $- | $- | $- | $- | $- | $6.11M | $- | $-267.43K | $- | $-7.54M | $- | $-47.96M |
| Other Non Cash Items | $13.57M | $13.57M | $50.68M | $50.68M | $-3.53M | $45.49M | $45.49M | $11.14M | $11.14M | $-8.25M | $-8.25M | $-20.84M | $-20.84M | $47.04M | $23.08M | $-14.67M | $-8.09M | $-28.02M | $-13.81M | $15.05M |
| Net Cash Provided by Operating Activities | $13.37M | $13.37M | $52.64M | $52.64M | $31.04M | $-2.89M | $-2.89M | $11.22M | $11.22M | $6.53M | $6.53M | $5.17M | $5.17M | $10.76M | $5.38M | $10.31M | $5.15M | $11.81M | $5.90M | $4.52M |
| Investments in Property Plant and Equipment | $- | $- | $- | $- | $- | $- | $- | $- | $- | $- | $- | $- | $- | $- | $- | $- | $- | $- | $- | $- |
| Acquisitions Net | $- | $- | $- | $- | $- | $- | $- | $- | $- | $- | $- | $- | $- | $- | $- | $- | $- | $- | $- | $- |
| Purchases of Investments | $- | $- | $- | $- | $- | $- | $- | $- | $- | $- | $- | $- | $- | $- | $- | $- | $- | $- | $- | $- |
| Sales Maturities of Investments | $- | $- | $- | $- | $- | $- | $- | $- | $- | $- | $- | $- | $- | $- | $- | $- | $- | $- | $- | $- |
| Other Investing Activities | $- | $- | $- | $- | $- | $- | $- | $- | $- | $- | $- | $- | $- | $- | $- | $- | $- | $- | $- | $- |
| Net Cash Used for Investing Activities | $- | $- | $- | $- | $- | $- | $- | $- | $- | $- | $- | $- | $- | $- | $- | $- | $- | $- | $- | $- |
| Debt Repayment | $- | $- | $- | $- | $- | $- | $- | $- | $- | $- | $- | $- | $- | $- | $- | $- | $- | $- | $- | $- |
| Common Stock Issued | $- | $- | $- | $- | $- | $- | $- | $- | $- | $- | $- | $- | $- | $- | $- | $- | $- | $- | $- | $- |
| Common Stock Repurchased | $-4.11M | $-4.11M | $-1.57M | $-1.57M | $- | $-69 | $-69 | $- | $- | $- | $- | $- | $- | $- | $- | $- | $- | $- | $- | $- |
| Dividends Paid | $-8.66M | $-8.66M | $-10.44M | $-10.44M | $-11.94M | $-6.20M | $-6.20M | $-6.20M | $-6.20M | $-6.20M | $-6.20M | $-5.73M | $-5.73M | $-10.23M | $-5.11M | $-10.23M | $-5.11M | $-11.53M | $-5.76M | $-10.23M |
| Other Financing Activities | $-2.21M | $-2.21M | $-40.29M | $-40.29M | $-19.75M | $7.92M | $7.92M | $-4.89M | $-4.89M | $-297.33K | $-297.33K | $787.74K | $787.74K | $-709.44K | $-354.72K | $-623.25K | $-311.62K | $40.11K | $20.05K | $5.78M |
| Net Cash Used Provided by Financing Activities | $-14.99M | $-14.99M | $-52.30M | $-52.30M | $-31.69M | $1.71M | $1.71M | $-11.09M | $-11.09M | $-6.50M | $-6.50M | $-4.94M | $-4.94M | $-10.93M | $-5.47M | $-10.85M | $-5.42M | $-11.49M | $-5.74M | $-4.44M |
| Effect of Forex Changes on Cash | $- | $- | $- | $- | $- | $- | $- | $- | $- | $- | $- | $- | $- | $- | $- | $- | $- | $- | $- | $- |
| Net Change in Cash | $-1.61M | $-1.61M | $346.81K | $346.81K | $-648.29K | $-1.18M | $-1.18M | $125.70K | $125.70K | $33.39K | $33.39K | $235.50K | $235.50K | $-171.90K | $-85.95K | $-538.70K | $-269.35K | $322.91K | $161.46K | $72.79K |
| Cash at End of Period | $-1.61M | $-1.61M | $346.81K | $346.81K | $3.42M | $-1.18M | $-1.18M | $125.70K | $125.70K | $33.39K | $33.39K | $235.50K | $235.50K | $-171.90K | $-85.95K | $-413.00K | $-269.35K | $452.70K | $161.46K | $72.79K |
| Cash at Beginning of Period | $- | $- | $- | $- | $4.07M | $- | $- | $- | $- | $- | $- | $- | $- | $0 | $- | $125.70K | $- | $129.79K | $- | $- |
| Operating Cash Flow | $13.37M | $13.37M | $52.64M | $52.64M | $31.04M | $-2.89M | $-2.89M | $11.22M | $11.22M | $6.53M | $6.53M | $5.17M | $5.17M | $10.76M | $5.38M | $10.31M | $5.15M | $11.81M | $5.90M | $4.52M |
| Capital Expenditure | $- | $- | $- | $- | $- | $- | $- | $- | $- | $- | $- | $- | $- | $- | $- | $- | $- | $- | $- | $- |
| Free Cash Flow | $13.37M | $13.37M | $52.64M | $52.64M | $31.04M | $-2.89M | $-2.89M | $11.22M | $11.22M | $6.53M | $6.53M | $5.17M | $5.17M | $10.76M | $5.38M | $10.31M | $5.15M | $11.81M | $5.90M | $4.52M |
BlackRock Municipal Income Fund Dividends
Explore BlackRock Municipal Income Fund's dividend history, including dividend yield, payout ratio, and historical payments.
Dividend Yield
4.57%
Dividend Payout Ratio
1457.61%
Dividend Paid & Capex Coverage Ratio
3.46x
BlackRock Municipal Income Fund Dividend History
| Dividend | Adjusted Dividend | Date | Record Date | Payment Date | Declaration Date |
|---|---|---|---|---|---|
| $0.035544 | $0.035544 | March 14, 2025 | |||
| $0.055 | $0.055 | February 14, 2025 | February 14, 2025 | February 26, 2025 | February 03, 2025 |
| $0.043326 | $0.043326 | January 15, 2025 | January 15, 2025 | February 03, 2025 | January 02, 2025 |
| $0.055 | $0.055 | December 16, 2024 | December 16, 2024 | December 31, 2024 | December 06, 2024 |
| $0.055 | $0.055 | November 15, 2024 | November 15, 2024 | December 02, 2024 | November 01, 2024 |
| $0.055 | $0.055 | October 15, 2024 | October 15, 2024 | November 01, 2024 | September 12, 2024 |
| $0.055 | $0.055 | September 16, 2024 | September 16, 2024 | October 01, 2024 | September 03, 2024 |
| $0.055 | $0.055 | August 15, 2024 | August 15, 2024 | September 03, 2024 | August 01, 2024 |
| $0.055 | $0.055 | July 15, 2024 | July 15, 2024 | August 01, 2024 | July 01, 2024 |
| $0.055 | $0.055 | June 14, 2024 | June 14, 2024 | July 01, 2024 | June 03, 2024 |
| $0.055 | $0.055 | May 14, 2024 | May 15, 2024 | June 03, 2024 | May 01, 2024 |
| $0.055 | $0.055 | April 12, 2024 | April 15, 2024 | May 01, 2024 | April 01, 2024 |
| $0.055 | $0.055 | March 14, 2024 | March 15, 2024 | April 01, 2024 | March 01, 2024 |
| $0.055 | $0.055 | February 14, 2024 | February 15, 2024 | March 01, 2024 | November 14, 2023 |
| $0.055 | $0.055 | January 11, 2024 | January 12, 2024 | February 01, 2024 | November 14, 2023 |
| $0.05512 | $0.05512 | December 14, 2023 | December 15, 2023 | December 29, 2023 | December 05, 2023 |
| $0.034 | $0.034 | November 14, 2023 | November 15, 2023 | December 01, 2023 | November 01, 2023 |
| $0.034 | $0.034 | October 13, 2023 | October 16, 2023 | November 01, 2023 | October 02, 2023 |
| $0.034 | $0.034 | September 14, 2023 | September 15, 2023 | October 02, 2023 | September 01, 2023 |
| $0.034 | $0.034 | August 14, 2023 | August 15, 2023 | September 01, 2023 | August 01, 2023 |
BlackRock Municipal Income Fund News
Read the latest news about BlackRock Municipal Income Fund, including recent articles, headlines, and updates.
BlackRock Municipal Income Fund, Inc. (MUI) Completes Conversion to Interval Fund Structure
NEW YORK--(BUSINESS WIRE)---- $MUI--BlackRock Municipal Income Fund, Inc. (NYSE: MUI, the “Fund”) has completed the conversion from an exchange-listed closed-end fund to an unlisted continuously-offered interval fund that conducts quarterly repurchases of its shares (the “Conversion”) and will operate under the name BlackRock Municipal Credit Alpha Portfolio, Inc. (“Interval Fund”). The below table provides shareholders with information regarding the Net Asset Value (NAV) and conversion ratio for the Fu.

BlackRock Municipal Income Fund, Inc. (MUI) Declares Final Distribution as Part of its Conversion to the Institutional Share Class (MUNEX) of BlackRock Municipal Credit Alpha Portfolio, Inc.
NEW YORK--(BUSINESS WIRE)---- $MUI--BlackRock Municipal Income Fund, Inc. (MUI) announced a distribution today as detailed below. Shareholders will receive a final distribution from MUI to be paid March 20, 2025 representing the period March 1, 2025 through March 23, 2025. The conversion is anticipated to close on March 24, 2025, at which time MUNEX will begin a daily record & ex-date to be paid March 31, 2025. MUNEX represents the Institutional Share Class and is expected to launch with a 5.75% ann.

BlackRock Municipal Income Fund, Inc. (MUI) Announces 2025 Repurchase Schedule and Initial Repurchase Amount in Connection with Upcoming Conversion to Unlisted Continuously-Offered Closed-End Fund
NEW YORK--(BUSINESS WIRE)---- $MUI--BlackRock Municipal Income Fund, Inc. (NYSE: MUI, the “Fund”) is providing additional information related to the Fund's upcoming conversion from an exchange-listed closed-end fund to an unlisted continuously-offered closed-end fund that conducts quarterly repurchases of its shares (the “Conversion”) and will operate under the name BlackRock Municipal Credit Alpha Portfolio, Inc. (the “Interval Fund”). Today, the Board of Directors of MUI, (the “Board”) approved a repu.

BlackRock Municipal Income Fund, Inc. (MUI) Delists from the NYSE in Connection with the Conversion to an Unlisted Interval Fund Structure
NEW YORK--(BUSINESS WIRE)---- $MUI--BlackRock Municipal Income Fund, Inc. (NYSE: MUI, the “Fund”) has delisted from the New York Stock Exchange (NYSE). Please note that, effective as of the Delisting Date, the MUI Shares will no longer trade on the NYSE or any other securities exchange. The Fund is in the process of converting from an exchange-listed closed-end fund to an unlisted continuously-offered closed-end fund that conducts quarterly repurchases of its shares (the “Conversion”) and will operate u.

BlackRock Municipal Income Fund, Inc. (MUI) Provides De-Listing and Conversion Dates for Upcoming Conversion to Unlisted Continuously-Offered Closed-End Fund
NEW YORK--(BUSINESS WIRE)---- $MUI--BlackRock Municipal Income Fund, Inc. (NYSE: MUI, the “Fund”) is providing additional information related to the Fund's upcoming conversion from an exchange-listed closed-end fund to an unlisted continuously-offered closed-end fund that conducts quarterly repurchases of its shares (the “Conversion”) and will operate under the name BlackRock Municipal Credit Alpha Portfolio, Inc. (the “Interval Fund”). It is currently anticipated that the Conversion will take place aft.

CEF Weekly Review: Emerging Market Debt Remains A Tricky Income Holding
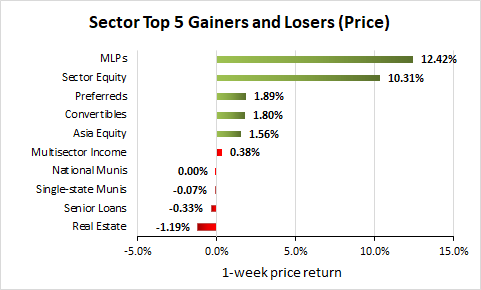
We review the CEF market valuation and performance through the third week of November and highlight recent market action. CEFs had a positive week, with most sectors gaining except for higher-quality sectors like Munis and Agencies. MLPs led month-to-date returns with double-digit gains. The Western Asset Emerging Market Debt Fund raised its distribution by 4%, but its 70% coverage ratio makes it less appealing.

BlackRock Municipal Income Fund, Inc. (MUI) Announces Final Results of Tender Offer
NEW YORK--(BUSINESS WIRE)---- $MUI--BlackRock Advisors, LLC (“BlackRock”) announced today the final results of BlackRock Municipal Income Fund, Inc. (NYSE: MUI, the “Fund”) tender offer (a “Tender Offer”) for up to 50% of its outstanding common shares (the “Shares”). The Tender Offers, which expired at 5:00 p.m. Eastern time on November 15, 2024, was oversubscribed. Therefore, in accordance with the terms and conditions of the Tender Offer, the Fund will purchase Shares from all tendering shareholders o.

BlackRock Municipal Income Fund, Inc. (MUI) Expiration and Preliminary Results of Tender Offer
NEW YORK--(BUSINESS WIRE)---- $MUI--BlackRock Advisors, LLC (“BlackRock”) announced today the expiration and preliminary results of BlackRock Municipal Income Fund, Inc. (NYSE: MUI, the “Fund”) tender offer (a “Tender Offer”) for up to 50% of its outstanding common shares (the “Shares”). The Tender Offer commenced on October 15, 2024 and expired at 5:00 p.m. Eastern time on November 15, 2024. Based on preliminary information, the number of Shares properly tendered for the Fund and not withdrawn is noted.

BlackRock Municipal Income Fund, Inc. (MUI) Announces Tender Offer in Conjunction with Conversion to an Unlisted Closed-End Interval Fund Structure
NEW YORK--(BUSINESS WIRE)---- $MUI--BlackRock Advisors, LLC (“BlackRock”) announced today that on October 15, 2024, BlackRock Municipal Income Fund, Inc. (NYSE: MUI, the “Fund”) will commence a tender offer to purchase up to 50% of the Fund's outstanding common shares at a price per share equal to 98% of the Fund's net asset value (“NAV”) per common share, as described in further detail below (the “Tender Offer”). The Tender Offer will expire on November 15, 2024 at 5:00 p.m. Eastern Time, unless otherw.

BlackRock Announces Results of Shareholder Vote at Special Meeting Relating to BlackRock Municipal Income Fund, Inc. (MUI) Conversion to Unlisted Closed-End Interval Fund Structure
NEW YORK--(BUSINESS WIRE)---- $MUI--BlackRock Advisors, LLC announced today that, at a special meeting of shareholders of BlackRock Municipal Income Fund, Inc. (NYSE: MUI, the “Fund”), shareholders approved the proposals necessary for the conversion of the Fund from an exchange-listed, closed-end fund to an unlisted closed-end fund that conducts periodic repurchases of its shares pursuant to Rule 23c-3 under the Investment Company Act of 1940 (the “Conversion”). The Conversion is currently expected to o.

Board of BlackRock Municipal Income Fund, Inc. (MUI) Approves Conversion to Unlisted Closed-End Interval Fund Structure
NEW YORK--(BUSINESS WIRE)---- $MUI--BlackRock Advisors, LLC (“BlackRock”) announced today that the Board of Directors (the “Board”) of BlackRock Municipal Income Fund, Inc. (NYSE: MUI, the “Fund”) has approved the conversion of the Fund from an exchange-listed, closed-end fund to an unlisted closed-end fund that conducts periodic repurchases of its shares pursuant to Rule 23c-3 under the Investment Company Act of 1940 (the “Conversion”). As previously announced, the Fund will, subject to receiving share.

CEF Weekly Review: Are Discounts Good Or Bad?
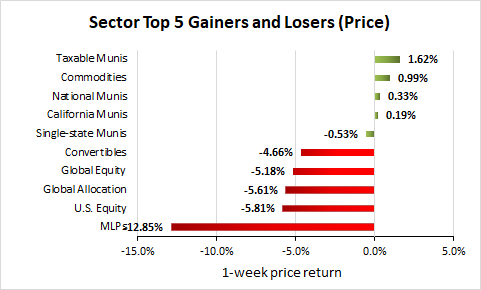
We review CEF market valuation and performance through the second week of May and highlight recent market action. CEFs had a strong week, with all sector NAVs moving higher, particularly MLPs and Utilities. CEF activists criticize wide discounts, but discounts can also provide implicit leverage and offset management fees.


BlackRock Municipal Income Fund, Inc. (MUI) Announces Tender Offer Contingent Upon Approval of Conversion of MUI to Unlisted Closed-End Interval Fund Structure
NEW YORK--(BUSINESS WIRE)---- $MUI--BlackRock Advisors, LLC (“BlackRock”) announced today that the Board of Directors (the “Board”) of BlackRock Municipal Income Fund, Inc. (NYSE: MUI, the “Fund”) has approved a tender offer to repurchase 50% of the Fund's outstanding common shares at a price per share equal to 98% of the Fund's net asset value per common share determined following the expiration of the tender offer (the “Tender Offer”). The Tender Offer is contingent on obtaining all approvals for the.


Distribution Dates and Amounts Announced for Certain BlackRock Closed-End Funds
NEW YORK--(BUSINESS WIRE)--Certain BlackRock closed-end funds (the “Funds”) announced distributions today as detailed below. Municipal Funds: Declaration- 3/1/2024 Ex-Date- 3/14/2024 Record- 3/15/2024 Payable- 4/1/2024 National Funds Ticker Distribution Change From Prior Distribution BlackRock Municipal Income Quality Trust* BYM $0.052500 - BlackRock Long-Term Municipal Advantage Trust* BTA $0.043500 - BlackRock MuniAssets Fund, Inc.* MUA $0.055500 - BlackRock Municipal Income Fund, Inc.


CORRECTING and REPLACING BlackRock Closed-End Fund Share Repurchase Program Update
NEW YORK--(BUSINESS WIRE)--Please replace the release dated April 11, 2023, with the following corrected version due to changes in the table, "Summary of share repurchase activity since Repurchase Program inception as of March 31, 2023".

BlackRock Announces Fiscal Year End Changes for Certain Municipal Closed-End Funds
NEW YORK--(BUSINESS WIRE)--BlackRock Advisors, LLC (“BlackRock”) announced today a change to the fiscal year end (“FYE”) for each Fund listed below. These changes were made to reduce operating costs for the Funds and will be effective as of July 31, 2022. Ticker (NYSE) Fund Current FYE New FYE BKN BlackRock Investment Quality Municipal Trust, Inc. 4/30 7/31 BTA BlackRock Long-Term Municipal Advantage Trust 4/30 7/31 MUA BlackRock MuniAssets Fund, Inc. 4/30 7/31 MUI BlackRock Municipal Income Fu

BlackRock Muni Intermediate Duration Fund, Inc. Announces Investment Policy Update and Name Change
NEW YORK--(BUSINESS WIRE)--BlackRock Advisors, LLC (“BlackRock”) announced today an investment policy update and name change for BlackRock Muni Intermediate Duration Fund, Inc. (the “Fund”) (NYSE: MUI, CUSIP:09253X102). The Fund's Board of Directors has approved the elimination, effective October 1, 2021, of the Fund's non-fundamental policy to maintain a dollar-weighted average portfolio duration, as calculated by BlackRock, of three to ten years. In connection with this investment policy chan

6 Meridian Has $330,000 Holdings in Blackrock Muni Intermediate Drtn Fnd Inc (NYSE:MUI)
6 Meridian trimmed its stake in Blackrock Muni Intermediate Drtn Fnd Inc (NYSE:MUI) by 33.9% during the 1st quarter, according to its most recent 13F filing with the Securities and Exchange Commission (SEC). The fund owned 25,292 shares of the company’s stock after selling 12,981 shares during the period. 6 Meridian’s holdings in Blackrock Muni […]

Blackrock Muni Intermediate Drtn Fnd Inc (NYSE:MUI) Plans $0.05 Monthly Dividend
Blackrock Muni Intermediate Drtn Fnd Inc (NYSE:MUI) declared a monthly dividend on Wednesday, April 1st, Zacks reports. Shareholders of record on Wednesday, April 15th will be paid a dividend of 0.045 per share on Friday, May 1st. This represents a $0.54 dividend on an annualized basis and a dividend yield of 3.94%. The ex-dividend date […]

Bank of America Corp DE Purchases 54,203 Shares of Blackrock Muni Intermediate Drtn Fnd Inc (NYSE:MUI)
Bank of America Corp DE boosted its position in shares of Blackrock Muni Intermediate Drtn Fnd Inc (NYSE:MUI) by 10.8% in the 4th quarter, according to its most recent filing with the Securities & Exchange Commission. The fund owned 553,771 shares of the company’s stock after purchasing an additional 54,203 shares during the period. Bank […]

Ladenburg Thalmann Financial Services Inc. Acquires 2,671 Shares of Blackrock Muni Intermediate Drtn Fnd Inc (NYSE:MUI)
Ladenburg Thalmann Financial Services Inc. raised its holdings in shares of Blackrock Muni Intermediate Drtn Fnd Inc (NYSE:MUI) by 5.1% during the fourth quarter, according to its most recent filing with the Securities and Exchange Commission (SEC). The firm owned 54,866 shares of the company’s stock after acquiring an additional 2,671 shares during the quarter. […]

Similar Companies
Virtus Convertible & Income 2024 Target Term Fund
CBH
Price: $9.19
Market Cap: $167.75M
Eaton Vance National Municipal Opportunities Trust
EOT
Price: $16.89
Market Cap: $263.90M
Related Metrics
Explore detailed financial metrics and analysis for MUI.