New Jersey Resources Key Executives
This section highlights New Jersey Resources's key executives, including their titles and compensation details.
Find Contacts at New Jersey Resources
(Showing 0 of )
New Jersey Resources Earnings
This section highlights New Jersey Resources's earnings, including key dates, EPS, earnings reports, and earnings call transcripts.
Next Earnings Date
Last Earnings Results
Earnings Call Transcripts
| Transcript | Quarter | Year | Date | Estimated EPS | Actual EPS |
|---|---|---|---|---|---|
| Read Transcript | Q1 | 2025 | 2025-02-04 | N/A | N/A |
| Read Transcript | Q4 | 2024 | 2024-11-26 | N/A | N/A |
| Read Transcript | Q3 | 2024 | 2024-08-06 | $-0.02 | $-0.09 |
| Read Transcript | Q2 | 2024 | 2024-05-07 | $1.33 | $1.41 |
| Read Transcript | Q1 | 2024 | 2024-02-06 | $0.75 | $0.74 |
| Read Transcript | Q4 | 2023 | 2023-11-21 | $0.30 | $0.30 |
| Read Transcript | Q3 | 2023 | 2023-08-06 | N/A | N/A |
| Read Transcript | Q2 | 2023 | 2023-05-05 | N/A | N/A |
| Read Transcript | Q1 | 2023 | 2023-02-02 | $0.72 | $1.14 |
Financial Statements
Access annual & quarterly financial statements for New Jersey Resources, including income statements, balance sheets, and cash flow statements..
Annual Income Statement
| Breakdown | September 30, 2024 | September 30, 2023 | September 30, 2022 | September 30, 2021 | September 30, 2020 |
|---|---|---|---|---|---|
| Revenue | $1.80B | $1.96B | $2.91B | $2.16B | $1.95B |
| Cost of Revenue | $1.10B | $1.35B | $2.31B | $1.72B | $1.58B |
| Gross Profit | $696.47M | $610.48M | $595.16M | $438.04M | $370.81M |
| Gross Profit Ratio | 38.77% | 31.10% | 20.48% | 20.31% | 18.98% |
| Research and Development Expenses | $- | $- | $- | $- | $- |
| General and Administrative Expenses | $- | $- | $59.44M | $38.30M | $34.53M |
| Selling and Marketing Expenses | $- | $- | $- | $- | $- |
| Selling General and Administrative Expenses | $- | $10.46M | $59.44M | $38.30M | $34.53M |
| Other Expenses | $226.89M | $193.02M | $129.25M | $111.39M | $107.37M |
| Operating Expenses | $226.89M | $203.48M | $188.69M | $149.69M | $141.90M |
| Cost and Expenses | $1.34B | $1.56B | $2.50B | $1.87B | $1.72B |
| Interest Income | $- | $- | $2.72M | $2.58M | $4.39M |
| Interest Expense | $130.28M | $123.01M | $85.83M | $78.56M | $67.60M |
| Depreciation and Amortization | $166.57M | $155.21M | $137.61M | $120.58M | $117.57M |
| EBITDA | $671.52M | $594.06M | $565.01M | $433.52M | $370.36M |
| EBITDA Ratio | 37.38% | 30.26% | 19.44% | 20.10% | 18.96% |
| Operating Income | $458.10M | $407.00M | $406.48M | $288.35M | $228.91M |
| Operating Income Ratio | 25.50% | 20.73% | 13.99% | 13.37% | 11.72% |
| Total Other Income Expenses Net | $-88.72M | $-96.93M | $-63.53M | $-53.96M | $-43.72M |
| Income Before Tax | $369.38M | $310.07M | $342.94M | $234.39M | $185.19M |
| Income Before Tax Ratio | 20.56% | 15.80% | 11.80% | 10.87% | 9.48% |
| Income Tax Expense | $84.91M | $49.27M | $76.19M | $33.29M | $36.49M |
| Net Income | $289.77M | $264.72M | $274.92M | $201.10M | $163.01M |
| Net Income Ratio | 16.13% | 13.49% | 9.46% | 9.32% | 8.34% |
| EPS | $2.94 | $2.73 | $2.86 | $2.09 | $1.72 |
| EPS Diluted | $2.92 | $2.71 | $2.85 | $2.08 | $1.71 |
| Weighted Average Shares Outstanding | 98.63M | 97.03M | 96.10M | 96.23M | 94.80M |
| Weighted Average Shares Outstanding Diluted | 99.29M | 97.63M | 96.49M | 96.56M | 95.10M |
| SEC Filing | Source | Source | Source | Source | Source |
| Breakdown | December 31, 2024 | September 30, 2024 | June 30, 2024 | March 31, 2024 | December 31, 2023 | September 30, 2023 | June 30, 2023 | March 31, 2023 | December 31, 2022 | September 30, 2022 | June 30, 2022 | March 31, 2022 | December 31, 2021 | September 30, 2021 | June 30, 2021 | March 31, 2021 | December 31, 2020 | September 30, 2020 | June 30, 2020 | March 31, 2020 |
|---|---|---|---|---|---|---|---|---|---|---|---|---|---|---|---|---|---|---|---|---|
| Revenue | $488.36M | $395.78M | $275.64M | $661.56M | $467.21M | $331.32M | $264.07M | $644.03M | $723.57M | $765.49M | $552.34M | $912.32M | $675.84M | $532.53M | $367.59M | $802.19M | $454.31M | $400.04M | $298.97M | $639.61M |
| Cost of Revenue | $88.63M | $197.53M | $220.45M | $483.81M | $271.92M | $224.72M | $214.34M | $417.60M | $495.84M | $646.53M | $481.29M | $711.10M | $471.89M | $496.27M | $361.83M | $555.72M | $304.76M | $328.05M | $282.49M | $498.29M |
| Gross Profit | $399.73M | $198.25M | $55.19M | $177.76M | $195.29M | $106.60M | $49.73M | $226.43M | $227.72M | $118.95M | $71.04M | $201.22M | $203.95M | $36.26M | $5.77M | $246.47M | $149.54M | $71.99M | $16.49M | $141.33M |
| Gross Profit Ratio | 81.85% | 50.09% | 20.02% | 26.87% | 41.80% | 32.17% | 18.83% | 35.16% | 31.47% | 15.54% | 12.86% | 22.06% | 30.18% | 6.81% | 1.57% | 30.72% | 32.92% | 18.00% | 5.52% | 22.10% |
| Research and Development Expenses | $- | $- | $- | $- | $- | $- | $- | $- | $- | $- | $- | $- | $- | $- | $- | $- | $- | $- | $- | $- |
| General and Administrative Expenses | $- | $- | $- | $- | $- | $- | $6.12M | $23.15M | $- | $3.50M | $8.36M | $30.91M | $16.67M | $3.73M | $5.46M | $18.41M | $10.70M | $1.99M | $5.46M | $15.33M |
| Selling and Marketing Expenses | $- | $- | $- | $- | $- | $- | $- | $- | $- | $- | $- | $- | $- | $- | $- | $- | $- | $- | $- | $- |
| Selling General and Administrative Expenses | $- | $- | $49.25M | $2.77M | $2.74M | $2.81M | $6.12M | $23.15M | $2.64M | $3.50M | $8.36M | $30.91M | $16.67M | $3.73M | $5.46M | $18.41M | $10.70M | $1.99M | $5.46M | $15.33M |
| Other Expenses | $298.78M | $48.86M | $- | $15.42M | $6.34M | $10.94M | $5.71M | $38.09M | $54.93M | $34.55M | $4.29M | $31.43M | $4.14M | $10.66M | $4.82M | $5.01M | $4.12M | $13.62M | $2.71M | $7.26M |
| Operating Expenses | $298.78M | $48.86M | $43.29M | $69.30M | $59.48M | $42.31M | $45.00M | $61.24M | $54.93M | $38.05M | $41.23M | $62.34M | $47.06M | $33.14M | $33.22M | $45.26M | $38.06M | $32.13M | $36.68M | $46.11M |
| Cost and Expenses | $387.42M | $249.65M | $261.04M | $483.81M | $331.39M | $267.03M | $259.34M | $478.84M | $550.78M | $684.58M | $522.53M | $773.44M | $518.96M | $529.41M | $395.05M | $600.98M | $342.82M | $360.18M | $319.17M | $544.40M |
| Interest Income | $- | $- | $- | $- | $2.03M | $2.33M | $2.39M | $2.24M | $1.96M | $1.04M | $- | $- | $- | $- | $- | $- | $- | $- | $- | $- |
| Interest Expense | $33.89M | $36.01M | $31.17M | $31.62M | $31.47M | $33.14M | $30.12M | $30.26M | $29.49M | $26.02M | $21.41M | $18.93M | $19.48M | $19.88M | $18.74M | $20.15M | $19.79M | $17.18M | $15.14M | $19.20M |
| Depreciation and Amortization | $45.33M | $45.30M | $40.91M | $40.22M | $40.40M | $39.78M | $39.38M | $38.84M | $37.21M | $36.22M | $34.59M | $33.98M | $31.87M | $31.55M | $29.46M | $30.17M | $27.36M | $30.14M | $31.22M | $30.78M |
| EBITDA | $246.52M | $202.96M | $56.10M | $225.57M | $182.56M | $121.78M | $50.02M | $208.46M | $214.31M | $126.50M | $68.68M | $176.98M | $192.89M | $45.33M | $6.82M | $236.38M | $142.96M | $85.17M | $13.74M | $133.26M |
| EBITDA Ratio | 50.48% | 51.28% | 20.35% | 34.10% | 39.07% | 36.76% | 18.94% | 32.37% | 29.62% | 16.53% | 12.43% | 19.40% | 28.54% | 8.51% | 1.85% | 29.47% | 31.47% | 21.29% | 4.60% | 20.83% |
| Operating Income | $189.58M | $146.13M | $5.94M | $177.76M | $135.82M | $64.29M | $4.73M | $165.18M | $172.79M | $80.91M | $29.81M | $138.88M | $156.88M | $3.12M | $-27.46M | $201.21M | $111.48M | $39.86M | $-20.19M | $95.22M |
| Operating Income Ratio | 38.82% | 36.92% | 2.15% | 26.87% | 29.07% | 19.40% | 1.79% | 25.65% | 23.88% | 10.57% | 5.40% | 15.22% | 23.21% | 0.59% | -7.47% | 25.08% | 24.54% | 9.96% | -6.75% | 14.89% |
| Total Other Income Expenses Net | $-22.27M | $-25.77M | $-21.61M | $-23.73M | $-25.13M | $-22.20M | $-24.41M | $-25.48M | $-24.84M | $-16.27M | $-17.12M | $-14.80M | $-15.34M | $-9.22M | $-13.93M | $-15.15M | $-15.67M | $-20.08M | $-15.78M | $-15.21M |
| Income Before Tax | $167.30M | $120.35M | $-15.68M | $154.02M | $110.69M | $42.09M | $-19.67M | $139.70M | $147.95M | $64.63M | $12.69M | $124.08M | $141.54M | $-6.10M | $-41.38M | $186.06M | $95.81M | $36.30M | $-32.62M | $83.27M |
| Income Before Tax Ratio | 34.26% | 30.41% | -5.69% | 23.28% | 23.69% | 12.70% | -7.45% | 21.69% | 20.45% | 8.44% | 2.30% | 13.60% | 20.94% | -1.15% | -11.26% | 23.19% | 21.09% | 9.07% | -10.91% | 13.02% |
| Income Tax Expense | $37.38M | $30.79M | $-2.76M | $33.95M | $22.94M | $6.22M | $-20.50M | $30.59M | $32.98M | $12.14M | $4.43M | $28.81M | $30.81M | $-4.43M | $-18.79M | $39.06M | $17.44M | $-2.85M | $-2.19M | $-1.64M |
| Net Income | $131.32M | $91.13M | $-11.57M | $120.81M | $89.41M | $37.02M | $1.53M | $110.25M | $115.92M | $54.52M | $13.05M | $96.03M | $111.31M | $-1.13M | $-111.83M | $149.81M | $81.05M | $43.27M | $-27.22M | $88.50M |
| Net Income Ratio | 26.89% | 23.02% | -4.20% | 18.26% | 19.14% | 11.17% | 0.58% | 17.12% | 16.02% | 7.12% | 2.36% | 10.53% | 16.47% | -0.21% | -30.42% | 18.68% | 17.84% | 10.82% | -9.10% | 13.84% |
| EPS | $1.32 | $0.00 | $-0.12 | $1.23 | $0.91 | $0.38 | $0.02 | $1.14 | $1.20 | $0.57 | $0.14 | $1.00 | $1.16 | $-0.01 | $-1.16 | $1.56 | $0.84 | $0.45 | $-0.28 | $0.93 |
| EPS Diluted | $1.31 | $0.00 | $-0.12 | $1.22 | $0.91 | $0.38 | $0.02 | $1.13 | $1.19 | $0.56 | $0.14 | $1.00 | $1.16 | $-0.01 | $-1.16 | $1.55 | $0.84 | $0.45 | $-0.28 | $0.92 |
| Weighted Average Shares Outstanding | 99.86M | - | 98.98M | 98.38M | 97.87M | 97.57M | 97.17M | 96.89M | 96.48M | 96.23M | 96.15M | 96.07M | 95.94M | 96.20M | 96.35M | 96.25M | 96.11M | 95.93M | 95.76M | 95.58M |
| Weighted Average Shares Outstanding Diluted | 100.48M | - | 98.98M | 99.10M | 98.56M | 98.19M | 97.89M | 97.56M | 97.08M | 96.63M | 96.62M | 96.52M | 96.36M | 96.20M | 96.35M | 96.62M | 96.42M | 96.26M | 95.76M | 95.89M |
| SEC Filing | Source | Source | Source | Source | Source | Source | Source | Source | Source | Source | Source | Source | Source | Source | Source | Source | Source | Source | Source | Source |
Annual Balance Sheet
| Breakdown | September 30, 2024 | September 30, 2023 | September 30, 2022 | September 30, 2021 | September 30, 2020 |
|---|---|---|---|---|---|
| Cash and Cash Equivalents | $1.02M | $954.00K | $1.11M | $4.75M | $117.01M |
| Short Term Investments | $1 | $- | $- | $- | $- |
| Cash and Short Term Investments | $1.02M | $954.00K | $1.11M | $4.75M | $117.01M |
| Net Receivables | $117.12M | $120.70M | $271.19M | $249.75M | $160.46M |
| Inventory | $237.61M | $226.52M | $293.97M | $213.17M | $187.91M |
| Other Current Assets | $198.85M | $155.95M | $189.82M | $166.61M | $156.95M |
| Total Current Assets | $554.60M | $532.08M | $756.09M | $634.27M | $622.33M |
| Property Plant Equipment Net | $5.59B | $5.20B | $4.82B | $4.39B | $3.85B |
| Goodwill | $- | $- | $- | $- | $- |
| Intangible Assets | $10.52M | $8.45M | $8.47M | $10.61M | $14.77M |
| Goodwill and Intangible Assets | $10.52M | $8.45M | $8.47M | $10.61M | $14.77M |
| Long Term Investments | $101.74M | $104.13M | $106.57M | $114.53M | $208.38M |
| Tax Assets | $20.75M | $28.38M | $81.66M | $525.50M | $530.81M |
| Other Non-Current Assets | $706.33M | $666.65M | $490.19M | $49.92M | $85.66M |
| Total Non-Current Assets | $6.43B | $6.01B | $5.51B | $5.09B | $4.69B |
| Other Assets | $- | $- | $- | $- | $- |
| Total Assets | $6.98B | $6.54B | $6.26B | $5.72B | $5.32B |
| Account Payables | $226.75M | $203.93M | $392.48M | $393.06M | $238.24M |
| Short Term Debt | $493.29M | $373.03M | $503.58M | $454.44M | $159.31M |
| Tax Payables | $10.59M | $10.09M | $5.13M | $3.36M | $2.72M |
| Deferred Revenue | $60.17M | $61.40M | $68.79M | $32.59M | $25.93M |
| Other Current Liabilities | $96.98M | $158.16M | $167.41M | $200.56M | $133.46M |
| Total Current Liabilities | $887.77M | $806.60M | $1.10B | $1.05B | $533.72M |
| Long Term Debt | $3.04B | $2.92B | $2.62B | $2.30B | $2.35B |
| Deferred Revenue Non-Current | $3.10M | $659.00K | $753.00K | $847.00K | $1.03M |
| Deferred Tax Liabilities Non-Current | $360.94M | $287.86M | $241.64M | $166.54M | $141.41M |
| Other Non-Current Liabilities | $490.63M | $535.60M | $473.88M | $569.09M | $641.91M |
| Total Non-Current Liabilities | $3.89B | $3.74B | $3.34B | $3.04B | $3.14B |
| Other Liabilities | $- | $- | $- | $- | $- |
| Total Liabilities | $4.78B | $4.55B | $4.44B | $4.09B | $3.67B |
| Preferred Stock | $- | $- | $- | $- | $- |
| Common Stock | $248.16M | $243.46M | $241.62M | $240.64M | $240.24M |
| Retained Earnings | $1.30B | $1.18B | $1.07B | $934.61M | $947.50M |
| Accumulated Other Comprehensive Income Loss | $-6.52M | $10.79M | $-4.83M | $-34.53M | $-44.31M |
| Other Total Stockholders Equity | $660.03M | $558.65M | $512.89M | $490.14M | $500.47M |
| Total Stockholders Equity | $2.20B | $1.99B | $1.82B | $1.63B | $1.64B |
| Total Equity | $2.20B | $1.99B | $1.82B | $1.63B | $1.64B |
| Total Liabilities and Stockholders Equity | $6.98B | $6.54B | $6.26B | $5.72B | $5.32B |
| Minority Interest | $- | $- | $- | $- | $- |
| Total Liabilities and Total Equity | $6.98B | $6.54B | $6.26B | $5.72B | $5.32B |
| Total Investments | $101.74M | $104.13M | $106.57M | $114.53M | $208.38M |
| Total Debt | $3.52B | $3.29B | $3.13B | $2.76B | $2.51B |
| Net Debt | $3.52B | $3.29B | $3.13B | $2.75B | $2.40B |
Balance Sheet Charts
| Breakdown | December 31, 2024 | September 30, 2024 | June 30, 2024 | March 31, 2024 | December 31, 2023 | September 30, 2023 | June 30, 2023 | March 31, 2023 | December 31, 2022 | September 30, 2022 | June 30, 2022 | March 31, 2022 | December 31, 2021 | September 30, 2021 | June 30, 2021 | March 31, 2021 | December 31, 2020 | September 30, 2020 | June 30, 2020 | March 31, 2020 |
|---|---|---|---|---|---|---|---|---|---|---|---|---|---|---|---|---|---|---|---|---|
| Cash and Cash Equivalents | $1.91M | $1.02M | $22.40M | $24.35M | $2.74M | $954.00K | $511.00K | $27.09M | $2.41M | $1.11M | $27.69M | $13.91M | $1.26M | $4.75M | $4.72M | $57.65M | $22.36M | $117.01M | $42.82M | $25.97M |
| Short Term Investments | $- | $1 | $- | $- | $- | $- | $- | $- | $- | $- | $- | $- | $- | $- | $- | $- | $- | $- | $- | $- |
| Cash and Short Term Investments | $1.91M | $1.02M | $22.40M | $24.35M | $2.74M | $954.00K | $511.00K | $27.09M | $2.41M | $1.11M | $27.69M | $13.91M | $1.26M | $4.75M | $4.72M | $57.65M | $22.36M | $117.01M | $42.82M | $25.97M |
| Net Receivables | $- | $117.12M | $138.09M | $268.25M | $276.42M | $148.65M | $150.62M | $242.65M | $489.91M | $271.19M | $296.54M | $312.20M | $338.24M | $249.75M | $229.69M | $265.28M | $253.19M | $160.46M | $170.37M | $231.22M |
| Inventory | $- | $237.61M | $163.88M | $111.36M | $224.57M | $226.52M | $185.86M | $108.52M | $275.99M | $293.97M | $225.84M | $88.16M | $262.03M | $213.17M | $145.27M | $93.68M | $182.12M | $187.91M | $142.09M | $94.17M |
| Other Current Assets | $728.80M | $198.85M | $228.31M | $169.07M | $173.23M | $155.95M | $183.37M | $237.70M | $243.51M | $189.82M | $190.01M | $141.78M | $158.79M | $166.61M | $138.58M | $118.62M | $151.54M | $156.95M | $165.80M | $149.51M |
| Total Current Assets | $730.70M | $554.60M | $534.39M | $553.71M | $676.96M | $532.08M | $520.36M | $615.97M | $1.01B | $756.09M | $740.08M | $556.04M | $760.32M | $634.27M | $518.26M | $535.23M | $609.20M | $622.33M | $521.08M | $500.87M |
| Property Plant Equipment Net | $5.61B | $5.59B | $5.47B | $5.34B | $5.27B | $5.20B | $5.06B | $4.99B | $4.92B | $4.82B | $4.71B | $4.62B | $4.52B | $4.39B | $4.17B | $4.06B | $3.96B | $3.85B | $4.01B | $3.90B |
| Goodwill | $- | $- | $- | $- | $- | $- | $- | $- | $- | $- | $- | $- | $- | $- | $- | $- | $- | $- | $- | $- |
| Intangible Assets | $10.56M | $10.52M | $10.25M | $9.73M | $9.11M | $8.45M | $8.19M | $8.04M | $8.47M | $8.47M | $8.80M | $9.16M | $9.80M | $10.61M | $11.33M | $11.95M | $14.89M | $14.77M | $11.01M | $11.43M |
| Goodwill and Intangible Assets | $10.56M | $10.52M | $10.25M | $9.73M | $9.11M | $8.45M | $8.19M | $8.04M | $8.47M | $8.47M | $8.80M | $9.16M | $9.80M | $10.61M | $11.33M | $11.95M | $14.89M | $14.77M | $11.01M | $11.43M |
| Long Term Investments | $101.61M | $101.74M | $100.82M | $147.00M | $103.27M | $104.13M | $104.43M | $105.12M | $106.17M | $106.57M | $108.25M | $109.98M | $114.25M | $114.53M | $117.02M | $214.52M | $211.58M | $208.38M | $205.80M | $204.25M |
| Tax Assets | $23.30M | $20.75M | $22.57M | $22.85M | $22.90M | $28.38M | $25.54M | $36.07M | $255.07M | $81.66M | $536.03M | $16.91M | $14.86M | $23.80M | $540.25M | $166.24M | $166.13M | $-9.09M | $457.46M | $318.00K |
| Other Non-Current Assets | $716.29M | $706.33M | $645.63M | $571.36M | $664.41M | $666.65M | $597.13M | $540.15M | $312.89M | $490.19M | $58.25M | $559.87M | $565.21M | $551.63M | $48.54M | $437.72M | $438.15M | $625.56M | $81.09M | $539.09M |
| Total Non-Current Assets | $6.46B | $6.43B | $6.25B | $6.09B | $6.07B | $6.01B | $5.79B | $5.68B | $5.60B | $5.51B | $5.42B | $5.31B | $5.22B | $5.09B | $4.89B | $4.89B | $4.79B | $4.69B | $4.76B | $4.65B |
| Other Assets | $- | $- | $- | $- | $- | $- | $- | $- | $- | $- | $- | $- | $- | $- | $- | $0 | $- | $- | $- | $- |
| Total Assets | $7.19B | $6.98B | $6.78B | $6.65B | $6.75B | $6.54B | $6.31B | $6.30B | $6.61B | $6.26B | $6.16B | $5.87B | $5.98B | $5.72B | $5.41B | $5.43B | $5.40B | $5.32B | $5.28B | $5.16B |
| Account Payables | $201.92M | $226.75M | $198.82M | $192.47M | $182.66M | $203.93M | $169.52M | $198.69M | $269.46M | $392.48M | $332.35M | $266.78M | $318.99M | $393.06M | $278.76M | $256.14M | $231.41M | $238.24M | $192.46M | $220.57M |
| Short Term Debt | $433.74M | $484.88M | $449.19M | $349.31M | $493.07M | $373.03M | $312.81M | $162.79M | $549.23M | $503.58M | $399.95M | $331.63M | $566.94M | $454.44M | $32.21M | $35.14M | $35.66M | $159.31M | $583.52M | $492.78M |
| Tax Payables | $10.59M | $10.59M | $8.61M | $16.05M | $10.80M | $10.09M | $11.48M | $15.79M | $10.50M | $5.13M | $6.99M | $32.15M | $6.60M | $3.36M | $4.27M | $41.46M | $1.84M | $2.72M | $5.35M | $4.23M |
| Deferred Revenue | $64.81M | $60.17M | $99.57M | $109.70M | $163.98M | $106.31M | $72.73M | $66.77M | $80.52M | $68.79M | $68.27M | $74.40M | $91.52M | $32.59M | $22.70M | $20.76M | $32.95M | $25.93M | $20.06M | $19.33M |
| Other Current Liabilities | $107.61M | $117.00M | $146.34M | $121.57M | $156.98M | $158.16M | $132.67M | $475.30M | $197.51M | $167.41M | $184.10M | $197.47M | $152.39M | $200.56M | $447.40M | $62.56M | $346.76M | $133.46M | $120.93M | $106.77M |
| Total Current Liabilities | $818.66M | $887.77M | $894.35M | $789.10M | $962.03M | $806.60M | $668.95M | $711.48M | $1.07B | $1.10B | $969.43M | $882.14M | $1.10B | $1.05B | $613.63M | $416.07M | $518.67M | $533.72M | $902.26M | $824.35M |
| Long Term Debt | $3.15B | $3.04B | $2.95B | $2.86B | $3.04B | $2.92B | $2.86B | $2.92B | $2.97B | $2.62B | $2.66B | $2.46B | $2.42B | $2.30B | $2.44B | $2.49B | $2.47B | $2.35B | $1.76B | $1.67B |
| Deferred Revenue Non-Current | $32.45M | $5.25M | $588.00K | $612.00K | $635.00K | $659.00K | $30.87M | $40.41M | $49.94M | $753.00K | $776.00K | $5.09M | $14.62M | $847.00K | $871.00K | $894.00K | $987.00K | $1.03M | $1.03M | $1.47M |
| Deferred Tax Liabilities Non-Current | $385.45M | $358.78M | $334.06M | $333.10M | $301.82M | $287.86M | $277.74M | $283.25M | $257.72M | $241.64M | $204.93M | $184.72M | $181.58M | $166.54M | $148.08M | $169.41M | $169.38M | $141.41M | $190.92M | $191.43M |
| Other Non-Current Liabilities | $496.66M | $495.88M | $458.45M | $486.81M | $381.67M | $535.60M | $475.19M | $344.39M | $347.26M | $473.88M | $554.25M | $554.30M | $554.67M | $569.09M | $522.37M | $529.66M | $534.74M | $641.91M | $588.31M | $575.42M |
| Total Non-Current Liabilities | $4.06B | $3.89B | $3.75B | $3.68B | $3.72B | $3.74B | $3.65B | $3.58B | $3.62B | $3.34B | $3.42B | $3.20B | $3.17B | $3.04B | $3.11B | $3.19B | $3.18B | $3.14B | $2.54B | $2.44B |
| Other Liabilities | $- | $- | $- | $- | $- | $- | $- | $- | $- | $- | $- | $- | $- | $- | $- | $- | $- | $- | $- | $- |
| Total Liabilities | $4.88B | $4.78B | $4.64B | $4.47B | $4.68B | $4.55B | $4.32B | $4.30B | $4.69B | $4.44B | $4.39B | $4.09B | $4.26B | $4.09B | $3.73B | $3.60B | $3.70B | $3.67B | $3.44B | $3.27B |
| Preferred Stock | $- | $- | $- | $- | $8.24B | $- | $341.49M | $- | $- | $- | $- | $- | $- | $- | $- | $- | $- | $- | $- | $- |
| Common Stock | $249.98M | $248.16M | $247.23M | $246.37M | $245.01M | $243.46M | $243.24M | $241.92M | $241.84M | $241.62M | $241.60M | $241.59M | $241.27M | $240.64M | $240.57M | $240.50M | $240.37M | $240.24M | $240.23M | $240.22M |
| Retained Earnings | $1.39B | $1.30B | $1.25B | $1.31B | $1.23B | $1.18B | $1.18B | $1.22B | $1.15B | $1.07B | $1.05B | $1.07B | $1.01B | $934.61M | $970.51M | $1.11B | $996.58M | $947.50M | $1.14B | $1.19B |
| Accumulated Other Comprehensive Income Loss | $13.73M | $-6.52M | $217.00K | $322.00K | $12.57M | $10.79M | $-3.91M | $-4.22M | $-4.52M | $-4.83M | $-31.44M | $-32.47M | $-33.50M | $-34.53M | $-41.12M | $-42.20M | $-43.27M | $-44.31M | $-34.60M | $-34.64M |
| Other Total Stockholders Equity | $663.88M | $660.03M | $643.17M | $626.95M | $582.55M | $558.65M | $574.13M | $544.89M | $539.69M | $512.89M | $507.99M | $502.82M | $498.07M | $490.14M | $512.10M | $509.15M | $504.54M | $500.47M | $496.38M | $489.43M |
| Total Stockholders Equity | $2.31B | $2.20B | $2.14B | $2.18B | $2.07B | $1.99B | $2.00B | $2.00B | $1.92B | $1.82B | $1.77B | $1.78B | $1.72B | $1.63B | $1.68B | $1.82B | $1.70B | $1.64B | $1.84B | $1.89B |
| Total Equity | $2.31B | $2.20B | $2.14B | $2.18B | $2.07B | $1.99B | $2.00B | $2.00B | $1.92B | $1.82B | $1.77B | $1.78B | $1.72B | $1.63B | $1.68B | $1.82B | $1.70B | $1.64B | $1.84B | $1.89B |
| Total Liabilities and Stockholders Equity | $7.19B | $6.98B | $6.78B | $6.65B | $6.75B | $6.54B | $6.31B | $6.30B | $6.61B | $6.26B | $6.16B | $5.87B | $5.98B | $5.72B | $5.41B | $5.43B | $5.40B | $5.32B | $5.28B | $5.16B |
| Minority Interest | $- | $- | $- | $- | $- | $- | $- | $- | $- | $- | $- | $- | $- | $- | $- | $- | $- | $- | $- | $- |
| Total Liabilities and Total Equity | $7.19B | $6.98B | $6.78B | $6.65B | $6.75B | $6.54B | $6.31B | $6.30B | $6.61B | $6.26B | $6.16B | $5.87B | $5.98B | $5.72B | $5.41B | $5.43B | $5.40B | $5.32B | $5.28B | $5.16B |
| Total Investments | $101.61M | $101.74M | $100.82M | $147.00M | $103.27M | $104.13M | $104.43M | $105.12M | $106.17M | $106.57M | $108.25M | $109.98M | $114.25M | $114.53M | $117.02M | $214.52M | $211.58M | $208.38M | $205.80M | $204.25M |
| Total Debt | $3.58B | $3.52B | $3.41B | $3.23B | $3.38B | $3.29B | $3.18B | $3.12B | $3.38B | $3.13B | $3.06B | $2.79B | $2.98B | $2.76B | $2.54B | $2.41B | $2.54B | $2.51B | $2.34B | $2.17B |
| Net Debt | $3.58B | $3.52B | $3.39B | $3.20B | $3.38B | $3.29B | $3.18B | $3.10B | $3.38B | $3.13B | $3.04B | $2.78B | $2.98B | $2.75B | $2.53B | $2.35B | $2.51B | $2.40B | $2.30B | $2.14B |
Annual Cash Flow
| Breakdown | September 30, 2024 | September 30, 2023 | September 30, 2022 | September 30, 2021 | September 30, 2020 |
|---|---|---|---|---|---|
| Net Income | $289.77M | $264.72M | $274.92M | $117.89M | $163.01M |
| Depreciation and Amortization | $166.57M | $152.94M | $129.25M | $111.39M | $107.37M |
| Deferred Income Tax | $84.52M | $29.87M | $81.52M | $23.64M | $34.99M |
| Stock Based Compensation | $-1.22M | $- | $14.83M | $7.15M | $6.54M |
| Change in Working Capital | $-89.01M | $91.91M | $-67.72M | $20.49M | $-46.95M |
| Accounts Receivables | $-12.74M | $112.63M | $-16.66M | $-2.41M | $-71.91M |
| Inventory | $-11.09M | $67.44M | $-80.80M | $-25.26M | $-3.25M |
| Accounts Payables | $15.64M | $7.54M | $-34.26M | $30.06M | $20.39M |
| Other Working Capital | $-80.82M | $-95.70M | $64.00M | $18.09M | $7.82M |
| Other Non Cash Items | $-23.22M | $-60.46M | $-109.32M | $-44.59M | $-31.69M |
| Net Cash Provided by Operating Activities | $427.41M | $478.99M | $323.48M | $390.95M | $213.48M |
| Investments in Property Plant and Equipment | $- | $-540.92M | $-598.43M | $-624.61M | $-470.17M |
| Acquisitions Net | $- | $- | $5.48M | $-690.00K | $-2.12M |
| Purchases of Investments | $- | $- | $-5.48M | $-690.00K | $-2.12M |
| Sales Maturities of Investments | $- | $- | $5.48M | $690.00K | $2.12M |
| Other Investing Activities | $-569.07M | $2.29M | $2.34M | $3.18M | $-521.74M |
| Net Cash Used for Investing Activities | $-569.07M | $-538.62M | $-590.61M | $-622.12M | $-994.02M |
| Debt Repayment | $238.14M | $157.45M | $379.68M | $251.62M | $786.54M |
| Common Stock Issued | $74.41M | $57.80M | $14.74M | $15.11M | $230.98M |
| Common Stock Repurchased | $- | $- | $- | $-27.22M | $- |
| Dividends Paid | $-165.06M | $-150.97M | $-127.70M | $-116.96M | $-117.80M |
| Other Financing Activities | $-5.72M | $-4.58M | $-4.18M | $-4.76M | $-3.81M |
| Net Cash Used Provided by Financing Activities | $141.76M | $59.70M | $262.54M | $117.78M | $895.90M |
| Effect of Forex Changes on Cash | $- | $- | $- | $- | $- |
| Net Change in Cash | $95.00K | $65.00K | $-4.59M | $-113.38M | $115.36M |
| Cash at End of Period | $1.61M | $1.52M | $1.45M | $6.04M | $119.42M |
| Cash at Beginning of Period | $1.52M | $1.45M | $6.04M | $119.42M | $4.06M |
| Operating Cash Flow | $427.41M | $478.99M | $323.48M | $390.95M | $213.48M |
| Capital Expenditure | $- | $-540.92M | $-598.43M | $-624.61M | $-470.17M |
| Free Cash Flow | $427.41M | $-61.93M | $-274.95M | $-233.66M | $-256.69M |
Cash Flow Charts
| Breakdown | December 31, 2024 | September 30, 2024 | June 30, 2024 | March 31, 2024 | December 31, 2023 | September 30, 2023 | June 30, 2023 | March 31, 2023 | December 31, 2022 | September 30, 2022 | June 30, 2022 | March 31, 2022 | December 31, 2021 | September 30, 2021 | June 30, 2021 | March 31, 2021 | December 31, 2020 | September 30, 2020 | June 30, 2020 | March 31, 2020 |
|---|---|---|---|---|---|---|---|---|---|---|---|---|---|---|---|---|---|---|---|---|
| Net Income | $131.32M | $91.13M | $-11.57M | $120.81M | $89.41M | $37.02M | $1.53M | $110.25M | $115.92M | $54.52M | $13.05M | $96.03M | $111.31M | $-1.13M | $-111.83M | $149.81M | $81.05M | $43.27M | $-27.22M | $88.50M |
| Depreciation and Amortization | $45.33M | $45.15M | $40.91M | $40.22M | $40.29M | $39.29M | $38.88M | $38.09M | $36.68M | $34.55M | $32.87M | $31.43M | $30.39M | $29.41M | $27.77M | $26.85M | $27.36M | $30.14M | $31.22M | $30.78M |
| Deferred Income Tax | $20.52M | $33.73M | $297.00K | $30.54M | $19.94M | $18.29M | $-25.05M | $24.21M | $12.41M | $44.13M | $20.64M | $2.06M | $14.69M | $18.97M | $-16.10M | $3.02M | $17.74M | $-6.02M | $-3.54M | $-2.92M |
| Stock Based Compensation | $- | $-2.40M | $- | $- | $1.19M | $14.72M | $- | $- | $- | $14.83M | $- | $- | $76.00K | $7.15M | $- | $- | $76.00K | $6.54M | $- | $- |
| Change in Working Capital | $-153.48M | $-92.71M | $- | $105.18M | $-86.19M | $17.56M | $44.66M | $245.80M | $-216.11M | $-31.81M | $-138.90M | $199.30M | $-96.31M | $-34.86M | $-10.35M | $119.32M | $-53.63M | $-34.79M | $-14.52M | $116.89M |
| Accounts Receivables | $-203.09M | $21.59M | $109.99M | $2.06M | $-146.38M | $-1.17M | $64.12M | $238.20M | $-247.08M | $45.18M | $45.64M | $9.53M | $-108.14M | $-6.83M | $55.15M | $15.48M | $-108.14M | $-32.14M | $52.78M | $38.62M |
| Inventory | $5.25M | $-73.73M | $- | $113.22M | $1.95M | $-40.66M | $-77.34M | $167.47M | $17.97M | $-68.13M | $-137.68M | $173.88M | $-48.87M | $-67.90M | $-51.59M | $88.44M | $5.79M | $-45.82M | $-47.92M | $107.54M |
| Accounts Payables | $-45.97M | $17.32M | $- | $20.19M | $-47.80M | $27.69M | $3.94M | $11.27M | $-35.36M | $35.94M | $18.67M | $-44.49M | $-44.37M | $17.41M | $32.28M | $19.61M | $-39.23M | $33.47M | $14.26M | $-265.00K |
| Other Working Capital | $90.33M | $-57.90M | $-125.90M | $-30.28M | $106.03M | $31.69M | $53.94M | $-171.14M | $48.36M | $-44.80M | $-169.33M | $69.92M | $105.08M | $22.46M | $-46.18M | $-4.22M | $87.96M | $9.70M | $-33.65M | $-29.00M |
| Other Non Cash Items | $-52.64M | $-10.38M | $-5.34M | $-43.96M | $-18.22M | $-14.80M | $-2.94M | $13.72M | $-38.41M | $-28.61M | $-4.01M | $39.03M | $-97.57M | $-7.93M | $-22.60M | $-7.97M | $-40.88M | $-13.80M | $-4.49M | $-6.37M |
| Net Cash Provided by Operating Activities | $-8.96M | $64.51M | $24.29M | $307.82M | $46.41M | $91.09M | $44.78M | $432.07M | $-88.95M | $87.60M | $-94.58M | $367.86M | $-37.41M | $49.16M | $-14.49M | $324.57M | $31.72M | $30.70M | $3.64M | $222.21M |
| Investments in Property Plant and Equipment | $- | $-156.70M | $-146.37M | $-114.22M | $-114.62M | $-160.71M | $-117.10M | $-117.19M | $-145.92M | $-157.31M | $-139.80M | $-137.01M | $-164.30M | $-194.70M | $-184.03M | $-136.01M | $-109.88M | $-96.96M | $-129.35M | $-96.13M |
| Acquisitions Net | $- | $- | $- | $- | $- | $- | $- | $- | $- | $- | $- | $- | $- | $- | $-208.00K | $-196.00K | $-286.00K | $-6.59M | $-10.76M | $-5.79M |
| Purchases of Investments | $- | $- | $- | $- | $- | $- | $- | $- | $- | $- | $- | $- | $- | $- | $-208.00K | $49.00K | $- | $- | $- | $- |
| Sales Maturities of Investments | $- | $- | $- | $- | $- | $- | $- | $- | $- | $-1.48M | $1.48M | $4.00M | $- | $- | $- | $- | $- | $- | $- | $- |
| Other Investing Activities | $-19.27M | $-19.79M | $-11.20M | $-8.46M | $830.00K | $258.00K | $662.00K | $1.01M | $361.00K | $3.12M | $-9.16M | $4.23M | $244.00K | $2.45M | $-138.00K | $-542.00K | $1.41M | $496.00K | $279.00K | $-155.03M |
| Net Cash Used for Investing Activities | $-19.27M | $-176.49M | $-157.57M | $-122.68M | $-113.79M | $-160.45M | $-116.44M | $-116.17M | $-145.56M | $-155.67M | $-138.11M | $-132.78M | $-164.05M | $-192.25M | $-184.37M | $-136.75M | $-108.75M | $-103.06M | $-139.84M | $-256.95M |
| Debt Repayment | $61.80M | $116.79M | $176.88M | $-149.10M | $93.57M | $104.81M | $54.22M | $-253.89M | $252.31M | $70.25M | $273.95M | $-193.96M | $229.44M | $193.46M | $173.89M | $-131.65M | $15.92M | $173.90M | $177.28M | $69.95M |
| Common Stock Issued | $23.70M | $15.98M | $15.07M | $21.66M | $21.70M | $3.57M | $28.70M | $3.76M | $21.77M | $3.67M | $3.56M | $3.72M | $3.81M | $3.58M | $3.98M | $3.63M | $3.91M | $3.58M | $5.73M | $5.20M |
| Common Stock Repurchased | $- | $- | $- | $- | $- | $- | $- | $- | $- | $- | $- | $- | $- | $-27.22M | $- | $- | $- | $- | $- | $- |
| Dividends Paid | $-44.75M | $-41.62M | $-41.29M | $-41.17M | $-40.98M | $-37.98M | $-37.79M | $-40.69M | $-34.51M | $-32.01M | $-31.97M | $-31.88M | $-31.84M | $-26.58M | $-29.48M | $-28.99M | $-31.90M | $-31.09M | $-29.89M | $-29.85M |
| Other Financing Activities | $-11.58M | $15.98M | $- | $-27.00K | $-5.00M | $-553.00K | $- | $-382.00K | $-3.64M | $-383.00K | $-57.00K | $-304.00K | $-3.43M | $-119.00K | $-2.48M | $3.37M | $-5.53M | $153.00K | $-73.00K | $-350.00K |
| Net Cash Used Provided by Financing Activities | $29.18M | $90.45M | $150.66M | $-168.64M | $69.29M | $69.85M | $45.13M | $-291.20M | $235.93M | $41.52M | $245.48M | $-222.43M | $197.97M | $143.12M | $145.90M | $-153.64M | $-17.60M | $146.54M | $153.05M | $44.95M |
| Effect of Forex Changes on Cash | $- | $- | $- | $- | $- | $- | $56.28M | $- | $- | $- | $- | $- | $- | $- | $- | $- | $- | $- | $- | $- |
| Net Change in Cash | $951.00K | $-21.52M | $17.39M | $2.28M | $1.91M | $497.00K | $-26.54M | $24.69M | $1.42M | $-26.54M | $12.79M | $12.65M | $-3.49M | $33.00K | $-52.97M | $34.19M | $-94.63M | $74.18M | $16.86M | $10.21M |
| Cash at End of Period | $2.56M | $1.61M | $23.13M | $24.35M | $3.43M | $1.52M | $1.02M | $27.56M | $2.87M | $1.45M | $27.99M | $15.20M | $2.55M | $6.04M | $6.01M | $58.98M | $24.79M | $119.42M | $45.24M | $28.39M |
| Cash at Beginning of Period | $1.61M | $23.13M | $5.75M | $22.07M | $1.52M | $1.02M | $27.56M | $2.87M | $1.45M | $27.99M | $15.20M | $2.55M | $6.04M | $6.01M | $58.98M | $24.79M | $119.42M | $45.24M | $28.39M | $18.18M |
| Operating Cash Flow | $-8.96M | $64.51M | $24.29M | $307.82M | $46.41M | $91.09M | $44.78M | $432.07M | $-88.95M | $87.60M | $-94.58M | $367.86M | $-37.41M | $49.16M | $-14.49M | $324.57M | $31.72M | $30.70M | $3.64M | $222.21M |
| Capital Expenditure | $- | $-175.53M | $-146.37M | $-114.22M | $-114.62M | $-160.71M | $-117.10M | $-117.19M | $-145.92M | $-157.31M | $-139.80M | $-137.01M | $-164.30M | $-194.70M | $-184.03M | $-136.01M | $-109.88M | $-96.96M | $-129.35M | $-96.13M |
| Free Cash Flow | $-8.96M | $-111.02M | $-135.95M | $193.60M | $-68.21M | $-69.61M | $-72.33M | $314.88M | $-234.87M | $-69.71M | $-234.38M | $230.85M | $-201.71M | $-145.54M | $-198.52M | $188.56M | $-78.16M | $-66.26M | $-125.72M | $126.08M |

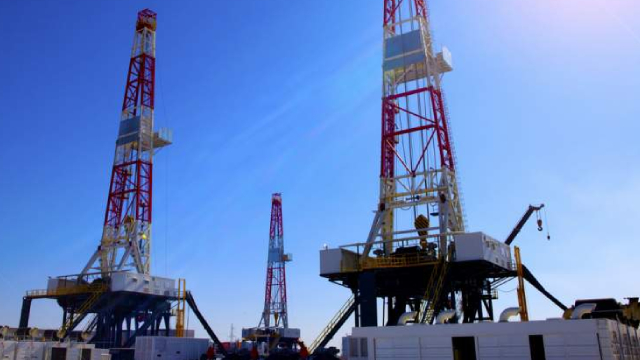
New Jersey Resources Corporation, an energy services holding company, provides regulated gas distribution, and retail and wholesale energy services. The company operates through four segments: Natural Gas Distribution, Clean Energy Ventures, Energy Services, and Storage and Transportation. The Natural Gas Distribution segment offers regulated natural gas utility services to approximately 564,000 residential and commercial customers throughout Burlington, Middlesex, Monmouth, Morris, Ocean, and Sussex counties in New Jersey; provides capacity and storage management services; and participates in the off-system sales and capacity release markets. The Clean Energy Ventures segment invests in, owns, and operates commercial and residential solar projects situated in New Jersey, Connecticut, Rhode Island, and New York. The Energy Services segment offers unregulated wholesale energy management services to other energy companies and natural gas producers, as well as maintains and transacts a portfolio of physical assets consisting of natural gas storage and transportation contracts in the United States and Canada. The Storage and Transportation segment invests in natural gas transportation and storage facilities. It provides heating, ventilation, and cooling services; holds commercial real estate properties; and offers solar equipment installation, and plumbing repair and installation services, as well as engages in the water appliance sale, installation, and servicing activities. The company was incorporated in 1981 and is headquartered in Wall, New Jersey.
$49.07
Stock Price
$4.92B
Market Cap
1.37K
Employees
Wall, NJ
Location
Revenue (FY 2024)
$1.80B
-8.5% YoY
Net Income (FY 2024)
$289.77M
9.5% YoY
EPS (FY 2024)
$2.92
7.7% YoY
Free Cash Flow (FY 2024)
$427.41M
790.2% YoY
Profitability
Gross Margin
38.8%
Net Margin
16.1%
ROE
13.2%
ROA
4.2%
Valuation
P/E Ratio
16.07
P/S Ratio
2.59
EV/EBITDA
12.18
Market Cap
$4.92B
Revenue & Net Income
Profit Margins
Cash Flow Summary
Operating Cash Flow
$427.41M
-10.8% YoY
Free Cash Flow
$427.41M
790.2% YoY
Balance Sheet Summary
Total Assets
$6.98B
6.8% YoY
Total Debt
$3.52B
7.2% YoY
Shareholder Equity
$2.20B
8.7% YoY
Dividend Overview
$0.45
Latest Dividend
%
Dividend Yield
%
Payout Ratio
Recent Dividend History
| Date | Amount | Type |
|---|---|---|
| 2025-06-10 | $0.45 | June 10, 25 |
| 2025-03-11 | $0.45 | March 11, 25 |
| 2024-12-11 | $0.45 | December 11, 24 |
| 2024-09-23 | $0.45 | September 23, 24 |
| 2024-06-12 | $0.42 | June 12, 24 |
| 2024-03-12 | $0.42 | March 12, 24 |
| 2023-12-12 | $0.42 | December 12, 23 |
| 2023-09-19 | $0.42 | September 19, 23 |
| 2023-06-13 | $0.39 | June 13, 23 |
| 2023-03-14 | $0.39 | March 14, 23 |
New Jersey Resources Dividends
Explore New Jersey Resources's dividend history, including dividend yield, payout ratio, and historical payments.
Dividend Yield
3.55%
Dividend Payout Ratio
56.96%
Dividend Paid & Capex Coverage Ratio
2.59x
New Jersey Resources Dividend History
| Dividend | Adjusted Dividend | Date | Record Date | Payment Date | Declaration Date |
|---|---|---|---|---|---|
| $0.45 | $0.45 | June 10, 2025 | June 10, 2025 | July 01, 2025 | April 16, 2025 |
| $0.45 | $0.45 | March 11, 2025 | March 11, 2025 | April 01, 2025 | January 22, 2025 |
| $0.45 | $0.45 | December 11, 2024 | December 11, 2024 | January 02, 2025 | November 07, 2024 |
| $0.45 | $0.45 | September 23, 2024 | September 23, 2024 | October 01, 2024 | September 11, 2024 |
| $0.42 | $0.42 | June 12, 2024 | June 12, 2024 | July 01, 2024 | April 18, 2024 |
| $0.42 | $0.42 | March 12, 2024 | March 13, 2024 | April 01, 2024 | January 24, 2024 |
| $0.42 | $0.42 | December 12, 2023 | December 13, 2023 | January 02, 2024 | November 16, 2023 |
| $0.42 | $0.42 | September 19, 2023 | September 20, 2023 | October 02, 2023 | July 12, 2023 |
| $0.39 | $0.39 | June 13, 2023 | June 14, 2023 | July 03, 2023 | April 05, 2023 |
| $0.39 | $0.39 | March 14, 2023 | March 15, 2023 | April 03, 2023 | January 25, 2023 |
| $0.39 | $0.39 | December 13, 2022 | December 14, 2022 | January 03, 2023 | November 10, 2022 |
| $0.39 | $0.39 | September 23, 2022 | September 26, 2022 | October 03, 2022 | July 14, 2022 |
| $0.363 | $0.3625 | June 14, 2022 | June 15, 2022 | July 01, 2022 | April 20, 2022 |
| $0.363 | $0.3625 | March 15, 2022 | March 16, 2022 | April 01, 2022 | January 25, 2022 |
| $0.363 | $0.3625 | December 14, 2021 | December 15, 2021 | January 03, 2022 | November 10, 2021 |
| $0.363 | $0.3625 | September 17, 2021 | September 20, 2021 | October 01, 2021 | July 14, 2021 |
| $0.333 | $0.3325 | June 15, 2021 | June 16, 2021 | July 01, 2021 | April 20, 2021 |
| $0.3325 | $0.3325 | March 16, 2021 | March 17, 2021 | April 01, 2021 | January 19, 2021 |
| $0.3325 | $0.3325 | December 15, 2020 | December 16, 2020 | January 04, 2021 | November 11, 2020 |
| $0.333 | $0.3325 | September 21, 2020 | September 22, 2020 | October 01, 2020 | July 14, 2020 |
New Jersey Resources News
Read the latest news about New Jersey Resources, including recent articles, headlines, and updates.

New Jersey Natural Gas Expands Workforce Development Programs with Isles, Inc.
WALL, N.J.--(BUSINESS WIRE)--New Jersey Natural Gas (NJNG) today announced the opening of the company's SAVEGREEN® Innovation and Training Annex in Atlantic Highlands, New Jersey, Monmouth County. The facility exemplifies NJNG's role as a leader in innovation and energy efficiency in the state and will serve as the hub for an enhanced Workforce Development Program in collaboration with Isles, Inc., a community development and environmental nonprofit organization based in Trenton, New Jersey, an.


New Jersey Resources Highlights the Success of the Coastal Climate Initiative in Celebration of Earth Day
WALL, N.J.--(BUSINESS WIRE)--Created to help raise awareness about important environmental issues affecting the world around us, Earth Day has grown into a call to action to promote conservation, advance environmental sustainability best practices and protect the planet. For 55 years it has been inspiring people to get involved and help make a difference in their local communities. New Jersey Resources (NYSE: NJR), the parent company of New Jersey Natural Gas (NJNG), has worked to answer this c.

William T. Yardley Elected to the Board of Directors of New Jersey Resources
WALL, N.J.--(BUSINESS WIRE)--The board of directors of New Jersey Resources (NYSE: NJR) today announced the unanimous election of William T. Yardley to the board, effective July 1, 2025. “Bill Yardley is a proven leader in the energy industry,” said Steve Westhoven, president and CEO of New Jersey Resources. “His extensive experience with pipeline infrastructure, regulatory strategy, policy and innovation will be an asset to our company, and I am confident the strategic guidance and insight he.

New Jersey Resources Schedules Fiscal 2025 Second Quarter Earnings Call
WALL, N.J.--(BUSINESS WIRE)--New Jersey Resources (NYSE: NJR) invites investors, customers, members of the financial community and other interested parties to listen to a live webcast of its fiscal 2025 second quarter financial results on Tuesday, May 6, 2025, at 10 a.m. ET. New Jersey Resources will release these results on Monday, May 5, 2025, after the close of the stock market. A few minutes prior to the webcast, visit www.njresources.com and select “Investor Relations.” Scroll down and cli.


4 Gas Distribution Stocks to Accumulate in a Thriving Industry
Ongoing increases in natural gas export volumes and regular investment in pipelines are driving the Zacks Gas Distribution industry's near-term prospects. Utilities with stable infrastructure like ATO, SWX, NJR and CPK are well-poised to gain.

New Jersey Resources Appears Well-Positioned For Double-Digit Returns
New Jersey Resources shows consistent earnings growth, rising dividends, and a positive track record with its state utility board when rate increases are necessary. NJR not only looks attractive as a stand-alone investment idea for conservative investors, but it also appears to be leading its peers in a number of financial metrics. Demand for natural gas is expected to rise by 3% in 2025 and another 2.5% in 2026. In 2024, consumption set new records in both the summer and winter months.


Nebius accelerates US expansion, adding up to 300 MW capacity at new data center in New Jersey
AMSTERDAM--(BUSINESS WIRE)--Nebius Group N.V. (“Nebius Group” or the “Company”; NASDAQ: NBIS), a leading AI infrastructure company, today announced a major upgrade to its US-based cloud computing capacity with the planned construction of a new data center in New Jersey with capacity of up to 300 MW. The data center that Nebius has commissioned in New Jersey will be built to Nebius's own design, enabling the company to achieve maximum efficiency and offer superlative performance to customers. Th.


New Jersey Resources Corporation (NJR) Q1 2025 Earnings Call Transcript
New Jersey Resources Corporation (NYSE:NJR ) Q1 2025 Earnings Conference Call February 4, 2025 10:00 AM ET Company Participants Adam Prior – Director-Investor Relations Steve Westhoven – President and Chief Executive Officer Roberto Bel – Senior Vice President and Chief Financial Officer Pat Migliaccio – Senior Vice President and Chief Operating Officer-New Jersey Natural Gas Conference Call Participants Shar Pourreza – Guggenheim Securities Richard Sunderland – JPMorgan Gabe Moreen – Mizuho Travis Miller – Morningstar Operator Thank you for standing by. My name is Prilla, and I will be your conference operator today.


New Jersey Resources Reports Fiscal 2025 First-Quarter Results
WALL, N.J.--(BUSINESS WIRE)--New Jersey Resources Corporation (NYSE: NJR) today reported financial and operating results for its fiscal 2025 first quarter ended December 31, 2024. Regulatory and Operating Highlights During the first quarter of fiscal 2025, New Jersey Natural Gas (NJNG) received approval from the New Jersey Board of Public Utilities (BPU) on the settlement of its base rate case, authorizing a $157.0 million annual increase to its base rates, with rates effective on November 21,.


New Jersey Resources Board of Directors Declares Quarterly Dividend
WALL, N.J.--(BUSINESS WIRE)--The board of directors (the “Board”) of New Jersey Resources Corporation (NYSE: NJR) unanimously declared a quarterly dividend on its common stock of $0.45 per share. The dividend will be payable on April 1, 2025, to shareowners of record as of March 11, 2025. NJR has paid quarterly dividends continuously since its inception in 1952, and has raised the dividend every year for the last 29 years. About New Jersey Resources New Jersey Resources (NYSE: NJR) is a Fortune.

New Jersey Resources Hosts 72nd Annual Meeting
WALL, N.J.--(BUSINESS WIRE)--New Jersey Resources (NYSE: NJR), today hosted its 72nd Annual Shareowners Meeting. At the virtual meeting, shareowners elected Gregory E. Aliff, Thomas C. O'Connor and Michael A. O'Sullivan to NJR's board of directors each for a three-year term that will expire in 2028. “I appreciate our shareowners' support for our directors and confidence in our company,” said Steve Westhoven, President and CEO of New Jersey Resources. “The expertise of Greg, Tom and Mike is an a.

New Jersey Resources Announces $50,000 Pledge to Launch Rutgers University's First Vibrant Communities Sustainability & Resiliency Project
WALL, N.J.--(BUSINESS WIRE)--New Jersey Resources (NYSE: NJR), the parent company of New Jersey Natural Gas (NJNG), today announced a new collaborative effort with Rutgers University and its School of Environmental and Biological Sciences to advance the University's “Vibrant Communities” program. NJR committed $50,000 from its Coastal Climate Initiative (CCI) to support the inaugural Vibrant Communities program's sustainability and resiliency project. The CCI supports projects and programs desi.

3 Gas Distribution Stocks to Watch From a Flourishing Industry
Increased natural gas export volumes and regular investment in pipelines are driving the Zacks Gas Distribution industry's near-term prospects. Utilities with stable infrastructure like ATO, MDU and NJR can provide reliable services to customers and benefit from a positive industry outlook.


Similar Companies
Related Metrics
Explore detailed financial metrics and analysis for NJR.