Nova Royalty Key Executives
This section highlights Nova Royalty's key executives, including their titles and compensation details.
Find Contacts at Nova Royalty
(Showing 0 of )
Nova Royalty Earnings
This section highlights Nova Royalty's earnings, including key dates, EPS, earnings reports, and earnings call transcripts.
Next Earnings Date
Last Earnings Results
Earnings Call Transcripts
| Transcript | Quarter | Year | Date | Estimated EPS | Actual EPS |
|---|

$1.09
Stock Price
$102.51M
Market Cap
-
Employees
Vancouver, BC
Location
Financial Statements
Access annual & quarterly financial statements for Nova Royalty, including income statements, balance sheets, and cash flow statements..
Annual Income Statement
| Breakdown | December 31, 2022 | December 31, 2021 | December 31, 2020 | December 31, 2019 |
|---|---|---|---|---|
| Revenue | $2.00M | $703.04K | $2.06K | $5.00K |
| Cost of Revenue | $1.20M | $395.83K | $- | $- |
| Gross Profit | $795.79K | $307.21K | $2.06K | $5.00K |
| Gross Profit Ratio | 39.86% | 43.70% | 100.00% | 100.00% |
| Research and Development Expenses | $- | $- | $- | $- |
| General and Administrative Expenses | $7.54M | $6.27M | $3.38M | $930.86K |
| Selling and Marketing Expenses | $- | $- | $- | $- |
| Selling General and Administrative Expenses | $7.54M | $6.27M | $3.38M | $930.86K |
| Other Expenses | $-201 | $-18.30K | $-40.45K | $-2.37K |
| Operating Expenses | $7.54M | $6.27M | $3.38M | $930.86K |
| Cost and Expenses | $8.74M | $6.67M | $3.38M | $930.86K |
| Interest Income | $- | $- | $- | $- |
| Interest Expense | $1.08M | $838.04K | $90.60K | $- |
| Depreciation and Amortization | $1.20M | $395.83K | $-40.45K | $-2.37K |
| EBITDA | $-5.54M | $-5.59M | $-3.42M | $-928.23K |
| EBITDA Ratio | -277.66% | -794.44% | -165932.19% | -18564.58% |
| Operating Income | $-6.74M | $-5.96M | $-3.38M | $-925.86K |
| Operating Income Ratio | -337.79% | -848.14% | -163971.59% | -18517.16% |
| Total Other Income Expenses Net | $-1.16M | $-3.47M | $-85.06K | $-1.58K |
| Income Before Tax | $-7.90M | $-9.43M | $-3.47M | $-927.44K |
| Income Before Tax Ratio | -395.75% | -1341.71% | -168094.86% | -18548.80% |
| Income Tax Expense | $-5.49K | $-8.55K | $-46.81K | $- |
| Net Income | $-7.90M | $-9.42M | $-3.42M | $-927.44K |
| Net Income Ratio | -395.48% | -1340.49% | -165825.93% | -18548.80% |
| EPS | $-0.09 | $-0.12 | $-0.11 | $-0.02 |
| EPS Diluted | $-0.09 | $-0.12 | $-0.11 | $-0.02 |
| Weighted Average Shares Outstanding | 85.32M | 77.36M | 31.14M | 38.50M |
| Weighted Average Shares Outstanding Diluted | 85.32M | 77.36M | 31.14M | 38.50M |
| SEC Filing | Source | Source | Source | Source |
| Breakdown | September 30, 2023 | June 30, 2023 | March 31, 2023 | December 31, 2022 | September 30, 2022 | June 30, 2022 | March 31, 2022 | December 31, 2021 | September 30, 2021 | June 30, 2021 | March 31, 2021 | December 31, 2020 | September 30, 2020 | June 30, 2020 | March 31, 2020 | December 31, 2019 | September 30, 2019 | June 30, 2019 |
|---|---|---|---|---|---|---|---|---|---|---|---|---|---|---|---|---|---|---|
| Revenue | $555.32K | $520.26K | $591.85K | $508.17K | $344.15K | $470.79K | $673.52K | $517.08K | $181.90K | $2.00K | $2.07K | $2.06K | $- | $- | $- | $5.00K | $- | $- |
| Cost of Revenue | $442.44K | $397.38K | $380.14K | $367.17K | $330.01K | $243.08K | $260.58K | $294.11K | $101.72K | $- | $- | $- | $- | $- | $- | $- | $- | $- |
| Gross Profit | $112.88K | $122.88K | $211.72K | $141.00K | $14.14K | $227.70K | $412.94K | $222.97K | $80.18K | $2.00K | $2.07K | $2.06K | $- | $- | $- | $5.00K | $- | $- |
| Gross Profit Ratio | 20.30% | 23.60% | 35.80% | 27.70% | 4.10% | 48.40% | 61.30% | 43.10% | 44.10% | 100.00% | 100.00% | 100.00% | 0.00% | 0.00% | 0.00% | 100.00% | 0.00% | 0.00% |
| Research and Development Expenses | $- | $- | $- | $- | $- | $- | $- | $- | $- | $- | $- | $- | $- | $- | $- | $- | $- | $- |
| General and Administrative Expenses | $3.29M | $2.00M | $1.61M | $1.69M | $1.97M | $1.91M | $1.97M | $2.61M | $1.49M | $1.23M | $936.12K | $1.29M | $1.01M | $420.84K | $667.49K | $348.94K | $241.79K | $236.03K |
| Selling and Marketing Expenses | $- | $- | $- | $- | $- | $- | $- | $- | $- | $- | $- | $- | $- | $- | $- | $- | $- | $- |
| Selling General and Administrative Expenses | $3.29M | $2.00M | $1.61M | $1.69M | $1.97M | $1.91M | $1.97M | $2.61M | $1.49M | $1.23M | $936.12K | $1.29M | $1.01M | $420.84K | $667.49K | $348.94K | $241.79K | $236.03K |
| Other Expenses | $- | $- | $- | $-31 | $-34 | $-25 | $-104 | $60 | $-1.75K | $-3.33K | $-66.54K | $- | $- | $- | $- | $- | $- | $- |
| Operating Expenses | $3.32M | $2.08M | $1.83M | $1.69M | $1.97M | $1.91M | $1.97M | $2.61M | $1.49M | $1.23M | $936.12K | $1.29M | $1.01M | $420.84K | $667.49K | $348.94K | $241.79K | $236.03K |
| Cost and Expenses | $3.76M | $2.47M | $2.21M | $2.06M | $2.30M | $2.16M | $2.23M | $2.90M | $1.59M | $1.23M | $936.12K | $1.29M | $1.01M | $420.84K | $667.49K | $348.94K | $241.79K | $236.03K |
| Interest Income | $- | $- | $- | $- | $- | $- | $- | $- | $- | $- | $- | $- | $- | $- | $- | $- | $- | $- |
| Interest Expense | $429.68K | $356.71K | $350.16K | $327.67K | $275.40K | $254.23K | $227.38K | $210.13K | $209.16K | $205.96K | $159.53K | $- | $- | $- | $- | $- | $- | $- |
| Depreciation and Amortization | $442.44K | $397.38K | $380.14K | $367.17K | $330.01K | $243.08K | $260.58K | $294.11K | $-1.75K | $-3.33K | $-66.54K | $8.52K | $26.52K | $51.75K | $47.30K | $-35.64K | $34.46K | $-49 |
| EBITDA | $-2.77M | $-1.56M | $-1.24M | $-1.18M | $-1.62M | $-1.44M | $-1.29M | $-2.09M | $-1.41M | $-1.24M | $-1.00M | $-1.28M | $-983.22K | $-369.10K | $-667.49K | $-379.58K | $-207.33K | $-236.08K |
| EBITDA Ratio | -498.17% | -299.33% | -209.57% | -233.14% | -471.47% | -306.43% | -192.15% | -404.40% | -776.56% | -61958.25% | -48267.34% | -61858.12% | 0.00% | 0.00% | 0.00% | -7591.60% | 0.00% | 0.00% |
| Operating Income | $-3.21M | $-2.43M | $-1.62M | $-1.55M | $-1.95M | $-1.69M | $-1.55M | $-2.39M | $-1.41M | $-1.23M | $-934.04K | $-1.28M | $-1.01M | $-420.84K | $-667.49K | $-343.94K | $-241.79K | $-236.03K |
| Operating Income Ratio | -577.85% | -467.50% | -273.80% | -305.38% | -567.35% | -358.06% | -230.83% | -461.29% | -775.60% | -61791.53% | -45057.60% | -62271.11% | 0.00% | 0.00% | 0.00% | -6878.86% | 0.00% | 0.00% |
| Total Other Income Expenses Net | $-423.03K | $-366.14K | $-363.02K | $-317.97K | $-354.93K | $-278.98K | $-205.09K | $-2.86M | $-262.52K | $-117.17K | $-235.22K | $-134.03K | $-26.52K | $-51.75K | $127.24K | $31.68K | $-34.46K | $49 |
| Income Before Tax | $-3.63M | $-2.80M | $-1.98M | $-1.87M | $-2.31M | $-1.96M | $-1.76M | $-5.24M | $-1.67M | $-1.35M | $-1.17M | $-1.42M | $-1.04M | $-472.59K | $-540.25K | $-312.26K | $-276.25K | $-235.98K |
| Income Before Tax Ratio | -654.02% | -537.88% | -335.13% | -367.95% | -670.48% | -417.32% | -261.28% | -1013.45% | -919.92% | -67664.71% | -56404.44% | -68767.96% | 0.00% | 0.00% | 0.00% | -6245.18% | 0.00% | 0.00% |
| Income Tax Expense | $19.96K | $-36.03K | $-24.08K | $7.91K | $7.23K | $-8.41K | $-12.22K | $3.88K | $3.63K | $3.31K | $-19.37K | $43.79K | $- | $- | $- | $- | $- | $- |
| Net Income | $-3.65M | $-2.76M | $-1.96M | $-1.88M | $-2.31M | $-1.96M | $-1.75M | $-5.24M | $-1.68M | $-1.35M | $-1.15M | $-1.37M | $-1.04M | $-472.59K | $-540.25K | $-312.26K | $-276.25K | $-235.98K |
| Net Income Ratio | -657.62% | -530.96% | -331.07% | -369.51% | -672.58% | -415.53% | -259.46% | -1014.20% | -921.92% | -67830.58% | -55470.00% | -66499.03% | 0.00% | 0.00% | 0.00% | -6245.18% | 0.00% | 0.00% |
| EPS | $-0.04 | $-0.03 | $-0.02 | $-0.02 | $-0.03 | $-0.02 | $-0.02 | $-0.06 | $-0.02 | $-0.02 | $-0.02 | $-0.02 | $-0.03 | $-0.01 | $-0.01 | $-0.01 | $-0.01 | $-0.01 |
| EPS Diluted | $-0.04 | $-0.03 | $-0.02 | $-0.02 | $-0.03 | $-0.02 | $-0.02 | $-0.06 | $-0.02 | $-0.02 | $-0.02 | $-0.02 | $-0.03 | $-0.01 | $-0.01 | $-0.01 | $-0.01 | $-0.01 |
| Weighted Average Shares Outstanding | 93.83M | 89.94M | 87.44M | 86.67M | 85.02M | 85.08M | 84.72M | 84.22M | 78.49M | 76.40M | 68.21M | 57.98M | 38.50M | 38.50M | 38.50M | 38.50M | 38.50M | 38.50M |
| Weighted Average Shares Outstanding Diluted | 93.83M | 89.94M | 87.44M | 86.67M | 85.02M | 85.08M | 84.72M | 84.22M | 78.49M | 76.40M | 68.21M | 57.98M | 38.50M | 38.50M | 38.50M | 38.50M | 38.50M | 38.50M |
| SEC Filing | Source | Source | Source | Source | Source | Source | Source | Source | Source | Source | Source | Source | Source | Source | Source | Source | Source | Source |
Annual Balance Sheet
| Breakdown | December 31, 2022 | December 31, 2021 | December 31, 2020 | December 31, 2019 |
|---|---|---|---|---|
| Cash and Cash Equivalents | $1.09M | $962.75K | $5.40M | $157.10K |
| Short Term Investments | $- | $- | $- | $- |
| Cash and Short Term Investments | $1.09M | $962.75K | $5.40M | $157.10K |
| Net Receivables | $880.26K | $1.00M | $75.48K | $6.89K |
| Inventory | $- | $- | $- | $- |
| Other Current Assets | $- | $- | $- | $- |
| Total Current Assets | $2.08M | $2.18M | $5.56M | $168.16K |
| Property Plant Equipment Net | $- | $- | $29.86M | $3.52M |
| Goodwill | $- | $- | $- | $- |
| Intangible Assets | $- | $- | $- | $- |
| Goodwill and Intangible Assets | $- | $- | $- | $- |
| Long Term Investments | $85.99M | $83.35M | $29.86M | $3.52M |
| Tax Assets | $- | $- | $- | $- |
| Other Non-Current Assets | $82.06K | $291.54K | $-29.78M | $-3.47M |
| Total Non-Current Assets | $86.07M | $83.64M | $29.94M | $3.57M |
| Other Assets | $- | $- | $- | $- |
| Total Assets | $88.15M | $85.82M | $35.50M | $3.74M |
| Account Payables | $224.82K | $639.07K | $3.77M | $262.19K |
| Short Term Debt | $- | $- | $- | $- |
| Tax Payables | $- | $- | $- | $- |
| Deferred Revenue | $- | $- | $- | $- |
| Other Current Liabilities | $2.07M | $1.85M | $- | $- |
| Total Current Liabilities | $2.30M | $2.49M | $3.77M | $262.19K |
| Long Term Debt | $9.15M | $4.90M | $3.03M | $- |
| Deferred Revenue Non-Current | $- | $- | $- | $- |
| Deferred Tax Liabilities Non-Current | $- | $- | $- | $- |
| Other Non-Current Liabilities | $-9.15M | $-4.90M | $637.05K | $- |
| Total Non-Current Liabilities | $9.15M | $4.90M | $3.66M | $- |
| Other Liabilities | $- | $- | $- | $- |
| Total Liabilities | $11.45M | $7.39M | $7.43M | $262.19K |
| Preferred Stock | $- | $- | $- | $2.70M |
| Common Stock | $92.24M | $88.86M | $31.13M | $3.70M |
| Retained Earnings | $-21.75M | $-13.85M | $-4.43M | $-1.01M |
| Accumulated Other Comprehensive Income Loss | $- | $3.39M | $1.33M | $775.15K |
| Other Total Stockholders Equity | $6.21M | $28.57K | $28.57K | $-2.70M |
| Total Stockholders Equity | $76.70M | $78.43M | $28.06M | $3.47M |
| Total Equity | $76.70M | $78.43M | $28.06M | $3.47M |
| Total Liabilities and Stockholders Equity | $88.15M | $85.82M | $35.50M | $3.74M |
| Minority Interest | $- | $- | $- | $- |
| Total Liabilities and Total Equity | $88.15M | $85.82M | $35.50M | $3.74M |
| Total Investments | $85.99M | $83.35M | $29.86M | $3.52M |
| Total Debt | $9.15M | $4.90M | $3.03M | $- |
| Net Debt | $8.06M | $3.94M | $-2.37M | $-157.10K |
Balance Sheet Charts
| Breakdown | September 30, 2023 | June 30, 2023 | March 31, 2023 | December 31, 2022 | September 30, 2022 | June 30, 2022 | March 31, 2022 | December 31, 2021 | September 30, 2021 | June 30, 2021 | March 31, 2021 | December 31, 2020 | September 30, 2020 | June 30, 2020 | December 31, 2019 |
|---|---|---|---|---|---|---|---|---|---|---|---|---|---|---|---|
| Cash and Cash Equivalents | $820.18K | $2.30M | $3.11M | $1.09M | $1.37M | $936.58K | $716.93K | $962.75K | $2.22M | $710.78K | $2.64M | $5.40M | $2.38M | $2.46M | $157.10K |
| Short Term Investments | $- | $- | $- | $- | $- | $- | $- | $- | $- | $- | $- | $- | $- | $- | $- |
| Cash and Short Term Investments | $820.18K | $2.30M | $3.11M | $1.09M | $1.37M | $936.58K | $716.93K | $962.75K | $2.22M | $710.78K | $2.64M | $5.40M | $2.38M | $2.46M | $157.10K |
| Net Receivables | $599.29K | $1.11M | $636.80K | $880.26K | $397.57K | $1.19M | $730.74K | $1.00M | $483.79K | $114.54K | $103.12K | $75.48K | $22.27K | $22.75K | $6.89K |
| Inventory | $- | $- | $- | $- | $- | $- | $- | $- | $- | $- | $- | $- | $- | $- | $- |
| Other Current Assets | $- | $- | $- | $- | $- | $- | $- | $- | $- | $- | $- | $- | $- | $- | $- |
| Total Current Assets | $1.57M | $3.74M | $4.25M | $2.08M | $2.19M | $2.78M | $1.93M | $2.18M | $2.85M | $1.01M | $2.95M | $5.56M | $2.42M | $2.50M | $168.16K |
| Property Plant Equipment Net | $- | $- | $- | $- | $- | $- | $- | $- | $- | $- | $64.95M | $29.86M | $7.87M | $7.87M | $3.52M |
| Goodwill | $- | $- | $- | $- | $- | $- | $- | $- | $- | $- | $- | $- | $- | $- | $- |
| Intangible Assets | $- | $- | $- | $- | $- | $- | $- | $- | $- | $- | $- | $- | $- | $- | $- |
| Goodwill and Intangible Assets | $- | $- | $- | $- | $- | $- | $- | $- | $- | $- | $- | $- | $- | $- | $- |
| Long Term Investments | $- | $92.17M | $85.69M | $85.99M | $86.32M | $- | $- | $- | $- | $- | $- | $- | $- | $- | $- |
| Tax Assets | $- | $- | $- | $- | $- | $- | $- | $- | $- | $- | $- | $- | $- | $- | $- |
| Other Non-Current Assets | $97.96M | $- | $-85.69M | $82.06K | $- | $86.56M | $86.85M | $83.64M | $84.11M | $72.29M | $- | $75.66K | $271.42K | $- | $46.15K |
| Total Non-Current Assets | $97.96M | $92.17M | $85.69M | $86.07M | $86.32M | $86.56M | $86.85M | $83.64M | $84.11M | $72.29M | $64.95M | $29.94M | $8.14M | $7.87M | $3.57M |
| Other Assets | $- | $- | $- | $- | $- | $- | $- | $- | $- | $- | $- | $- | $- | $- | $- |
| Total Assets | $99.52M | $95.91M | $89.95M | $88.15M | $88.51M | $89.34M | $88.78M | $85.82M | $86.96M | $73.30M | $67.90M | $35.50M | $10.56M | $10.37M | $3.74M |
| Account Payables | $626.06K | $132.50K | $441.42K | $224.82K | $431.82K | $317.72K | $246.69K | $639.07K | $1.87M | $1.68M | $2.47M | $3.77M | $200.62K | $198.37K | $262.19K |
| Short Term Debt | $14.33M | $- | $- | $- | $- | $- | $- | $- | $- | $- | $- | $- | $- | $- | $- |
| Tax Payables | $- | $- | $- | $- | $- | $- | $- | $- | $- | $- | $- | $- | $- | $- | $- |
| Deferred Revenue | $- | $- | $- | $- | $- | $- | $- | $- | $- | $- | $- | $- | $- | $- | $- |
| Other Current Liabilities | $2.91M | $1.48M | $1.60M | $2.07M | $3.15M | $2.91M | $3.02M | $1.85M | $- | $- | $- | $- | $1.15M | $1.04M | $- |
| Total Current Liabilities | $17.86M | $1.61M | $2.05M | $2.30M | $3.58M | $3.22M | $3.27M | $2.49M | $1.87M | $1.68M | $2.47M | $3.77M | $1.35M | $1.24M | $262.19K |
| Long Term Debt | $- | $13.90M | $11.02M | $9.15M | $8.31M | $8.10M | $6.48M | $4.90M | $4.76M | $4.63M | $4.50M | $3.03M | $- | $- | $- |
| Deferred Revenue Non-Current | $- | $- | $- | $- | $- | $- | $- | $- | $- | $- | $- | $- | $- | $- | $- |
| Deferred Tax Liabilities Non-Current | $- | $- | $- | $- | $- | $- | $- | $- | $- | $- | $- | $- | $- | $- | $- |
| Other Non-Current Liabilities | $- | $-13.90M | $-11.02M | $-9.15M | $-8.31M | $- | $- | $- | $637.05K | $619.70K | $634.25K | $637.05K | $- | $- | $- |
| Total Non-Current Liabilities | $- | $13.90M | $11.02M | $9.15M | $8.31M | $8.10M | $6.48M | $4.90M | $5.40M | $5.25M | $5.13M | $3.66M | $- | $- | $- |
| Other Liabilities | $- | $- | $- | $- | $- | $- | $- | $- | $- | $- | $- | $- | $- | $- | $- |
| Total Liabilities | $17.86M | $15.51M | $13.07M | $11.45M | $11.89M | $11.32M | $9.75M | $7.39M | $7.28M | $6.93M | $7.60M | $7.43M | $1.35M | $1.24M | $262.19K |
| Preferred Stock | $- | $- | $- | $- | $- | $- | $- | $- | $- | $- | $- | $- | $- | $- | $- |
| Common Stock | $103.54M | $99.50M | $94.37M | $92.24M | $90.77M | $90.65M | $90.57M | $88.86M | $86.11M | $71.80M | $64.44M | $31.13M | $10.51M | $4.46M | $3.70M |
| Retained Earnings | $-30.12M | $-26.47M | $-23.71M | $-21.75M | $-19.87M | $-17.55M | $-15.60M | $-13.85M | $-8.61M | $-6.93M | $-5.58M | $-4.43M | $-3.05M | $-2.02M | $-1.01M |
| Accumulated Other Comprehensive Income Loss | $- | $- | $- | $- | $5.69M | $4.89M | $4.03M | $3.39M | $2.15M | $1.36M | $1.24M | $1.33M | $1.12M | $6.60M | $775.15K |
| Other Total Stockholders Equity | $8.25M | $7.36M | $6.22M | $6.21M | $28.57K | $28.57K | $28.57K | $28.57K | $28.57K | $132.19K | $191.75K | $28.57K | $637.00K | $87.50K | $- |
| Total Stockholders Equity | $81.66M | $80.40M | $76.88M | $76.70M | $76.62M | $78.01M | $79.02M | $78.43M | $79.68M | $66.37M | $60.29M | $28.06M | $9.21M | $9.13M | $3.47M |
| Total Equity | $81.66M | $80.40M | $76.88M | $76.70M | $76.62M | $78.01M | $79.02M | $78.43M | $79.68M | $66.37M | $60.29M | $28.06M | $9.21M | $9.13M | $3.47M |
| Total Liabilities and Stockholders Equity | $99.52M | $95.91M | $89.95M | $88.15M | $88.51M | $89.34M | $88.78M | $85.82M | $86.96M | $73.30M | $67.90M | $35.50M | $10.56M | $10.37M | $3.74M |
| Minority Interest | $- | $- | $- | $- | $- | $- | $- | $- | $- | $- | $- | $- | $- | $- | $- |
| Total Liabilities and Total Equity | $99.52M | $95.91M | $89.95M | $88.15M | $88.51M | $89.34M | $88.78M | $85.82M | $86.96M | $73.30M | $67.90M | $35.50M | $10.56M | $10.37M | $3.74M |
| Total Investments | $- | $92.17M | $85.69M | $85.99M | $86.32M | $- | $- | $- | $- | $- | $- | $- | $- | $- | $- |
| Total Debt | $14.33M | $13.90M | $11.02M | $9.15M | $8.31M | $8.10M | $6.48M | $4.90M | $4.76M | $4.63M | $4.50M | $3.03M | $- | $- | $- |
| Net Debt | $13.51M | $11.60M | $7.91M | $8.06M | $6.94M | $7.16M | $5.77M | $3.94M | $2.55M | $3.92M | $1.86M | $-2.37M | $-2.38M | $-2.46M | $-157.10K |
Annual Cash Flow
| Breakdown | December 31, 2022 | December 31, 2021 | December 31, 2020 | December 31, 2019 |
|---|---|---|---|---|
| Net Income | $-7.90M | $-9.42M | $-3.42M | $-927.44K |
| Depreciation and Amortization | $1.17M | $3.02M | $-107.51K | $- |
| Deferred Income Tax | $-5.49K | $-8.55K | $-46.81K | $- |
| Stock Based Compensation | $3.70M | $2.89M | $1.36M | $438.60K |
| Change in Working Capital | $-190.20K | $-1.81M | $505.85K | $140.26K |
| Accounts Receivables | $125.31K | $-922.69K | $-68.59K | $-4.06K |
| Inventory | $- | $- | $- | $- |
| Accounts Payables | $- | $- | $- | $- |
| Other Working Capital | $-315.51K | $-883.11K | $574.44K | $144.32K |
| Other Non Cash Items | $1.08M | $838.04K | $218.60K | $- |
| Net Cash Provided by Operating Activities | $-2.14M | $-4.49M | $-1.49M | $-348.57K |
| Investments in Property Plant and Equipment | $-2.29M | $-29.89M | $-18.01M | $-1.95M |
| Acquisitions Net | $- | $- | $-75.66K | $- |
| Purchases of Investments | $- | $- | $- | $- |
| Sales Maturities of Investments | $- | $- | $- | $- |
| Other Investing Activities | $-82.21K | $- | $- | $- |
| Net Cash Used for Investing Activities | $-2.37M | $-29.89M | $-18.08M | $-1.95M |
| Debt Repayment | $- | $- | $- | $- |
| Common Stock Issued | $2.02M | $20.25M | $20.27M | $964.65K |
| Common Stock Repurchased | $- | $- | $- | $- |
| Dividends Paid | $- | $- | $- | $- |
| Other Financing Activities | $4.66M | $29.98M | $24.82M | $887.91K |
| Net Cash Used Provided by Financing Activities | $4.66M | $29.98M | $24.82M | $887.91K |
| Effect of Forex Changes on Cash | $-22.64K | $-35.51K | $259 | $- |
| Net Change in Cash | $124.63K | $-4.44M | $5.24M | $-1.41M |
| Cash at End of Period | $1.09M | $962.75K | $5.40M | $157.10K |
| Cash at Beginning of Period | $962.75K | $5.40M | $157.10K | $1.57M |
| Operating Cash Flow | $-2.14M | $-4.49M | $-1.49M | $-348.57K |
| Capital Expenditure | $-2.29M | $-29.89M | $-18.01M | $-1.95M |
| Free Cash Flow | $-4.43M | $-34.38M | $-19.50M | $-2.30M |
Cash Flow Charts
| Breakdown | September 30, 2023 | June 30, 2023 | March 31, 2023 | December 31, 2022 | September 30, 2022 | June 30, 2022 | March 31, 2022 | December 31, 2021 | September 30, 2021 | June 30, 2021 | March 31, 2021 | December 31, 2020 | September 30, 2020 | June 30, 2020 | March 31, 2020 | December 31, 2019 | September 30, 2019 |
|---|---|---|---|---|---|---|---|---|---|---|---|---|---|---|---|---|---|
| Net Income | $-3.65M | $-2.76M | $-1.96M | $-1.88M | $-2.31M | $-1.96M | $-1.75M | $-5.24M | $-1.68M | $-1.35M | $-1.15M | $-1.37M | $-1.04M | $-472.59K | $-540.25K | $-312.26K | $-276.25K |
| Depreciation and Amortization | $443.49K | $429.79K | $379.31K | $366.53K | $286.48K | $258.22K | $258.91K | $2.94M | $153.98K | $-75.98K | $1.42K | $- | $- | $- | $- | $- | $- |
| Deferred Income Tax | $19.96K | $-36.03K | $-24.08K | $7.91K | $7.23K | $-8.41K | $-12.22K | $3.88K | $3.63K | $3.31K | $-19.37K | $- | $- | $- | $- | $- | $- |
| Stock Based Compensation | $870.34K | $1.04M | $783.48K | $683.13K | $935.95K | $940.20K | $1.14M | $1.25M | $796.77K | $547.14K | $295.43K | $101.83K | $588.60K | $153.59K | $517.33K | $105.59K | $105.46K |
| Change in Working Capital | $2.41M | $-448.93K | $-354.68K | $-281.36K | $1.17M | $-452.73K | $-629.07K | $-709.05K | $-386.38K | $-209.39K | $-500.99K | $509.81K | $39.42K | $-157.43K | $114.04K | $238.73K | $35.84K |
| Accounts Receivables | $- | $-493.42K | $243.46K | $-504.29K | $824.51K | $- | $- | $- | $- | $- | $- | $- | $- | $- | $- | $- | $- |
| Inventory | $- | $- | $- | $- | $- | $- | $- | $- | $- | $- | $- | $- | $- | $- | $- | $- | $- |
| Accounts Payables | $- | $- | $- | $- | $- | $- | $- | $- | $- | $- | $- | $- | $- | $- | $- | $- | $- |
| Other Working Capital | $- | $44.49K | $-598.13K | $222.93K | $348.45K | $- | $- | $- | $- | $- | $- | $- | $- | $- | $- | $- | $- |
| Other Non Cash Items | $429.68K | $356.71K | $350.16K | $327.67K | $275.40K | $254.23K | $227.38K | $3.15M | $363.13K | $183.24K | $160.95K | $11.90K | $-60.23K | $255.15K | $-142.54K | $- | $- |
| Net Cash Provided by Operating Activities | $518.17K | $-1.43M | $-825.23K | $-773.88K | $363.34K | $-964.75K | $-765.26K | $-1.55M | $-899.82K | $-828.92K | $-1.21M | $-748.33K | $-468.48K | $-221.27K | $-51.42K | $32.06K | $-134.94K |
| Investments in Property Plant and Equipment | $-1.97M | $-3.71M | $-53.19K | $-826.04K | $-72.48K | $-22.73K | $-1.36M | $-177.62K | $-10.48M | $-5.91M | $-13.32M | $-14.98M | $102 | $15.55K | $-3.04M | $-72.24K | $-2 |
| Acquisitions Net | $- | $- | $- | $- | $- | $- | $-86.35K | $- | $- | $- | $- | $119.97K | $- | $- | $- | $- | $- |
| Purchases of Investments | $- | $- | $- | $- | $- | $- | $- | $- | $- | $- | $- | $- | $- | $- | $- | $- | $- |
| Sales Maturities of Investments | $- | $- | $- | $- | $- | $- | $- | $- | $- | $- | $- | $- | $- | $- | $- | $- | $- |
| Other Investing Activities | $- | $- | $- | $134.88K | $103.78K | $-234.53K | $- | $- | $- | $- | $- | $- | $-195.62K | $- | $- | $- | $- |
| Net Cash Used for Investing Activities | $-1.97M | $-3.71M | $-53.19K | $-691.15K | $31.30K | $-257.26K | $-1.45M | $-177.62K | $-10.48M | $-5.91M | $-13.32M | $-14.86M | $-195.52K | $15.55K | $-3.04M | $-72.24K | $-2 |
| Debt Repayment | $- | $- | $- | $- | $- | $- | $- | $- | $- | $- | $- | $- | $- | $- | $- | $- | $- |
| Common Stock Issued | $- | $1.79M | $1.50M | $1.49M | $- | $- | $526.84K | $558.81K | $13.96M | $4.91M | $824.90K | $20.27M | $- | $- | $- | $- | $- |
| Common Stock Repurchased | $- | $- | $- | $- | $- | $- | $- | $- | $- | $- | $- | $- | $- | $- | $- | $- | $- |
| Dividends Paid | $- | $- | $- | $- | $- | $- | $- | $- | $- | $- | $- | $- | $- | $- | $- | $- | $- |
| Other Financing Activities | $-53.87K | $4.35M | $2.90M | $1.27M | $-24.20K | $1.43M | $1.98M | $498.77K | $12.88M | $4.83M | $11.77M | $18.60M | $521.35K | $87.50K | $5.61M | $-75.67K | $- |
| Net Cash Used Provided by Financing Activities | $-53.87K | $4.35M | $2.90M | $1.27M | $-24.20K | $1.43M | $1.98M | $498.77K | $12.88M | $4.83M | $11.77M | $18.60M | $521.35K | $87.50K | $5.61M | $-75.67K | $- |
| Effect of Forex Changes on Cash | $26.33K | $-16.42K | $-488 | $-79.36K | $58.16K | $8.48K | $-9.91K | $-22.97K | $33 | $-13.44K | $863 | $29.64K | $65.98K | $-237.90K | $142.54K | $- | $- |
| Net Change in Cash | $-1.48M | $-807.58K | $2.02M | $-277.80K | $428.60K | $219.65K | $-245.81K | $-1.25M | $1.51M | $-1.93M | $-2.76M | $3.02M | $-76.67K | $-356.12K | $2.66M | $-115.85K | $-134.95K |
| Cash at End of Period | $820.18K | $2.30M | $3.11M | $1.09M | $1.37M | $936.58K | $716.93K | $962.75K | $2.22M | $710.78K | $2.64M | $5.40M | $2.38M | $2.46M | $2.81M | $157.10K | $272.95K |
| Cash at Beginning of Period | $2.30M | $3.11M | $1.09M | $1.37M | $936.58K | $716.93K | $962.75K | $2.22M | $710.78K | $2.64M | $5.40M | $2.38M | $2.46M | $2.81M | $157.10K | $272.95K | $407.90K |
| Operating Cash Flow | $518.17K | $-1.43M | $-825.23K | $-773.88K | $363.34K | $-964.75K | $-765.26K | $-1.55M | $-899.82K | $-828.92K | $-1.21M | $-748.33K | $-468.48K | $-221.27K | $-51.42K | $32.06K | $-134.94K |
| Capital Expenditure | $-1.97M | $-3.71M | $-53.19K | $-826.04K | $-72.48K | $-22.73K | $-1.36M | $-177.62K | $-10.48M | $-5.91M | $-13.32M | $-14.98M | $102 | $15.55K | $-3.04M | $-72.24K | $-2 |
| Free Cash Flow | $-1.46M | $-5.14M | $-878.41K | $-1.60M | $290.86K | $-987.48K | $-2.13M | $-1.73M | $-11.38M | $-6.74M | $-14.54M | $-15.73M | $-468.38K | $-205.72K | $-3.09M | $-40.18K | $-134.95K |
Nova Royalty Dividends
Explore Nova Royalty's dividend history, including dividend yield, payout ratio, and historical payments.
Nova Royalty News
Read the latest news about Nova Royalty, including recent articles, headlines, and updates.
METALLA AND NOVA ANNOUNCE COMPLETION OF ARRANGEMENT
( All dollar amounts are in thousands of United States dollars unless otherwise indicated, except for per share amounts) VANCOUVER, BC , Dec. 1, 2023 /PRNewswire/ - Metalla Royalty & Streaming Ltd. ("Metalla") (TSXV: MTA) (NYSE American: MTA) and Nova Royalty Corp. (TSXV: NOVR) (OTCQB: NOVRF) ("Nova") are pleased to announce that they have completed the arrangement (the "Arrangement"), initially announced on September 8, 2023, pursuant to which Metalla acquired all of the issued and outstanding common shares of Nova (the "Nova Shares") by way of a court-approved plan of arrangement under the Business Corporations Act (British Columbia), positioning the combined company as a leading emerging intermediate royalty company.

Metalla Royalty to acquire Nova Royalty in all-stock deal
Metalla Royalty & Streaming Ltd (TSX-V:MTA) announced on Friday that it has agreed to acquire Nova Royalty Corp in an all-stock transaction valued at C$190 million. Nova Royalty shareholders will receive 0.36 of a Metalla common share for each Nova share held, implying a premium of 25% based on the closing share prices of Nova on September 7, 2023, Metalla Royalty stated.

METALLA AND NOVA COMBINE TO BUILD THE NEXT INTERMEDIATE ROYALTY COMPANY
Metalla and Beedie Capital Announce Strategic Partnership with C$65 Million Committed TSXV: MTA NYSE AMERICAN: MTA TSXV: NOVR OTCQB: NOVRF ( All dollar amounts are in thousands of United States dollars unless otherwise indicated, except for per ounce, and per share amounts) VANCOUVER, BC , Sept. 8, 2023 /PRNewswire/ - Metalla Royalty & Streaming Ltd.

Nova to acquire royalty on Newmont's Saddle North copper-gold-silver deposit in B.C.
Nova Royalty (TSXV: NOVR), a copper and nickel-focused royalty company, announced today that it has entered into an agreement with an arm's length private party pursuant to which Nova will acquire an existing 0.25% NSR royalty on the Tatogga property in British Columbia, Canada.

Nova Royalty Corp (NOVRF) Q4 2022 Earnings Call Transcript
Nova Royalty Corp (OTCQB:NOVRF) Q4 2022 Earnings Conference Call March 24, 2023 11:00 AM ET Company Participants Alex Tsukernik - President and Chief Executive Officer Hashim Ahmed - Chief Financial Officer Conference Call Participants Mike Kozak - Cantor Fitzgerald Adrian Day - Adrian Day Asset Management Justin Stevens - PI Financial Operator Hello, everyone. Welcome to Nova Royalty Corporation Fourth Quarter and Full Year 2022 Corporate Update Call.

Nova Royalty Corp (NOVRF) Q3 2022 Earnings Call Transcript
Nova Royalty Corp (OTCQB:NOVRF) Q3 2022 Earnings Conference Call November 17, 2022 10:00 AM ET Company Participants Alex Tsukernik - President and Chief Executive Officer, Director Bill Tsang - Chief Financial Officer Conference Call Participants Justin Stevens - PI Financial Operator Hello, everyone. Welcome to the Nova Royalty Corporation Third Quarter 2022 Conference Update Call.

Nova Royalty Corp's (NOVRF) CEO Alex Tsukernik on Q2 2022 Results - Earnings Call Transcript
Nova Royalty Corp. (OTCQB:NOVRF) Q2 2022 Earnings Conference Call August 11, 2022 12:00 PM ET Company Participants Alex Tsukernik – President and Chief Executive Officer Bill Tsang – Chief Financial Officer Conference Call Participants Justin Stevens – PI Financial Operator Hello, everyone. Welcome to the Nova Royalty Corporation Second Quarter 2022 Conference Update.

Nova Royalty reports financial results for its second quarter ended June 30, 2022, showing revenue increase
Nova Royalty Corp has released its financial results for the quarter ended June 30, 2022. showing the company recognized $0.5 million in revenue during the second quarter of 2022, compared to nil in the comparative quarter a year ago, with the increase in revenue due to the Aranzazu Royalty.

Nova Royalty names Guy Elliott as independent director and chair of audit committee
Nova Royalty Corp. (TSX-V:NOVR), the clean energy-focused royalty group, reported that it has added Guy Elliott as an independent director and chair of the audit committee, effective immediately. "On behalf of the board of directors and management, I would like to welcome Guy to the Nova Royalty board," said Alex Tsukernik, the CEO of Nova, in a statement.

Nova Royalty posts royalty revenue of C$673,519 in first quarter of 2022
Nova Royalty Corp has posted its results for the first quarter of 2022, which showed royalty revenue of C$673,519, up from C$2,073 in the same period of 2021. The increase was largely due to its 1% net smelter return (NSR) Aranzazu mine royalty in Mexico.
Nova Royalty set to acquire portion of existing royalty on Lundin Mining's Josemaria copper-gold-silver project in Argentina
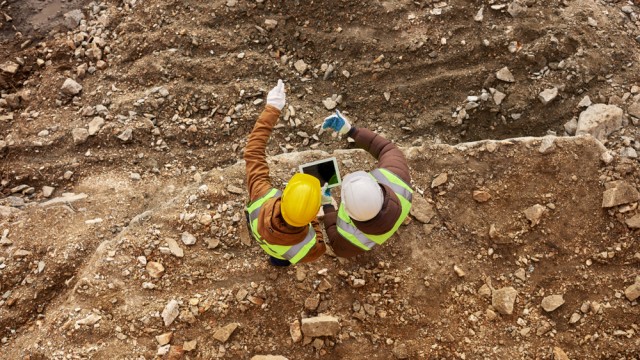
Nova Royalty Corp. (TSX-V:NOVR) revealed it is set to boost its portfolio, having secured the right to acquire part of an existing royalty on the Josemaria asset in Argentina, owned by major Lundin Mining, which is one of the most advanced large-scale copper development projects in the Americas. Nova has struck a purchase agreement with private sellers.

Nova Royalty reports FY2021 revenue of C$703,000 after busy year of cash-flowing royalty acquisitions
Nova Royalty Corp. (TSX-V:NOVR) reported revenue of C$703,044 in the 2021 financial year as its first cash-flowing royalty on the Aranzazu mine has exceeded performance expectations. CEO Alex Tsukernik told shareholders that performance at Aranzazu, which is operated by Aura Minerals Inc, has exceeded the firm's initial expectations, having achieved multiple throughput expansions and cost reductions since 2018.

Nova Royalty completes acquisition of royalty on two copper assets in the US
Nova Royalty Corp has announced the completion of its acquisition of a royalty on two copper projects in Arizona owned by Hudbay Minerals Inc. The Vancouver-based company now owns an existing 0.135% net smelter return (NSR) on the Copper World and Rosemont projects, as well as the right of first refusal for another 0.540% NSR covering the same area as the royalty.

Nova Royalty says Greg DiTomaso has agreed to join the company as its vice president, Investor Relations
Nova Royalty Corp announced that Greg DiTomaso has agreed to join the company as vice president, Investor Relations. The company noted that DiTomaso has over 14 years of investor relations and strategic communications experience, predominantly in the mining and energy sectors.

Nova Royalty bolsters portfolio with US$5.5M royalty deal on Hudbay Minerals' Copper World and Rosemont projects
Nova Royalty Corp. (TSX-V:NOVR) is set to buy, in a deal worth around US$5.5 million, an existing 0.135% net smelter return (NSR) royalty on Hudbay Minerals' Copper World and Rosemont copper projects in Arizona, USA. The company has struck a royalty purchase agreement with arm's length sellers over the transaction, which covers the Copper World asset, only discovered in 2020, and which already boasts an initial resource of 400 million tonnes.
Nova Royalty harnessing the green energy revolution to build a leading royalty company
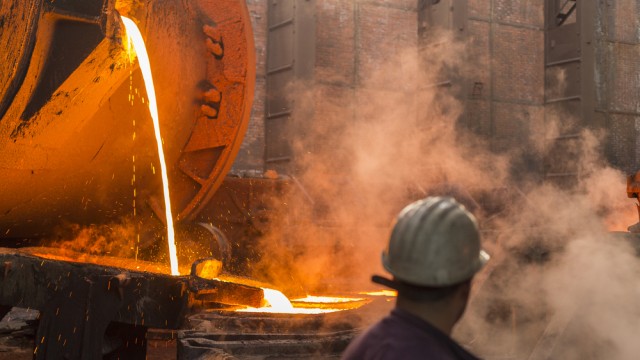
Royalty company focused on clean energy metals Invests in high-quality assets with long life High-quality base metal mines have track record of resource growth and extended mine life What Nova Royalty does: Nova Royalty Corp (CVE:NOVR) aims to build a leading royalty company focused on copper and nickel - commodities, which it says, are key to global society's transition to clean energy from fossil fuels. Copper is used in wind and solar energy and in electric vehicles (EVs).
Nova Royalty posts revenue of C$181,900 in third quarter; updates on asset portfolio
Nova Royalty Corp posted revenue of C$181,900 from its interests in the third quarter to end-September 2021, mainly attributable to the Aranzazu copper-gold-silver mine in Mexico - the firm's first cash flowing royalty. The company increased its portfolio of royalties in the three-month period to 20 via the acquisition of a 1% net smelter royalty (NSR) on the Aranzazu mine.
Nova Royalty appoints lawyer Johanna Fipke as an independent director
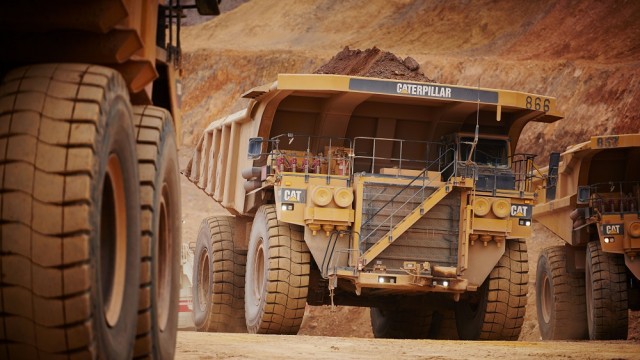
Nova Royalty Corp has announced the addition of Johanna Fipke as an independent director, effective immediately. Nova said Fipke is a partner at Fasken Martineau Dumoulin LLP, one of Canada's leading law firms, and has over 18 years of experience in the mining sector.

Nova Royalty closes acquisition of Aranzazu mine royalty for US$9M
Nova Royalty Corp announced that it has completed its acquisition of a 1% net smelter return (NSR) royalty on the Aranzazu mine, a copper-silver-gold operation in Mexico owned by Aura Minerals. The US$9 million deal was comprised of $8 million in cash and a further $1 million in Nova shares.

Nova Royalty closes previously announced 'best efforts' public offering of common shares for aggregate gross proceeds of $13,660,680
Nova Royalty Corp. has announced the closing of its previously announced 'best efforts' public offering of common shares of the company for aggregate gross proceeds of $13,660,680.

Nova Royalty upsizes offering to C$12.7M for Aranzazu acquisition
Nova Royalty Corp announced it is upsizing its previously announced public offering to C$12.7 million, up from $10 million originally. The royalty company is raising funds to finance its recent acquisition of the existing 1% net smelter return royalty on the Aranzazu copper-gold-silver mine in Zacatecas, Mexico.

Nova Royalty secures net smelter return royalty on Aranzazu copper mine; launches public offering
Nova Royalty Corp said it has signed a royalty purchase agreement with Macocozac to acquire an existing 1% net smelter return royalty on the Aranzazu copper-gold-silver mine in Zacatecas, Mexico. The deal will see Nova pay a total of $9 million, of which $8 million is in cash and $1 million in common shares.

Nova Royalty acquires its first cash flowing royalty on Aura's Aranzazu mine in Mexico
(Kitco News) - Nova Royalty (TSXV: NOVR) (OTCQB: NOVRF) announced Monday that it has entered into a royalty purchase agreement pursuant to which Nova will acquire an existing 1.0% net smelter return royalty on the Aranzazu copper-gold-silver mine in Zacatecas, Mexico, for $9.0 million.
Nova Royalty acquires new royalty on Anglo American and Glencore's West Wall copper-gold-molybdenum project in Chile
Nova Royalty Corp (CVE:NOVR) (OTCQB:NOVRF) announced it had acquired a new royalty on the West Wall copper-gold-molybdenum project in a US$4.2 million deal with Sociedad Minera Auromin Limitada. Nova will maintain a 1% net proceeds royalty on the Chile-based project, which is a joint venture between Anglo American plc (LON:AAL) and Glencore plc (LON:GLEN).

Similar Companies
Related Metrics
Explore detailed financial metrics and analysis for NOVRF.
