Invesco Municipal Income Opportunities Trust Key Executives
This section highlights Invesco Municipal Income Opportunities Trust's key executives, including their titles and compensation details.
Find Contacts at Invesco Municipal Income Opportunities Trust
(Showing 0 of )
Invesco Municipal Income Opportunities Trust Earnings
This section highlights Invesco Municipal Income Opportunities Trust's earnings, including key dates, EPS, earnings reports, and earnings call transcripts.
Next Earnings Date
Last Earnings Results
Earnings Call Transcripts
| Transcript | Quarter | Year | Date | Estimated EPS | Actual EPS |
|---|

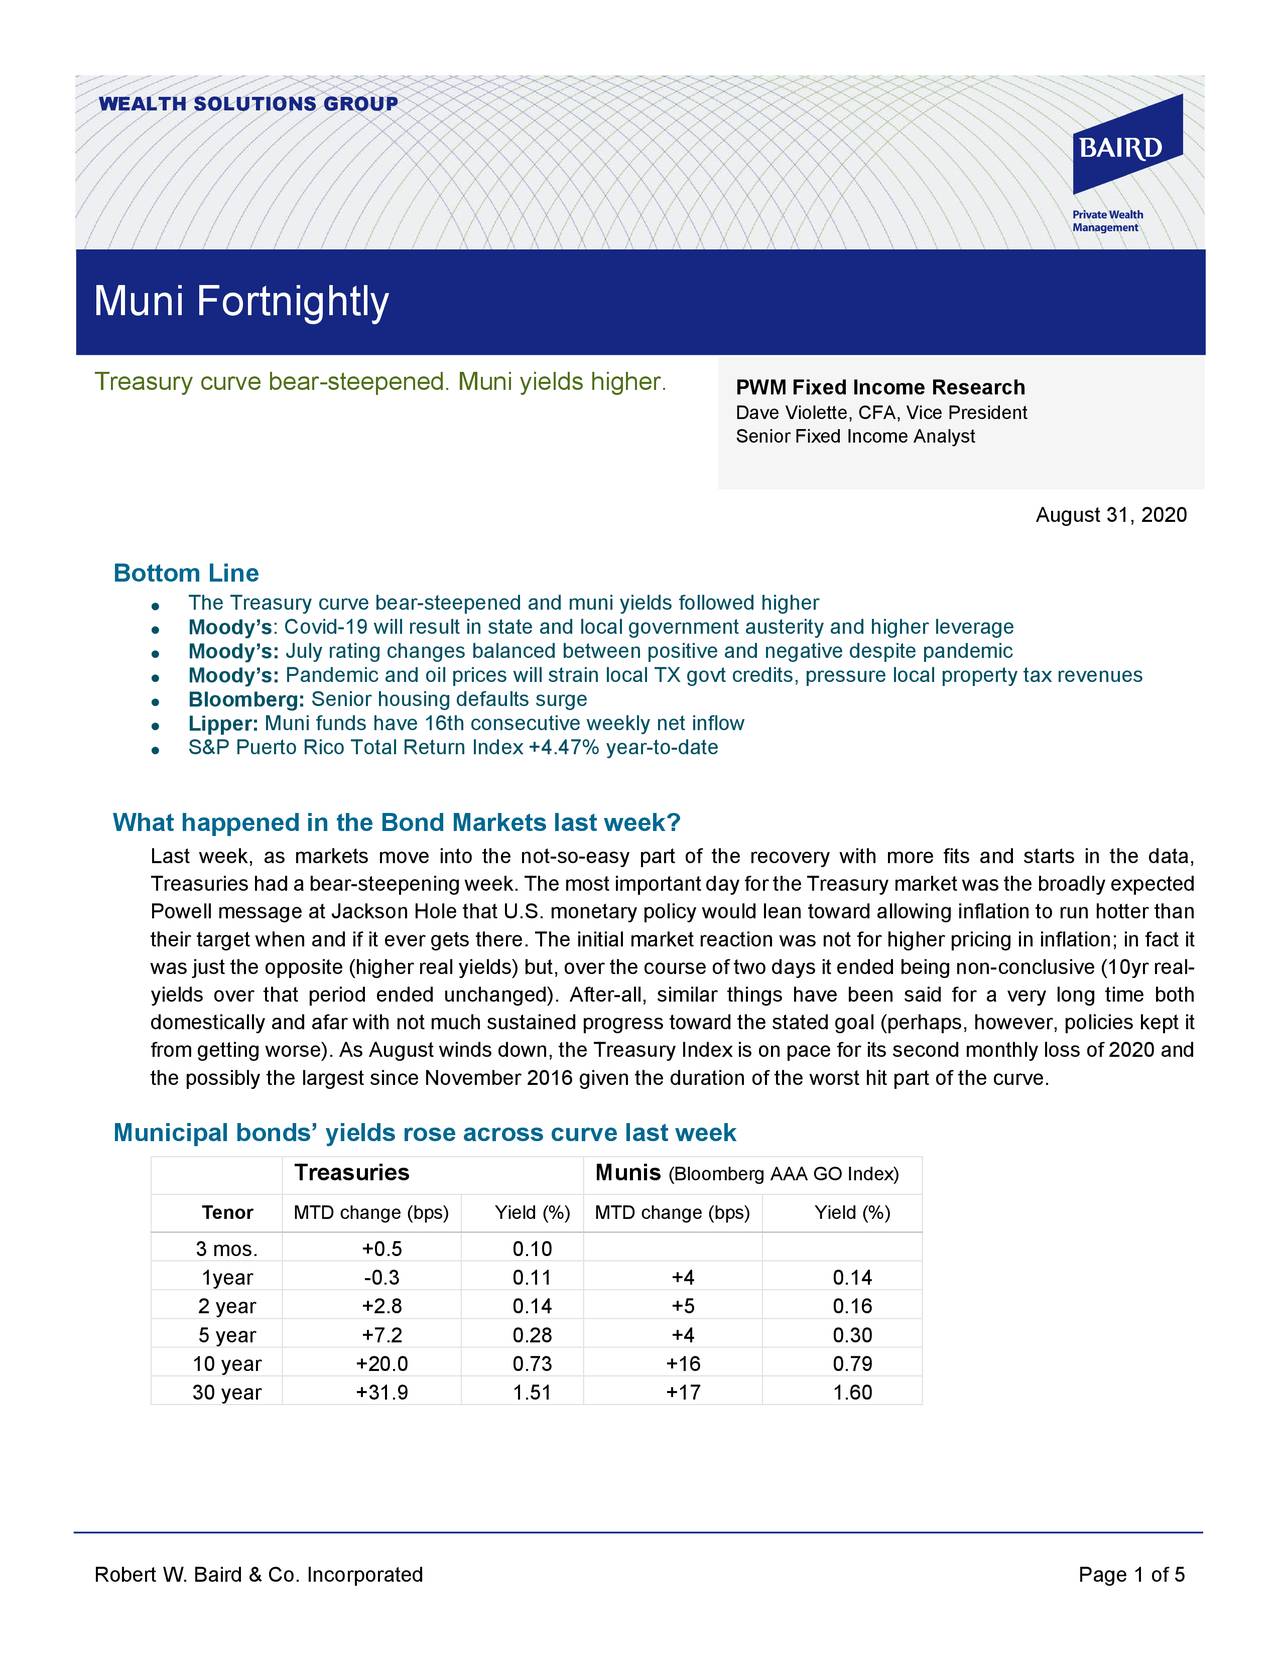
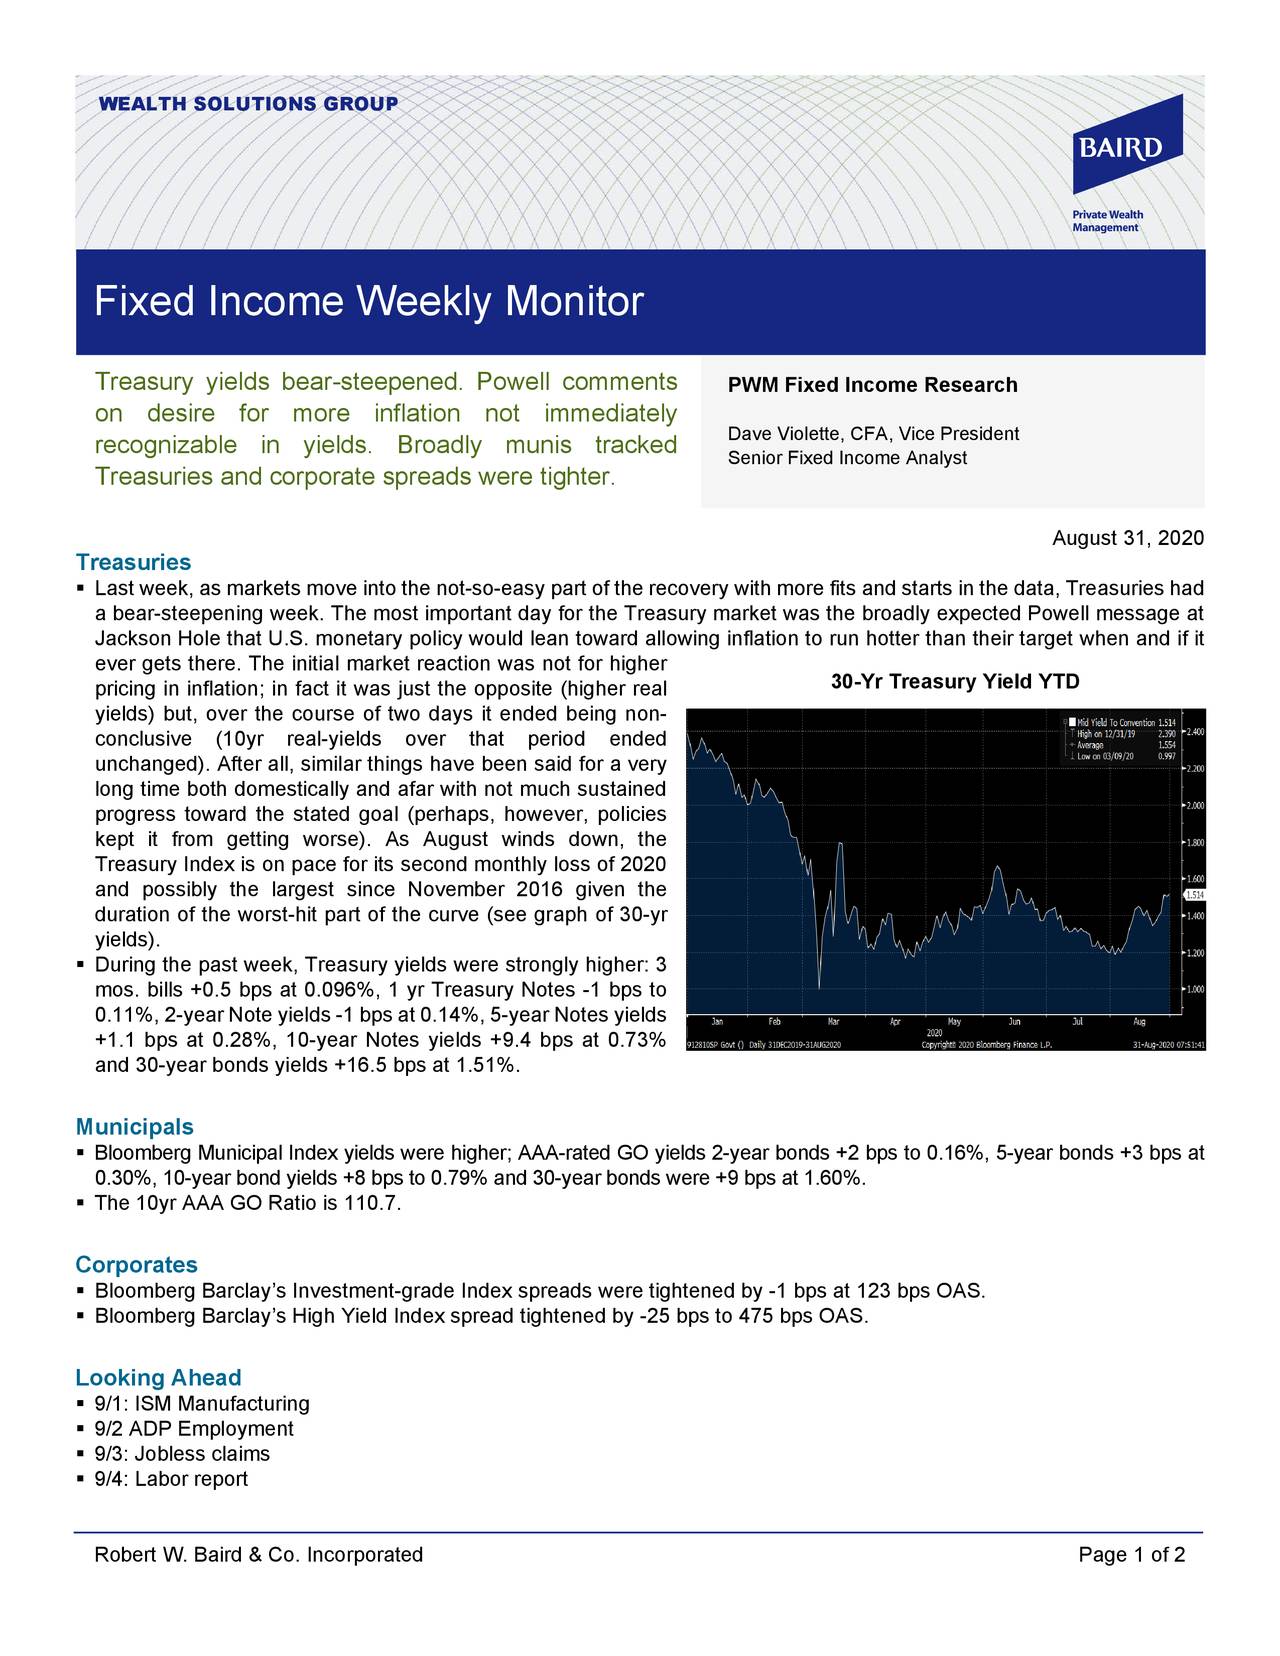
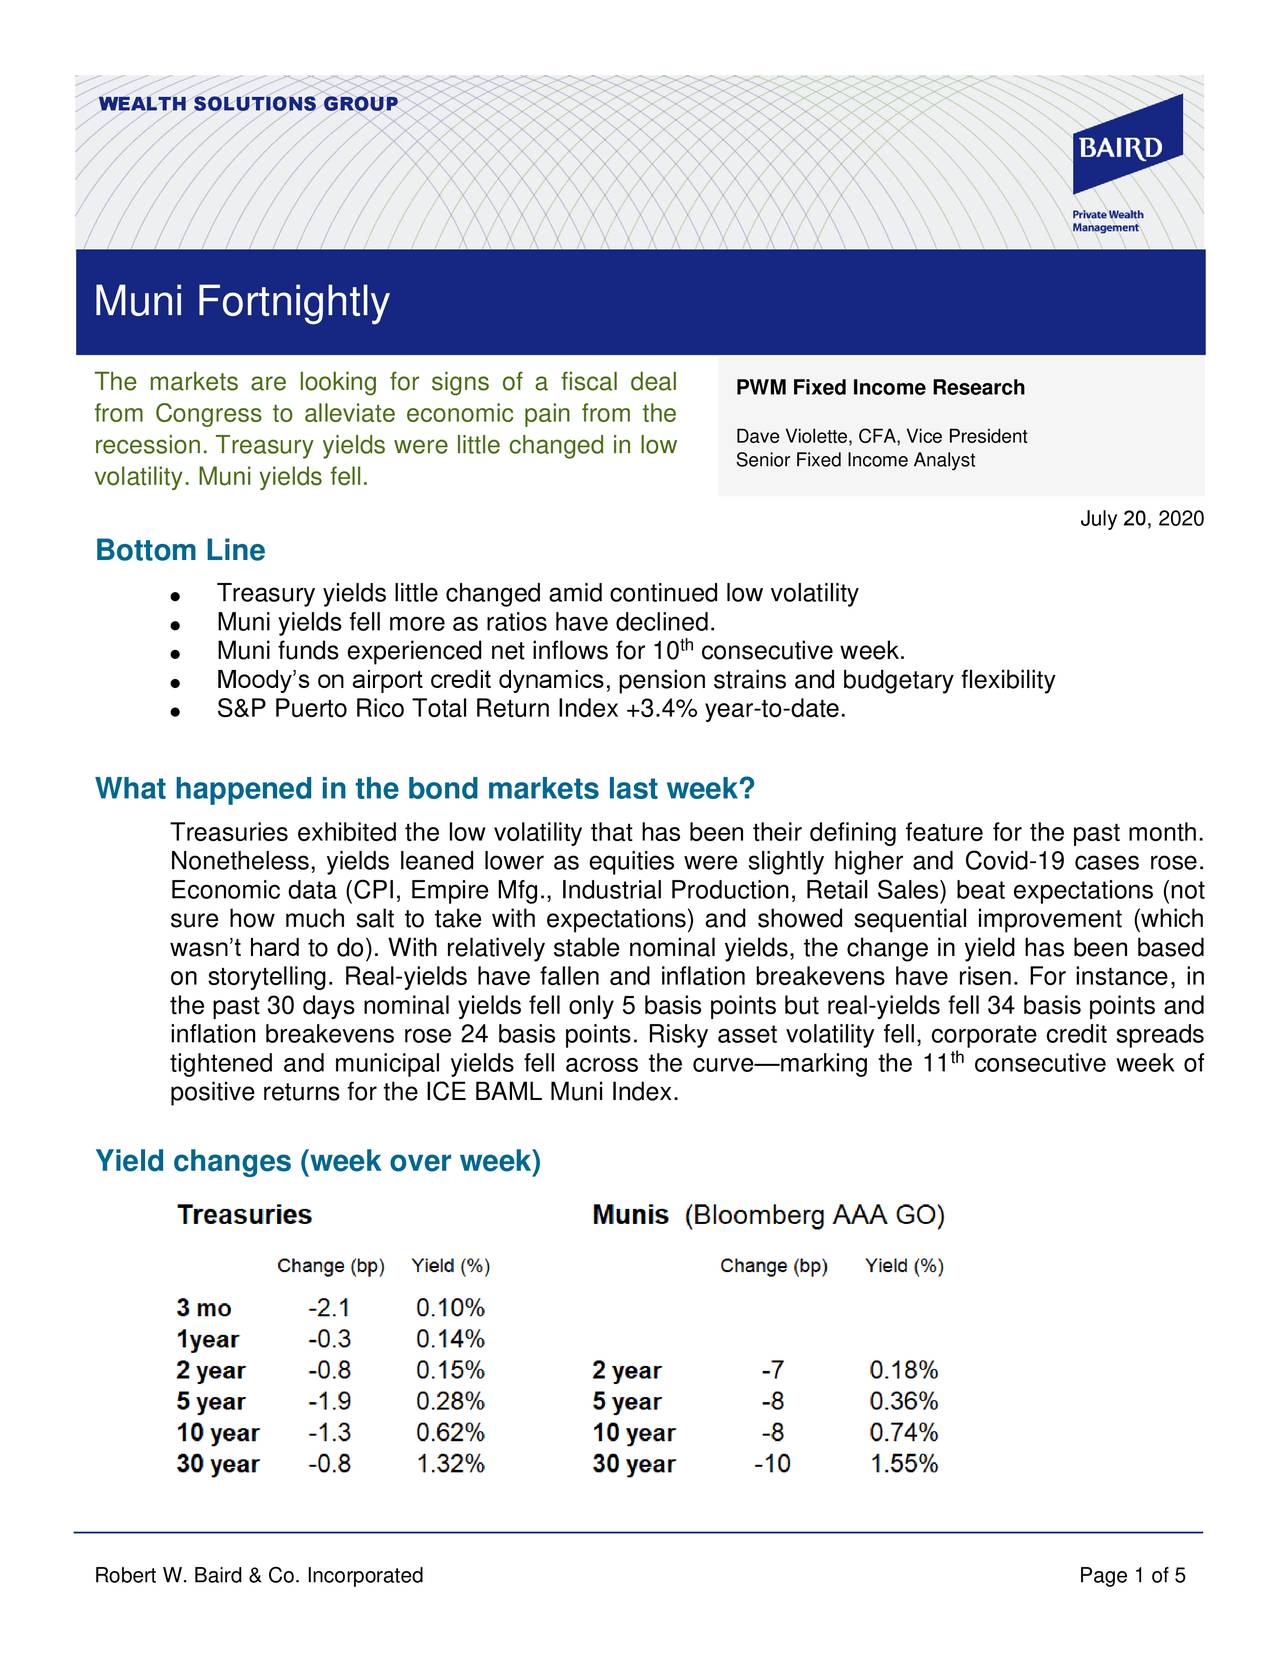
Invesco Municipal Income Opportunities Trust is a closed-ended fixed income mutual fund launched by Invesco Ltd. The fund is co-managed by Invesco Advisers, Inc., INVESCO Asset Management Deutschland GmbH, INVESCO Asset Management Limited, INVESCO Asset Management (Japan) Limited, Invesco Hong Kong Limited, INVESCO Senior Secured Management, Inc., and Invesco Canada Ltd. It invests in the fixed income markets of the United States. The fund primarily invests in municipal bonds rated BB or better by Standard & Poor's or Ba or better by Moody's. It employs fundamental analysis with bottom-up security selection approach to create its portfolio. The fund was previously known as Morgan Stanley Municipal Income Opportunities Trust. Invesco Municipal Income Opportunities Trust was formed on September 19, 1988 and is domiciled in the United States.
$6.06
Stock Price
$288.55M
Market Cap
-
Employees
Atlanta, GA
Location
Financial Statements
Access annual & quarterly financial statements for Invesco Municipal Income Opportunities Trust, including income statements, balance sheets, and cash flow statements..
Annual Income Statement
| Breakdown | February 29, 2024 | February 28, 2023 | February 28, 2022 | February 28, 2021 | February 29, 2020 |
|---|---|---|---|---|---|
| Revenue | $21.23M | $20.54M | $5.95M | $3.19M | $51.13M |
| Cost of Revenue | $- | $- | $2.81M | $2.76M | $27.62M |
| Gross Profit | $21.23M | $20.54M | $3.14M | $433.28K | $23.51M |
| Gross Profit Ratio | 100.00% | 100.00% | 52.80% | 13.59% | 45.98% |
| Research and Development Expenses | $- | $- | $- | $- | $- |
| General and Administrative Expenses | $2.66M | $2.56M | $320.57K | $254.43K | $373.83K |
| Selling and Marketing Expenses | $- | $- | $- | $- | $- |
| Selling General and Administrative Expenses | $2.66M | $2.56M | $320.57K | $254.43K | $373.83K |
| Other Expenses | $- | $- | $37.86K | $-13.90M | $39.55K |
| Operating Expenses | $2.66M | $2.56M | $358.42K | $289.17K | $413.38K |
| Cost and Expenses | $2.66M | $2.56M | $-14.52M | $-17.67M | $29.82M |
| Interest Income | $21.23M | $- | $21.04M | $22.07M | $23.51M |
| Interest Expense | $5.50M | $- | $930.65K | $1.50M | $2.61M |
| Depreciation and Amortization | $-9.72M | $-17.98M | $-18.05M | $-19.23M | $-20.46M |
| EBITDA | $8.84M | $- | $-11.53M | $-14.83M | $- |
| EBITDA Ratio | 41.64% | 0.00% | -225.05% | -559.04% | 54.06% |
| Operating Income | $18.56M | $17.98M | $18.05M | $19.23M | $20.46M |
| Operating Income Ratio | 87.45% | 87.53% | 303.38% | 602.97% | 40.03% |
| Total Other Income Expenses Net | $3.34M | $-57.03M | $-12.46M | $-16.33M | $30.25M |
| Income Before Tax | $21.90M | $-39.05M | $5.59M | $2.90M | $50.71M |
| Income Before Tax Ratio | 103.19% | -190.11% | 93.98% | 90.93% | 99.19% |
| Income Tax Expense | $- | $- | $-13.39M | $-17.83M | $27.64M |
| Net Income | $21.90M | $-39.05M | $5.59M | $2.90M | $50.71M |
| Net Income Ratio | 103.19% | -190.11% | 93.98% | 90.93% | 99.19% |
| EPS | $0.46 | $-0.82 | $0.12 | $0.06 | $1.07 |
| EPS Diluted | $0.46 | $-0.82 | $0.12 | $0.06 | $1.07 |
| Weighted Average Shares Outstanding | 47.64M | 47.62M | 47.60M | 47.57M | 47.55M |
| Weighted Average Shares Outstanding Diluted | 47.64M | 47.62M | 47.60M | 47.57M | 47.55M |
| SEC Filing | Source | Source | Source | Source | Source |
| Breakdown | August 31, 2024 | February 29, 2024 | August 29, 2023 | February 28, 2023 | August 31, 2022 | February 28, 2022 | August 31, 2021 | February 28, 2021 | August 31, 2020 | February 29, 2020 | August 31, 2019 | February 28, 2019 | August 31, 2018 | February 28, 2018 | August 31, 2017 | February 28, 2017 | August 31, 2016 | February 29, 2016 | August 31, 2015 | February 28, 2015 |
|---|---|---|---|---|---|---|---|---|---|---|---|---|---|---|---|---|---|---|---|---|
| Revenue | $9.30M | $10.45M | $10.78M | $10.41M | $10.13M | $10.57M | $10.47M | $10.96M | $11.11M | $12.74M | $10.99M | $11.62M | $11.99M | $11.66M | $12.81M | $11.51M | $11.47M | $11.45M | $11.59M | $11.25M |
| Cost of Revenue | $1.40M | $2.47M | $-2.47M | $- | $- | $- | $- | $- | $- | $1.40M | $1.40M | $5.66M | $5.55M | $4.62M | $- | $- | $- | $- | $- | $- |
| Gross Profit | $7.91M | $7.98M | $13.25M | $10.41M | $10.13M | $10.57M | $10.47M | $10.96M | $11.11M | $11.34M | $9.58M | $5.95M | $6.43M | $7.04M | $12.81M | $11.51M | $11.47M | $11.45M | $11.59M | $11.25M |
| Gross Profit Ratio | 84.98% | 76.40% | 122.90% | 100.00% | 100.00% | 100.00% | 100.00% | 200.00% | 200.00% | 89.04% | 87.23% | 51.24% | 53.66% | 60.39% | 100.00% | 100.00% | 100.00% | 100.00% | 100.00% | 100.00% |
| Research and Development Expenses | $- | $- | $- | $- | $- | $- | $- | $- | $- | $- | $- | $- | $- | $- | $- | $- | $- | $- | $- | $- |
| General and Administrative Expenses | $1.54M | $1.36M | $1.30M | $1.23M | $1.33M | $1.49M | $1.50M | $1.42M | $1.42M | $743.07K | $777.52K | $1.35M | $1.51M | $1.49M | $1.30M | $1.29M | $1.35M | $1.32M | $1.32M | $1.27M |
| Selling and Marketing Expenses | $5.46M | $- | $- | $- | $- | $- | $- | $- | $- | $- | $- | $-12.34K | $- | $84.26K | $- | $- | $- | $- | $- | $- |
| Selling General and Administrative Expenses | $7.00M | $1.36M | $1.30M | $1.23M | $1.33M | $1.49M | $1.50M | $1.42M | $1.42M | $743.07K | $777.52K | $1.35M | $1.51M | $1.49M | $1.30M | $1.29M | $1.35M | $1.32M | $1.32M | $1.27M |
| Other Expenses | $- | $4 | $-4 | $- | $- | $- | $- | $- | $- | $2 | $22.88M | $- | $- | $- | $- | $- | $- | $- | $- | $- |
| Operating Expenses | $7.00M | $1.36M | $1.30M | $1.23M | $1.33M | $25.77M | $11.25M | $10.21M | $27.88M | $4.49M | $-22.88M | $5.97M | $803.91K | $10.31M | $4.99M | $24.14M | $11.49M | $5.66M | $6.57M | $5.62M |
| Cost and Expenses | $-5.60M | $1.36M | $1.30M | $1.23M | $1.33M | $25.77M | $11.25M | $10.21M | $27.88M | $20.86M | $-20.10M | $5.97M | $803.91K | $10.31M | $4.99M | $24.14M | $11.49M | $5.66M | $6.57M | $5.62M |
| Interest Income | $- | $- | $21.23M | $- | $- | $- | $- | $- | $- | $- | $- | $- | $- | $- | $- | $- | $- | $- | $- | $- |
| Interest Expense | $- | $6.29M | $-788.47K | $- | $- | $479.14K | $451.52K | $641.10K | $857.99K | $10.46M | $22.40M | $- | $4.62M | $- | $454.16K | $466.39K | $317.80K | $229.86K | $193.66K | $223.99K |
| Depreciation and Amortization | $- | $-9.09M | $-631.79K | $-9.18M | $-8.80M | $-9.13M | $-8.92M | $-9.54M | $-9.69M | $19.62M | $-5.03M | $-10.23M | $-10.48M | $-10.04M | $-11.45M | $-10.09M | $-10.12M | $-10.13M | $-10.27M | $-9.98M |
| EBITDA | $14.91M | $- | $8.84M | $- | $- | $- | $- | $- | $- | $19.62M | $32.47M | $-1.81M | $1.01M | $973.50K | $5.89M | $-25.90M | $- | $- | $- | $- |
| EBITDA Ratio | 160.25% | 112.09% | 41.64% | 0.00% | 0.00% | -469.37% | 235.84% | 200.66% | -491.63% | 36.20% | 295.50% | -52.15% | 8.45% | -81.89% | 45.96% | -201.28% | 109.16% | 58.91% | -46.91% | 59.24% |
| Operating Income | $14.91M | $9.09M | $9.47M | $9.18M | $8.80M | $9.13M | $8.92M | $9.54M | $9.69M | $19.62M | $32.47M | $10.23M | $10.48M | $10.04M | $11.45M | $10.09M | $10.12M | $10.13M | $10.27M | $9.98M |
| Operating Income Ratio | 160.25% | 86.99% | 87.45% | 88.20% | 86.84% | 172.79% | 170.38% | 174.08% | 174.43% | 154.03% | 295.50% | 88.03% | 87.42% | 86.07% | 89.42% | 87.59% | 88.23% | 88.47% | 88.59% | 88.71% |
| Total Other Income Expenses Net | $-2.62M | $11.71M | $-8.37M | $-15.52M | $-41.51M | $-24.81M | $12.30M | $10.99M | $-27.32M | $14.42M | $-15.54M | $-6.06M | $1.01M | $-9.69M | $23.23M | $-36.27M | $35.16M | $6.75M | $-5.44M | $6.67M |
| Income Before Tax | $12.29M | $20.81M | $1.10M | $-6.34M | $-32.71M | $-15.67M | $21.27M | $20.53M | $-17.63M | $0 | $31.09M | $4.17M | $11.49M | $486.75K | $17.34M | $-13.09M | $22.64M | $16.88M | $4.83M | $16.65M |
| Income Before Tax Ratio | 132.13% | 199.08% | 103.19% | -60.92% | -322.80% | -296.59% | 406.23% | 374.73% | -317.20% | 0.00% | 282.97% | 35.88% | 95.88% | 4.17% | 135.37% | -113.69% | 197.38% | 147.38% | 41.68% | 147.95% |
| Income Tax Expense | $- | $1 | $-1 | $- | $- | $-25.29M | $11.90M | $10.35M | $-28.18M | $0 | $-44.80M | $18.34M | $-9.24M | $34.74M | $5.43M | $-23.64M | $12.20M | $6.52M | $-5.63M | $6.44M |
| Net Income | $12.29M | $20.81M | $1.10M | $-6.34M | $-32.71M | $-15.67M | $21.27M | $20.53M | $-17.63M | $47.55M | $31.09M | $4.17M | $11.49M | $486.75K | $17.34M | $-13.09M | $22.64M | $16.88M | $4.83M | $16.65M |
| Net Income Ratio | 132.13% | 199.08% | 103.19% | -60.92% | -322.80% | -296.59% | 406.23% | 374.73% | -317.20% | 373.26% | 282.97% | 35.88% | 95.88% | 4.17% | 135.37% | -113.69% | 197.38% | 147.38% | 41.68% | 147.95% |
| EPS | $0.26 | $0.44 | $0.02 | $-0.13 | $-0.69 | $-0.32 | $0.44 | $0.44 | $-0.38 | $1.00 | $0.65 | $0.09 | $0.24 | $0.01 | $0.36 | $-0.28 | $0.48 | $0.36 | $0.10 | $0.36 |
| EPS Diluted | $0.26 | $0.44 | $0.02 | $-0.13 | $-0.69 | $-0.32 | $0.44 | $0.44 | $-0.38 | $1.00 | $0.65 | $0.09 | $0.24 | $0.01 | $0.36 | $-0.28 | $0.48 | $0.36 | $0.10 | $0.36 |
| Weighted Average Shares Outstanding | 47.66M | 47.64M | 47.64M | 47.64M | 47.61M | 95.20M | 95.17M | 95.13M | 95.11M | 47.55M | 47.54M | 47.53M | 47.51M | 47.50M | 47.47M | 47.46M | 47.44M | 47.43M | 47.43M | 47.43M |
| Weighted Average Shares Outstanding Diluted | 47.66M | 47.64M | 47.64M | 47.64M | 47.61M | 95.20M | 95.17M | 95.13M | 95.11M | 47.55M | 47.54M | 47.53M | 47.51M | 47.49M | 47.47M | 47.46M | 47.44M | 47.43M | 47.43M | 47.43M |
| SEC Filing | Source | Source | Source | Source | Source | Source | Source | Source | Source | Source | Source | Source | Source | Source | Source | Source | Source | Source | Source | Source |
Annual Balance Sheet
| Breakdown | February 29, 2024 | February 28, 2023 | February 28, 2022 | February 28, 2021 | February 29, 2020 |
|---|---|---|---|---|---|
| Cash and Cash Equivalents | $322.83K | $- | $873.44K | $203.95K | $- |
| Short Term Investments | $- | $-85.43M | $-117.58M | $-131.22M | $-146.57M |
| Cash and Short Term Investments | $322.83K | $-85.43M | $873.44K | $203.95K | $-146.57M |
| Net Receivables | $6.13M | $12.85M | $8.74M | $9.00M | $5.85M |
| Inventory | $- | $96.25M | $6.54M | $-0 | $152.42M |
| Other Current Assets | $- | $- | $- | $- | $- |
| Total Current Assets | $6.46M | $12.85M | $9.61M | $9.21M | $5.85M |
| Property Plant Equipment Net | $- | $- | $- | $- | $- |
| Goodwill | $- | $- | $- | $- | $- |
| Intangible Assets | $- | $- | $- | $- | $- |
| Goodwill and Intangible Assets | $- | $- | $- | $- | $- |
| Long Term Investments | $440.23M | $382.47M | $452.24M | $468.83M | $497.11M |
| Tax Assets | $- | $- | $- | $- | $- |
| Other Non-Current Assets | $- | $-85.43M | $-117.58M | $-131.22M | $-146.57M |
| Total Non-Current Assets | $440.23M | $297.05M | $334.66M | $337.62M | $350.54M |
| Other Assets | $- | $85.43M | $117.58M | $131.22M | $146.57M |
| Total Assets | $446.69M | $395.33M | $461.85M | $478.04M | $502.96M |
| Account Payables | $139.67K | $3.26M | $2.16M | $48.72K | $6.11M |
| Short Term Debt | $- | $3.56M | $- | $- | $- |
| Tax Payables | $- | $- | $- | $- | $- |
| Deferred Revenue | $- | $-3.56M | $- | $- | $-1.38M |
| Other Current Liabilities | $- | $213.63K | $-2.16M | $-48.72K | $31.48M |
| Total Current Liabilities | $139.67K | $7.03M | $2.37M | $219.43K | $37.59M |
| Long Term Debt | $140.80M | $59.38M | $- | $- | $83.88M |
| Deferred Revenue Non-Current | $- | $- | $- | $- | $- |
| Deferred Tax Liabilities Non-Current | $- | $- | $- | $- | $- |
| Other Non-Current Liabilities | $160.60K | $-59.38M | $- | $- | $-83.88M |
| Total Non-Current Liabilities | $140.96M | $89.37M | $104.95M | $111.37M | $83.88M |
| Other Liabilities | $100.37K | $169.16K | $176.15K | $205.83K | $209.01K |
| Total Liabilities | $141.20M | $96.57M | $107.49M | $111.80M | $121.67M |
| Preferred Stock | $- | $- | $- | $- | $- |
| Common Stock | $345.39M | $345.83M | $345.90M | $345.60M | $345.45M |
| Retained Earnings | $-39.91M | $-47.07M | $8.46M | $20.64M | $35.84M |
| Accumulated Other Comprehensive Income Loss | $- | $-0 | $0 | $-0 | $-0 |
| Other Total Stockholders Equity | $- | $- | $- | $- | $- |
| Total Stockholders Equity | $305.49M | $298.76M | $354.36M | $366.25M | $381.29M |
| Total Equity | $305.49M | $298.76M | $354.36M | $366.25M | $381.29M |
| Total Liabilities and Stockholders Equity | $446.69M | $395.33M | $461.85M | $478.04M | $502.96M |
| Minority Interest | $- | $- | $- | $- | $- |
| Total Liabilities and Total Equity | $446.69M | $395.33M | $461.85M | $478.04M | $502.96M |
| Total Investments | $440.23M | $297.05M | $334.66M | $337.62M | $350.54M |
| Total Debt | $140.80M | $59.38M | $75.00M | $81.42M | $83.88M |
| Net Debt | $140.48M | $59.38M | $74.12M | $81.21M | $83.88M |
Balance Sheet Charts
| Breakdown | August 31, 2024 | February 29, 2024 | August 31, 2023 | February 28, 2023 | August 31, 2022 | February 28, 2022 | August 31, 2021 | February 28, 2021 | August 31, 2020 | February 29, 2020 | August 31, 2019 | February 28, 2019 | August 31, 2018 | February 28, 2018 | August 31, 2017 | February 28, 2017 | August 31, 2016 | February 29, 2016 | August 31, 2015 | February 28, 2015 |
|---|---|---|---|---|---|---|---|---|---|---|---|---|---|---|---|---|---|---|---|---|
| Cash and Cash Equivalents | $1.55M | $322.83K | $- | $- | $- | $873.44K | $- | $203.95K | $- | $- | $997.29K | $- | $1.58M | $- | $- | $- | $- | $- | $- | $- |
| Short Term Investments | $- | $- | $- | $-85.43M | $-98.45M | $-117.58M | $-123.90M | $- | $- | $- | $- | $- | $- | $- | $- | $- | $- | $- | $- | $- |
| Cash and Short Term Investments | $1.55M | $322.83K | $- | $-85.43M | $-98.45M | $873.44K | $-123.90M | $203.95K | $- | $- | $997.29K | $- | $1.58M | $- | $- | $- | $- | $- | $- | $- |
| Net Receivables | $5.30M | $6.13M | $6.87M | $12.85M | $15.08M | $8.74M | $9.12M | $9.00M | $8.36M | $5.85M | $6.15M | $6.25M | $7.57M | $13.66M | $8.34M | $5.65M | $6.33M | $5.69M | $6.08M | $9.51M |
| Inventory | $- | $- | $- | $96.25M | $111.12M | $6.54M | $130.14M | $-0 | $- | $- | $- | $- | $- | $- | $- | $- | $- | $- | $- | $- |
| Other Current Assets | $-6.85M | $- | $- | $- | $- | $- | $- | $- | $- | $- | $- | $176.47K | $- | $- | $- | $- | $4.76K | $- | $- | $- |
| Total Current Assets | $- | $6.46M | $6.87M | $12.85M | $15.08M | $9.61M | $9.12M | $9.21M | $8.36M | $5.85M | $7.15M | $6.25M | $9.14M | $13.66M | $8.34M | $5.65M | $6.33M | $5.69M | $6.08M | $9.51M |
| Property Plant Equipment Net | $- | $- | $- | $- | $- | $- | $- | $- | $- | $- | $- | $- | $- | $- | $- | $- | $- | $- | $- | $- |
| Goodwill | $- | $- | $- | $- | $- | $- | $- | $- | $- | $- | $- | $- | $- | $- | $- | $- | $- | $- | $- | $- |
| Intangible Assets | $- | $- | $- | $- | $- | $- | $- | $- | $- | $- | $- | $- | $- | $- | $- | $- | $- | $- | $- | $- |
| Goodwill and Intangible Assets | $- | $- | $- | $- | $- | $- | $- | $- | $- | $- | $- | $- | $- | $- | $- | $- | $- | $- | $- | $- |
| Long Term Investments | $- | $441.02M | $403.81M | $382.47M | $412.19M | $452.24M | $478.48M | $468.83M | $460.82M | $497.11M | $480.71M | $458.37M | $462.68M | $447.91M | $424.74M | $413.70M | $438.21M | $419.81M | $406.49M | $408.03M |
| Tax Assets | $- | $- | $- | $- | $- | $- | $- | $- | $- | $- | $- | $- | $- | $- | $- | $- | $- | $- | $- | $- |
| Other Non-Current Assets | $- | $-441.02M | $-403.81M | $-85.43M | $-98.45M | $-117.58M | $-123.90M | $-468.83M | $-460.82M | $-497.11M | $-480.71M | $-458.37M | $-462.68M | $-447.91M | $-424.74M | $64.53K | $76.81K | $55.81K | $57.45K | $62.98K |
| Total Non-Current Assets | $- | $440.23M | $403.81M | $297.05M | $313.75M | $334.66M | $354.58M | $468.83M | $460.82M | $497.11M | $480.71M | $458.37M | $462.68M | $447.91M | $424.74M | $413.76M | $438.29M | $419.87M | $406.55M | $408.10M |
| Other Assets | $438.96M | $- | $- | $85.43M | $98.45M | $117.58M | $123.90M | $- | $- | $1.85K | $23.23K | $182.43K | $55.15K | $27.84K | $35.38K | $- | $- | $- | $- | $- |
| Total Assets | $438.96M | $446.69M | $410.68M | $395.33M | $427.28M | $461.85M | $487.61M | $478.04M | $469.18M | $502.96M | $487.88M | $464.80M | $471.88M | $461.60M | $433.12M | $419.42M | $444.62M | $425.56M | $412.63M | $417.61M |
| Account Payables | $- | $139.67K | $138.08K | $3.26M | $12.22M | $2.16M | $798.36K | $48.72K | $49.71K | $6.11M | $81.13K | $84.09K | $1.65M | $7.63M | $- | $59.50K | $- | $1.75M | $775.00K | $4.01M |
| Short Term Debt | $- | $- | $203.80K | $3.56M | $4.39M | $- | $2.59M | $- | $- | $- | $- | $269.52K | $- | $10.86K | $1.94M | $1.33M | $1.61M | $2.58M | $205.03K | $494.10K |
| Tax Payables | $- | $- | $- | $- | $- | $- | $- | $- | $- | $- | $- | $- | $- | $- | $- | $- | $- | $- | $- | $- |
| Deferred Revenue | $- | $- | $-65.72K | $-3.56M | $-4.39M | $- | $-2.59M | $- | $-100.42K | $-1.38M | $- | $-269.52K | $- | $-10.86K | $- | $- | $- | $- | $- | $- |
| Other Current Liabilities | $- | $-139.67K | $-341.88K | $213.63K | $183.93K | $-2.16M | $152.93K | $-48.72K | $-49.71K | $1.72M | $-81.13K | $235.02K | $-1.65M | $107.82K | $-1.94M | $122.65K | $82.35K | $112.11K | $117.10K | $118.89K |
| Total Current Liabilities | $- | $139.67K | $138.08K | $7.03M | $16.79M | $2.37M | $3.54M | $48.72K | $49.71K | $7.83M | $432.18K | $588.62K | $1.96M | $7.97M | $1.94M | $1.51M | $1.69M | $4.44M | $1.10M | $4.62M |
| Long Term Debt | $114.60M | $140.80M | $87.78M | $59.38M | $67.17M | $- | $75.25M | $- | $- | $83.88M | $- | $85.72M | $- | $71.94M | $69.96M | $64.38M | $66.62M | $58.22M | $56.18M | $53.13M |
| Deferred Revenue Non-Current | $- | $- | $- | $- | $- | $- | $- | $- | $- | $- | $- | $- | $- | $- | $- | $- | $- | $- | $- | $- |
| Deferred Tax Liabilities Non-Current | $- | $- | $- | $- | $- | $- | $- | $- | $- | $- | $- | $- | $- | $- | $- | $- | $- | $- | $- | $- |
| Other Non-Current Liabilities | $-114.60M | $-140.80M | $-87.78M | $-59.38M | $-67.17M | $- | $-75.25M | $- | $- | $-83.88M | $- | $-85.72M | $- | $-71.94M | $-69.96M | $228.58K | $235.00K | $254.15K | $248.31K | $248.74K |
| Total Non-Current Liabilities | $- | $141.20M | $87.78M | $89.37M | $97.14M | $104.95M | $105.24M | $81.42M | $49.71K | $113.85M | $116.89M | $115.65M | $116.27M | $101.81M | $72.13M | $64.61M | $66.86M | $58.47M | $56.43M | $53.38M |
| Other Liabilities | $129.39M | $-139.67K | $30.43M | $169.16K | $171.90K | $176.15K | $198.65K | $30.33M | $114.44M | $-4 | $-3 | $1 | $-3 | $-3 | $-1.94M | $- | $- | $- | $- | $- |
| Total Liabilities | $129.39M | $141.20M | $118.35M | $96.57M | $114.10M | $107.49M | $108.98M | $111.80M | $114.54M | $121.67M | $117.33M | $116.23M | $118.22M | $109.78M | $72.13M | $66.12M | $68.55M | $62.91M | $57.53M | $58.00M |
| Preferred Stock | $- | $- | $- | $- | $313.17M | $- | $- | $- | $- | $- | $- | $- | $- | $0 | $- | $- | $- | $- | $- | $- |
| Common Stock | $345.50M | $345.39M | $345.92M | $345.83M | $345.95M | $345.90M | $345.74M | $345.60M | $345.45M | $345.45M | $345.20M | $345.11M | $348.55M | $348.40M | $357.29M | $357.14M | $367.96M | $367.84M | $383.51M | $383.51M |
| Retained Earnings | $-35.94M | $-39.91M | $-53.60M | $-47.07M | $-32.78M | $8.46M | $32.89M | $20.64M | $9.20M | $35.84M | $25.36M | $3.46M | $1.98M | $2.60M | $3.15M | $-3.85M | $8.11M | $-5.20M | $-28.41M | $-23.91M |
| Accumulated Other Comprehensive Income Loss | $- | $-0 | $0 | $-0 | $0 | $0 | $-0 | $-0 | $0 | $-0 | $-0 | $-0 | $0 | $-0 | $-0 | $-0 | $0 | $0 | $-0 | $0 |
| Other Total Stockholders Equity | $- | $- | $- | $- | $-313.17M | $- | $- | $- | $- | $- | $- | $- | $-0 | $-0 | $0 | $0 | $1 | $-0 | $0 | $-0 |
| Total Stockholders Equity | $309.56M | $305.49M | $292.33M | $298.76M | $313.17M | $354.36M | $378.63M | $366.25M | $354.64M | $381.29M | $370.56M | $348.57M | $353.65M | $351.82M | $360.99M | $353.30M | $376.06M | $362.64M | $355.10M | $359.60M |
| Total Equity | $309.56M | $305.49M | $292.33M | $298.76M | $313.17M | $354.36M | $378.63M | $366.25M | $354.64M | $381.29M | $370.56M | $348.57M | $353.65M | $351.82M | $360.99M | $353.30M | $376.06M | $362.64M | $355.10M | $359.60M |
| Total Liabilities and Stockholders Equity | $438.96M | $446.69M | $410.68M | $395.33M | $427.28M | $461.85M | $487.61M | $478.04M | $469.18M | $502.96M | $487.88M | $464.80M | $471.88M | $461.60M | $433.12M | $419.42M | $444.62M | $425.56M | $412.63M | $417.61M |
| Minority Interest | $- | $- | $- | $- | $- | $- | $- | $- | $- | $- | $- | $- | $- | $- | $- | $- | $- | $- | $- | $- |
| Total Liabilities and Total Equity | $438.96M | $446.69M | $410.68M | $395.33M | $427.28M | $461.85M | $487.61M | $478.04M | $469.18M | $502.96M | $487.88M | $464.80M | $471.88M | $461.60M | $433.12M | $419.42M | $444.62M | $425.56M | $412.63M | $417.61M |
| Total Investments | $- | $441.02M | $403.81M | $297.05M | $313.75M | $334.66M | $354.58M | $468.83M | $460.82M | $497.11M | $480.71M | $458.37M | $462.68M | $447.91M | $424.74M | $413.70M | $438.21M | $419.81M | $406.49M | $408.03M |
| Total Debt | $114.60M | $140.80M | $87.78M | $59.38M | $67.17M | $75.00M | $75.25M | $81.42M | $84.01M | $83.88M | $86.94M | $85.72M | $86.36M | $71.94M | $69.96M | $65.71M | $68.24M | $60.80M | $56.39M | $53.63M |
| Net Debt | $113.05M | $140.48M | $87.78M | $59.38M | $67.17M | $74.12M | $75.25M | $81.21M | $84.01M | $83.88M | $85.95M | $85.72M | $84.79M | $71.94M | $69.96M | $65.71M | $68.24M | $60.80M | $56.39M | $53.63M |
Annual Cash Flow
| Breakdown | February 29, 2024 | February 28, 2023 | February 28, 2022 | February 28, 2021 | February 29, 2020 |
|---|---|---|---|---|---|
| Net Income | $21.90M | $-39.05M | $5.59M | $2.90M | $50.71M |
| Depreciation and Amortization | $- | $- | $- | $- | $- |
| Deferred Income Tax | $- | $- | $- | $- | $- |
| Stock Based Compensation | $- | $- | $- | $- | $- |
| Change in Working Capital | $-435.36K | $830.51K | $712.00K | $-377.72K | $626.91K |
| Accounts Receivables | $-322.95K | $713.35K | $753.01K | $-386.00K | $353.15K |
| Inventory | $- | $- | $- | $- | $- |
| Accounts Payables | $- | $- | $- | $- | $- |
| Other Working Capital | $-112.42K | $117.16K | $-41.01K | $8.28K | $273.76K |
| Other Non Cash Items | $-53.89M | $65.95M | $18.26M | $19.46M | $-32.61M |
| Net Cash Provided by Operating Activities | $-32.42M | $27.73M | $24.56M | $21.98M | $18.73M |
| Investments in Property Plant and Equipment | $- | $- | $- | $- | $- |
| Acquisitions Net | $- | $- | $- | $- | $- |
| Purchases of Investments | $- | $-81.52M | $-37.06M | $-63.91M | $-46.63M |
| Sales Maturities of Investments | $- | $96.83M | $48.27M | $68.20M | $49.31M |
| Other Investing Activities | $- | $- | $- | $- | $- |
| Net Cash Used for Investing Activities | $- | $15.31M | $11.21M | $4.28M | $2.68M |
| Debt Repayment | $51.47M | $-15.61M | $-6.42M | $-2.46M | $-1.84M |
| Common Stock Issued | $- | $- | $- | $- | $- |
| Common Stock Repurchased | $-583.08K | $-212.56K | $- | $- | $- |
| Dividends Paid | $-14.58M | $-16.55M | $-17.47M | $-17.94M | $-18.00M |
| Other Financing Activities | $-3.56M | $3.56M | $- | $-1.38M | $1.11M |
| Net Cash Used Provided by Financing Activities | $32.74M | $-28.60M | $-23.89M | $-21.77M | $-18.73M |
| Effect of Forex Changes on Cash | $- | $-15.31M | $-11.21M | $-4.28M | $- |
| Net Change in Cash | $322.83K | $-873.44K | $669.49K | $203.95K | $2.68M |
| Cash at End of Period | $322.83K | $- | $873.44K | $203.95K | $2.68M |
| Cash at Beginning of Period | $- | $873.44K | $203.95K | $- | $- |
| Operating Cash Flow | $-32.42M | $27.73M | $24.56M | $21.98M | $18.73M |
| Capital Expenditure | $- | $- | $- | $- | $- |
| Free Cash Flow | $-32.42M | $27.73M | $24.56M | $21.98M | $18.73M |
Cash Flow Charts
| Breakdown | August 31, 2024 | February 29, 2024 | August 31, 2023 | February 28, 2023 | August 31, 2022 | February 28, 2022 | August 31, 2021 | February 28, 2021 | August 31, 2020 | February 29, 2020 | August 31, 2019 | February 28, 2019 | August 31, 2018 | February 28, 2018 | August 31, 2017 | February 28, 2017 | August 31, 2016 | February 29, 2016 | August 31, 2015 | February 28, 2015 |
|---|---|---|---|---|---|---|---|---|---|---|---|---|---|---|---|---|---|---|---|---|
| Net Income | $12.29M | $20.81M | $1.10M | $-6.34M | $-32.71M | $-15.67M | $21.27M | $20.53M | $-17.63M | $19.62M | $31.09M | $4.17M | $11.49M | $486.75K | $17.34M | $-13.09M | $22.64M | $16.88M | $4.83M | $16.65M |
| Depreciation and Amortization | $- | $- | $- | $- | $- | $- | $- | $- | $- | $- | $- | $- | $- | $- | $- | $- | $- | $- | $- | $- |
| Deferred Income Tax | $- | $- | $- | $- | $- | $- | $- | $- | $- | $- | $- | $- | $- | $- | $- | $- | $- | $- | $- | $- |
| Stock Based Compensation | $- | $- | $- | $- | $- | $- | $- | $- | $- | $- | $- | $- | $- | $- | $- | $- | $- | $- | $- | $- |
| Change in Working Capital | $56.20K | $-116.32K | $-319.05K | $515.33K | $315.17K | $721.99K | $-10.00K | $102.59K | $-480.31K | $333.98K | $292.94K | $-112.04K | $-149.38K | $-201.59K | $-383.86K | $83.17K | $-53.70K | $14.74K | $-86.58K | $20.82K |
| Accounts Receivables | $- | $-77.17K | $-122.89K | $230.49K | $252.36K | $368.84K | $7.66K | $56.49K | $-249.50K | $176.37K | $203 | $133.90K | $-132.55K | $-353.00K | $-263.83K | $49.28K | $-28.57K | $13.50K | $-84.05K | $-6.11K |
| Inventory | $- | $- | $- | $- | $- | $- | $- | $- | $- | $- | $- | $- | $- | $- | $- | $- | $- | $- | $- | $- |
| Accounts Payables | $- | $- | $- | $- | $- | $- | $- | $- | $- | $- | $- | $- | $- | $- | $- | $- | $- | $- | $- | $- |
| Other Working Capital | $56.20K | $-39.14K | $-319.05K | $515.33K | $62.81K | $721.99K | $-10.00K | $102.59K | $-480.31K | $333.98K | $292.94K | $-245.95K | $-16.83K | $151.42K | $-120.03K | $33.88K | $-25.13K | $1.24K | $-2.53K | $26.93K |
| Other Non Cash Items | $-6.87M | $-35.60M | $4.69M | $12.35M | $43.43M | $22.27M | $-12.52M | $-12.60M | $25.71M | $-11.37M | $-23.10M | $5.57M | $-16.12M | $-20.68M | $-13.49M | $25.21M | $-20.78M | $-11.97M | $1.83M | $-14.03M |
| Net Cash Provided by Operating Activities | $5.48M | $-14.91M | $5.46M | $6.52M | $11.04M | $7.32M | $8.74M | $8.03M | $7.61M | $8.59M | $8.28M | $9.62M | $-4.78M | $-20.40M | $3.47M | $12.20M | $1.81M | $4.92M | $6.58M | $2.63M |
| Investments in Property Plant and Equipment | $4 | $- | $- | $- | $- | $- | $- | $- | $- | $- | $- | $- | $- | $- | $- | $- | $- | $- | $- | $- |
| Acquisitions Net | $- | $- | $- | $- | $- | $- | $- | $- | $- | $- | $- | $- | $- | $- | $- | $- | $- | $- | $- | $- |
| Purchases of Investments | $-9.95M | $-103.00M | $-75.51M | $-33.89M | $-95.25M | $-14.23M | $-22.83M | $-21.58M | $-42.34M | $-27.49M | $-19.14M | $- | $- | $- | $- | $- | $- | $- | $- | $- |
| Sales Maturities of Investments | $40.19M | $56.95M | $52.39M | $41.97M | $109.73M | $18.83M | $29.44M | $23.83M | $44.37M | $29.21M | $20.10M | $- | $- | $- | $- | $- | $- | $- | $- | $- |
| Other Investing Activities | $-4 | $- | $- | $- | $- | $- | $- | $- | $- | $- | $- | $- | $- | $- | $- | $- | $- | $- | $- | $- |
| Net Cash Used for Investing Activities | $30.24M | $-46.05M | $-23.11M | $8.07M | $14.48M | $4.60M | $6.61M | $2.25M | $2.03M | $1.72M | $964.00K | $- | $- | $- | $- | $- | $- | $- | $- | $- |
| Debt Repayment | $- | $- | $- | $- | $- | $-2.85M | $-3.57M | $-2.75M | $-1.09M | $- | $- | $- | $- | $- | $- | $- | $- | $- | $- | $- |
| Common Stock Issued | $- | $- | $- | $36.10M | $- | $- | $- | $- | $- | $- | $- | $- | $- | $- | $- | $- | $- | $- | $- | $- |
| Common Stock Repurchased | $- | $-583.08K | $- | $-106.28K | $- | $- | $- | $- | $- | $- | $- | $- | $- | $60.00M | $- | $- | $- | $- | $- | $- |
| Dividends Paid | $-8.21M | $-15.26M | $-7.53M | $-8.07M | $-8.48M | $-8.59M | $-8.88M | $-8.92M | $-9.01M | $-8.89M | $-9.10M | $-10.82M | $-8.06M | $-9.66M | $-9.65M | $-9.68M | $-9.25M | $-9.33M | $-9.33M | $-9.33M |
| Other Financing Activities | $-26.25M | $46.31M | $21.28M | $-12.65M | $-15.35M | $- | $- | $- | $- | $-1.69M | $955.48K | $10.45M | $14.41M | $30.05M | $6.19M | $-2.52M | $7.44M | $4.41M | $2.76M | $6.70M |
| Net Cash Used Provided by Financing Activities | $-34.46M | $15.23M | $17.51M | $-16.69M | $-11.91M | $-11.44M | $-12.45M | $-11.67M | $-10.10M | $-10.59M | $-8.14M | $-11.20M | $6.35M | $20.40M | $-3.47M | $-12.20M | $-1.81M | $-4.92M | $-6.58M | $-2.63M |
| Effect of Forex Changes on Cash | $- | $- | $- | $- | $-6.10M | $- | $- | $- | $- | $- | $- | $- | $- | $- | $- | $- | $- | $- | $- | $- |
| Net Change in Cash | $1.22M | $-2.58M | $-137.49K | $-2.09M | $-1.31M | $479.81K | $-305.92K | $-1.38M | $-470.00K | $-278.33K | $1.10M | $-787.59K | $787.59K | $- | $- | $- | $- | $- | $- | $- |
| Cash at End of Period | $1.55M | $322.83K | $-137.49K | $-2.09M | $-436.72K | $873.44K | $-101.97K | $203.95K | $-470.00K | $-997.29K | $997.29K | $-1.58M | $1.58M | $- | $- | $- | $- | $- | $- | $- |
| Cash at Beginning of Period | $322.83K | $2.90M | $- | $- | $873.44K | $393.63K | $203.95K | $1.59M | $- | $-718.96K | $-100.00K | $-787.59K | $787.59K | $- | $- | $- | $- | $- | $- | $- |
| Operating Cash Flow | $5.48M | $-14.91M | $5.46M | $6.52M | $11.04M | $7.32M | $8.74M | $8.03M | $7.61M | $8.59M | $8.28M | $9.62M | $-4.78M | $-20.40M | $3.47M | $12.20M | $1.81M | $4.92M | $6.58M | $2.63M |
| Capital Expenditure | $4 | $- | $- | $- | $- | $- | $- | $- | $- | $- | $- | $- | $- | $- | $- | $- | $- | $- | $- | $- |
| Free Cash Flow | $5.48M | $-14.91M | $5.46M | $6.52M | $11.04M | $7.32M | $8.74M | $8.03M | $7.61M | $8.59M | $8.28M | $9.62M | $-4.78M | $-20.40M | $3.47M | $12.20M | $1.81M | $4.92M | $6.58M | $2.63M |
Invesco Municipal Income Opportunities Trust Dividends
Explore Invesco Municipal Income Opportunities Trust's dividend history, including dividend yield, payout ratio, and historical payments.
Dividend Yield
4.89%
Dividend Payout Ratio
66.57%
Dividend Paid & Capex Coverage Ratio
-2.22x
Invesco Municipal Income Opportunities Trust Dividend History
| Dividend | Adjusted Dividend | Date | Record Date | Payment Date | Declaration Date |
|---|---|---|---|---|---|
| $0.0291 | $0.0291 | April 16, 2025 | April 16, 2025 | April 30, 2025 | March 24, 2025 |
| $0.0291 | $0.0291 | March 17, 2025 | March 17, 2025 | March 31, 2025 | March 03, 2025 |
| $0.0291 | $0.0291 | February 18, 2025 | February 18, 2025 | February 28, 2025 | February 03, 2025 |
| $0.0291 | $0.0291 | January 17, 2025 | January 17, 2025 | January 31, 2025 | January 02, 2025 |
| $0.0291 | $0.0291 | December 17, 2024 | December 17, 2024 | December 31, 2024 | December 02, 2024 |
| $0.0291 | $0.0291 | November 15, 2024 | November 15, 2024 | November 29, 2024 | November 01, 2024 |
| $0.0291 | $0.0291 | October 16, 2024 | October 16, 2024 | October 31, 2024 | October 01, 2024 |
| $0.0291 | $0.0291 | September 17, 2024 | September 17, 2024 | September 30, 2024 | September 03, 2024 |
| $0.0291 | $0.0291 | August 16, 2024 | August 16, 2024 | August 30, 2024 | August 01, 2024 |
| $0.0291 | $0.0291 | July 16, 2024 | July 16, 2024 | July 31, 2024 | July 01, 2024 |
| $0.0291 | $0.0291 | June 18, 2024 | June 18, 2024 | June 28, 2024 | May 23, 2024 |
| $0.029 | $0.029 | May 15, 2024 | |||
| $0.0291 | $0.0291 | April 15, 2024 | April 16, 2024 | April 30, 2024 | April 01, 2024 |
| $0.0291 | $0.0291 | March 14, 2024 | March 15, 2024 | March 28, 2024 | March 01, 2024 |
| $0.0291 | $0.0291 | February 15, 2024 | February 16, 2024 | February 29, 2024 | January 29, 2024 |
| $0.0265 | $0.0265 | January 16, 2024 | January 17, 2024 | January 31, 2024 | January 02, 2024 |
| $0.0265 | $0.0265 | December 14, 2023 | December 15, 2023 | December 29, 2023 | December 01, 2023 |
| $0.0265 | $0.0265 | November 14, 2023 | November 15, 2023 | November 30, 2023 | November 01, 2023 |
| $0.0265 | $0.0265 | October 13, 2023 | October 16, 2023 | October 31, 2023 | October 02, 2023 |
| $0.0265 | $0.0265 | September 14, 2023 | September 15, 2023 | September 29, 2023 | September 01, 2023 |
Invesco Municipal Income Opportunities Trust News
Read the latest news about Invesco Municipal Income Opportunities Trust, including recent articles, headlines, and updates.
Invesco Closed-End Funds Declare Dividends
ATLANTA , Dec. 2, 2024 /PRNewswire/ -- The Board of Trustees of each of the Invesco closed-end funds listed below declared dividends. EX-DATE RECORD DATE REINVEST DATE PAYABLE DATE 12/17/2024 12/17/2024 12/31/2024 12/31/2024 Name of Closed-EndManagement Investment Company Ticker MonthlyDividend Per Share ChangeFrom PriorDistribution % ChangeFrom PriorDistribution Invesco Advantage Municipal Income Trust II VKI $0.05591 - - Invesco Bond Fund VBF $0.08501 +0.0110 +15 % Invesco California Value Municipal Income Trust VCV $0.06461 - - Invesco Municipal Income Opportunities Trust OIA $0.0291 - - Invesco Municipal Opportunity Trust VMO $0.06251 - - Invesco Municipal Trust VKQ $0.06281 - - Invesco Pennsylvania Value Municipal Income Trust VPV $0.06671 - - Invesco Quality Municipal Income Trust IQI $0.06311 - - Invesco Trust for Investment Grade Municipals VGM $0.06461 - - Invesco Trust for Investment Grade New York Municipals VTN $0.06851 - - Invesco Value Municipal Income Trust IIM $0.07711 - - 1 A portion of this distribution is estimated to be from a return of principal rather than net income.


Invesco Advisers, Inc. Announces Addition to Portfolio Management Team for Invesco Municipal Income Opportunities Trust
ATLANTA , Feb. 1, 2024 /PRNewswire/ -- Invesco Advisers, Inc., a subsidiary of Invesco Ltd. ("Invesco") (NYSE: IVZ), announced today the addition of Mark DeMitry to the portfolio management team for Invesco Municipal Income Opportunities Trust (the "Fund") (NYSE: OIA).

Invesco Advisers Announces Portfolio Management Changes for Invesco Municipal Closed-End Funds
ATLANTA , June 8, 2023 /PRNewswire/ -- Invesco Advisers, Inc., a subsidiary of Invesco Ltd. (NYSE: IVZ), announced today portfolio management changes for the following Invesco closed-end municipal funds (the "Funds"): Invesco Advantage Municipal Income Trust II (NYSE American: VKI) Invesco California Value Municipal Income Trust (NYSE: VCV) Invesco Municipal Income Opportunities Trust (NYSE: OIA) Invesco Municipal Opportunity Trust (NYSE: VMO) Invesco Municipal Trust (NYSE: VKQ) Invesco Pennsylvania Value Municipal Income Trust (NYSE: VPV) Invesco Quality Municipal Income Trust (NYSE: IQI) Invesco Trust for Investment Grade Municipals (NYSE: VGM) Invesco Trust for Investment Grade New York Municipals (NYSE: VTN) Invesco Value Municipal Income Trust (NYSE: IIM) Effective June 30, 2023, the following individuals are jointly and primarily responsible for the day-to-day management of Invesco Advantage Municipal Income Trust II, Invesco Municipal Opportunity Trust, Invesco Municipal Trust, Invesco Quality Municipal Income Trust, Invesco Trust for Investment Grade Municipals and Invesco Value Municipal Income Trust's portfolio: Mark Paris, Portfolio Manager, who has been associated with Invesco and/or its affiliates since 2010.


CEF Report August 2022 - CEFs Continue In Rally Mode, But For How Long?
Risk assets continue to rebound with investors focusing on the potential of a Fed pivot given slower growth and inflation. We think we will shift from a stagflationary economic regime to a deflationary bust one. That means adding duration and quality.

Double Down On Alpha In CEF Allocation
A lack of further yield compression and low yields suggest that future fixed-income returns are likely to be well below their historic levels. This suggests that investors should seek out funds that are able to deliver additional alpha through structural features or active management.


HY Munis Worth A Look Vs. HY Corporate Credit Right Now
"High-yield" tends to be associated with corporate credit in investor income portfolios. However, the high-yield/unrated municipal sector is also worth a look. We discuss some benefits of HY muni bond CEFs over their corporate analogues such as relative valuation, higher-quality fund portfolios, resilient leverage structures and more.


Similar Companies
Virtus Convertible & Income 2024 Target Term Fund
CBH
Price: $9.19
Market Cap: $167.75M
Eaton Vance National Municipal Opportunities Trust
EOT
Price: $16.71
Market Cap: $261.09M
Related Metrics
Explore detailed financial metrics and analysis for OIA.