Ormat Technologies Key Executives
This section highlights Ormat Technologies's key executives, including their titles and compensation details.
Find Contacts at Ormat Technologies
(Showing 0 of )
Ormat Technologies Earnings
This section highlights Ormat Technologies's earnings, including key dates, EPS, earnings reports, and earnings call transcripts.
Next Earnings Date
Last Earnings Results
Earnings Call Transcripts
| Transcript | Quarter | Year | Date | Estimated EPS | Actual EPS |
|---|---|---|---|---|---|
| Read Transcript | Q4 | 2024 | 2025-02-27 | N/A | N/A |
| Read Transcript | Q2 | 2024 | 2024-08-07 | N/A | N/A |
| Read Transcript | Q1 | 2024 | 2024-05-09 | N/A | N/A |
| Read Transcript | Q4 | 2023 | 2024-02-22 | N/A | N/A |
| Read Transcript | Q3 | 2023 | 2023-11-09 | N/A | N/A |
| Read Transcript | Q2 | 2023 | 2023-08-03 | N/A | N/A |
| Read Transcript | Q1 | 2023 | 2023-05-10 | N/A | N/A |
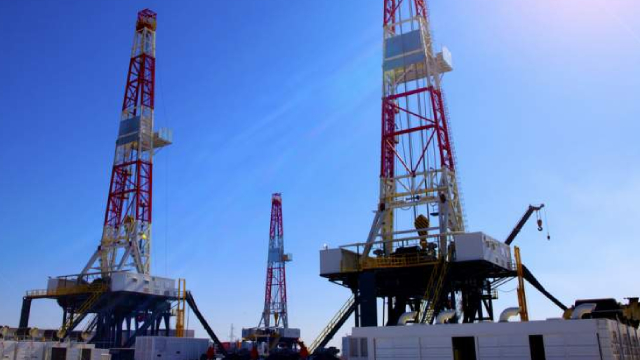
Ormat Technologies, Inc. engages in the geothermal and recovered energy power business in the United States, Indonesia, Kenya, Turkey, Chile, Guadeloupe, Guatemala, Ethiopia, New Zealand, Honduras, and internationally. It operates through three segments: Electricity, Product, and Energy Storage. The Electricity segment develops, builds, owns, and operates geothermal, solar photovoltaic, and recovered energy-based power plants; and sells electricity. The Product segment designs, manufactures, and sells equipment for geothermal, recovered energy-based electricity generation, and remote power units, such as fossil fuel powered turbo-generators and heavy duty direct-current generators; and provides services relating to the engineering, procurement, construction, operation, and maintenance of geothermal and recovered energy-based power plants. The Product segment serves contractors; developers, owners, and operators of geothermal power plants; and owners and operators of interstate natural gas pipelines, gas processing plants, and cement plants, as well as companies in other energy-intensive industrial processes. The Energy Storage segment offers energy storage and related services, as well as services relating to the engineering, procurement, construction, operation, and maintenance of energy storage units. Ormat Technologies, Inc. was founded in 1965 and is based in Reno, Nevada.
$71.64
Stock Price
$4.33B
Market Cap
1.51K
Employees
Reno, NV
Location
Financial Statements
Access annual & quarterly financial statements for Ormat Technologies, including income statements, balance sheets, and cash flow statements..
Annual Income Statement
| Breakdown | December 31, 2024 | December 31, 2023 | December 31, 2022 | December 31, 2021 | December 31, 2020 |
|---|---|---|---|---|---|
| Revenue | $879.65M | $829.42M | $734.16M | $663.08M | $705.34M |
| Cost of Revenue | $607.03M | $565.41M | $465.33M | $398.75M | $429.07M |
| Gross Profit | $272.62M | $264.02M | $268.82M | $264.34M | $276.27M |
| Gross Profit Ratio | 30.99% | 31.80% | 36.62% | 39.90% | 39.17% |
| Research and Development Expenses | $6.50M | $7.21M | $5.08M | $4.13M | $5.39M |
| General and Administrative Expenses | $80.12M | $68.18M | $61.27M | $75.90M | $60.23M |
| Selling and Marketing Expenses | $17.69M | $18.31M | $16.19M | $15.20M | $17.38M |
| Selling General and Administrative Expenses | $97.81M | $86.48M | $77.47M | $91.10M | $77.61M |
| Other Expenses | $-4.17M | $3.73M | $33.18M | $29.45M | $27.14M |
| Operating Expenses | $100.15M | $97.43M | $82.55M | $95.23M | $83.00M |
| Cost and Expenses | $707.18M | $662.84M | $547.88M | $493.98M | $512.07M |
| Interest Income | $7.88M | $11.98M | $3.42M | $2.12M | $1.72M |
| Interest Expense | $134.03M | $98.88M | $87.74M | $82.66M | $77.95M |
| Depreciation and Amortization | $262.86M | $230.96M | $204.05M | $178.68M | $151.13M |
| EBITDA | $512.27M | $468.93M | $387.40M | $364.89M | $397.80M |
| EBITDA Ratio | 58.24% | 56.54% | 30.36% | 30.26% | 31.49% |
| Operating Income | $172.47M | $166.59M | $24.08M | $17.71M | $65.51M |
| Operating Income Ratio | 19.61% | 20.08% | 3.28% | 2.67% | 9.29% |
| Total Other Income Expenses Net | $-57.09M | $-27.50M | $-57.19M | $-65.81M | $-45.30M |
| Income Before Tax | $115.38M | $139.09M | $95.61M | $103.55M | $168.72M |
| Income Before Tax Ratio | 13.12% | 16.77% | 13.02% | 15.62% | 23.92% |
| Income Tax Expense | $-16.29M | $5.98M | $14.74M | $24.85M | $67.00M |
| Net Income | $123.73M | $124.40M | $65.84M | $62.09M | $85.46M |
| Net Income Ratio | 14.07% | 15.00% | 8.97% | 9.36% | 12.12% |
| EPS | $2.05 | $2.09 | $1.17 | $1.11 | $1.66 |
| EPS Diluted | $2.04 | $2.08 | $1.17 | $1.10 | $1.65 |
| Weighted Average Shares Outstanding | 60.45M | 59.42M | 56.06M | 56.00M | 51.57M |
| Weighted Average Shares Outstanding Diluted | 60.79M | 59.76M | 56.50M | 56.40M | 51.94M |
| SEC Filing | Source | Source | Source | Source | Source |
| Breakdown | December 31, 2024 | September 30, 2024 | June 30, 2024 | March 31, 2024 | December 31, 2023 | September 30, 2023 | June 30, 2023 | March 31, 2023 | December 31, 2022 | September 30, 2022 | June 30, 2022 | March 31, 2022 | December 31, 2021 | September 30, 2021 | June 30, 2021 | March 31, 2021 | December 31, 2020 | September 30, 2020 | June 30, 2020 | March 31, 2020 |
|---|---|---|---|---|---|---|---|---|---|---|---|---|---|---|---|---|---|---|---|---|
| Revenue | $230.74M | $211.78M | $212.96M | $224.17M | $241.34M | $208.06M | $194.80M | $185.23M | $205.49M | $175.88M | $169.08M | $183.71M | $190.99M | $158.84M | $146.90M | $166.35M | $179.38M | $158.95M | $174.90M | $192.11M |
| Cost of Revenue | $157.18M | $152.92M | $151.58M | $145.36M | $162.88M | $148.05M | $145.31M | $109.16M | $125.28M | $114.78M | $111.48M | $113.81M | $115.41M | $95.70M | $94.93M | $92.70M | $104.34M | $104.92M | $109.51M | $110.30M |
| Gross Profit | $73.56M | $58.86M | $61.39M | $78.81M | $78.46M | $60.00M | $49.49M | $76.07M | $80.21M | $61.11M | $57.60M | $69.91M | $75.58M | $63.14M | $51.98M | $73.65M | $75.04M | $54.03M | $65.39M | $81.82M |
| Gross Profit Ratio | 31.88% | 27.80% | 28.80% | 35.20% | 32.50% | 28.80% | 25.40% | 41.10% | 39.00% | 34.70% | 34.10% | 38.10% | 39.60% | 39.80% | 35.40% | 44.30% | 41.83% | 33.99% | 37.38% | 42.59% |
| Research and Development Expenses | $1.39M | $1.82M | $1.73M | $1.56M | $2.45M | $1.39M | $2.08M | $1.29M | $1.39M | $1.24M | $1.39M | $1.06M | $950.00K | $1.18M | $1.13M | $876.00K | $1.11M | $1.49M | $1.17M | $1.62M |
| General and Administrative Expenses | $19.58M | $22.97M | $18.03M | $19.54M | $18.65M | $14.04M | $17.81M | $17.67M | $14.12M | $16.06M | $13.53M | $17.57M | $15.50M | $23.55M | $18.24M | $18.61M | $17.07M | $14.54M | $11.29M | $14.35M |
| Selling and Marketing Expenses | $4.15M | $4.25M | $4.17M | $5.13M | $4.31M | $4.68M | $5.37M | $3.95M | $3.78M | $4.09M | $3.95M | $4.37M | $4.26M | $2.67M | $3.99M | $4.28M | $3.66M | $4.08M | $4.85M | $4.79M |
| Selling General and Administrative Expenses | $23.74M | $27.22M | $22.19M | $23.36M | $22.14M | $18.73M | $23.18M | $21.61M | $17.90M | $20.15M | $17.48M | $21.94M | $19.77M | $26.23M | $22.23M | $22.88M | $20.73M | $18.61M | $16.14M | $19.14M |
| Other Expenses | $-651.00K | $-5.85M | $15.87M | $17.50M | $19.95M | $15.04M | $15.06M | $12.63M | $7.34M | $9.79M | $8.27M | $7.78M | $8.10M | $7.92M | $7.40M | $6.02M | $8.98M | $7.97M | $5.98M | $4.21M |
| Operating Expenses | $24.48M | $23.19M | $23.92M | $24.93M | $24.60M | $20.12M | $25.27M | $22.90M | $19.29M | $21.39M | $18.87M | $23.00M | $20.71M | $27.40M | $23.36M | $23.76M | $21.85M | $20.11M | $17.31M | $20.76M |
| Cost and Expenses | $181.66M | $176.11M | $175.50M | $170.28M | $187.48M | $168.17M | $170.57M | $132.07M | $144.57M | $136.16M | $130.34M | $136.81M | $136.13M | $123.10M | $118.28M | $116.46M | $126.19M | $125.02M | $126.83M | $131.06M |
| Interest Income | $1.39M | $2.05M | $2.60M | $1.84M | $2.36M | $2.83M | $4.94M | $1.85M | $1.24M | $1.66M | $179.00K | $342.00K | $534.00K | $519.00K | $808.00K | $263.00K | $248.00K | $626.00K | $441.00K | $402.00K |
| Interest Expense | $34.52M | $34.82M | $33.72M | $30.97M | $29.74M | $25.05M | $24.39M | $23.63M | $23.84M | $22.40M | $20.42M | $21.08M | $22.79M | $22.23M | $18.63M | $19.02M | $19.14M | $21.76M | $19.79M | $17.27M |
| Depreciation and Amortization | $70.05M | $132.47M | $65.79M | $64.26M | $59.33M | $59.05M | $55.81M | $54.69M | $55.64M | $51.78M | $50.26M | $49.34M | $49.64M | $49.86M | $44.40M | $43.05M | $40.94M | $40.81M | $37.91M | $36.95M |
| EBITDA | $136.29M | $126.22M | $101.87M | $118.14M | $133.98M | $96.62M | $98.76M | $107.86M | $92.43M | $101.83M | $93.31M | $102.80M | $114.64M | $94.27M | $73.01M | $92.94M | $105.96M | $102.92M | $93.84M | $103.79M |
| EBITDA Ratio | 59.07% | 59.60% | 48.48% | 52.70% | 46.90% | 27.76% | 22.70% | 36.52% | 33.82% | 57.78% | 56.82% | 29.95% | 33.25% | 58.56% | 54.64% | 59.08% | 34.80% | 26.75% | 31.16% | 53.42% |
| Operating Income | $49.09M | $-6.25M | $37.46M | $53.88M | $53.86M | $37.57M | $24.22M | $14.48M | $18.17M | $38.89M | $38.61M | $6.92M | $54.86M | $35.99M | $28.62M | $49.89M | $53.20M | $51.69M | $48.08M | $61.06M |
| Operating Income Ratio | 21.27% | -2.95% | 17.59% | 24.04% | 22.32% | 18.06% | 12.44% | 7.82% | 8.84% | 22.11% | 22.83% | 3.77% | 28.72% | 22.66% | 19.48% | 29.99% | 29.65% | 32.52% | 27.49% | 31.78% |
| Total Other Income Expenses Net | $-17.37M | $30.98M | $-15.57M | $-14.51M | $-41.46M | $-7.96M | $-5.67M | $-11.09M | $-17.27M | $-11.25M | $-15.97M | $-12.70M | $-12.64M | $-13.81M | $-9.76M | $-29.59M | $-8.22M | $-12.11M | $-12.70M | $-12.27M |
| Income Before Tax | $31.72M | $24.73M | $19.55M | $39.37M | $48.85M | $29.60M | $18.56M | $42.08M | $12.95M | $27.64M | $22.64M | $32.38M | $42.22M | $22.18M | $18.86M | $20.29M | $44.97M | $39.58M | $35.38M | $48.79M |
| Income Before Tax Ratio | 13.75% | 11.68% | 9.18% | 17.56% | 20.24% | 14.23% | 9.53% | 22.71% | 6.30% | 15.72% | 13.39% | 17.63% | 22.11% | 13.96% | 12.84% | 12.20% | 25.07% | 24.90% | 20.23% | 25.40% |
| Income Tax Expense | $-11.77M | $1.19M | $-3.18M | $-147.00K | $8.19M | $-7.13M | $-3.96M | $8.88M | $-8.78M | $7.23M | $6.13M | $10.16M | $15.53M | $2.05M | $4.27M | $3.01M | $21.73M | $15.36M | $11.77M | $18.15M |
| Net Income | $40.82M | $22.08M | $22.24M | $38.59M | $35.73M | $35.45M | $24.19M | $29.03M | $18.04M | $18.11M | $16.51M | $18.43M | $18.91M | $14.90M | $13.03M | $15.26M | $20.70M | $15.68M | $23.05M | $26.03M |
| Net Income Ratio | 17.69% | 10.43% | 10.44% | 17.21% | 14.80% | 17.04% | 12.42% | 15.67% | 8.78% | 10.30% | 9.76% | 10.03% | 9.90% | 9.38% | 8.87% | 9.17% | 11.54% | 9.86% | 13.18% | 13.55% |
| EPS | $0.67 | $0.37 | $0.37 | $0.64 | $0.59 | $0.59 | $0.40 | $0.51 | $0.32 | $0.32 | $0.29 | $0.33 | $0.34 | $0.27 | $0.23 | $0.27 | $0.39 | $0.31 | $0.45 | $0.51 |
| EPS Diluted | $0.67 | $0.36 | $0.37 | $0.64 | $0.59 | $0.59 | $0.40 | $0.51 | $0.32 | $0.32 | $0.29 | $0.33 | $0.34 | $0.26 | $0.23 | $0.27 | $0.39 | $0.31 | $0.45 | $0.51 |
| Weighted Average Shares Outstanding | 60.48M | 60.48M | 60.45M | 60.39M | 60.37M | 60.30M | 60.24M | 56.71M | 56.08M | 56.00M | 56.11M | 56.06M | 56.03M | 56.00M | 55.99M | 55.99M | 53.11M | 51.07M | 51.04M | 51.04M |
| Weighted Average Shares Outstanding Diluted | 60.77M | 60.77M | 60.76M | 60.54M | 60.51M | 60.57M | 60.63M | 57.10M | 56.50M | 56.46M | 56.50M | 56.37M | 56.39M | 56.30M | 56.32M | 56.73M | 53.55M | 51.28M | 51.36M | 51.53M |
| SEC Filing | Source | Source | Source | Source | Source | Source | Source | Source | Source | Source | Source | Source | Source | Source | Source | Source | Source | Source | Source | Source |
Annual Balance Sheet
| Breakdown | December 31, 2024 | December 31, 2023 | December 31, 2022 | December 31, 2021 | December 31, 2020 |
|---|---|---|---|---|---|
| Cash and Cash Equivalents | $205.77M | $195.81M | $95.87M | $239.28M | $448.25M |
| Short Term Investments | $-111.38M | $- | $- | $43.34M | $- |
| Cash and Short Term Investments | $94.39M | $195.81M | $95.87M | $282.62M | $448.25M |
| Net Receivables | $244.09M | $271.60M | $177.64M | $150.78M | $191.70M |
| Inventory | $38.09M | $45.04M | $22.83M | $28.45M | $35.32M |
| Other Current Assets | $170.55M | $133.56M | $160.38M | $158.23M | $103.88M |
| Total Current Assets | $547.12M | $646.00M | $456.72M | $601.93M | $779.15M |
| Property Plant Equipment Net | $3.53B | $3.84B | $3.41B | $3.04B | $2.61B |
| Goodwill | $151.02M | $90.54M | $90.33M | $89.95M | $24.57M |
| Intangible Assets | $301.75M | $307.61M | $333.85M | $363.31M | $194.42M |
| Goodwill and Intangible Assets | $452.77M | $398.15M | $424.17M | $453.27M | $218.99M |
| Long Term Investments | $- | $125.44M | $115.69M | $105.89M | $98.22M |
| Tax Assets | $153.94M | $152.57M | $161.37M | $143.45M | $119.30M |
| Other Non-Current Assets | $978.40M | $44.63M | $39.76M | $78.92M | $66.99M |
| Total Non-Current Assets | $5.12B | $4.56B | $4.15B | $3.82B | $3.11B |
| Other Assets | $- | $- | $- | $- | $- |
| Total Assets | $5.67B | $5.21B | $4.61B | $4.43B | $3.89B |
| Account Payables | $124.70M | $140.69M | $77.55M | $75.16M | $75.78M |
| Short Term Debt | $109.99M | $303.82M | $185.70M | $391.72M | $86.99M |
| Tax Payables | $12.70M | $7.00M | $11.66M | $11.04M | $21.29M |
| Deferred Revenue | $- | $19.44M | $8.79M | $9.25M | $11.18M |
| Other Current Liabilities | $350.69M | $66.06M | $59.15M | $65.07M | $64.59M |
| Total Current Liabilities | $598.08M | $537.01M | $343.91M | $544.16M | $248.65M |
| Long Term Debt | $517.72M | $1.81B | $1.87B | $1.54B | $1.40B |
| Deferred Revenue Non-Current | $- | $- | $83.47M | $241.27M | $205.48M |
| Deferred Tax Liabilities Non-Current | $68.62M | $66.75M | $83.47M | $84.66M | $87.97M |
| Other Non-Current Liabilities | $1.92B | $341.61M | $286.63M | $246.22M | $201.89M |
| Total Non-Current Liabilities | $2.51B | $2.22B | $2.24B | $1.87B | $1.70B |
| Other Liabilities | $- | $- | $- | $- | $- |
| Total Liabilities | $3.11B | $2.76B | $2.58B | $2.42B | $1.95B |
| Preferred Stock | $- | $- | $- | $- | $- |
| Common Stock | $- | $60.00K | $56.00K | $56.00K | $56.00K |
| Retained Earnings | $- | $719.89M | $623.91M | $585.21M | $550.10M |
| Accumulated Other Comprehensive Income Loss | $-6.73M | $-1.33M | $2.50M | $-2.19M | $-6.62M |
| Other Total Stockholders Equity | $4.58B | $1.60B | $1.24B | $1.27B | $1.26B |
| Total Stockholders Equity | $4.57B | $2.32B | $1.87B | $1.85B | $1.81B |
| Total Equity | $4.57B | $2.45B | $2.03B | $2.01B | $1.94B |
| Total Liabilities and Stockholders Equity | $5.67B | $5.21B | $4.61B | $4.43B | $3.89B |
| Minority Interest | $- | $136.16M | $162.99M | $152.79M | $135.45M |
| Total Liabilities and Total Equity | $5.67B | $5.21B | $4.61B | $4.43B | $3.89B |
| Total Investments | $144.59M | $125.44M | $115.69M | $149.23M | $98.22M |
| Total Debt | $598.65M | $2.12B | $2.05B | $1.93B | $1.48B |
| Net Debt | $392.88M | $1.92B | $1.96B | $1.70B | $1.04B |
Balance Sheet Charts
| Breakdown | December 31, 2024 | September 30, 2024 | June 30, 2024 | March 31, 2024 | December 31, 2023 | September 30, 2023 | June 30, 2023 | March 31, 2023 | December 31, 2022 | September 30, 2022 | June 30, 2022 | March 31, 2022 | December 31, 2021 | September 30, 2021 | June 30, 2021 | March 31, 2021 | December 31, 2020 | September 30, 2020 | June 30, 2020 | March 31, 2020 |
|---|---|---|---|---|---|---|---|---|---|---|---|---|---|---|---|---|---|---|---|---|
| Cash and Cash Equivalents | $94.39M | $176.78M | $163.74M | $298.96M | $287.77M | $78.08M | $275.07M | $414.86M | $95.87M | $154.63M | $263.43M | $130.01M | $239.28M | $267.80M | $250.01M | $376.63M | $448.25M | $197.31M | $173.72M | $231.15M |
| Short Term Investments | $- | $- | $1.38M | $- | $- | $- | $- | $- | $- | $- | $- | $42.93M | $43.34M | $45.48M | $45.96M | $27.73M | $98.22M | $- | $- | $- |
| Cash and Short Term Investments | $94.39M | $176.78M | $163.74M | $298.96M | $287.77M | $78.08M | $275.07M | $414.86M | $95.87M | $154.63M | $263.43M | $172.93M | $282.62M | $313.28M | $295.97M | $404.37M | $448.25M | $197.31M | $173.72M | $231.15M |
| Net Receivables | $244.09M | $- | $221.62M | $212.09M | $271.60M | $228.47M | $205.37M | $197.74M | $177.64M | $155.28M | $156.13M | $148.83M | $150.78M | $176.98M | $163.41M | $171.10M | $191.70M | $198.97M | $217.35M | $218.95M |
| Inventory | $38.09M | $47.41M | $44.65M | $53.87M | $45.04M | $44.84M | $37.90M | $45.45M | $22.83M | $29.80M | $32.21M | $32.89M | $28.45M | $27.36M | $28.53M | $38.41M | $35.32M | $34.38M | $38.93M | $34.11M |
| Other Current Assets | $170.55M | $313.31M | $86.99M | $44.31M | $41.59M | $164.26M | $167.64M | $152.94M | $160.38M | $135.26M | $133.84M | $153.34M | $158.23M | $117.82M | $100.09M | $111.06M | $103.88M | $101.93M | $87.06M | $100.08M |
| Total Current Assets | $547.12M | $537.49M | $517.00M | $609.24M | $646.00M | $515.66M | $685.98M | $810.99M | $456.72M | $474.98M | $585.61M | $507.99M | $601.93M | $635.44M | $587.99M | $724.93M | $779.15M | $532.59M | $517.07M | $584.29M |
| Property Plant Equipment Net | $4.29B | $3.36B | $4.16B | $4.09B | $3.84B | $3.75B | $3.58B | $3.47B | $3.41B | $3.33B | $3.23B | $3.14B | $3.04B | $2.94B | $2.73B | $2.64B | $2.61B | $2.53B | $2.46B | $2.43B |
| Goodwill | $151.02M | $151.34M | $151.07M | $151.12M | $90.54M | $90.27M | $90.46M | $90.45M | $90.33M | $89.74M | $90.20M | $90.59M | $89.95M | $91.34M | $24.86M | $24.24M | $24.57M | $23.58M | $20.12M | $19.96M |
| Intangible Assets | $301.74M | $309.85M | $316.51M | $323.66M | $307.61M | $313.67M | $320.85M | $327.54M | $333.85M | $339.04M | $347.22M | $355.19M | $363.31M | $370.89M | $185.51M | $189.25M | $194.42M | $197.00M | $179.66M | $182.31M |
| Goodwill and Intangible Assets | $452.77M | $461.20M | $467.59M | $474.78M | $398.15M | $403.94M | $411.30M | $417.98M | $424.17M | $428.78M | $437.42M | $445.78M | $453.27M | $462.23M | $210.37M | $213.49M | $218.99M | $220.59M | $199.78M | $202.27M |
| Long Term Investments | $144.59M | $- | $129.66M | $127.39M | $125.44M | $128.22M | $126.45M | $119.19M | $115.69M | $117.18M | $114.70M | $112.52M | $105.89M | $109.72M | $103.89M | $104.52M | $98.22M | $91.28M | $84.41M | $76.01M |
| Tax Assets | $153.94M | $199.01M | $186.19M | $173.63M | $152.57M | $166.21M | $166.48M | $155.97M | $161.37M | $134.59M | $137.96M | $138.71M | $143.45M | $149.18M | $124.28M | $119.22M | $119.30M | $108.14M | $116.76M | $118.68M |
| Other Non-Current Assets | $75.38M | $1.04B | $48.74M | $43.83M | $44.63M | $44.33M | $41.99M | $36.92M | $39.76M | $38.25M | $40.94M | $70.40M | $78.92M | $61.72M | $57.35M | $52.96M | $66.99M | $39.29M | $37.28M | $37.73M |
| Total Non-Current Assets | $5.12B | $5.05B | $4.99B | $4.91B | $4.56B | $4.50B | $4.32B | $4.20B | $4.15B | $4.05B | $3.96B | $3.91B | $3.82B | $3.72B | $3.23B | $3.13B | $3.11B | $2.99B | $2.90B | $2.86B |
| Other Assets | $1.00K | $- | $- | $- | $- | $- | $- | $- | $- | $- | $- | $- | $- | $- | $- | $- | $- | $- | $- | $- |
| Total Assets | $5.67B | $5.59B | $5.51B | $5.52B | $5.21B | $5.01B | $5.01B | $5.02B | $4.61B | $4.52B | $4.54B | $4.41B | $4.43B | $4.36B | $3.82B | $3.86B | $3.89B | $3.52B | $3.42B | $3.45B |
| Account Payables | $124.70M | $- | $183.39M | $197.03M | $140.69M | $- | $- | $172.75M | $77.55M | $159.64M | $144.52M | $164.75M | $75.16M | $127.43M | $108.41M | $- | $75.78M | $141.44M | $149.59M | $140.87M |
| Short Term Debt | $340.65M | $105.48M | $331.07M | $327.84M | $303.82M | $301.90M | $189.84M | $193.56M | $5.51M | $198.36M | $195.88M | $408.27M | $391.72M | $391.01M | $124.37M | $93.48M | $34.21M | $84.15M | $249.46M | $420.51M |
| Tax Payables | $12.70M | $- | $- | $- | $7.00M | $- | $- | $- | $11.66M | $- | $- | $- | $11.04M | $- | $- | $- | $21.29M | $- | $- | $- |
| Deferred Revenue | $49.20M | $- | $16.28M | $21.38M | $19.44M | $10.62M | $18.65M | $24.65M | $8.79M | $14.03M | $12.71M | $10.96M | $9.25M | $15.83M | $13.45M | $12.69M | $11.18M | $7.68M | $5.60M | $5.94M |
| Other Current Liabilities | $70.83M | $460.85M | $- | $- | $101.21M | $227.51M | $174.72M | $- | $437.98M | $- | $- | $- | $55.76M | $- | $- | $148.07M | $202.00M | $3.03M | $- | $- |
| Total Current Liabilities | $598.08M | $566.33M | $530.73M | $546.25M | $537.01M | $540.03M | $383.21M | $390.96M | $343.91M | $372.03M | $353.11M | $583.99M | $544.16M | $534.27M | $246.23M | $254.23M | $248.65M | $236.30M | $404.65M | $567.32M |
| Long Term Debt | $2.11B | $493.05M | $2.05B | $2.06B | $1.81B | $1.70B | $1.84B | $1.91B | $1.87B | $1.84B | $1.88B | $1.48B | $1.54B | $1.56B | $1.32B | $1.36B | $1.40B | $1.40B | $1.13B | $1.02B |
| Deferred Revenue Non-Current | $- | $- | $22.16M | $24.25M | $22.03M | $264.04M | $271.17M | $- | $83.47M | $77.79M | $80.97M | $- | $84.66M | $199.16M | $198.25M | $202.46M | $87.97M | $204.66M | $213.44M | $214.58M |
| Deferred Tax Liabilities Non-Current | $68.62M | $- | $86.37M | $84.22M | $75.42M | $60.77M | $74.66M | $78.61M | $83.47M | $77.79M | $80.97M | $83.35M | $84.66M | $85.92M | $88.16M | $87.42M | $87.97M | $101.89M | $104.01M | $100.97M |
| Other Non-Current Liabilities | $327.97M | $2.01B | $336.09M | $338.33M | $332.93M | $297.76M | $294.53M | $288.49M | $193.83M | $235.39M | $235.16M | $241.45M | $155.83M | $195.63M | $194.47M | $208.55M | $111.94M | $203.73M | $211.44M | $213.05M |
| Total Non-Current Liabilities | $2.51B | $2.50B | $2.47B | $2.48B | $2.22B | $2.06B | $2.21B | $2.28B | $2.24B | $2.15B | $2.20B | $1.81B | $1.87B | $1.85B | $1.61B | $1.66B | $1.70B | $1.71B | $1.46B | $1.34B |
| Other Liabilities | $- | $- | $- | $- | $- | $- | $- | $- | $- | $- | $- | $- | $- | $- | $- | $- | $- | $- | $- | $- |
| Total Liabilities | $3.11B | $3.07B | $3.00B | $3.03B | $2.76B | $2.60B | $2.59B | $2.67B | $2.58B | $2.52B | $2.55B | $2.39B | $2.42B | $2.39B | $1.86B | $1.91B | $1.95B | $1.95B | $1.86B | $1.91B |
| Preferred Stock | $- | $- | $- | $- | $- | $- | $- | $- | $- | $- | $- | $- | $- | $- | $- | $6.92M | $- | $- | $- | $- |
| Common Stock | $61.00K | $61.00K | $61.00K | $60.00K | $60.00K | $60.00K | $60.00K | $60.00K | $56.00K | $56.00K | $56.00K | $56.00K | $56.00K | $56.00K | $56.00K | $56.00K | $56.00K | $51.00K | $51.00K | $51.00K |
| Retained Earnings | $814.52M | $780.96M | $766.14M | $751.24M | $719.89M | $691.39M | $663.17M | $646.20M | $623.91M | $612.83M | $601.44M | $596.91M | $585.21M | $573.41M | $565.22M | $558.64M | $550.10M | $534.98M | $524.86M | $507.54M |
| Accumulated Other Comprehensive Income Loss | $-6.73M | $-4.59M | $-1.75M | $-843.00K | $-1.33M | $-5.23M | $-170.00K | $-4.21M | $2.50M | $-4.48M | $-4.15M | $-1.14M | $-2.19M | $-9.65M | $-7.65M | $-6.92M | $-6.62M | $-15.50M | $-13.92M | $-13.66M |
| Other Total Stockholders Equity | $1.62B | $1.61B | $1.61B | $1.60B | $1.60B | $1.59B | $1.59B | $1.54B | $1.24B | $1.24B | $1.24B | $1.27B | $1.27B | $1.27B | $1.27B | $1.26B | $1.26B | $920.21M | $917.40M | $915.14M |
| Total Stockholders Equity | $2.43B | $2.39B | $2.37B | $2.35B | $2.32B | $2.28B | $2.25B | $2.18B | $1.87B | $1.85B | $1.83B | $1.87B | $1.85B | $1.83B | $1.83B | $1.82B | $1.81B | $1.44B | $1.43B | $1.41B |
| Total Equity | $2.56B | $2.40B | $2.51B | $2.49B | $2.45B | $2.41B | $2.42B | $2.35B | $2.03B | $2.00B | $1.99B | $2.02B | $2.01B | $1.97B | $1.96B | $1.95B | $1.94B | $1.57B | $1.56B | $1.53B |
| Total Liabilities and Stockholders Equity | $5.67B | $5.59B | $5.51B | $5.52B | $5.21B | $5.01B | $5.01B | $5.02B | $4.61B | $4.52B | $4.54B | $4.41B | $4.43B | $4.36B | $3.82B | $3.86B | $3.89B | $3.52B | $3.42B | $3.45B |
| Minority Interest | $135.25M | $10.86M | $136.00M | $134.55M | $136.16M | $136.15M | $162.66M | $161.85M | $162.99M | $154.20M | $155.66M | $153.59M | $152.79M | $138.97M | $134.77M | $133.27M | $135.45M | $132.06M | $128.41M | $124.59M |
| Total Liabilities and Total Equity | $5.67B | $5.59B | $5.51B | $5.52B | $5.21B | $5.01B | $5.01B | $5.02B | $4.61B | $4.52B | $4.54B | $4.41B | $4.43B | $4.36B | $3.82B | $3.86B | $3.89B | $3.52B | $3.42B | $3.45B |
| Total Investments | $144.59M | $126.77M | $129.66M | $127.39M | $125.44M | $128.22M | $126.45M | $119.19M | $115.69M | $117.18M | $114.70M | $155.45M | $149.23M | $155.20M | $149.85M | $132.25M | $196.43M | $91.28M | $84.41M | $76.01M |
| Total Debt | $2.45B | $598.53M | $2.38B | $2.39B | $2.12B | $2.00B | $2.03B | $2.10B | $2.05B | $2.04B | $2.08B | $1.89B | $1.93B | $1.95B | $1.44B | $1.45B | $1.48B | $1.48B | $1.38B | $1.44B |
| Net Debt | $2.36B | $421.75M | $2.21B | $2.09B | $1.83B | $1.92B | $1.76B | $1.69B | $1.96B | $1.88B | $1.82B | $1.76B | $1.70B | $1.68B | $1.19B | $1.08B | $1.04B | $1.29B | $1.21B | $1.21B |
Annual Cash Flow
| Breakdown | December 31, 2024 | December 31, 2023 | December 31, 2022 | December 31, 2021 | December 31, 2020 |
|---|---|---|---|---|---|
| Net Income | $131.24M | $124.40M | $77.80M | $76.08M | $101.81M |
| Depreciation and Amortization | $262.86M | $230.96M | $198.79M | $182.97M | $156.61M |
| Deferred Income Tax | $-16.29M | $-23.46M | $-31.30M | $-11.56M | $-19.66M |
| Stock Based Compensation | $20.20M | $15.48M | $11.65M | $9.17M | $9.83M |
| Change in Working Capital | $-1.49M | $-44.49M | $-21.98M | $-4.37M | $15.03M |
| Accounts Receivables | $- | $-99.60M | $-19.93M | $26.74M | $3.52M |
| Inventory | $- | $-22.20M | $5.61M | $4.13M | $178.00K |
| Accounts Payables | $- | $68.59M | $-2.04M | $-30.25M | $2.90M |
| Other Working Capital | $-1.49M | $8.73M | $-5.62M | $-4.99M | $8.42M |
| Other Non Cash Items | $14.40M | $6.52M | $46.02M | $6.53M | $1.39M |
| Net Cash Provided by Operating Activities | $410.92M | $309.40M | $280.97M | $258.82M | $265.00M |
| Investments in Property Plant and Equipment | $-487.68M | $-618.38M | $-563.48M | $-419.27M | $-320.74M |
| Acquisitions Net | $-293.60M | $- | $-4.51M | $-177.40M | $-64.36M |
| Purchases of Investments | $- | $- | $-19.19M | $-60.07M | $-20.96M |
| Sales Maturities of Investments | $- | $221.00K | $63.17M | $19.46M | $845.00K |
| Other Investing Activities | $1.02M | $-10.18M | $600.00K | $-911.00K | $19.24M |
| Net Cash Used for Investing Activities | $-780.25M | $-628.34M | $-523.41M | $-638.19M | $-385.97M |
| Debt Repayment | $328.01M | $60.81M | $147.69M | $178.77M | $190.44M |
| Common Stock Issued | $- | $341.67M | $- | $311.00K | $339.47M |
| Common Stock Repurchased | $- | $- | $-17.96M | $- | $- |
| Dividends Paid | $-29.11M | $-28.41M | $-27.14M | $-26.99M | $-22.47M |
| Other Financing Activities | $-10.98M | $5.90M | $23.70M | $34.29M | $-3.96M |
| Net Cash Used Provided by Financing Activities | $287.92M | $379.96M | $126.71M | $187.90M | $503.48M |
| Effect of Forex Changes on Cash | $-579.00K | $72.00K | $-609.00K | $-348.00K | $1.15M |
| Net Change in Cash | $-82.00M | $61.09M | $-116.77M | $-193.33M | $383.67M |
| Cash at End of Period | $205.77M | $287.77M | $226.68M | $343.44M | $536.78M |
| Cash at Beginning of Period | $287.77M | $226.68M | $343.44M | $536.78M | $153.11M |
| Operating Cash Flow | $410.92M | $309.40M | $280.97M | $258.82M | $265.00M |
| Capital Expenditure | $-487.68M | $-618.38M | $-563.48M | $-419.27M | $-320.74M |
| Free Cash Flow | $-76.76M | $-308.98M | $-282.50M | $-160.45M | $-55.73M |
Cash Flow Charts
| Breakdown | December 31, 2024 | September 30, 2024 | June 30, 2024 | March 31, 2024 | December 31, 2023 | September 30, 2023 | June 30, 2023 | March 31, 2023 | December 31, 2022 | September 30, 2022 | June 30, 2022 | March 31, 2022 | December 31, 2021 | September 30, 2021 | June 30, 2021 | March 31, 2021 | December 31, 2020 | September 30, 2020 | June 30, 2020 | March 31, 2020 |
|---|---|---|---|---|---|---|---|---|---|---|---|---|---|---|---|---|---|---|---|---|
| Net Income | $42.62M | $24.30M | $22.24M | $38.59M | $35.73M | $36.33M | $24.51M | $33.46M | $20.23M | $19.83M | $14.95M | $22.79M | $22.27M | $20.78M | $15.20M | $17.83M | $23.53M | $23.10M | $25.27M | $29.91M |
| Depreciation and Amortization | $70.05M | $66.66M | $65.79M | $64.26M | $59.33M | $57.49M | $54.26M | $53.16M | $51.33M | $50.45M | $48.90M | $48.11M | $48.60M | $48.83M | $43.44M | $42.10M | $40.94M | $40.81M | $37.91M | $36.95M |
| Deferred Income Tax | $36.53M | $-19.84M | $-8.58M | $-9.68M | $22.52M | $-20.00M | $-23.12M | $-7.12M | $-17.73M | $-4.61M | $-7.46M | $-1.49M | $9.23M | $-8.34M | $-9.24M | $-3.20M | $-32.34M | $-2.18M | $1.91M | $12.95M |
| Stock Based Compensation | $5.31M | $5.04M | $5.08M | $4.77M | $4.24M | $3.93M | $4.31M | $2.99M | $3.02M | $2.82M | $3.00M | $2.81M | $2.33M | $2.12M | $2.62M | $2.10M | $2.77M | $2.81M | $2.26M | $1.99M |
| Change in Working Capital | $-4.44M | $27.83M | $-48.12M | $23.24M | $11.40M | $-42.22M | $14.38M | $-28.05M | $-14.65M | $21.08M | $-34.83M | $6.42M | $26.95M | $-17.28M | $-21.20M | $7.15M | $-8.69M | $17.92M | $9.40M | $-3.61M |
| Accounts Receivables | $- | $- | $-10.15M | $51.94M | $-41.44M | $-19.20M | $-2.98M | $-26.63M | $-23.55M | $4.26M | $-5.77M | $5.13M | $26.51M | $-9.70M | $1.07M | $8.86M | $9.27M | $19.08M | $177.00K | $-25.01M |
| Inventory | $- | $- | $9.23M | $-8.84M | $-193.00K | $-6.94M | $7.55M | $-22.61M | $6.97M | $2.41M | $675.00K | $-4.44M | $5.94M | $-8.61M | $9.88M | $-3.09M | $-387.00K | $4.55M | $-4.83M | $842.00K |
| Accounts Payables | $- | $- | $-26.43M | $-16.33M | $35.82M | $-7.05M | $16.12M | $22.23M | $13.08M | $14.04M | $-15.13M | $13.08M | $-21.94M | $-259.00K | $-32.40M | $3.79M | $-7.99M | $-7.08M | $13.76M | $350.00K |
| Other Working Capital | $-4.44M | $27.83M | $-20.76M | $-3.53M | $17.21M | $-9.02M | $-6.31M | $-1.03M | $-11.16M | $369.00K | $-14.60M | $-7.35M | $16.44M | $1.28M | $255.00K | $-2.41M | $-9.58M | $1.38M | $289.00K | $20.20M |
| Other Non Cash Items | $8.54M | $2.40M | $-5.71M | $100.55M | $5.92M | $4.22M | $-289.00K | $2.02M | $32.53M | $1.40M | $8.96M | $3.14M | $4.64M | $-158.00K | $-902.00K | $2.95M | $-104.00K | $2.08M | $-2.15M | $1.57M |
| Net Cash Provided by Operating Activities | $158.62M | $106.40M | $30.70M | $115.21M | $139.15M | $39.75M | $74.05M | $56.46M | $74.73M | $90.96M | $33.51M | $81.78M | $114.03M | $45.95M | $29.92M | $68.92M | $26.11M | $84.54M | $74.60M | $79.76M |
| Investments in Property Plant and Equipment | $-127.74M | $-109.72M | $-146.84M | $-103.39M | $-169.59M | $-182.08M | $-159.84M | $-106.88M | $-155.10M | $-144.94M | $-126.19M | $-137.25M | $-130.85M | $-80.53M | $-119.99M | $-87.90M | $-88.95M | $-80.53M | $-70.88M | $-80.38M |
| Acquisitions Net | $-7.35M | $-10.39M | $-840.00K | $-265.55M | $-5.33M | $-1.50M | $-3.87M | $-4.24M | $4.51M | $-156.00K | $-2.20M | $-2.16M | $-193.00K | $-175.20M | $-1.02M | $-2.00M | $-6.24M | $-50.36M | $-7.40M | $-358.00K |
| Purchases of Investments | $- | $- | $-617.00K | $-608.00K | $-581.00K | $-1.50M | $-3.87M | $-4.24M | $- | $-156.00K | $-2.20M | $-19.19M | $-10.75M | $-1.70M | $-19.87M | $-27.75M | $- | $- | $- | $- |
| Sales Maturities of Investments | $- | $- | $- | $- | $221.00K | $183.58M | $3.87M | $4.24M | $1.17M | $156.00K | $42.71M | $19.29M | $15.90M | $1.92M | $1.65M | $- | $- | $- | $- | $- |
| Other Investing Activities | $-49.00K | $-47.00K | $329.00K | $791.00K | $-225.00K | $-181.72M | $-63.00K | $-65.00K | $-4.41M | $554.00K | $2.17M | $-27.00K | $-2.35M | $89.00K | $2.82M | $182.00K | $2.20M | $-3.06M | $73.00K | $-87.00K |
| Net Cash Used for Investing Activities | $-135.14M | $-120.15M | $-147.97M | $-368.75M | $-175.51M | $-183.22M | $-163.76M | $-111.18M | $-153.83M | $-144.54M | $-85.70M | $-139.33M | $-128.25M | $-255.43M | $-137.04M | $-117.47M | $-93.00M | $-133.94M | $-78.21M | $-80.82M |
| Debt Repayment | $26.80M | $- | $-9.71M | $272.05M | $102.34M | $-26.31M | $-72.75M | $56.47M | $229.24M | $-40.15M | $217.23M | $-39.89M | $-29.93M | $246.74M | $-20.70M | $-17.34M | $-20.46M | $101.39M | $-61.62M | $171.13M |
| Common Stock Issued | $- | $- | $- | $- | $- | $8.00K | $44.54M | $297.12M | $-3.00K | $- | $- | $- | $29.00K | $-3.00K | $- | $285.00K | $339.47M | $- | $- | $- |
| Common Stock Repurchased | $- | $- | $- | $- | $- | $- | $- | $- | $-3.00K | $- | $-18.02M | $- | $- | $- | $- | $- | $- | $- | $- | $- |
| Dividends Paid | $-7.26M | $-7.26M | $-7.34M | $-7.24M | $-7.22M | $-7.23M | $-7.23M | $-6.73M | $-6.97M | $-6.72M | $-6.73M | $-6.73M | $-7.10M | $-6.72M | $-6.45M | $-6.72M | $-5.58M | $-5.56M | $-5.72M | $-5.61M |
| Other Financing Activities | $-13.66M | $34.10M | $-1.70M | $- | $42.33M | $-31.99M | $-1.85M | $3.53M | $-169.60M | $-2.54M | $-24.26M | $1.79M | $38.40M | $-4.04M | $-1.02M | $963.00K | $339.53M | $-7.26M | $664.00K | $2.58M |
| Net Cash Used Provided by Financing Activities | $5.89M | $26.84M | $-17.91M | $264.86M | $137.73M | $-34.58M | $-36.70M | $346.02M | $52.61M | $-47.33M | $168.22M | $-46.79M | $1.25M | $237.81M | $-27.15M | $-24.00M | $313.49M | $88.57M | $-66.67M | $168.09M |
| Effect of Forex Changes on Cash | $- | $- | $-35.00K | $-128.00K | $139.00K | $-123.00K | $70.00K | $-14.00K | $70.00K | $-352.00K | $-293.00K | $-34.00K | $-12.00K | $-79.00K | $85.00K | $-342.00K | $634.00K | $545.00K | $340.00K | $-365.00K |
| Net Change in Cash | $29.00M | $13.03M | $-135.22M | $11.19M | $101.50M | $-209.12M | $-126.94M | $295.65M | $-26.36M | $-103.35M | $115.25M | $-102.31M | $-12.86M | $26.42M | $-135.20M | $-71.70M | $247.24M | $39.71M | $-69.94M | $166.67M |
| Cash at End of Period | $205.77M | $176.78M | $163.74M | $298.96M | $287.77M | $186.27M | $395.38M | $522.32M | $226.68M | $253.03M | $356.38M | $241.13M | $343.44M | $356.30M | $329.88M | $465.08M | $536.78M | $289.54M | $249.83M | $319.78M |
| Cash at Beginning of Period | $176.78M | $163.74M | $298.96M | $287.77M | $186.27M | $395.38M | $522.32M | $226.68M | $253.03M | $356.38M | $241.13M | $343.44M | $356.30M | $329.88M | $465.08M | $536.78M | $289.54M | $249.83M | $319.78M | $153.11M |
| Operating Cash Flow | $158.62M | $106.40M | $30.70M | $115.21M | $139.15M | $39.75M | $74.05M | $56.46M | $74.73M | $90.96M | $33.51M | $81.78M | $114.03M | $45.95M | $29.92M | $68.92M | $26.11M | $84.54M | $74.60M | $79.76M |
| Capital Expenditure | $-127.74M | $-109.72M | $-146.84M | $-103.39M | $-169.59M | $-182.08M | $-159.84M | $-106.88M | $-155.10M | $-144.94M | $-126.19M | $-137.25M | $-130.85M | $-80.53M | $-119.99M | $-87.90M | $-88.95M | $-80.53M | $-70.88M | $-80.38M |
| Free Cash Flow | $30.88M | $-3.32M | $-116.14M | $11.82M | $-30.45M | $-142.33M | $-85.79M | $-50.42M | $-80.37M | $-53.98M | $-92.68M | $-55.47M | $-16.82M | $-34.59M | $-90.07M | $-18.97M | $-62.84M | $4.01M | $3.72M | $-619.00K |
Ormat Technologies Dividends
Explore Ormat Technologies's dividend history, including dividend yield, payout ratio, and historical payments.
Dividend Yield
0.71%
Dividend Payout Ratio
23.53%
Dividend Paid & Capex Coverage Ratio
0.80x
Ormat Technologies Dividend History
| Dividend | Adjusted Dividend | Date | Record Date | Payment Date | Declaration Date |
|---|---|---|---|---|---|
| $0.12 | $0.12 | March 12, 2025 | March 12, 2025 | March 26, 2025 | February 26, 2025 |
| $0.12 | $0.12 | November 20, 2024 | November 20, 2024 | December 04, 2024 | November 06, 2024 |
| $0.12 | $0.12 | August 20, 2024 | August 20, 2024 | September 03, 2024 | August 06, 2024 |
| $0.12 | $0.12 | May 21, 2024 | May 22, 2024 | June 05, 2024 | May 08, 2024 |
| $0.12 | $0.12 | March 05, 2024 | March 06, 2024 | March 20, 2024 | February 21, 2024 |
| $0.12 | $0.12 | November 21, 2023 | November 22, 2023 | December 06, 2023 | November 08, 2023 |
| $0.12 | $0.12 | August 15, 2023 | August 16, 2023 | August 30, 2023 | August 02, 2023 |
| $0.12 | $0.12 | May 22, 2023 | May 23, 2023 | June 06, 2023 | May 09, 2023 |
| $0.12 | $0.12 | March 07, 2023 | March 08, 2023 | March 22, 2023 | February 22, 2023 |
| $0.12 | $0.12 | November 15, 2022 | November 16, 2022 | November 30, 2022 | November 02, 2022 |
| $0.12 | $0.12 | August 16, 2022 | August 17, 2022 | August 31, 2022 | August 03, 2022 |
| $0.12 | $0.12 | May 13, 2022 | May 16, 2022 | May 31, 2022 | May 02, 2022 |
| $0.12 | $0.12 | March 08, 2022 | March 09, 2022 | March 23, 2022 | February 23, 2022 |
| $0.12 | $0.12 | November 16, 2021 | November 17, 2021 | December 03, 2021 | November 03, 2021 |
| $0.12 | $0.12 | August 17, 2021 | August 18, 2021 | September 01, 2021 | August 04, 2021 |
| $0.12 | $0.12 | May 17, 2021 | May 18, 2021 | June 01, 2021 | May 05, 2021 |
| $0.12 | $0.12 | March 10, 2021 | March 11, 2021 | March 29, 2021 | February 24, 2021 |
| $0.11 | $0.11 | November 17, 2020 | November 18, 2020 | December 02, 2020 | November 03, 2020 |
| $0.11 | $0.11 | August 17, 2020 | August 18, 2020 | September 01, 2020 | August 04, 2020 |
| $0.11 | $0.11 | May 20, 2020 | May 21, 2020 | June 02, 2020 | May 08, 2020 |
Ormat Technologies News
Read the latest news about Ormat Technologies, including recent articles, headlines, and updates.
CWENA vs. ORA: Which Stock Is the Better Value Option?
Investors interested in stocks from the Alternative Energy - Other sector have probably already heard of Clearway Energy (CWENA) and Ormat Technologies (ORA). But which of these two companies is the best option for those looking for undervalued stocks?


Ormat Technologies, Inc. (ORA) Q4 2024 Earnings Call Transcript
Ormat Technologies, Inc. (NYSE:ORA ) Q4 2024 Earnings Conference Call February 27, 2025 11:00 AM ET Company Participants Josh Carroll - Alpha IR Doron Blachar - Chief Executive Officer Assi Ginzburg - Chief Financial Officer Smadar Lavi - Vice President of Investor Relations and ESG Planning and Reporting Conference Call Participants Noah Kaye - Oppenheimer Justin Clare - ROTH Capital Partners Hannah Velásquez - Jefferies Derek Podhaizer - Piper Sandler Jeff Osborne - TD Cowen Ryan Levine - Citigroup Operator Good morning, and welcome to the Ormat Technologies Fourth Quarter and Full Year 2024 Earnings Conference Call. All participants will be in a listen-only mode.


Ormat Technologies Reports Fourth Quarter and Year-End 2024 Financial Results
STRATEGIC PORTFOLIO EXPANSION SUPPORTS CONTINUED REVENUE AND ADJUSTED EBITDA GROWTH STRONG FULL-YEAR RESULTS REINFORCES ORMAT'S MOMENTUM, REMAINING ON PACE TO ACHIEVE GENERATING CAPACITY GOALS OF 2.6 TO 2.8 GW BY 2028 HIGHLIGHTS TOTAL REVENUES FOR THE FULL-YEAR INCREASED 6.1% COMPARED TO 2023, DRIVEN BY GROWTH IN ALL THREE SEGMENTS FULL YEAR OPERATING INCOME AND ADJUSTED EBITDA IMPROVED 3.5% AND 14.3%, RESPECTIVELY FOURTH QUARTER NET INCOME AND ADJUSTED NET INCOME IMPROVED BY 14.3% AND 7.7% YEAR-OVER-YEAR, RESPECTIVELY ORMAT ANNOUNCES FULL YEAR 2025 OUTLOOK AND GROWTH EXPECTATIONS RENO, Nev., Feb. 26, 2025 (GLOBE NEWSWIRE) -- Ormat Technologies, Inc. (NYSE: ORA) (the “Company” or “Ormat”), a leading renewable energy company, today announced financial results for the fourth quarter and full year ended December 31, 2024.

Curious about Ormat Technologies (ORA) Q4 Performance? Explore Wall Street Estimates for Key Metrics
Get a deeper insight into the potential performance of Ormat Technologies (ORA) for the quarter ended December 2024 by going beyond Wall Street's top -and-bottom-line estimates and examining the estimates for some of its key metrics.


Ormat Commences Commercial Operation of 35 MW Ijen Geothermal Facility in Indonesia, Delivering Low Carbon Geothermal Power
RENO, Nev., Feb. 10, 2025 (GLOBE NEWSWIRE) -- Ormat Technologies Inc. (NYSE: ORA), a leading geothermal and renewable energy company, today announced the successful commencement of commercial operations (COD) for the 35MW Ijen geothermal power plant. The power plant is jointly owned with PT Medco Power Indonesia (“Medco Power”), through their subsidiary company, PT Medco Cahaya Geothermal (“MCG”). Ormat's share of the facility is 17MW. This is the first geothermal power plant in East Java, Indonesia, contributing to Indonesia's plan for an additional 7.2 GW of geothermal capacity by 2035.

Ormat Technologies Signs 10-Year PPA With Calpine Energy Solutions for Up to 15MW of Carbon-Free Geothermal Capacity
New Geothermal PPA Advances Ormat's Portfolio Expansion Strategy and Long-Term Revenue and EBITDA Generation New Geothermal PPA Advances Ormat's Portfolio Expansion Strategy and Long-Term Revenue and EBITDA Generation


CORRECTION -- Ormat Technologies Inc.
RENO, Nev., Dec. 30, 2024 (GLOBE NEWSWIRE) -- In a release issued earlier today by Ormat Technologies Inc. (NYSE: ORA), please note the original headline read "20MW/120MWH" when it should have read "20MW/20MWH." This error was introduced by GlobeNewswire. The corrected release follows:


Ormat Commences Commercial Operation of Montague Energy Storage Facility, Delivering 20MW/120MWh of Energy Storage Capacity to the PJM Market
RENO, Nev., Dec. 30, 2024 (GLOBE NEWSWIRE) -- Ormat Technologies Inc. (NYSE: ORA) (“Ormat” or the “Company”), a leading geothermal and renewable energy technology company, announced today the successful commencement of commercial operations for its Montague energy storage facility. This 20MW/20MWh Battery Energy Storage System (BESS), located in New Jersey, will provide ancillary services on the merchant market to PJM.

Ormat Technologies Inc. Secures Strategic Land Parcels in Utah BLM Auction to Advance Future Geothermal Development
RENO, Nev., Dec. 23, 2024 (GLOBE NEWSWIRE) -- Ormat Technologies Inc. (NYSE: ORA), a leading geothermal and renewable energy company, today announced it has successfully secured 1,678 acres in Utah's Bureau of Land Management (BLM) Auction. These lease acquisitions will significantly support Ormat's ongoing operations and development projects in the state, further strengthening the company's commitment to advancing renewable energy solutions and meeting Utah's increasing demand for sustainable energy.

2 Ideal Buys From 50 'Safer' Dividends In 100 December Sustainables
Calvert Research and Management ranked the 1,000 largest publicly traded companies by ESG performance, identifying the top 100 sustainable companies for 2024. Among 78 dividend paying sustainable companies, 8 met the Dogcatcher ideal, with annual dividends from a $1K investment exceeding their single share prices. Analysts estimate net gains of 15.68% to 48.08% for the top ten ESG companies by December 2025.

Ormat Announces Pricing of Public Offering of Common Stock on Behalf of Stockholder Orix Corporation
RENO, Nev., Dec. 11, 2024 (GLOBE NEWSWIRE) -- Ormat Technologies, Inc. (NYSE: ORA) (“Ormat” or the “Company”), a leading geothermal and renewable energy technology company, announced today the pricing of an underwritten secondary offering of 3,700,000 shares of its common stock on behalf of ORIX Corporation. The offering is expected to close on December 13, 2024, subject to customary closing conditions. Ormat is not offering any of its common stock in the offering for its own account and will not receive any proceeds from the sale of the shares being offered by the selling stockholder.

Ormat Announces Public Offering of Common Stock on Behalf of Stockholder ORIX Corporation
RENO, Nev., Dec. 11, 2024 (GLOBE NEWSWIRE) -- Ormat Technologies, Inc. (NYSE: ORA) (“Ormat” or the “Company”), a leading geothermal and renewable energy technology company, announced today the commencement of an underwritten secondary offering of an aggregate of 3,700,000 shares of its common stock on behalf of ORIX Corporation. Ormat is not offering any of its common stock in the offering for its own account and will not receive any proceeds from the sale of the shares being offered by the selling stockholder.


100 November Sustainable Dividend Dogs: 50 'Safer' And 2 Ideal Buys
Calvert Research and Management ranked the 100 most sustainable companies based on over 230 ESG indicators, including workplace diversity and greenhouse-gas emissions. Eight of 78 dividend-paying sustainable companies offer dividends exceeding their share prices, signalling potential buy opportunities for investors. Analysts estimate net gains of 17.47% to 69.69% for the top ten sustainable companies by November 2025, based on target prices and dividends.


Ormat Technologies Announces Successful Monetization of 40% Investment Tax Credit for Bottleneck Energy Storage Facility
RENO, Nev., Nov. 12, 2024 (GLOBE NEWSWIRE) -- Ormat Technologies Inc. (NYSE: ORA), a leading renewable energy company, today announced the successful deal to transfer investment tax credits (ITCs) from the 80MW/320MWh Bottleneck Project to third party. This transaction, which was facilitated under the Inflation Reduction Act (IRA), represents a significant achievement in our goal to collect up to $152 million in cash tax benefits this year.


Ormat Technologies, Inc. (ORA) Q3 2024 Earnings Call Transcript
Ormat Technologies, Inc. (NYSE:ORA ) Q3 2024 Results Conference Call November 7, 2024 10:00 AM ET Company Participants Josh Carroll - Alpha IR Group, IR Doron Blachar - CEO Assi Ginzburg - CFO Conference Call Participants Noah Kaye - Oppenheimer Justin Clare - ROTH Capital Mark Strouse - JPMorgan Operator Good morning, and welcome to the Ormat Technologies Third Quarter 2024 Earnings Conference Call. [Operator Instructions] After today's presentation, there will be an opportunity to ask questions.

Ormat Technologies: Growth Prospects Outpaced By Overvaluation
Ormat Technologies is a leading geothermal power company with a stable revenue growth and an ambitious growth plan targeting 2.1GW-2.3GW capacity by FY26. Geothermal energy's stable output and lower construction costs make it a crucial component of the electricity transition, offering a valuable alternative to nuclear power. Increased debt and potential policy changes under the new Trump administration pose risks, though high margins and steady OCF production remain strengths.


Ormat Releases 2023 Sustainability Report
RENO, Nev., Oct. 31, 2024 (GLOBE NEWSWIRE) -- Ormat Technologies Inc. (NYSE: ORA), a leading renewable energy company, today announced the release of its annual Sustainability Report, providing an overview of the Company's environmental, social, and governance (ESG) performance in 2023.

Similar Companies
Related Metrics
Explore detailed financial metrics and analysis for ORA.