POSCO Holdings Key Executives
This section highlights POSCO Holdings's key executives, including their titles and compensation details.
Find Contacts at POSCO Holdings
(Showing 0 of )
POSCO Holdings Earnings
This section highlights POSCO Holdings's earnings, including key dates, EPS, earnings reports, and earnings call transcripts.
Next Earnings Date
Last Earnings Results
Earnings Call Transcripts
| Transcript | Quarter | Year | Date | Estimated EPS | Actual EPS |
|---|---|---|---|---|---|
| Read Transcript | Q4 | 2024 | 2025-02-03 | $0.74 | $-1.19 |
| Read Transcript | Q3 | 2024 | 2024-10-31 | N/A | N/A |
| Read Transcript | Q2 | 2024 | 2024-07-25 | $0.86 | $1.14 |
| Read Transcript | Q4 | 2023 | 2024-01-31 | N/A | N/A |
| Read Transcript | Q3 | 2023 | 2023-10-29 | N/A | N/A |
| Read Transcript | Q2 | 2023 | 2023-07-24 | N/A | N/A |
| Read Transcript | Q1 | 2023 | 2023-04-28 | N/A | N/A |

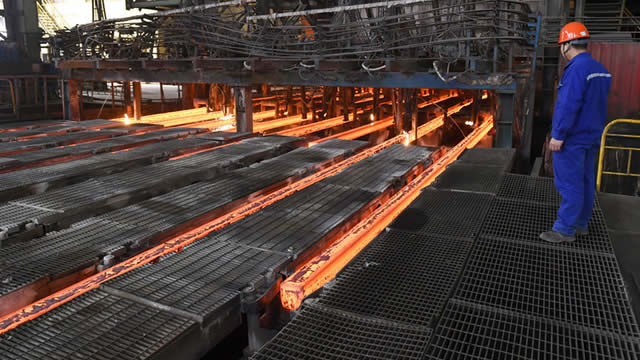
POSCO Holdings Inc., together with its subsidiaries, manufactures and sells steel rolled products and plates in South Korea and internationally. It operates through four segments: Steel, Construction, Trading, and Others. The company offers hot and cold rolled steel, steel plates, wire rods, galvanized sheets, electrical steel, stainless steel, and titanium. It also engages in the design, manufacture, and construction of steel mills and their facilities, and commercial and residential facilities; export and import of raw materials, as well as provision of supply and purchase transactions between domestic and foreign companies, and various steel products; power generation activities; and provision of network, system integration, and logistics services. In addition, the company is involved in the engineering and construction; research and consulting; architectural design and supervision; investment in venture, energy, and technology industries; electronic commerce; intellectual property services and consulting; transporting and warehousing; real estate development, rental, sale, and management; and education and real estate business. Further, it engages in the resource development; mine development; business facility maintenance; fuel cell; iron ore and coal sales; anode reproduction; and cargo handling business, as well as operates housing business agency. Additionally, the company is involved in the IT service and DVR; electric control engineering; forest resources development; refractory materials sales and furnace maintenance; quicklime manufacturing and sales; wastewater treatment operation and maintenance; rice processing; grain sales; and social enterprise businesses. POSCO Holdings Inc. was incorporated in 1968 and is headquartered in Pohang, South Korea.
$51.93
Stock Price
$15.71B
Market Cap
44.50K
Employees
Pohang, None
Location
Financial Statements
Access annual & quarterly financial statements for POSCO Holdings, including income statements, balance sheets, and cash flow statements..
Annual Income Statement
| Breakdown | December 31, 2024 | December 31, 2023 | December 31, 2022 | December 31, 2021 | December 31, 2020 |
|---|---|---|---|---|---|
| Revenue | $72.69T | $77.06T | $84.75T | $76.33T | $57.79T |
| Cost of Revenue | $67.30T | $70.74T | $77.10T | $64.45T | $53.07T |
| Gross Profit | $5.39T | $6.32T | $7.65T | $11.88T | $4.72T |
| Gross Profit Ratio | 7.41% | 8.20% | 9.03% | 15.60% | 8.17% |
| Research and Development Expenses | $207.56B | $175.17B | $179.71B | $123.09B | $116.27B |
| General and Administrative Expenses | $91.87B | $2.01T | $1.84T | $1.65T | $1.94T |
| Selling and Marketing Expenses | $571.73B | $539.46B | $398.03B | $482.29B | $376.94B |
| Selling General and Administrative Expenses | $2.68T | $2.61T | $2.24T | $2.14T | $2.32T |
| Other Expenses | $- | $- | $362.85B | $170.56B | $-116.27B |
| Operating Expenses | $2.88T | $2.79T | $2.78T | $2.43T | $2.32T |
| Cost and Expenses | $70.18T | $73.52T | $79.88T | $66.88T | $55.39T |
| Interest Income | $- | $502.15B | $247.00B | $292.24B | $2.68T |
| Interest Expense | $- | $1.00T | $607.46B | $439.83B | $2.89T |
| Depreciation and Amortization | $3.98T | $3.84T | $3.69T | $3.58T | $3.62T |
| EBITDA | $6.11T | $7.26T | $8.53T | $12.79T | $6.18T |
| EBITDA Ratio | 8.40% | 9.42% | 11.10% | 18.24% | 14.87% |
| Operating Income | $2.50T | $3.60T | $4.85T | $9.24T | $4.97T |
| Operating Income Ratio | 3.44% | 4.68% | 5.72% | 12.10% | 8.60% |
| Total Other Income Expenses Net | $-1.25T | $-968.78B | $-294.19B | $-152.07B | $-3.00T |
| Income Before Tax | $1.25T | $2.64T | $4.01T | $9.42T | $2.03T |
| Income Before Tax Ratio | 1.72% | 3.42% | 4.74% | 12.34% | 3.50% |
| Income Tax Expense | $303.62B | $789.30B | $453.88B | $2.22T | $236.93B |
| Net Income | $1.09T | $1.70T | $3.16T | $6.61T | $1.58T |
| Net Income Ratio | 1.51% | 2.20% | 3.73% | 8.66% | 2.74% |
| EPS | $12249.00 | $22381.00 | $41456.00 | $87330.00 | $20164.00 |
| EPS Diluted | $14039.00 | $22381.00 | $39125.00 | $85376.00 | $20164.00 |
| Weighted Average Shares Outstanding | 89.38M | 75.87M | 75.81M | 75.70M | 79.12M |
| Weighted Average Shares Outstanding Diluted | 77.99M | 75.87M | 78.91M | 76.69M | 79.12M |
| SEC Filing | Source | Source | Source | Source | Source |
| Breakdown | December 31, 2024 | September 30, 2024 | June 30, 2024 | March 31, 2024 | December 31, 2023 | September 30, 2023 | June 30, 2023 | March 31, 2023 | December 31, 2022 | September 30, 2022 | June 30, 2022 | March 31, 2022 | December 31, 2021 | September 30, 2021 | June 30, 2021 | March 31, 2021 | December 31, 2020 | September 30, 2020 | June 30, 2020 | March 31, 2020 |
|---|---|---|---|---|---|---|---|---|---|---|---|---|---|---|---|---|---|---|---|---|
| Revenue | $17.81T | $18.32T | $18.51T | $18.10T | $18.66T | $18.96T | $20.12T | $19.38T | $19.25T | $21.15T | $23.01T | $21.34T | $21.33T | $20.64T | $18.29T | $16.07T | $15.26T | $14.26T | $13.72T | $14.55T |
| Cost of Revenue | $16.73T | $1.00B | $17.09T | $16.77T | $17.53T | $17.07T | $18.09T | $18.01T | $18.87T | $19.55T | $20.28T | $18.41T | $18.19T | $16.86T | $15.47T | $13.93T | $13.80T | $13.05T | $12.99T | $13.24T |
| Gross Profit | $1.08T | $18.32T | $1.42T | $1.33T | $1.13T | $1.89T | $2.03T | $1.37T | $379.43B | $1.61T | $2.73T | $2.93T | $3.14T | $3.78T | $2.82T | $2.14T | $1.47T | $1.21T | $733.94B | $1.31T |
| Gross Profit Ratio | 6.05% | 100.00% | 7.70% | 7.30% | 6.10% | 10.00% | 10.10% | 7.10% | 2.00% | 7.60% | 11.90% | 13.70% | 14.70% | 18.30% | 15.40% | 13.30% | 9.62% | 8.46% | 5.35% | 9.01% |
| Research and Development Expenses | $51.29B | $- | $56.44B | $246.31B | $157.43B | $45.00B | $39.79B | $36.14B | $58.92B | $49.63B | $37.59B | $33.56B | $39.36B | $23.36B | $28.03B | $32.34B | $37.92B | $29.08B | $25.41B | $23.87B |
| General and Administrative Expenses | $16.31B | $- | $20.80B | $509.26B | $548.26B | $504.19B | $480.67B | $463.71B | $507.15B | $468.25B | $430.23B | $441.70B | $484.96B | $420.57B | $380.08B | $367.94B | $1.03T | $341.14B | $326.07B | $356.43B |
| Selling and Marketing Expenses | $202.64B | $- | $134.77B | $80.72B | $119.61B | $72.33B | $73.03B | $84.38B | $120.67B | $92.80B | $72.57B | $102.24B | $129.37B | $123.29B | $128.39B | $101.24B | $33.38B | $106.58B | $101.64B | $135.34B |
| Selling General and Administrative Expenses | $861.32B | $763.00B | $580.61B | $746.00B | $917.80B | $691.00B | $553.70B | $548.09B | $627.83B | $561.05B | $502.80B | $543.94B | $614.33B | $543.86B | $508.46B | $469.18B | $1.06T | $447.72B | $427.71B | $491.76B |
| Other Expenses | $- | $16.82T | $-37.93B | $-17.50T | $-23.24B | $-1.38T | $-102.46B | $41.30B | $38.80B | $133.20B | $99.28B | $92.45B | $63.62B | $21.56B | $28.58B | $50.92B | $-274.84B | $17.06B | $12.71B | $-13.29B |
| Operating Expenses | $912.61B | $17.58T | $674.98B | $17.50T | $1.10T | $-692.00B | $695.72B | $625.54B | $725.55B | $743.88B | $639.67B | $669.95B | $727.49B | $655.88B | $625.97B | $597.79B | $620.51B | $559.71B | $540.70B | $595.90B |
| Cost and Expenses | $17.64T | $17.58T | $17.76T | $17.50T | $18.63T | $16.38T | $18.78T | $18.63T | $19.59T | $20.29T | $20.92T | $19.08T | $18.92T | $17.51T | $16.10T | $14.53T | $14.42T | $13.61T | $13.53T | $13.83T |
| Interest Income | $- | $- | $129.30B | $172.44B | $149.38B | $126.73B | $121.75B | $104.29B | $- | $116.97B | $117.74B | $109.81B | $83.78B | $92.08B | $61.77B | $54.62B | $2.38T | $92.28B | $111.15B | $92.85B |
| Interest Expense | $- | $- | $198.62B | $246.80B | $247.71B | $252.64B | $256.38B | $244.56B | $295.86B | $171.65B | $129.39B | $106.02B | $115.67B | $88.55B | $106.30B | $129.32B | $2.39T | $159.00B | $171.67B | $175.13B |
| Depreciation and Amortization | $1.00T | $- | $921.12B | $1.00T | $972.88B | $983.48B | $935.43B | $952.87B | $968.84B | $927.53B | $908.87B | $888.34B | $912.80B | $889.12B | $881.56B | $899.10B | $936.14B | $900.17B | $900.97B | $884.46B |
| EBITDA | $1.06T | $740.00B | $1.83T | $1.91T | $1.03T | $1.98T | $2.16T | $2.10T | $-535.97B | $1.77T | $3.38T | $3.25T | $3.03T | $4.05T | $3.20T | $2.59T | $1.54T | $1.69T | $1.21T | $1.72T |
| EBITDA Ratio | 5.96% | 4.04% | 9.01% | 3.22% | 5.40% | 6.31% | 11.72% | 9.27% | 3.28% | 8.68% | 14.48% | 16.90% | 16.65% | 21.39% | 18.43% | 16.25% | 25.40% | 12.44% | 8.86% | 11.76% |
| Operating Income | $164.17B | $740.00B | $747.39B | $600.00B | $34.88B | $1.20T | $1.33T | $704.70B | $-336.63B | $919.54B | $2.10T | $2.26T | $2.37T | $3.12T | $2.20T | $1.55T | $863.36B | $666.71B | $167.72B | $705.25B |
| Operating Income Ratio | 0.92% | 4.04% | 4.04% | 3.31% | 0.19% | 6.31% | 6.59% | 3.64% | -1.75% | 4.35% | 9.12% | 10.58% | 11.10% | 15.10% | 12.03% | 9.66% | 5.66% | 4.67% | 1.22% | 4.85% |
| Total Other Income Expenses Net | $-1.06T | $-50.00B | $-32.48B | $116.98B | $-356.41B | $-365.00B | $-296.33B | $296.55B | $-1.08T | $-286.22B | $239.30B | $206.36B | $-295.34B | $242.69B | $197.25B | $7.12B | $-369.25B | $45.45B | $-33.57B | $-44.85B |
| Income Before Tax | $-892.16B | $690.00B | $623.16B | $700.00B | $-213.86B | $831.12B | $1.03T | $1.00T | $-1.41T | $627.22B | $2.34T | $2.46T | $2.10T | $3.36T | $2.40T | $1.56T | $518.38B | $712.16B | $134.15B | $660.40B |
| Income Before Tax Ratio | -5.01% | 3.77% | 3.37% | 3.87% | -1.15% | 4.38% | 5.12% | 5.17% | -7.35% | 2.96% | 10.16% | 11.55% | 9.84% | 16.28% | 13.11% | 9.71% | 3.40% | 4.99% | 0.98% | 4.54% |
| Income Tax Expense | $188.89B | $-1.00B | $173.31B | $100.00B | $93.81B | $-550.00B | $253.93B | $160.95B | $-677.42B | $35.58B | $538.59B | $557.12B | $476.94B | $731.79B | $590.67B | $420.78B | $-216.20B | $198.11B | $29.28B | $225.75B |
| Net Income | $-428.39B | $453.00B | $530.00B | $540.72B | $-206.26B | $488.20B | $690.00B | $726.42B | $-736.98B | $509.91B | $1.59T | $1.71T | $1.50T | $2.43T | $1.66T | $1.02T | $701.02B | $465.46B | $40.28B | $395.39B |
| Net Income Ratio | -2.41% | 2.47% | 2.86% | 2.99% | -1.11% | 2.57% | 3.43% | 3.75% | -3.83% | 2.41% | 6.90% | 8.02% | 7.02% | 11.77% | 9.10% | 6.38% | 4.59% | 3.26% | 0.29% | 2.72% |
| EPS | $-5668.65 | $5482.67 | $6984.18 | $5912.18 | $-2718.39 | $6434.18 | $9090.24 | $9577.16 | $-9716.39 | $6722.75 | $20941.00 | $22607.00 | $21452.00 | $32106.00 | $21986.00 | $13477.00 | $8583.54 | $5854.00 | $483.00 | $4915.00 |
| EPS Diluted | $-5665.00 | $5482.67 | $6157.03 | $5912.18 | $-2718.39 | $6434.18 | $9090.24 | $9577.16 | $-9716.39 | $6722.74 | $20126.00 | $21736.00 | $21452.00 | $31571.00 | $21986.00 | $13477.00 | $8583.54 | $5854.00 | $483.00 | $4915.00 |
| Weighted Average Shares Outstanding | 75.57M | 82.62M | 75.88M | 84.57M | 75.88M | 75.88M | 75.88M | 75.85M | 75.85M | 75.85M | 75.85M | 75.71M | 75.62M | 75.63M | 75.63M | 75.91M | 77.13M | 79.23M | 80.01M | 80.12M |
| Weighted Average Shares Outstanding Diluted | 75.62M | 82.62M | 79.14M | 84.57M | 75.88M | 75.88M | 75.88M | 75.85M | 75.85M | 75.85M | 78.92M | 78.74M | 75.63M | 76.58M | 75.63M | 75.91M | 79.23M | 79.23M | 80.01M | 80.12M |
| SEC Filing | Source | Source | Source | Source | Source | Source | Source | Source | Source | Source | Source | Source | Source | Source | Source | Source | Source | Source | Source | Source |
Annual Balance Sheet
| Breakdown | December 31, 2024 | December 31, 2023 | December 31, 2022 | December 31, 2021 | December 31, 2020 |
|---|---|---|---|---|---|
| Cash and Cash Equivalents | $6.77T | $6.67T | $8.05T | $4.78T | $4.75T |
| Short Term Investments | $8.03T | $11.24T | $10.69T | $13.38T | $11.71T |
| Cash and Short Term Investments | $14.80T | $17.91T | $18.74T | $18.16T | $16.46T |
| Net Receivables | $10.84T | $12.73T | $12.11T | $12.18T | $9.67T |
| Inventory | $14.14T | $14.56T | $15.47T | $15.22T | $9.05T |
| Other Current Assets | $3.64T | $1.54T | $1.44T | $1.19T | $750.16B |
| Total Current Assets | $43.42T | $46.73T | $47.65T | $46.62T | $35.83T |
| Property Plant Equipment Net | $39.85T | $35.37T | $31.88T | $29.66T | $29.40T |
| Goodwill | $357.85B | $403.17B | $442.49B | $735.97B | $903.89B |
| Intangible Assets | $4.32T | $4.15T | $4.22T | $3.37T | $3.49T |
| Goodwill and Intangible Assets | $4.68T | $4.55T | $4.66T | $4.10T | $4.45T |
| Long Term Investments | $4.76T | $7.59T | $7.19T | $6.45T | $5.44T |
| Tax Assets | $- | $3.36T | $3.50T | $1.43T | $1.34T |
| Other Non-Current Assets | $10.69T | $3.88T | $3.52T | $3.20T | $2.63T |
| Total Non-Current Assets | $59.98T | $54.75T | $50.76T | $44.85T | $43.26T |
| Other Assets | $- | $- | $- | $-0 | $- |
| Total Assets | $103.40T | $101.49T | $98.41T | $91.47T | $79.09T |
| Account Payables | $6.16T | $6.96T | $6.94T | $6.50T | $4.56T |
| Short Term Debt | $11.28T | $10.13T | $9.76T | $8.02T | $7.85T |
| Tax Payables | $- | $319.10B | $1.18T | $2.61T | $366.48B |
| Deferred Revenue | $- | $693.69B | $597.91B | $582.37B | $975.95B |
| Other Current Liabilities | $5.34T | $4.36T | $4.73T | $3.03T | $3.42T |
| Total Current Liabilities | $22.78T | $22.47T | $23.19T | $21.08T | $16.85T |
| Long Term Debt | $15.63T | $15.77T | $13.06T | $13.51T | $12.32T |
| Deferred Revenue Non-Current | $- | $8.89B | $22.20B | $27.91B | $329.23B |
| Deferred Tax Liabilities Non-Current | $- | $2.76T | $2.92T | $1.27T | $1.32T |
| Other Non-Current Liabilities | $3.55T | $879.33B | $950.67B | $775.98B | $903.53B |
| Total Non-Current Liabilities | $19.17T | $19.42T | $16.96T | $15.58T | $14.56T |
| Other Liabilities | $- | $- | $0 | $- | $- |
| Total Liabilities | $41.95T | $41.89T | $40.15T | $36.67T | $31.41T |
| Preferred Stock | $- | $- | $- | $- | $- |
| Common Stock | $482.40B | $482.40B | $482.40B | $482.40B | $482.40B |
| Retained Earnings | $53.66T | $53.81T | $52.97T | $51.53T | $46.11T |
| Accumulated Other Comprehensive Income Loss | $1.16T | $248.22B | $-443.99B | $-666.99B | $-1.38T |
| Other Total Stockholders Equity | $98.03B | $-397.83B | $-932.62B | $-863.46B | $-834.61B |
| Total Stockholders Equity | $55.39T | $54.15T | $52.51T | $50.43T | $44.33T |
| Total Equity | $61.45T | $59.60T | $58.26T | $54.80T | $47.67T |
| Total Liabilities and Stockholders Equity | $103.40T | $101.49T | $98.41T | $91.47T | $79.09T |
| Minority Interest | $6.06T | $5.45T | $5.75T | $4.38T | $3.34T |
| Total Liabilities and Total Equity | $103.40T | $101.49T | $98.41T | $91.47T | $79.09T |
| Total Investments | $12.80T | $18.83T | $18.24T | $19.83T | $17.15T |
| Total Debt | $26.90T | $25.90T | $25.13T | $22.52T | $20.50T |
| Net Debt | $20.14T | $19.23T | $17.08T | $17.74T | $15.74T |
Balance Sheet Charts
| Breakdown | December 31, 2024 | September 30, 2024 | June 30, 2024 | March 31, 2024 | December 31, 2023 | September 30, 2023 | June 30, 2023 | March 31, 2023 | December 31, 2022 | September 30, 2022 | June 30, 2022 | March 31, 2022 | December 31, 2021 | September 30, 2021 | June 30, 2021 | March 31, 2021 | December 31, 2020 | September 30, 2020 | June 30, 2020 | March 31, 2020 |
|---|---|---|---|---|---|---|---|---|---|---|---|---|---|---|---|---|---|---|---|---|
| Cash and Cash Equivalents | $6.77T | $7.73T | $8.03T | $17.88T | $5.20T | $19.69T | $6.35T | $7.01T | $8.05T | $7.50T | $5.77T | $6.33T | $4.78T | $5.48T | $4.02T | $4.55T | $4.75T | $6.77T | $6.04T | $5.08T |
| Short Term Investments | $8.03T | $8.37T | $5.18T | $6.29T | $8.31T | $12.62T | $13.35T | $12.87T | $10.69T | $13.45T | $12.17T | $13.25T | $13.38T | $13.09T | $12.66T | $13.02T | $11.71T | $11.12T | $10.85T | $10.27T |
| Cash and Short Term Investments | $14.80T | $16.10T | $13.22T | $17.88T | $13.51T | $19.69T | $19.70T | $19.88T | $18.74T | $20.94T | $17.94T | $19.58T | $18.16T | $18.57T | $16.68T | $17.57T | $16.46T | $17.89T | $16.89T | $15.35T |
| Net Receivables | $10.84T | $- | $13.55T | $13.83T | $13.07T | $13.42T | $13.86T | $13.90T | $12.11T | $13.52T | $14.59T | $13.85T | $12.18T | $12.49T | $11.23T | $10.74T | $9.67T | $10.47T | $10.14T | $10.81T |
| Inventory | $14.14T | $13.70T | $13.49T | $15.03T | $13.83T | $14.15T | $15.03T | $15.03T | $15.47T | $17.43T | $17.96T | $16.08T | $15.22T | $13.81T | $11.43T | $10.25T | $9.05T | $9.02T | $9.74T | $10.73T |
| Other Current Assets | $3.64T | $14.40T | $6.82T | $1.11T | $5.81T | $1.32T | $1.48T | $1.51T | $1.44T | $2.01T | $1.66T | $1.58T | $1.19T | $968.62B | $916.93B | $972.15B | $750.16B | $960.47B | $1.02T | $1.01T |
| Total Current Assets | $43.42T | $44.20T | $47.17T | $46.77T | $46.21T | $48.64T | $50.01T | $50.31T | $47.65T | $53.77T | $52.15T | $50.93T | $46.62T | $45.71T | $40.18T | $39.44T | $35.83T | $38.25T | $37.75T | $37.81T |
| Property Plant Equipment Net | $39.85T | $38.54T | $38.15T | $36.70T | $35.21T | $34.31T | $33.50T | $32.83T | $31.88T | $31.46T | $30.57T | $29.77T | $29.66T | $29.48T | $29.39T | $29.47T | $29.40T | $29.91T | $30.21T | $30.40T |
| Goodwill | $357.85B | $398.83B | $400.54B | $403.32B | $403.17B | $442.92B | $442.92B | $442.87B | $442.49B | $807.88B | $738.76B | $739.51B | $735.97B | $906.89B | $905.04B | $- | $903.89B | $1.09T | $1.10T | $1.10T |
| Intangible Assets | $4.32T | $4.18T | $4.11T | $4.32T | $4.14T | $4.31T | $4.37T | $4.28T | $4.22T | $4.38T | $4.32T | $3.40T | $3.37T | $3.34T | $3.35T | $- | $3.49T | $3.57T | $3.65T | $3.71T |
| Goodwill and Intangible Assets | $4.68T | $4.67T | $4.51T | $4.72T | $4.54T | $4.88T | $4.81T | $4.72T | $4.66T | $5.19T | $5.06T | $4.14T | $4.10T | $4.24T | $4.26T | $4.35T | $4.45T | $4.67T | $4.74T | $4.80T |
| Long Term Investments | $4.76T | $- | $11.38T | $11.11T | $10.82T | $2.78T | $7.39T | $7.52T | $7.19T | $7.80T | $7.23T | $7.10T | $6.45T | $6.35T | $5.72T | $5.56T | $5.44T | $5.43T | $5.39T | $5.16T |
| Tax Assets | $- | $- | $3.24T | $3.29T | $3.33T | $3.30T | $3.34T | $3.39T | $3.50T | $3.59T | $3.59T | $3.60T | $1.43T | $1.41T | $1.35T | $1.36T | $1.34T | $1.25T | $1.28T | $1.25T |
| Other Non-Current Assets | $10.69T | $14.89T | $834.91B | $670.60B | $834.69B | $9.12T | $4.03T | $4.13T | $3.52T | $3.42T | $3.27T | $3.08T | $3.20T | $2.95T | $2.56T | $2.64T | $2.63T | $2.59T | $2.73T | $2.83T |
| Total Non-Current Assets | $59.98T | $58.10T | $58.11T | $56.49T | $54.73T | $54.38T | $53.07T | $52.59T | $50.76T | $51.46T | $49.72T | $47.70T | $44.85T | $44.43T | $43.29T | $43.38T | $43.26T | $43.84T | $44.37T | $44.45T |
| Other Assets | $- | $-1.00B | $- | $0 | $1 | $- | $- | $-0 | $- | $0 | $- | $- | $-0 | $-0 | $0 | $- | $- | $- | $- | $- |
| Total Assets | $103.40T | $102.30T | $105.29T | $103.27T | $100.95T | $103.02T | $103.08T | $102.90T | $98.41T | $105.23T | $101.87T | $98.63T | $91.47T | $90.14T | $83.47T | $82.82T | $79.09T | $82.09T | $82.11T | $82.26T |
| Account Payables | $6.16T | $- | $6.94T | $6.67T | $6.96T | $6.39T | $6.87T | $7.00T | $6.94T | $6.77T | $7.79T | $6.75T | $6.50T | $5.95T | $4.96T | $4.72T | $4.56T | $4.00T | $3.97T | $4.20T |
| Short Term Debt | $11.28T | $- | $11.64T | $11.44T | $10.13T | $11.05T | $9.14T | $9.76T | $9.76T | $13.21T | $11.86T | $10.14T | $8.02T | $7.70T | $7.80T | $8.57T | $7.85T | $9.42T | $9.68T | $8.61T |
| Tax Payables | $- | $- | $224.79B | $221.06B | $319.10B | $974.63B | $980.70B | $889.58B | $1.18T | $1.50T | $1.55T | $2.19T | $2.61T | $2.14T | $1.59T | $1.09T | $366.48B | $895.12B | $926.76B | $938.13B |
| Deferred Revenue | $- | $- | $609.97B | $975.70B | $1.02T | $458.52B | $443.76B | $592.67B | $597.91B | $558.99B | $679.05B | $582.95B | $582.37B | $499.94B | $518.68B | $492.98B | $975.95B | $543.06B | $573.50B | $627.88B |
| Other Current Liabilities | $5.34T | $22.62T | $3.86T | $4.13T | $3.76T | $3.01T | $3.95T | $4.45T | $4.73T | $4.21T | $3.50T | $3.41T | $3.03T | $2.69T | $2.44T | $2.95T | $3.42T | $3.02T | $2.82T | $3.61T |
| Total Current Liabilities | $22.78T | $22.62T | $23.28T | $23.07T | $21.86T | $22.07T | $21.74T | $22.89T | $23.19T | $26.69T | $25.76T | $23.58T | $21.08T | $19.41T | $17.74T | $18.29T | $16.85T | $18.41T | $18.27T | $18.28T |
| Long Term Debt | $15.63T | $- | $17.19T | $16.16T | $15.77T | $16.63T | $17.54T | $16.50T | $13.06T | $14.07T | $13.05T | $13.52T | $13.51T | $14.96T | $12.58T | $13.05T | $12.32T | $13.54T | $13.96T | $14.19T |
| Deferred Revenue Non-Current | $- | $- | $4.84B | $3.75B | $8.89B | $9.94B | $12.02B | $21.16B | $22.20B | $26.20B | $90.23B | $26.64B | $27.91B | $22.78B | $23.39B | $24.00B | $329.23B | $18.41B | $18.68B | $22.33B |
| Deferred Tax Liabilities Non-Current | $- | $- | $2.77T | $2.80T | $2.76T | $3.00T | $3.01T | $3.04T | $2.92T | $3.32T | $3.45T | $3.53T | $1.27T | $1.31T | $1.38T | $1.36T | $1.32T | $1.50T | $1.48T | $1.57T |
| Other Non-Current Liabilities | $3.55T | $18.47T | $839.72B | $834.50B | $879.33B | $6.59T | $904.20B | $946.67B | $950.67B | $914.13B | $778.21B | $816.89B | $775.98B | $911.42B | $893.68B | $881.07B | $903.53B | $832.08B | $790.21B | $775.20B |
| Total Non-Current Liabilities | $19.17T | $18.47T | $20.80T | $19.80T | $19.42T | $26.22T | $21.46T | $20.51T | $16.96T | $18.34T | $17.36T | $17.89T | $15.58T | $17.21T | $14.87T | $15.32T | $14.56T | $15.89T | $16.25T | $16.56T |
| Other Liabilities | $- | $61.20T | $2 | $60.40T | $-0 | $- | $- | $-0 | $0 | $- | $- | $- | $- | $- | $- | $- | $- | $- | $- | $- |
| Total Liabilities | $41.95T | $102.30T | $44.07T | $103.27T | $41.28T | $48.29T | $43.20T | $43.40T | $40.15T | $45.03T | $43.12T | $41.46T | $36.67T | $36.61T | $32.61T | $33.61T | $31.41T | $34.30T | $34.52T | $34.85T |
| Preferred Stock | $- | $- | $- | $- | $- | $- | $- | $- | $- | $- | $- | $- | $- | $- | $- | $- | $- | $- | $- | $- |
| Common Stock | $482.40B | $- | $482.40B | $482.40B | $482.40B | $482.40B | $482.40B | $482.40B | $482.40B | $482.40B | $482.40B | $482.40B | $482.40B | $482.40B | $482.40B | $482.40B | $482.40B | $482.40B | $482.40B | $482.40B |
| Retained Earnings | $53.66T | $- | $54.57T | $54.23T | $53.68T | $54.33T | $54.03T | $53.50T | $52.97T | $53.62T | $54.09T | $52.79T | $51.53T | $50.35T | $48.22T | $46.78T | $46.11T | $45.48T | $45.06T | $45.14T |
| Accumulated Other Comprehensive Income Loss | $1.16T | $- | $643.60B | $312.58B | $248.22B | $158.03B | $63.41B | $157.57B | $-443.99B | $854.71B | $-244.49B | $-220.85B | $-666.99B | $-705.00B | $-993.89B | $-1.05T | $-1.38T | $-1.20T | $-1.17T | $-1.42T |
| Other Total Stockholders Equity | $98.03B | $55.30T | $-249.05B | $-234.06B | $-441.76B | $-245.47B | $-499.55B | $-515.09B | $-932.62B | $-525.25B | $-1.07T | $-1.43T | $-863.46B | $-954.38B | $-952.72B | $-951.87B | $-834.61B | $-322.23B | $-38.59B | $30.92B |
| Total Stockholders Equity | $55.39T | $55.30T | $55.45T | $54.80T | $54.18T | $54.73T | $54.34T | $53.80T | $52.51T | $54.45T | $53.26T | $51.99T | $50.43T | $49.17T | $46.76T | $45.26T | $44.33T | $44.44T | $44.33T | $44.23T |
| Total Equity | $61.45T | $55.30T | $61.21T | $60.41T | $59.66T | $60.35T | $59.88T | $59.50T | $58.26T | $60.19T | $58.75T | $57.16T | $54.80T | $53.52T | $50.86T | $49.22T | $47.67T | $47.79T | $47.59T | $47.41T |
| Total Liabilities and Stockholders Equity | $103.40T | $157.60T | $105.29T | $158.07T | $100.95T | $103.02T | $103.08T | $102.90T | $98.41T | $105.23T | $101.87T | $98.63T | $91.47T | $90.14T | $83.47T | $82.82T | $79.09T | $82.09T | $82.11T | $82.26T |
| Minority Interest | $6.06T | $- | $5.76T | $5.60T | $5.48T | $5.62T | $5.54T | $5.70T | $5.75T | $5.74T | $5.49T | $5.17T | $4.38T | $4.35T | $4.10T | $3.95T | $3.34T | $3.35T | $3.26T | $3.18T |
| Total Liabilities and Total Equity | $103.40T | $157.60T | $105.29T | $158.07T | $100.95T | $103.02T | $103.08T | $102.90T | $98.41T | $105.23T | $101.87T | $98.63T | $91.47T | $90.14T | $83.47T | $82.82T | $79.09T | $82.09T | $82.11T | $82.26T |
| Total Investments | $12.80T | $8.37T | $16.57T | $17.40T | $19.13T | $2.78T | $20.74T | $20.39T | $18.24T | $21.25T | $19.40T | $20.36T | $20.08T | $19.44T | $18.38T | $18.59T | $17.03T | $16.55T | $16.25T | $15.43T |
| Total Debt | $26.90T | $- | $28.83T | $28.67T | $26.89T | $28.88T | $28.58T | $28.49T | $25.13T | $29.63T | $26.38T | $24.79T | $22.52T | $23.62T | $21.11T | $22.48T | $20.50T | $24.36T | $24.87T | $24.29T |
| Net Debt | $20.14T | $-7.73T | $20.80T | $10.78T | $21.70T | $9.19T | $22.23T | $21.48T | $17.08T | $22.13T | $20.61T | $18.46T | $17.74T | $18.14T | $17.09T | $17.93T | $15.74T | $17.59T | $18.84T | $19.21T |
Annual Cash Flow
| Breakdown | December 31, 2024 | December 31, 2023 | December 31, 2022 | December 31, 2021 | December 31, 2020 |
|---|---|---|---|---|---|
| Net Income | $1.09T | $1.85T | $3.56T | $7.20T | $1.79T |
| Depreciation and Amortization | $3.98T | $3.84T | $3.69T | $3.58T | $3.62T |
| Deferred Income Tax | $- | $789.37B | $453.88B | $2.22T | $236.93B |
| Stock Based Compensation | $- | $- | $- | $- | $- |
| Change in Working Capital | $713.14B | $-823.98B | $-35.01B | $-6.82T | $2.80T |
| Accounts Receivables | $1.57T | $-1.09T | $547.48B | $-1.57T | $818.86B |
| Inventory | $218.51B | $1.38T | $-415.60B | $-6.05T | $1.44T |
| Accounts Payables | $- | $-118.80B | $141.93B | $1.40T | $594.41B |
| Other Working Capital | $-1.07T | $-994.10B | $-308.82B | $-604.14B | $-53.62B |
| Other Non Cash Items | $871.13B | $511.60B | $-1.49T | $-224.64B | $237.99B |
| Net Cash Provided by Operating Activities | $6.66T | $6.17T | $6.19T | $6.26T | $8.69T |
| Investments in Property Plant and Equipment | $-7.67T | $-6.80T | $-5.42T | $-3.51T | $-3.50T |
| Acquisitions Net | $- | $-150.20B | $-1.25T | $-425.95B | $-45.90B |
| Purchases of Investments | $- | $-40.22T | $-89.84T | $-42.39T | $-43.65T |
| Sales Maturities of Investments | $- | $40.32T | $91.87T | $40.61T | $40.95T |
| Other Investing Activities | $3.19T | $-537.20B | $419.87B | $130.84B | $-18.88B |
| Net Cash Used for Investing Activities | $-4.49T | $-7.39T | $-4.22T | $-5.58T | $-6.26T |
| Debt Repayment | $-1.83T | $609.20B | $1.91T | $309.52B | $584.54B |
| Common Stock Issued | $- | $- | $- | $- | $- |
| Common Stock Repurchased | $-92.31B | $-340.00B | $- | $-116.77B | $-1.16T |
| Dividends Paid | $-844.20B | $-815.45B | $-1.22T | $-1.25T | $-598.19B |
| Other Financing Activities | $463.51B | $27.66B | $625.63B | $349.51B | $-133.05B |
| Net Cash Used Provided by Financing Activities | $-2.30T | $-178.59B | $1.32T | $-768.67B | $-1.09T |
| Effect of Forex Changes on Cash | $221.88B | $16.72B | $-8.74B | $112.95B | $-95.27B |
| Net Change in Cash | $97.02B | $-1.38T | $3.28T | $20.14B | $1.24T |
| Cash at End of Period | $6.77T | $6.67T | $8.05T | $4.78T | $4.76T |
| Cash at Beginning of Period | $6.67T | $8.05T | $4.78T | $4.76T | $3.52T |
| Operating Cash Flow | $6.66T | $6.17T | $6.19T | $6.26T | $8.69T |
| Capital Expenditure | $-7.67T | $-7.23T | $-5.42T | $-3.51T | $-3.50T |
| Free Cash Flow | $-1.01T | $-1.06T | $766.31B | $2.75T | $5.19T |
Cash Flow Charts
| Breakdown | December 31, 2024 | September 30, 2024 | June 30, 2024 | March 31, 2024 | December 31, 2023 | September 30, 2023 | June 30, 2023 | March 31, 2023 | December 31, 2022 | September 30, 2022 | June 30, 2022 | March 31, 2022 | December 31, 2021 | September 30, 2021 | June 30, 2021 | March 31, 2021 | December 31, 2020 | September 30, 2020 | June 30, 2020 | March 31, 2020 |
|---|---|---|---|---|---|---|---|---|---|---|---|---|---|---|---|---|---|---|---|---|
| Net Income | $-428.39B | $452.65B | $529.93B | $540.72B | $-206.26B | $550.50B | $775.97B | $840.30B | $-736.98B | $591.64B | $1.80T | $1.91T | $1.62T | $2.63T | $1.81T | $1.14T | $734.58B | $514.05B | $104.87B | $434.66B |
| Depreciation and Amortization | $1.00T | $1.06T | $921.12B | $1.00T | $972.88B | $983.48B | $935.43B | $952.87B | $968.84B | $927.53B | $908.87B | $888.35B | $912.80B | $889.12B | $878.43B | $899.10B | $936.14B | $900.17B | $900.97B | $884.46B |
| Deferred Income Tax | $- | $- | $- | $124.70B | $93.81B | $280.61B | $253.93B | $160.95B | $-677.42B | $35.58B | $538.59B | $557.12B | $476.94B | $731.79B | $590.67B | $420.78B | $-216.20B | $198.11B | $29.28B | $225.75B |
| Stock Based Compensation | $- | $- | $- | $- | $- | $- | $- | $- | $- | $- | $- | $- | $- | $- | $- | $- | $- | $- | $- | $- |
| Change in Working Capital | $918.43B | $-349.70B | $892.32B | $-1.33T | $608.03B | $232.17B | $-281.89B | $-1.43T | $3.05T | $866.47B | $-1.75T | $-2.20T | $-1.16T | $-2.52T | $-1.35T | $-1.79T | $780.25B | $845.50B | $1.16T | $193.52B |
| Accounts Receivables | $1.51T | $128.90B | $-288.66B | $248.29B | $195.62B | $189.59B | $-415.26B | $-1.32T | $829.36B | $1.75T | $-353.61B | $-1.68T | $463.51B | $-830.43B | $-399.01B | $-799.40B | $699.11B | $-405.10B | $813.98B | $-289.14B |
| Inventory | $-93.63B | $-198.90B | $734.11B | $-223.07B | $-103.96B | $1.01T | $-12.35B | $493.60B | $1.20T | $895.11B | $-1.77T | $-737.79B | $-1.51T | $-2.22T | $-1.22T | $-1.11T | $-582.68B | $765.75B | $915.71B | $345.16B |
| Accounts Payables | $- | $- | $161.20B | $-578.27B | $357.95B | $-788.57B | $349.77B | $-37.95B | $973.51B | $-1.63T | $656.65B | $146.62B | $271.43B | $681.01B | $516.50B | $-67.00B | $739.88B | $154.24B | $-159.59B | $-140.11B |
| Other Working Capital | $-496.34B | $-279.70B | $285.68B | $-773.12B | $158.42B | $-175.29B | $-204.05B | $-566.44B | $51.88B | $-146.81B | $-288.04B | $74.15B | $-380.14B | $-151.47B | $-256.68B | $184.14B | $-76.06B | $330.61B | $-411.63B | $277.61B |
| Other Non Cash Items | $757.25B | $177.93B | $447.13B | $2.63T | $2.01T | $266.47B | $81.03B | $-798.57B | $558.96B | $317.80B | $-1.22T | $-1.14T | $596.48B | $-79.19B | $-87.00B | $-7.37B | $77.28B | $-127.30B | $2.69B | $111.17B |
| Net Cash Provided by Operating Activities | $2.25T | $1.34T | $2.79T | $285.14B | $1.89T | $2.15T | $2.40T | $-270.88B | $3.16T | $2.74T | $274.24B | $9.41B | $2.45T | $1.59T | $1.64T | $570.87B | $2.70T | $2.14T | $2.13T | $1.73T |
| Investments in Property Plant and Equipment | $-1.99T | $-1.88T | $-2.05T | $-1.92T | $-2.40T | $-1.67T | $-1.71T | $-1.45T | $-2.30T | $-1.07T | $-1.08T | $-964.37B | $-1.35T | $-804.15B | $-773.82B | $-584.98B | $-1.05T | $-606.48B | $-791.92B | $-1.05T |
| Acquisitions Net | $- | $- | $- | $37.21B | $74.27B | $-292.31B | $-16.02B | $-214.79B | $117.61B | $-249.79B | $-947.45B | $-170.39B | $-243.48B | $-128.49B | $-31.50B | $-22.48B | $-32.05B | $26.11B | $11.26B | $-51.22B |
| Purchases of Investments | $- | $- | $-4.91T | $-4.77T | $-2.80T | $-3.09T | $-4.92T | $-29.44T | $-33.86T | $-17.21T | $-12.70T | $-26.07T | $-12.99T | $-10.05T | $-8.81T | $-10.54T | $-10.80T | $-11.15T | $-12.35T | $-9.34T |
| Sales Maturities of Investments | $- | $- | $5.03T | $5.23T | $4.39T | $3.91T | $4.46T | $27.69T | $36.15T | $15.93T | $13.61T | $26.18T | $13.00T | $9.32T | $9.13T | $9.16T | $10.30T | $10.89T | $11.74T | $8.02T |
| Other Investing Activities | $240.50B | $2.43T | $127.86B | $-32.29B | $-19.13B | $93.97B | $12.57B | $72.95B | $7.05B | $101.99B | $232.40B | $78.42B | $37.07B | $-171.65B | $170.76B | $94.66B | $-155.78B | $4.18B | $13.57B | $119.15B |
| Net Cash Used for Investing Activities | $-1.75T | $555.71B | $-1.80T | $-1.46T | $-750.44B | $-1.05T | $-2.17T | $-3.34T | $118.38B | $-2.50T | $-885.02B | $-952.31B | $-1.54T | $-1.84T | $-316.12B | $-1.88T | $-1.74T | $-835.66B | $-1.38T | $-2.30T |
| Debt Repayment | $-321.92B | $-2.48T | $470.29B | $1.28T | $-1.28T | $-129.38B | $-419.21B | $2.45T | $-2.28T | $1.59T | $-650.07B | $2.02T | $-1.11T | $1.93T | $-1.27T | $582.17B | $-2.15T | $-190.67B | $800.96B | $2.27T |
| Common Stock Issued | $- | $- | $- | $- | $-67.92B | $- | $- | $- | $- | $- | $- | $- | $- | $- | $- | $- | $- | $- | $- | $2.70T |
| Common Stock Repurchased | $85.30K | $-92.31B | $- | $- | $-340.00B | $- | $- | $- | $- | $- | $- | $- | $- | $- | $- | $-116.77B | $-553.54B | $-264.85B | $-64.82B | $-278.58B |
| Dividends Paid | $-189.06B | $-192.51B | $-461.89B | $-734.22M | $-190.78B | $-197.77B | $-426.51B | $-384.17M | $-151.92B | $-307.01B | $-759.17B | $-304.00M | $-376.89B | $-304.79B | $-627.68B | $-1.57B | $-118.44B | $-39.79B | $-499.55B | $-1.36B |
| Other Financing Activities | $-1.12T | $621.32B | $119.04B | $30.23B | $267.22B | $-16.77B | $-23.55B | $56.37B | $73.56B | $6.53B | $1.33T | $452.95B | $-108.65B | $18.51B | $31.81B | $588.20B | $-56.29B | $-63.23B | $1.37B | $-157.18B |
| Net Cash Used Provided by Financing Activities | $-1.63T | $-2.14T | $127.44B | $1.31T | $-1.54T | $-343.92B | $-869.28B | $2.51T | $-2.36T | $1.29T | $-80.43B | $2.47T | $-1.59T | $1.64T | $-1.87T | $1.05T | $-2.88T | $-558.55B | $237.96B | $2.11T |
| Effect of Forex Changes on Cash | $174.75B | $-59.37B | $42.61B | $63.89B | $-70.96B | $37.03B | $-14.62B | $65.27B | $-366.68B | $198.37B | $131.15B | $28.42B | $-19.43B | $65.62B | $13.94B | $52.81B | $-85.20B | $-14.77B | $-28.04B | $32.74B |
| Net Change in Cash | $-961.03B | $-305.49B | $1.16T | $1.68T | $-1.95T | $796.86B | $-659.08B | $-1.04T | $557.41B | $1.73T | $-560.06B | $1.55T | $-705.26B | $1.46T | $-524.00B | $-208.51B | $-2.01T | $727.83B | $959.72B | $1.57T |
| Cash at End of Period | $6.77T | $7.73T | $8.03T | $6.87T | $5.20T | $7.15T | $6.35T | $7.01T | $8.05T | $7.50T | $5.77T | $6.33T | $4.78T | $5.48T | $4.02T | $4.55T | $4.76T | $6.77T | $6.04T | $5.08T |
| Cash at Beginning of Period | $7.73T | $8.03T | $6.87T | $5.20T | $7.15T | $6.35T | $7.01T | $8.05T | $7.50T | $5.77T | $6.33T | $4.78T | $5.48T | $4.02T | $4.55T | $4.76T | $6.77T | $6.04T | $5.08T | $3.52T |
| Operating Cash Flow | $2.25T | $1.34T | $2.79T | $285.14B | $1.89T | $2.15T | $2.40T | $-270.88B | $3.16T | $2.74T | $274.24B | $9.41B | $2.45T | $1.59T | $1.64T | $570.87B | $2.70T | $2.14T | $2.13T | $1.73T |
| Capital Expenditure | $-1.99T | $-1.88T | $-1.96T | $-1.92T | $-2.40T | $-1.67T | $-1.71T | $-1.45T | $-2.30T | $-1.07T | $-1.08T | $-964.37B | $-1.35T | $-804.15B | $-773.82B | $-584.98B | $-1.05T | $-606.48B | $-791.92B | $-1.05T |
| Free Cash Flow | $258.57B | $-540.40B | $831.60B | $-1.64T | $-508.98B | $484.80B | $688.18B | $-1.72T | $866.39B | $1.67T | $-810.71B | $-954.96B | $1.10T | $788.87B | $870.42B | $-14.11B | $1.65T | $1.53T | $1.33T | $678.11B |
POSCO Holdings Dividends
Explore POSCO Holdings's dividend history, including dividend yield, payout ratio, and historical payments.
Dividend Yield
2.20%
Dividend Payout Ratio
48.02%
Dividend Paid & Capex Coverage Ratio
0.77x
POSCO Holdings Dividend History
| Dividend | Adjusted Dividend | Date | Record Date | Payment Date | Declaration Date |
|---|---|---|---|---|---|
| $0.35 | $0.35 | September 30, 2024 | September 30, 2024 | November 29, 2024 | September 06, 2024 |
| $0.37 | $0.37 | June 28, 2024 | June 28, 2024 | September 06, 2024 | June 06, 2024 |
| $0.47259 | $0.47259 | March 28, 2024 | April 01, 2024 | April 26, 2024 | January 31, 2024 |
| $0.46829 | $0.46829 | February 28, 2024 | February 29, 2024 | August 12, 2024 | January 31, 2024 |
| $0.48027 | $0.48027 | September 28, 2023 | September 29, 2023 | December 01, 2023 | September 07, 2023 |
| $0.47224 | $0.47224 | June 29, 2023 | June 30, 2023 | September 06, 2023 | June 15, 2023 |
| $0.47224 | $0.47224 | March 30, 2023 | March 31, 2023 | June 08, 2023 | March 15, 2023 |
| $0.3 | $0.3 | December 28, 2022 | December 31, 2022 | April 24, 2023 | December 07, 2022 |
| $0.3 | $0.3 | September 29, 2022 | September 30, 2022 | December 02, 2022 | September 09, 2022 |
| $0.73819 | $0.73819 | June 29, 2022 | June 30, 2022 | September 09, 2022 | September 02, 2021 |
| $0.66245 | $0.66245 | March 30, 2022 | March 31, 2022 | June 09, 2022 | |
| $0.835 | $0.835 | December 29, 2021 | December 31, 2021 | April 25, 2022 | April 18, 2021 |
| $1.04889 | $1.04889 | September 29, 2021 | September 30, 2021 | December 03, 2021 | November 26, 2020 |
| $0.8617 | $0.86165 | June 29, 2021 | June 30, 2021 | September 10, 2021 | |
| $0.6745 | $0.67447 | March 30, 2021 | March 31, 2021 | June 10, 2021 | |
| $1.005 | $1.0048 | December 30, 2020 | December 31, 2020 | April 16, 2021 | December 08, 2020 |
| $0.3387 | $0.33866 | September 29, 2020 | September 30, 2020 | December 04, 2020 | |
| $0.10526 | $0.10526 | June 29, 2020 | June 30, 2020 | September 04, 2020 | |
| $0.3026 | $0.3026 | March 30, 2020 | March 31, 2020 | June 04, 2020 | |
| $0.81116 | $0.81116 | December 27, 2019 | December 31, 2019 | May 04, 2020 | April 27, 2019 |
POSCO Holdings News
Read the latest news about POSCO Holdings, including recent articles, headlines, and updates.
US-Based Energy Fuels and South Korea-Based POSCO International Forge Collaboration to Create Non-China Rare Earth Magnet Supply Chain
Collaboration could fast-track the formation of one of the world's first commercial permanent rare earth magnet supply chains independent of China by linking Energy Fuels' emerging U.S. rare earth oxide production with POSCO's current position as a global leader in traction motor cores used in EVs and hybrid EVs sold by major OEMs. DENVER , March 17, 2025 /PRNewswire/ - Energy Fuels Inc. (NYSE American: UUUU) (TSX: EFR) (Energy Fuels or the Company), a leading U.S. producer of uranium, rare earth elements (REE), and heavy mineral sands (HMS), today announced the signing of a strategic Memorandum of Understanding (MOU) with South Korea-based POSCO International Corporation (POSCO) that sets out the principal terms of a collaboration that, if successful, has the potential to create a new non-China REE supply chain for electric vehicle (EV) and hybrid EV drivetrains for U.S., E.U.

POSCO Holdings: A Value Stock With Consistent Profitability
POSCO Holdings is undervalued, trading at less than half its tangible book value, despite consistent profitability and a strong balance sheet. The company maintains profitability during difficult steel markets through diversification, with significant potential in its battery materials business. POSCO believes it is past the worst of this steel down cycle, with expected earnings improvement in 2025 and potential growth from cost-cutting and new duties on Chinese steel.


POSCO Holdings Inc. (PKX) Q4 2024 Earnings Call Transcript
POSCO Holdings Inc. (NYSE:PKX ) Q4 2024 Earnings Conference Call February 3, 2025 1:00 AM ET Company Participants Kim Jun-Hyung - Head of Finance & IR Division Yoo Jinnyoung - Head of Finance Conference Call Participants Park Hyun-Wook - Hyundai Motor Company Kim Yoon Sang - iM Securities Lee Tae-Hwan - Daishin Securities Kim Jun-Hyung Good afternoon. Thank you for joining us at POSCO Holdings Earnings Call.

American Resources Corporation's ReElement Technologies and POSCO International Come Together to Develop a Sustainable Rare Earth Element and Magnet Supply Chain
Companies enter into a Memorandum of Understanding (MOU) to develop a commercial partnership for rare earth element refining, recycling and offtake ReElement will utilize its proprietary technology for rare-earth magnet recycling and ore purification to produce magnet-grade rare earth oxides to power POSCO's magnet manufacturing FISHERS, IN / ACCESSWIRE / November 21, 2024 / American Resources Corporation (NASDAQ:AREC) ("American Resources" or the "Company") announced today that its wholly owned subsidiary, ReElement Technologies Corporation ("ReElement"), a leading provider of high-performance refining capacity for rare earth and critical battery elements, has signed a Memorandum of Understanding (MOU) with POSCO International ("POSCO"). This collaboration will integrate ReElement's efficient magnet recycling and rare earth ore refining processes into POSCO's global rare earth magnet manufacturing network.

POSCO: Look Past Q3 Earnings Miss
POSCO Holdings' Q3 2024 bottom line fell short of expectations, but I think investors should focus on the stock's future prospects and valuation re-rating potential. The stock is currently trading at a mid-single-digit forward EV/EBITDA ratio and below 0.5 times P/B. The potential re-rating catalysts for PKX include a fourth-quarter earnings turnaround and the successful conclusion of its portfolio restructuring exercise by 2026.


Are Investors Undervaluing POSCO (PKX) Right Now?
Here at Zacks, our focus is on the proven Zacks Rank system, which emphasizes earnings estimates and estimate revisions to find great stocks. Nevertheless, we are always paying attention to the latest value, growth, and momentum trends to underscore strong picks.

Fast-paced Momentum Stock Posco (PKX) Is Still Trading at a Bargain
If you are looking for stocks that have gained strong momentum recently but are still trading at reasonable prices, Posco (PKX) could be a great choice. It is one of the several stocks that passed through our 'Fast-Paced Momentum at a Bargain' screen.


POSCO Holdings Inc. (PKX) Q2 2024 Earnings Call Transcript
POSCO Holdings Inc. (NYSE:PKX ) Q2 2024 Earnings Conference Call July 25, 2024 2:00 AM ET Company Participants Ki-Seop Jeong - Chief Strategy Officer Conference Call Participants Park Hyun-Wook - Hyundai Motor Company Kim Yoon Sang - HI Investment Securities Eugene Lee - Eugene Securities Operator Good afternoon. Thank you for joining us for the POSCO Holdings Earnings Call for Q2 2024.


POSCO Holdings Inc. (PKX) Q1 2024 Earnings Call Transcript
POSCO Holdings Inc. (NYSE:PKX ) Q1 2024 Earnings Call Transcript April 25, 2024 2:00 AM ET Company Participants Ki-Seop Jeong - CSO Lee Kyung-seop - Chief of LiB Materials Business Han Young-ah - Head of Finance Kim Sang-hoon - Managing Director Conference Call Participants Park Hyun-Wook - Hyundai Securities Kim Yoon Sang - HI Investment Securities Eugene Lee - Eugene Securities Ki-Seop Jeong Greetings, everyone. I am CSO of POSCO Holdings.


POSCO: Wait For Better Entry Point
Korean steel giant POSCO has made a successful pivot to green material business, supplying battery parts for EV leaders like LG & Samsung. PKX has delivered 24% & 29% return over the past 1 & 5 years despite challenging growth and earnings outlook. My target price of $72 means the stock appears overvalued. I advise interested investors to watch for potential correction, especially under the currently weak macro environment.


Rally will fizzle out in a week or two, Morgan Stanley strategist Wilson says
What an incredible rally it was last week, in a big dash for trash as bond yields tumbled. The mostly profitless tech stocks of the ARK Innovation ETF ARKK rallied 19% last week, and the regional banks in the SPDR S&P Regional Banking ETF KRE surged 12%.

POSCO Holdings Inc. (PKX) Q3 2023 Earnings Call Transcript
POSCO Holdings Inc. (NYSE:PKX ) Q3 2023 Earnings Call Transcript October 24, 2023 2:00 AM ET Company Participants Jeong Ki-Seop - President, Co-CEO, CSO Han Young-Ah - Head of Investor Relations Lee Kyung-seop - Chief of LiB Materials Business Conference Call Participants Kim Sang-hoon - HI Investment & Securities Operator We will now begin the 2023 Third Quarter Earnings Release Conference Call of POSCO Holdings. As for today's conference call, after the presentation of POSCO Holdings, we will have a Q&A session with the participants.


Why Fast-paced Mover Posco (PKX) Is a Great Choice for Value Investors
Posco (PKX) could be a great choice for investors looking to buy stocks that have gained strong momentum recently but are still trading at reasonable prices. It is one of the several stocks that made it through our 'Fast-Paced Momentum at a Bargain' screen.


POSCO Holdings Still Has Legs To Run
POSCO Holdings Inc. shares have performed well in recent times, but its current valuations are still undemanding. POSCO Holdings' plans to increase its operating earnings contribution from the company's battery materials business might be the key driver of valuation multiple expansion for the stock. I maintain a Buy rating for POSCO Holdings as I think that the company's shares have the potential to rise further.


POSCO Holdings Inc. (PKX) Q2 2023 Earnings Call Transcript
POSCO Holdings Inc. (NYSE:PKX ) Q2 2023 Earnings Conference Call July 23, 2023 10:00 PM ET Company Participants Jeong Ki-Seop - President, Co-CEO, CSO Han Young-Ah - Head of Investor Relations Lee Kyung-seop - Chief of LiB Materials Business Kim Seung-Jun - Head of Finance Team Jeong Dae-Hyung - Head of Corporate Strategy Team Conference Call Participants Yi Hyun-soo - Yuanta Securities Kim Sang-hoon - HI Investment & Securities Lee Eu-gene - Eugene Investment & Securities Sean Jou - Marshall Wace Jeong Ki-Seop Good afternoon, everyone. I am Jeong Ki-Seop, CSO at POSCO Holdings.


Similar Companies
Related Metrics
Explore detailed financial metrics and analysis for PKX.