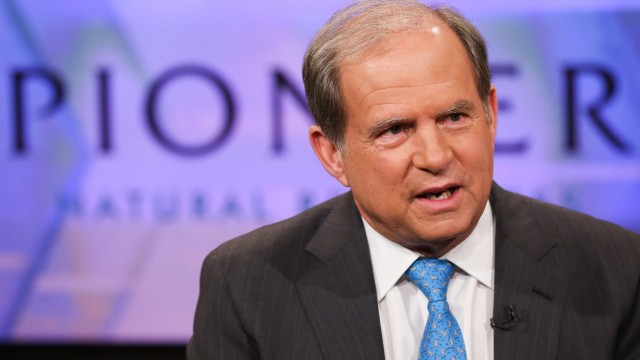
Pioneer Natural Resources Key Executives
This section highlights Pioneer Natural Resources's key executives, including their titles and compensation details.
Find Contacts at Pioneer Natural Resources
(Showing 0 of )
Pioneer Natural Resources Earnings
This section highlights Pioneer Natural Resources's earnings, including key dates, EPS, earnings reports, and earnings call transcripts.
Next Earnings Date
Last Earnings Results
Earnings Call Transcripts
| Transcript | Quarter | Year | Date | Estimated EPS | Actual EPS |
|---|---|---|---|---|---|
| Read Transcript | Q2 | 2023 | 2023-08-02 | N/A | N/A |
| Read Transcript | Q1 | 2023 | 2023-04-27 | N/A | N/A |

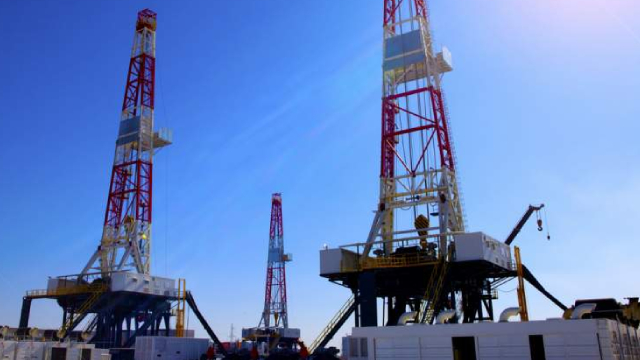
Pioneer Natural Resources Company operates as an independent oil and gas exploration and production company in the United States. The company explores for, develops, and produces oil, natural gas liquids (NGLs), and gas. It has operations in the Midland Basin in West Texas. As of December 31, 2021, the company had proved undeveloped reserves and proved developed non-producing reserves of 130 million barrels of oil, 92 million barrels of NGLs, and 462 billion cubic feet of gas; and owned interests in 11 gas processing plants. Pioneer Natural Resources Company was founded in 1997 and is headquartered in Irving, Texas.
$269.62
Stock Price
$63.00B
Market Cap
2.21K
Employees
Irving, TX
Location
Financial Statements
Access annual & quarterly financial statements for Pioneer Natural Resources, including income statements, balance sheets, and cash flow statements..
Annual Income Statement
| Breakdown | December 31, 2023 | December 31, 2022 | December 31, 2021 | December 31, 2020 | December 31, 2019 |
|---|---|---|---|---|---|
| Revenue | $19.37B | $24.38B | $17.87B | $7.02B | $9.67B |
| Cost of Revenue | $12.27B | $13.65B | $10.98B | $6.20B | $7.36B |
| Gross Profit | $7.10B | $10.73B | $6.89B | $828.00M | $2.31B |
| Gross Profit Ratio | 36.60% | 44.01% | 38.60% | 11.79% | 23.94% |
| Research and Development Expenses | $- | $- | $- | $- | $- |
| General and Administrative Expenses | $461.00M | $334.00M | $292.00M | $244.00M | $324.00M |
| Selling and Marketing Expenses | $- | $- | $- | $- | $- |
| Selling General and Administrative Expenses | $461.00M | $334.00M | $292.00M | $244.00M | $324.00M |
| Other Expenses | $-78.00M | $56.00M | $58.00M | $56.00M | $68.00M |
| Operating Expenses | $557.00M | $390.00M | $350.00M | $300.00M | $392.00M |
| Cost and Expenses | $12.83B | $14.04B | $11.33B | $6.50B | $7.75B |
| Interest Income | $6.00M | $119.00M | $23.00M | $24.00M | $76.00M |
| Interest Expense | $142.00M | $128.00M | $161.00M | $196.00M | $121.00M |
| Depreciation and Amortization | $2.86B | $2.53B | $2.50B | $1.64B | $1.71B |
| EBITDA | $9.36B | $12.82B | $8.65B | $1.85B | $3.26B |
| EBITDA Ratio | 48.29% | 52.57% | 48.43% | 26.28% | 33.73% |
| Operating Income | $-1.41B | $10.29B | $6.16B | $207.00M | $1.55B |
| Operating Income Ratio | -7.26% | 42.19% | 34.45% | 2.95% | 16.04% |
| Total Other Income Expenses Net | $-172.00M | $-391.00M | $-3.80B | $-383.00M | $-865.00M |
| Income Before Tax | $6.25B | $9.95B | $2.75B | $-261.00M | $987.00M |
| Income Before Tax Ratio | 32.24% | 40.81% | 15.37% | -3.72% | 10.21% |
| Income Tax Expense | $1.35B | $2.11B | $628.00M | $-61.00M | $231.00M |
| Net Income | $4.88B | $7.83B | $2.11B | $-200.00M | $756.00M |
| Net Income Ratio | 25.21% | 32.11% | 11.82% | -2.85% | 7.82% |
| EPS | $20.88 | $32.63 | $9.07 | $-1.21 | $4.61 |
| EPS Diluted | $20.20 | $31.10 | $8.61 | $-1.21 | $4.61 |
| Weighted Average Shares Outstanding | 234.00M | 240.00M | 233.00M | 165.00M | 167.00M |
| Weighted Average Shares Outstanding Diluted | 242.00M | 252.00M | 246.00M | 165.00M | 167.00M |
| SEC Filing | Source | Source | Source | Source | Source |
| Breakdown | March 31, 2024 | December 31, 2023 | September 30, 2023 | June 30, 2023 | March 31, 2023 | December 31, 2022 | September 30, 2022 | June 30, 2022 | March 31, 2022 | December 31, 2021 | September 30, 2021 | June 30, 2021 | March 31, 2021 | December 31, 2020 | September 30, 2020 | June 30, 2020 | March 31, 2020 | December 31, 2019 | September 30, 2019 | June 30, 2019 |
|---|---|---|---|---|---|---|---|---|---|---|---|---|---|---|---|---|---|---|---|---|
| Revenue | $4.90B | $5.08B | $5.14B | $4.56B | $4.60B | $5.17B | $6.06B | $7.00B | $6.15B | $5.58B | $4.96B | $4.27B | $3.06B | $2.02B | $1.86B | $1.14B | $2.01B | $2.64B | $2.41B | $2.38B |
| Cost of Revenue | $3.23B | $3.29B | $3.16B | $3.01B | $2.81B | $3.06B | $3.43B | $3.75B | $3.41B | $3.17B | $2.97B | $2.74B | $2.09B | $1.67B | $1.62B | $1.20B | $1.71B | $2.01B | $1.88B | $1.80B |
| Gross Profit | $1.68B | $1.78B | $1.98B | $1.55B | $1.78B | $2.11B | $2.63B | $3.25B | $2.74B | $2.41B | $1.99B | $1.52B | $970.00M | $350.00M | $240.00M | $-61.00M | $297.00M | $630.00M | $530.00M | $577.00M |
| Gross Profit Ratio | 34.20% | 35.10% | 38.60% | 34.00% | 38.80% | 40.80% | 43.40% | 46.50% | 44.60% | 43.10% | 40.20% | 35.70% | 31.70% | 17.36% | 12.92% | -5.35% | 14.78% | 23.85% | 22.03% | 24.25% |
| Research and Development Expenses | $- | $- | $- | $- | $- | $- | $- | $- | $- | $- | $- | $- | $- | $- | $- | $- | $- | $- | $- | $- |
| General and Administrative Expenses | $92.00M | $202.00M | $87.00M | $88.00M | $84.00M | $83.00M | $90.00M | $88.00M | $73.00M | $76.00M | $72.00M | $75.00M | $68.00M | $64.00M | $64.00M | $60.00M | $56.00M | $78.00M | $72.00M | $80.00M |
| Selling and Marketing Expenses | $- | $- | $- | $- | $- | $- | $- | $- | $- | $- | $- | $- | $- | $- | $- | $- | $- | $- | $- | $- |
| Selling General and Administrative Expenses | $92.00M | $202.00M | $87.00M | $88.00M | $84.00M | $83.00M | $90.00M | $88.00M | $73.00M | $76.00M | $72.00M | $75.00M | $68.00M | $64.00M | $64.00M | $60.00M | $56.00M | $78.00M | $72.00M | $80.00M |
| Other Expenses | $-5.00M | $-7.00M | $-25.00M | $-16.00M | $19.00M | $13.00M | $12.00M | $15.00M | $18.00M | $-26.00M | $-34.00M | $-47.00M | $-304.00M | $-48.00M | $-98.00M | $-90.00M | $-85.00M | $-58.00M | $-32.00M | $-211.00M |
| Operating Expenses | $117.00M | $230.00M | $109.00M | $115.00M | $103.00M | $96.00M | $102.00M | $103.00M | $91.00M | $90.00M | $84.00M | $87.00M | $88.00M | $78.00M | $82.00M | $72.00M | $67.00M | $92.00M | $85.00M | $97.00M |
| Cost and Expenses | $3.34B | $3.52B | $3.27B | $3.12B | $2.92B | $3.16B | $3.53B | $3.85B | $3.50B | $3.26B | $3.05B | $2.83B | $2.18B | $1.74B | $1.70B | $1.27B | $1.78B | $2.10B | $1.96B | $1.90B |
| Interest Income | $28.00M | $2.00M | $12.00M | $42.00M | $28.00M | $61.00M | $15.00M | $- | $126.00M | $- | $2.00M | $- | $60.00M | $78.00M | $13.00M | $33.00M | $25.00M | $118.00M | $- | $24.00M |
| Interest Expense | $40.00M | $- | $44.00M | $41.00M | $65.00M | $28.00M | $42.00M | $33.00M | $37.00M | $58.00M | $41.00M | $61.00M | $39.00M | $36.00M | $21.00M | $- | $- | $34.00M | $251.00M | $- |
| Depreciation and Amortization | $774.00M | $630.00M | $728.00M | $695.00M | $664.00M | $655.00M | $641.00M | $620.00M | $614.00M | $672.00M | $704.00M | $648.00M | $474.00M | $396.00M | $393.00M | $416.00M | $434.00M | $440.00M | $438.00M | $412.00M |
| EBITDA | $2.36B | $2.29B | $2.63B | $2.16B | $2.31B | $2.68B | $3.13B | $3.71B | $3.31B | $2.96B | $2.58B | $2.04B | $1.11B | $698.00M | $453.00M | $193.00M | $373.00M | $1.04B | $851.00M | $681.00M |
| EBITDA Ratio | 48.07% | 45.09% | 51.12% | 47.32% | 50.14% | 51.76% | 51.66% | 52.89% | 53.90% | 53.12% | 52.03% | 47.76% | 36.29% | 34.62% | 24.39% | 16.91% | 18.56% | 39.30% | 35.37% | 28.63% |
| Operating Income | $-302.00M | $1.51B | $-221.00M | $-289.00M | $1.64B | $2.02B | $2.49B | $3.08B | $2.70B | $2.28B | $1.91B | $1.44B | $878.00M | $255.00M | $140.00M | $-179.00M | $219.00M | $523.00M | $436.00M | $470.00M |
| Operating Income Ratio | -6.16% | 29.83% | -4.30% | -6.34% | 35.70% | 39.10% | 41.08% | 44.04% | 43.91% | 40.91% | 38.48% | 33.68% | 28.66% | 12.65% | 7.54% | -15.69% | 10.90% | 19.80% | 18.12% | 19.76% |
| Total Other Income Expenses Net | $-29.00M | $64.00M | $-206.00M | $-14.00M | $-76.00M | $-148.00M | $2.99B | $-21.00M | $-89.00M | $-1.32B | $-573.00M | $-938.00M | $-959.00M | $92.00M | $-23.00M | $-417.00M | $124.00M | $33.00M | $-155.00M | $-706.00M |
| Income Before Tax | $1.40B | $1.62B | $1.67B | $1.41B | $1.56B | $1.87B | $2.49B | $3.03B | $2.56B | $991.00M | $1.34B | $500.00M | $-81.00M | $28.00M | $-16.00M | $-538.00M | $365.00M | $448.00M | $303.00M | $-216.00M |
| Income Before Tax Ratio | 28.64% | 31.84% | 32.43% | 30.86% | 33.87% | 36.10% | 41.18% | 43.23% | 41.66% | 17.77% | 26.93% | 11.71% | -2.64% | 1.39% | -0.86% | -47.15% | 18.16% | 16.96% | 12.59% | -9.08% |
| Income Tax Expense | $309.00M | $347.00M | $366.00M | $305.00M | $335.00M | $387.00M | $510.00M | $657.00M | $552.00M | $228.00M | $291.00M | $120.00M | $-11.00M | $-15.00M | $4.00M | $-99.00M | $76.00M | $104.00M | $72.00M | $-47.00M |
| Net Income | $1.09B | $1.26B | $1.30B | $1.10B | $1.22B | $1.48B | $1.98B | $2.37B | $2.01B | $763.00M | $1.04B | $380.00M | $-70.00M | $43.00M | $-20.00M | $-439.00M | $289.00M | $344.00M | $231.00M | $-169.00M |
| Net Income Ratio | 22.29% | 24.92% | 25.25% | 24.12% | 26.52% | 28.62% | 32.76% | 33.85% | 32.68% | 13.68% | 21.06% | 8.90% | -2.28% | 2.13% | -1.08% | -38.48% | 14.38% | 13.03% | 9.60% | -7.10% |
| EPS | $4.68 | $5.43 | $5.57 | $4.70 | $5.19 | $6.23 | $8.30 | $9.80 | $7.85 | $3.12 | $4.27 | $1.62 | $-0.33 | $0.26 | $-0.12 | $-2.67 | $1.75 | $2.06 | $1.38 | $-1.01 |
| EPS Diluted | $4.57 | $5.27 | $5.41 | $4.55 | $5.00 | $5.98 | $7.94 | $9.33 | $7.85 | $2.97 | $4.07 | $1.54 | $-0.33 | $0.26 | $-0.12 | $-2.66 | $1.75 | $2.06 | $1.38 | $-1.01 |
| Weighted Average Shares Outstanding | 234.00M | 233.00M | 233.00M | 234.00M | 235.00M | 237.00M | 239.00M | 242.00M | 255.87M | 244.00M | 244.00M | 234.00M | 210.00M | 165.00M | 163.46M | 164.47M | 166.00M | 164.00M | 167.00M | 167.33M |
| Weighted Average Shares Outstanding Diluted | 239.00M | 240.00M | 240.00M | 242.00M | 244.00M | 247.00M | 250.00M | 254.00M | 256.00M | 257.00M | 257.00M | 247.00M | 210.00M | 165.00M | 165.00M | 165.00M | 166.00M | 166.00M | 167.00M | 168.00M |
| SEC Filing | Source | Source | Source | Source | Source | Source | Source | Source | Source | Source | Source | Source | Source | Source | Source | Source | Source | Source | Source | Source |
Annual Balance Sheet
| Breakdown | December 31, 2023 | December 31, 2022 | December 31, 2021 | December 31, 2020 | December 31, 2019 |
|---|---|---|---|---|---|
| Cash and Cash Equivalents | $240.00M | $1.03B | $3.85B | $1.44B | $631.00M |
| Short Term Investments | $139.00M | $172.00M | $193.00M | $123.00M | $187.00M |
| Cash and Short Term Investments | $379.00M | $1.20B | $4.04B | $1.56B | $818.00M |
| Net Receivables | $1.59B | $2.02B | $1.69B | $699.00M | $1.04B |
| Inventory | $476.00M | $424.00M | $369.00M | $224.00M | $205.00M |
| Other Current Assets | $160.00M | $81.00M | $79.00M | $107.00M | $126.00M |
| Total Current Assets | $2.60B | $3.73B | $6.17B | $2.60B | $2.19B |
| Property Plant Equipment Net | $33.59B | $31.63B | $30.22B | $16.22B | $16.36B |
| Goodwill | $242.00M | $243.00M | $243.00M | $261.00M | $261.00M |
| Intangible Assets | $- | $- | $- | $- | $- |
| Goodwill and Intangible Assets | $242.00M | $243.00M | $243.00M | $261.00M | $261.00M |
| Long Term Investments | $-4.40B | $- | $-2.04B | $-1.37B | $-1.39B |
| Tax Assets | $4.40B | $3.87B | $2.04B | $1.37B | $1.39B |
| Other Non-Current Assets | $179.00M | $-3.72B | $171.00M | $153.00M | $258.00M |
| Total Non-Current Assets | $34.01B | $32.01B | $30.64B | $16.63B | $16.88B |
| Other Assets | $- | $- | $- | $- | $- |
| Total Assets | $36.61B | $35.74B | $36.81B | $19.23B | $19.07B |
| Account Payables | $2.45B | $2.64B | $2.56B | $1.03B | $1.41B |
| Short Term Debt | $203.00M | $904.00M | $365.00M | $240.00M | $586.00M |
| Tax Payables | $40.00M | $63.00M | $45.00M | $4.00M | $3.00M |
| Deferred Revenue | $88.00M | $3.87B | $98.00M | $39.00M | $56.00M |
| Other Current Liabilities | $194.00M | $-3.58B | $1.01B | $593.00M | $440.00M |
| Total Current Liabilities | $2.97B | $3.89B | $4.07B | $1.91B | $2.50B |
| Long Term Debt | $5.05B | $4.36B | $6.93B | $3.27B | $2.01B |
| Deferred Revenue Non-Current | $76.00M | $- | $25.00M | $66.00M | $8.00M |
| Deferred Tax Liabilities Non-Current | $4.40B | $3.87B | $2.04B | $1.37B | $1.39B |
| Other Non-Current Liabilities | $935.00M | $1.08B | $907.00M | $1.05B | $1.05B |
| Total Non-Current Liabilities | $10.47B | $9.31B | $9.90B | $5.75B | $4.45B |
| Other Liabilities | $- | $- | $- | $- | $- |
| Total Liabilities | $13.44B | $13.20B | $13.97B | $7.66B | $6.95B |
| Preferred Stock | $- | $- | $- | $- | $- |
| Common Stock | $2.00M | $2.00M | $2.00M | $2.00M | $2.00M |
| Retained Earnings | $7.28B | $5.68B | $3.96B | $3.48B | $4.03B |
| Accumulated Other Comprehensive Income Loss | $- | $- | $- | $- | $- |
| Other Total Stockholders Equity | $15.89B | $16.85B | $18.88B | $8.09B | $8.09B |
| Total Stockholders Equity | $23.17B | $22.54B | $22.84B | $11.57B | $12.12B |
| Total Equity | $23.17B | $22.54B | $22.84B | $11.57B | $12.12B |
| Total Liabilities and Stockholders Equity | $36.61B | $35.74B | $36.81B | $19.23B | $19.07B |
| Minority Interest | $- | $- | $- | $- | $- |
| Total Liabilities and Total Equity | $36.61B | $35.74B | $36.81B | $19.23B | $19.07B |
| Total Investments | $139.00M | $172.00M | $193.00M | $123.00M | $187.00M |
| Total Debt | $5.26B | $5.26B | $7.30B | $3.51B | $2.60B |
| Net Debt | $5.02B | $4.23B | $3.45B | $2.07B | $1.96B |
Balance Sheet Charts
| Breakdown | March 31, 2024 | December 31, 2023 | September 30, 2023 | June 30, 2023 | March 31, 2023 | December 31, 2022 | September 30, 2022 | June 30, 2022 | March 31, 2022 | December 31, 2021 | September 30, 2021 | June 30, 2021 | March 31, 2021 | December 31, 2020 | September 30, 2020 | June 30, 2020 | March 31, 2020 | December 31, 2019 | September 30, 2019 | June 30, 2019 |
|---|---|---|---|---|---|---|---|---|---|---|---|---|---|---|---|---|---|---|---|---|
| Cash and Cash Equivalents | $451.00M | $240.00M | $98.00M | $91.00M | $1.19B | $1.03B | $1.32B | $2.58B | $2.38B | $3.85B | $581.00M | $93.00M | $668.00M | $1.44B | $1.32B | $180.00M | $784.00M | $631.00M | $437.00M | $643.00M |
| Short Term Investments | $134.00M | $139.00M | $176.00M | $137.00M | $119.00M | $172.00M | $506.00M | $673.00M | $871.00M | $193.00M | $144.00M | $152.00M | $177.00M | $123.00M | $67.00M | $85.00M | $42.00M | $187.00M | $151.00M | $344.00M |
| Cash and Short Term Investments | $585.00M | $379.00M | $274.00M | $228.00M | $1.31B | $1.20B | $1.82B | $3.25B | $3.26B | $4.04B | $725.00M | $245.00M | $845.00M | $1.56B | $1.39B | $265.00M | $826.00M | $818.00M | $588.00M | $987.00M |
| Net Receivables | $1.82B | $1.59B | $1.85B | $1.51B | $1.56B | $2.02B | $1.94B | $2.34B | $2.40B | $1.69B | $1.68B | $1.67B | $1.27B | $699.00M | $684.00M | $587.00M | $564.00M | $1.04B | $859.00M | $795.00M |
| Inventory | $491.00M | $476.00M | $496.00M | $448.00M | $487.00M | $424.00M | $420.00M | $606.00M | $493.00M | $369.00M | $340.00M | $350.00M | $327.00M | $224.00M | $191.00M | $170.00M | $188.00M | $205.00M | $246.00M | $249.00M |
| Other Current Assets | $132.00M | $160.00M | $165.00M | $153.00M | $117.00M | $81.00M | $103.00M | $119.00M | $103.00M | $79.00M | $95.00M | $93.00M | $106.00M | $107.00M | $153.00M | $173.00M | $491.00M | $126.00M | $230.00M | $144.00M |
| Total Current Assets | $3.03B | $2.60B | $2.79B | $2.34B | $3.47B | $3.73B | $4.28B | $6.32B | $6.25B | $6.17B | $2.84B | $2.36B | $2.55B | $2.60B | $2.42B | $1.20B | $2.07B | $2.19B | $1.92B | $2.17B |
| Property Plant Equipment Net | $34.06B | $33.59B | $33.16B | $32.74B | $32.23B | $31.63B | $30.99B | $30.56B | $30.24B | $30.22B | $34.29B | $34.01B | $27.38B | $16.22B | $16.15B | $16.28B | $16.50B | $16.36B | $15.65B | $15.37B |
| Goodwill | $242.00M | $242.00M | $242.00M | $242.00M | $242.00M | $243.00M | $243.00M | $243.00M | $243.00M | $243.00M | $261.00M | $261.00M | $261.00M | $261.00M | $261.00M | $261.00M | $261.00M | $261.00M | $261.00M | $262.00M |
| Intangible Assets | $- | $- | $- | $- | $- | $- | $- | $- | $- | $- | $- | $- | $- | $- | $- | $- | $- | $- | $- | $- |
| Goodwill and Intangible Assets | $242.00M | $242.00M | $242.00M | $242.00M | $242.00M | $243.00M | $243.00M | $243.00M | $243.00M | $243.00M | $261.00M | $261.00M | $261.00M | $261.00M | $261.00M | $261.00M | $261.00M | $261.00M | $261.00M | $262.00M |
| Long Term Investments | $-4.48B | $-575.00M | $-4.23B | $-4.10B | $- | $-633.00M | $- | $48.00M | $-2.57B | $87.00M | $-1.83B | $-1.54B | $-1.43B | $- | $-1.41B | $-1.40B | $-1.42B | $- | $-1.26B | $-46.00M |
| Tax Assets | $4.48B | $575.00M | $4.23B | $4.10B | $3.98B | $633.00M | $3.30B | $3.09B | $2.57B | $1.96B | $1.83B | $1.54B | $1.44B | $- | $1.41B | $1.40B | $1.47B | $- | $1.28B | $56.00M |
| Other Non-Current Assets | $186.00M | $179.00M | $170.00M | $170.00M | $-3.81B | $143.00M | $-3.07B | $-2.96B | $131.00M | $-1.87B | $157.00M | $156.00M | $154.00M | $153.00M | $144.00M | $164.00M | $174.00M | $258.00M | $231.00M | $290.00M |
| Total Non-Current Assets | $34.48B | $34.01B | $33.58B | $33.15B | $32.64B | $32.01B | $31.46B | $30.98B | $30.61B | $30.64B | $34.71B | $34.42B | $27.80B | $16.63B | $16.56B | $16.71B | $16.98B | $16.88B | $16.16B | $15.93B |
| Other Assets | $- | $- | $- | $- | $- | $- | $- | $- | $- | $- | $- | $- | $- | $- | $- | $- | $- | $- | $- | $- |
| Total Assets | $37.51B | $36.61B | $36.36B | $35.49B | $36.11B | $35.74B | $35.75B | $37.30B | $36.86B | $36.81B | $37.55B | $36.78B | $30.35B | $19.23B | $18.98B | $17.91B | $19.05B | $19.07B | $18.08B | $18.11B |
| Account Payables | $2.55B | $2.45B | $2.67B | $2.38B | $2.35B | $2.64B | $2.48B | $2.69B | $2.72B | $2.56B | $2.40B | $2.45B | $1.79B | $1.03B | $1.01B | $852.00M | $1.07B | $1.41B | $1.42B | $1.57B |
| Short Term Debt | $270.00M | $203.00M | $200.00M | $456.00M | $952.00M | $904.00M | $1.11B | $1.24B | $357.00M | $365.00M | $359.00M | $123.00M | $125.00M | $240.00M | $239.00M | $249.00M | $627.00M | $586.00M | $589.00M | $590.00M |
| Tax Payables | $230.00M | $40.00M | $43.00M | $25.00M | $287.00M | $63.00M | $45.00M | $37.00M | $62.00M | $45.00M | $29.00M | $18.00M | $11.00M | $4.00M | $2.00M | $4.00M | $3.00M | $3.00M | $- | $- |
| Deferred Revenue | $246.00M | $88.00M | $59.00M | $73.00M | $- | $3.87B | $3.30B | $3.09B | $- | $2.04B | $59.00M | $70.00M | $38.00M | $1.37B | $19.00M | $30.00M | $21.00M | $1.39B | $25.00M | $53.00M |
| Other Current Liabilities | $53.00M | $194.00M | $311.00M | $265.00M | $350.00M | $-3.58B | $-2.77B | $-2.31B | $913.00M | $-934.00M | $1.69B | $1.61B | $1.28B | $-734.00M | $420.00M | $449.00M | $356.00M | $-893.00M | $429.00M | $310.00M |
| Total Current Liabilities | $3.35B | $2.97B | $3.28B | $3.20B | $3.94B | $3.89B | $4.17B | $4.75B | $4.06B | $4.07B | $4.54B | $4.27B | $3.24B | $1.91B | $1.69B | $1.58B | $2.08B | $2.50B | $2.46B | $2.52B |
| Long Term Debt | $5.07B | $5.05B | $5.12B | $5.25B | $5.35B | $4.36B | $4.47B | $4.80B | $5.67B | $6.93B | $6.91B | $7.16B | $6.43B | $3.27B | $3.26B | $2.18B | $2.29B | $2.01B | $2.02B | $2.03B |
| Deferred Revenue Non-Current | $113.00M | $76.00M | $152.00M | $85.00M | $- | $- | $- | $- | $- | $25.00M | $151.00M | $155.00M | $111.00M | $66.00M | $14.00M | $27.00M | $3.00M | $8.00M | $- | $- |
| Deferred Tax Liabilities Non-Current | $4.48B | $4.40B | $4.23B | $4.10B | $3.98B | $3.87B | $3.30B | $3.09B | $2.57B | $2.04B | $1.83B | $1.54B | $1.44B | $1.37B | $1.41B | $1.40B | $1.47B | $1.39B | $1.28B | $1.21B |
| Other Non-Current Liabilities | $916.00M | $935.00M | $850.00M | $855.00M | $1.01B | $1.08B | $852.00M | $875.00M | $897.00M | $907.00M | $932.00M | $1.01B | $981.00M | $1.05B | $954.00M | $974.00M | $1.01B | $1.05B | $462.00M | $465.00M |
| Total Non-Current Liabilities | $10.57B | $10.47B | $10.36B | $10.29B | $10.34B | $9.31B | $8.63B | $8.76B | $9.14B | $9.90B | $9.82B | $9.87B | $8.96B | $5.75B | $5.63B | $4.58B | $4.76B | $4.45B | $3.76B | $3.71B |
| Other Liabilities | $- | $- | $- | $- | $- | $- | $- | $- | $- | $- | $- | $- | $- | $- | $- | $- | $- | $- | $- | $- |
| Total Liabilities | $13.92B | $13.44B | $13.64B | $13.49B | $14.27B | $13.20B | $12.80B | $13.51B | $13.19B | $13.97B | $14.36B | $14.15B | $12.21B | $7.66B | $7.32B | $6.17B | $6.84B | $6.95B | $6.22B | $6.23B |
| Preferred Stock | $- | $- | $- | $- | $- | $- | $- | $- | $- | $- | $- | $- | $- | $- | $- | $- | $- | $- | $- | $- |
| Common Stock | $2.00M | $2.00M | $2.00M | $2.00M | $2.00M | $2.00M | $2.00M | $2.00M | $2.00M | $2.00M | $2.00M | $2.00M | $2.00M | $2.00M | $2.00M | $2.00M | $2.00M | $2.00M | $2.00M | $2.00M |
| Retained Earnings | $7.77B | $7.28B | $6.78B | $5.91B | $5.59B | $5.68B | $5.56B | $5.63B | $5.05B | $3.96B | $4.09B | $3.55B | $3.31B | $3.48B | $3.58B | $3.69B | $4.22B | $4.03B | $3.75B | $3.60B |
| Accumulated Other Comprehensive Income Loss | $- | $- | $- | $- | $- | $- | $- | $- | $- | $- | $- | $-11.15B | $-10.52B | $- | $-9.72B | $-9.35B | $-8.99B | $-8.58B | $-8.28B | $-7.88B |
| Other Total Stockholders Equity | $15.82B | $15.89B | $15.93B | $16.09B | $16.24B | $16.85B | $17.39B | $18.16B | $18.62B | $18.88B | $19.10B | $30.24B | $25.36B | $8.09B | $17.79B | $17.39B | $16.97B | $16.68B | $16.38B | $16.15B |
| Total Stockholders Equity | $23.59B | $23.17B | $22.72B | $22.00B | $21.84B | $22.54B | $22.95B | $23.79B | $23.67B | $22.84B | $23.19B | $22.64B | $18.15B | $11.57B | $11.65B | $11.74B | $12.21B | $12.12B | $11.86B | $11.88B |
| Total Equity | $23.59B | $23.17B | $22.72B | $22.00B | $21.84B | $22.54B | $22.95B | $23.79B | $23.67B | $22.84B | $23.19B | $22.64B | $18.15B | $11.57B | $11.65B | $11.74B | $12.21B | $12.12B | $11.86B | $11.88B |
| Total Liabilities and Stockholders Equity | $37.51B | $36.61B | $36.36B | $35.49B | $36.11B | $35.74B | $35.75B | $37.30B | $36.86B | $36.81B | $37.55B | $36.78B | $30.35B | $19.23B | $18.98B | $17.91B | $19.05B | $19.07B | $18.08B | $18.11B |
| Minority Interest | $- | $- | $- | $- | $- | $- | $- | $- | $- | $- | $- | $- | $- | $- | $- | $- | $- | $- | $- | $- |
| Total Liabilities and Total Equity | $37.51B | $36.61B | $36.36B | $35.49B | $36.11B | $35.74B | $35.75B | $37.30B | $36.86B | $36.81B | $37.55B | $36.78B | $30.35B | $19.23B | $18.98B | $17.91B | $19.05B | $19.07B | $18.08B | $18.11B |
| Total Investments | $134.00M | $139.00M | $176.00M | $137.00M | $119.00M | $172.00M | $506.00M | $673.00M | $871.00M | $193.00M | $144.00M | $152.00M | $177.00M | $123.00M | $67.00M | $85.00M | $42.00M | $187.00M | $151.00M | $344.00M |
| Total Debt | $5.33B | $5.26B | $5.33B | $5.71B | $6.30B | $5.26B | $5.59B | $6.04B | $6.03B | $7.30B | $7.26B | $7.29B | $6.56B | $3.51B | $3.50B | $2.43B | $2.91B | $2.60B | $2.61B | $2.62B |
| Net Debt | $4.88B | $5.02B | $5.23B | $5.62B | $5.11B | $4.23B | $4.27B | $3.46B | $3.64B | $3.45B | $6.68B | $7.19B | $5.89B | $2.07B | $2.17B | $2.25B | $2.13B | $1.96B | $2.17B | $1.98B |
Annual Cash Flow
| Breakdown | December 31, 2023 | December 31, 2022 | December 31, 2021 | December 31, 2020 | December 31, 2019 |
|---|---|---|---|---|---|
| Net Income | $4.89B | $7.84B | $2.12B | $-200.00M | $756.00M |
| Depreciation and Amortization | $2.86B | $2.53B | $3.12B | $2.05B | $2.22B |
| Deferred Income Tax | $506.00M | $1.81B | $583.00M | $-52.00M | $236.00M |
| Stock Based Compensation | $193.00M | $78.00M | $106.00M | $72.00M | $100.00M |
| Change in Working Capital | $-169.00M | $-853.00M | $-37.00M | $-104.00M | $-378.00M |
| Accounts Receivables | $259.00M | $-171.00M | $-607.00M | $309.00M | $-227.00M |
| Inventory | $-57.00M | $-59.00M | $-125.00M | $-20.00M | $-20.00M |
| Accounts Payables | $-250.00M | $-274.00M | $1.06B | $-179.00M | $-7.00M |
| Other Working Capital | $-121.00M | $-349.00M | $-364.00M | $-214.00M | $-124.00M |
| Other Non Cash Items | $162.00M | $-59.00M | $174.00M | $318.00M | $177.00M |
| Net Cash Provided by Operating Activities | $8.45B | $11.35B | $6.06B | $2.08B | $3.12B |
| Investments in Property Plant and Equipment | $-4.57B | $-3.92B | $-3.17B | $-1.60B | $-2.99B |
| Acquisitions Net | $35.00M | $367.00M | $-826.00M | $60.00M | $149.00M |
| Purchases of Investments | $- | $-1.02B | $- | $-1.00M | $-149.00M |
| Sales Maturities of Investments | $- | $1.10B | $- | $-60.00M | $624.00M |
| Other Investing Activities | $-177.00M | $-113.00M | $3.13B | $-65.00M | $-83.00M |
| Net Cash Used for Investing Activities | $-4.71B | $-3.59B | $-869.00M | $-1.67B | $-2.45B |
| Debt Repayment | $- | $- | $- | $- | $- |
| Common Stock Issued | $2.66B | $7.00M | $3.91B | $- | $6.00M |
| Common Stock Repurchased | $-701.00M | $-1.69B | $-269.00M | $-176.00M | $-653.00M |
| Dividends Paid | $-3.30B | $-6.27B | $-1.59B | $-346.00M | $-127.00M |
| Other Financing Activities | $-1.23B | $-4.34B | $-1.21B | $727.00M | $-661.00M |
| Net Cash Used Provided by Financing Activities | $-4.53B | $-10.61B | $-2.81B | $381.00M | $-788.00M |
| Effect of Forex Changes on Cash | $- | $- | $- | $- | $- |
| Net Change in Cash | $-792.00M | $-2.85B | $2.38B | $796.00M | $-120.00M |
| Cash at End of Period | $240.00M | $1.03B | $3.88B | $1.50B | $705.00M |
| Cash at Beginning of Period | $1.03B | $3.88B | $1.50B | $705.00M | $825.00M |
| Operating Cash Flow | $8.45B | $11.35B | $6.06B | $2.08B | $3.12B |
| Capital Expenditure | $-4.57B | $-3.92B | $-3.17B | $-1.60B | $-2.99B |
| Free Cash Flow | $3.88B | $7.43B | $2.89B | $481.00M | $127.00M |
Cash Flow Charts
| Breakdown | March 31, 2024 | December 31, 2023 | September 30, 2023 | June 30, 2023 | March 31, 2023 | December 31, 2022 | September 30, 2022 | June 30, 2022 | March 31, 2022 | December 31, 2021 | September 30, 2021 | June 30, 2021 | March 31, 2021 | December 31, 2020 | September 30, 2020 | June 30, 2020 | March 31, 2020 | December 31, 2019 | September 30, 2019 | June 30, 2019 |
|---|---|---|---|---|---|---|---|---|---|---|---|---|---|---|---|---|---|---|---|---|
| Net Income | $1.09B | $1.27B | $1.30B | $1.10B | $1.22B | $1.48B | $1.98B | $2.37B | $2.01B | $763.00M | $1.04B | $380.00M | $-70.00M | $43.00M | $-20.00M | $-439.00M | $289.00M | $344.00M | $231.00M | $-169.00M |
| Depreciation and Amortization | $774.00M | $630.00M | $728.00M | $662.00M | $664.00M | $2.53B | $704.00M | $648.00M | $614.00M | $2.50B | $715.00M | $930.00M | $474.00M | $1.64B | $386.00M | $857.00M | $434.00M | $1.71B | $517.00M | $868.00M |
| Deferred Income Tax | $71.00M | $165.00M | $118.00M | $113.00M | $110.00M | $559.00M | $202.00M | $513.00M | $532.00M | $212.00M | $280.00M | $109.00M | $-18.00M | $-16.00M | $3.00M | $-88.00M | $76.00M | $109.00M | $72.00M | $-47.00M |
| Stock Based Compensation | $22.00M | $123.00M | $20.00M | $27.00M | $23.00M | $19.00M | $20.00M | $20.00M | $19.00M | $19.00M | $18.00M | $17.00M | $52.00M | $18.00M | $21.00M | $17.00M | $16.00M | $19.00M | $19.00M | $38.00M |
| Change in Working Capital | $-159.00M | $130.00M | $-240.00M | $-232.00M | $173.00M | $-134.00M | $208.00M | $-329.00M | $-598.00M | $500.00M | $-110.00M | $-14.00M | $-425.00M | $-108.00M | $-31.00M | $-72.00M | $105.00M | $-183.00M | $-17.00M | $54.00M |
| Accounts Receivables | $-231.00M | $258.00M | $-337.00M | $-123.00M | $461.00M | $82.00M | $406.00M | $38.00M | $-697.00M | $-6.00M | $-8.00M | $-263.00M | $-330.00M | $-62.00M | $-97.00M | $-11.00M | $479.00M | $-180.00M | $-64.00M | $86.00M |
| Inventory | $-17.00M | $16.00M | $-49.00M | $39.00M | $-63.00M | $-4.00M | $186.00M | $-115.00M | $-126.00M | $-32.00M | $9.00M | $-12.00M | $-90.00M | $-34.00M | $-21.00M | $18.00M | $16.00M | $35.00M | $3.00M | $-22.00M |
| Accounts Payables | $-34.00M | $-124.00M | $216.00M | $38.00M | $-380.00M | $-14.00M | $-348.00M | $-90.00M | $178.00M | $544.00M | $-45.00M | $295.00M | $265.00M | $-15.00M | $148.00M | $-29.00M | $-284.00M | $-8.00M | $70.00M | $-8.00M |
| Other Working Capital | $-67.00M | $-20.00M | $-70.00M | $-186.00M | $155.00M | $-198.00M | $-36.00M | $-162.00M | $47.00M | $-6.00M | $-66.00M | $-34.00M | $-270.00M | $3.00M | $-61.00M | $-50.00M | $-106.00M | $-30.00M | $-26.00M | $-2.00M |
| Other Non Cash Items | $42.00M | $32.00M | $145.00M | $41.00M | $122.00M | $-1.86B | $-167.00M | $-2.00M | $8.00M | $-1.77B | $44.00M | $44.00M | $364.00M | $-1.04B | $32.00M | $53.00M | $-95.00M | $-1.17B | $73.00M | $45.00M |
| Net Cash Provided by Operating Activities | $1.95B | $2.35B | $2.07B | $1.71B | $2.31B | $2.60B | $2.95B | $3.22B | $2.58B | $2.23B | $1.99B | $1.47B | $377.00M | $537.00M | $391.00M | $328.00M | $825.00M | $828.00M | $895.00M | $789.00M |
| Investments in Property Plant and Equipment | $-922.00M | $-1.14B | $-1.02B | $-1.24B | $-1.18B | $-1.11B | $-972.00M | $-917.00M | $-917.00M | $-978.00M | $-998.00M | $-729.00M | $-464.00M | $-305.00M | $-263.00M | $-395.00M | $-639.00M | $-608.00M | $-870.00M | $-769.00M |
| Acquisitions Net | $- | $11.00M | $1.00M | $19.00M | $4.00M | $74.00M | $40.00M | $43.00M | $210.00M | $3.19B | $27.00M | $-943.00M | $117.00M | $- | $- | $- | $- | $- | $- | $- |
| Purchases of Investments | $- | $- | $- | $- | $- | $-74.00M | $-370.00M | $-10.00M | $-640.00M | $- | $- | $- | $- | $-1.00M | $- | $- | $- | $- | $- | $- |
| Sales Maturities of Investments | $- | $- | $- | $- | $- | $373.00M | $506.00M | $146.00M | $75.00M | $- | $- | $- | $- | $- | $- | $- | $- | $56.00M | $- | $456.00M |
| Other Investing Activities | $-42.00M | $-56.00M | $-52.00M | $-41.00M | $-28.00M | $66.00M | $-50.00M | $-20.00M | $169.00M | $3.14B | $4.00M | $-22.00M | $-1.00M | $-20.00M | $27.00M | $-28.00M | $-42.00M | $19.00M | $-25.00M | $-12.00M |
| Net Cash Used for Investing Activities | $-964.00M | $-1.18B | $-1.07B | $-1.26B | $-1.20B | $-675.00M | $-846.00M | $-758.00M | $-1.31B | $2.17B | $-994.00M | $-1.69B | $-348.00M | $-326.00M | $-236.00M | $-423.00M | $-681.00M | $-533.00M | $-895.00M | $-325.00M |
| Debt Repayment | $- | $- | $- | $- | $- | $- | $- | $- | $- | $- | $- | $- | $- | $- | $- | $- | $- | $- | $- | $- |
| Common Stock Issued | $- | $60.00M | $908.00M | $240.00M | $- | $- | $6.00M | $- | $1.00M | $3.37B | $5.00M | $3.90B | $6.00M | $- | $- | $- | $- | $- | $- | $- |
| Common Stock Repurchased | $-3.00M | $-45.00M | $-10.00M | $-126.00M | $-520.00M | $-401.00M | $-511.00M | $-499.00M | $-276.00M | $-250.00M | $-5.00M | $-1.00M | $-13.00M | $-2.00M | $-2.00M | $-50.00M | $-122.00M | $-26.00M | $-203.00M | $-202.00M |
| Dividends Paid | $-600.00M | $-768.00M | $-431.00M | $-781.00M | $-1.32B | $-1.36B | $-2.05B | $-1.79B | $-1.07B | $-874.00M | $-507.00M | $-122.00M | $-91.00M | $-91.00M | $-91.00M | $-91.00M | $-73.00M | $-73.00M | $- | $- |
| Other Financing Activities | $-171.00M | $-259.00M | $-567.00M | $-771.00M | $369.00M | $-857.00M | $-1.32B | $-484.00M | $-1.69B | $-259.00M | $-6.00M | $-232.00M | $-715.00M | $-10.00M | $1.08B | $-423.00M | $82.00M | $-30.00M | $-205.00M | $-257.00M |
| Net Cash Used Provided by Financing Activities | $-771.00M | $-1.03B | $-998.00M | $-1.55B | $-950.00M | $-2.21B | $-3.37B | $-2.27B | $-2.76B | $-1.13B | $-513.00M | $-354.00M | $-806.00M | $-101.00M | $986.00M | $-513.00M | $9.00M | $-103.00M | $-205.00M | $-257.00M |
| Effect of Forex Changes on Cash | $- | $-1.82B | $721.00M | $1.10B | $- | $- | $- | $- | $- | $- | $- | $- | $- | $- | $- | $- | $- | $- | $- | $- |
| Net Change in Cash | $211.00M | $142.00M | $7.00M | $-1.10B | $160.00M | $-290.00M | $-1.26B | $191.00M | $-1.49B | $3.26B | $485.00M | $-582.00M | $-777.00M | $110.00M | $1.14B | $-609.00M | $153.00M | $192.00M | $-205.00M | $207.00M |
| Cash at End of Period | $451.00M | $240.00M | $98.00M | $91.00M | $1.19B | $1.03B | $1.32B | $2.58B | $2.39B | $3.88B | $627.00M | $142.00M | $724.00M | $1.50B | $1.39B | $249.00M | $858.00M | $705.00M | $513.00M | $718.00M |
| Cash at Beginning of Period | $240.00M | $98.00M | $91.00M | $1.19B | $1.03B | $1.32B | $2.58B | $2.39B | $3.88B | $627.00M | $142.00M | $724.00M | $1.50B | $1.39B | $249.00M | $858.00M | $705.00M | $513.00M | $718.00M | $511.00M |
| Operating Cash Flow | $1.95B | $2.35B | $2.07B | $1.71B | $2.31B | $2.60B | $2.95B | $3.22B | $2.58B | $2.23B | $1.99B | $1.47B | $377.00M | $537.00M | $391.00M | $328.00M | $825.00M | $828.00M | $895.00M | $789.00M |
| Capital Expenditure | $-922.00M | $-1.14B | $-1.02B | $-1.24B | $-1.18B | $-1.11B | $-972.00M | $-917.00M | $-917.00M | $-978.00M | $-998.00M | $-729.00M | $-464.00M | $-305.00M | $-263.00M | $-395.00M | $-639.00M | $-608.00M | $-870.00M | $-769.00M |
| Free Cash Flow | $1.02B | $1.21B | $1.06B | $473.00M | $1.13B | $1.48B | $1.98B | $2.30B | $1.67B | $1.25B | $994.00M | $737.00M | $-87.00M | $232.00M | $128.00M | $-67.00M | $186.00M | $220.00M | $25.00M | $20.00M |
Pioneer Natural Resources Dividends
Explore Pioneer Natural Resources's dividend history, including dividend yield, payout ratio, and historical payments.
Dividend Yield
6.27%
Dividend Payout Ratio
67.53%
Dividend Paid & Capex Coverage Ratio
1.07x
Pioneer Natural Resources Dividend History
| Dividend | Adjusted Dividend | Date | Record Date | Payment Date | Declaration Date |
|---|---|---|---|---|---|
| $2.56 | $2.56 | March 01, 2024 | March 04, 2024 | March 22, 2024 | February 22, 2024 |
| $3.2 | $3.2 | November 29, 2023 | November 30, 2023 | December 22, 2023 | November 02, 2023 |
| $1.84 | $1.84 | September 05, 2023 | September 06, 2023 | September 21, 2023 | August 01, 2023 |
| $3.34 | $3.34 | May 31, 2023 | June 01, 2023 | June 21, 2023 | April 26, 2023 |
| $5.58 | $5.58 | March 03, 2023 | March 06, 2023 | March 17, 2023 | February 22, 2023 |
| $5.71 | $5.71 | November 29, 2022 | November 30, 2022 | December 15, 2022 | October 27, 2022 |
| $8.57 | $8.57 | September 02, 2022 | September 06, 2022 | September 16, 2022 | August 02, 2022 |
| $7.38 | $7.38 | May 27, 2022 | May 31, 2022 | June 14, 2022 | May 04, 2022 |
| $3.78 | $3.78 | February 25, 2022 | February 28, 2022 | March 14, 2022 | February 16, 2022 |
| $0.62 | $0.62 | December 30, 2021 | December 31, 2021 | January 14, 2022 | November 03, 2021 |
| $3.02 | $3.02 | November 29, 2021 | November 30, 2021 | December 14, 2021 | November 03, 2021 |
| $0.56 | $0.56 | September 29, 2021 | September 30, 2021 | October 14, 2021 | August 26, 2021 |
| $1.51 | $1.51 | September 02, 2021 | September 03, 2021 | September 17, 2021 | August 02, 2021 |
| $0.56 | $0.56 | June 29, 2021 | June 30, 2021 | July 14, 2021 | May 27, 2021 |
| $0.56 | $0.56 | March 30, 2021 | March 31, 2021 | April 14, 2021 | February 04, 2021 |
| $0.55 | $0.55 | December 30, 2020 | December 31, 2020 | January 14, 2021 | November 19, 2020 |
| $0.55 | $0.55 | September 29, 2020 | September 30, 2020 | October 14, 2020 | August 20, 2020 |
| $0.55 | $0.55 | June 29, 2020 | June 30, 2020 | July 14, 2020 | May 21, 2020 |
| $0.55 | $0.55 | March 30, 2020 | March 31, 2020 | April 14, 2020 | February 19, 2020 |
| $0.44 | $0.44 | December 30, 2019 | December 31, 2019 | January 14, 2020 | November 04, 2019 |
Pioneer Natural Resources News
Read the latest news about Pioneer Natural Resources, including recent articles, headlines, and updates.
FTC seeks public comment on ex-Pioneer CEO's petition to modify Exxon order
The U.S. Federal Trade Commission said on Friday that it was seeking public comment on a petition filed by the former CEO of Pioneer Natural Resources asking the commission to set aside an order involving Exxon Mobil Corp's acquisition of Pioneer.

Ex-Pioneer CEO sues FTC for banning him from Exxon board
Former Pioneer Natural Resources CEO Scott Sheffield sued the U.S. Federal Trade Commission on Tuesday, saying it violated the law by barring his inclusion on Exxon Mobil's board when the company acquired Pioneer in a deal worth $59.5 billion.
Former Pioneer Natural Resources Managing Associate General Counsel Bryan L. Clark Joins Bracewell's Dallas Office
Dallas, Texas--(Newsfile Corp. - January 6, 2025) - Bracewell LLP announced today that Bryan L. Clark has joined the firm's Dallas office as a partner in both the firm's oil and gas and energy transition practice groups.

Did FTC Over-Reach In Prohibiting Scott Sheffield From ExxonMobil's Board
The Federal Trade Commission (FTC) has taken an unprecedented step as part of the biggest shale oil and gas merger ever: ExxonMobil buying Pioneer Natural Resources Pioneer Natural Resources for the hefty sum of $60 billion. But, as part of the deal, FTC announced on May 3, 2024, the chairman of Pioneer, Scott Sheffield, was prohibited from joining the board at ExxonMobil ExxonMobil or retaining any advisory capacity.
Vistra Set to Join S&P 500; Aaon to Join S&P MidCap 400; Marathon Digital Holdings to Join S&P SmallCap 600
NEW YORK , May 3, 2024 /PRNewswire/ -- S&P MidCap 400 constituent Vistra Corp. (NYSE: VST) will replace Pioneer Natural Resources Co. (NYSE: PXD) in the S&P 500, S&P SmallCap 600 constituent Aaon Inc. (NASD: AAON) will replace Vistra in the S&P MidCap 400, and Marathon Digital Holdings Inc. (NASD: MARA) will replace Aaon in the S&P SmallCap 600 effective prior to the opening of trading on Wednesday, May 8. S&P 500 and S&P 100 constituent Exxon Mobil Corp. (NYSE: XOM) acquired Pioneer Natural Resources in a deal that closed today, Friday May 3.

ExxonMobil Completes Nearly $60B Pioneer Deal—Here's What You Need To Know
ExxonMobil (XOM) said Friday it completed its deal to buy Pioneer Natural Resources valued at nearly $60 billion after getting approval from U.S. regulators. Including debt, ExxonMobil is committing about $64.5 billion to the purchase of Pioneer.
ExxonMobil Completes Acquisition of Pioneer Natural Resources
SPRING, Texas--(BUSINESS WIRE)--Exxon Mobil Corporation (NYSE: XOM) today announced it has closed its acquisition of Pioneer Natural Resources Company (NYSE: PXD). The merger of ExxonMobil and Pioneer creates an Unconventional business with the largest, high-return development potential in the Permian Basin. The combined company's more than 1.4 million net acres in the Delaware and Midland basins have an estimated 16 billion barrels of oil equivalent resource. ExxonMobil's Permian production vo.

Pioneer Natural Resources CEO censured by the FTC
The US Federal Trade Commission (FTC) has sanctioned former Pioneer Natural Resources Corp CEO Scott Sheffield, barring him from Exxon Mobil's board amid its $60 billion acquisition of Pioneer. The FTC alleges Sheffield led a scheme with other American oil executives and OPEC to suppress production and boost profits.

FTC greenlights Exxon-Pioneer megadeal with a caveat. It's still a good sign for energy mergers
U.S. regulators on Thursday gave the go-ahead to Exxon Mobil's $60 billion purchase of Pioneer Natural Resources, but barred Pioneer's former CEO from Exxon's board on allegations he attempted to collude with OPEC to raise oil prices.
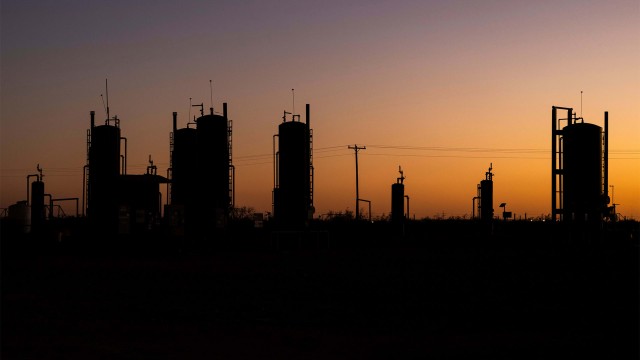
Pioneer founder barred from Exxon board in pending $60bn mega merger
The Federal Trade Commission (FTC) has barred Scott Sheffield, the founder and former chief executive of Pioneer Natural Resources, from taking a seat on Exxon's board of directors following Exxon's pending $64.5 billion acquisition of the group. It aims to prevent any potential for collusive behavior that could adversely affect crude oil market prices.
Pioneer Natural Resources Responds to FTC Settlement Complaint Filed as Part of Approval of Proposed Transaction with ExxonMobil
DALLAS--(BUSINESS WIRE)--Pioneer Natural Resources Company (NYSE:PXD) ("Pioneer" or "the Company") today issued the following statement in response to the decision by the U.S. Federal Trade Commission ("FTC") to clear the proposed merger with Exxon Mobil Corporation (NYSE: XOM) ("ExxonMobil") subject to a Consent Order based on allegations in a settlement Complaint directed at Mr. Sheffield: We disagree and are surprised by the FTC's Complaint saying that Mr. Sheffield's record and statements o.

US FTC order bans Exxon Mobil, Pioneer Natural Resources deal
The Federal Trade Commission said on Thursday it prevented former Pioneer Natural Resources CEO Scott Sheffield from serving on Exxon Mobil's board of directors as it resolves antitrust concerns about Exxon's bid to buy the top shale oil producer.

FTC Will Approve Exxon's $60 Billion Merger With Pioneer—With One Caveat
The Federal Trade Commission is set to approve ExxonMobil's $60 billion takeover of Pioneer Natural Resources, according to multiple outlets, though the deal can reportedly only close if former Pioneer CEO Scott Sheffield, who faces allegations of engaging in activity to raise gas prices, is barred from the combined company's board of directors.
Exxon-Pioneer deal set to be cleared by FTC, reports say. But there's an unusual twist.
Exxon Mobil Corp.'s XOM, -1.89% $60 billion takeover of Pioneer Natural Resources is set to be cleared by U.S. regulators, according to reports Wednesday, but there's a twist involving the latter's chief executive.
Exxon to bar Pioneer CEO from its board in deal with FTC, WSJ reports
Exxon Mobil is set to close its $60 billion deal for Pioneer Natural Resources following an agreement with antitrust enforcers to not add Pioneer CEO Scott Sheffield to its board, the Wall Street Journal reported on Wednesday, citing people familiar with the matter.

US FTC set to rule on $60 bln Exxon-Pioneer deal, Bloomberg reports
The U.S. Federal Trade Commission is set to decide whether to sue to block Exxon Mobil's $60 billion acquisition of Pioneer Natural Resources in the coming days, Bloomberg News reported on Wednesday, citing people familiar with the matter.

Similar Companies
Related Metrics
Explore detailed financial metrics and analysis for PXD.

