Rio Tinto Group Key Executives
This section highlights Rio Tinto Group's key executives, including their titles and compensation details.
Find Contacts at Rio Tinto Group
(Showing 0 of )
Rio Tinto Group Earnings
This section highlights Rio Tinto Group's earnings, including key dates, EPS, earnings reports, and earnings call transcripts.
Next Earnings Date
Last Earnings Results
Earnings Call Transcripts
| Transcript | Quarter | Year | Date | Estimated EPS | Actual EPS |
|---|---|---|---|---|---|
| Read Transcript | Q4 | 2024 | 2025-02-19 | $3.23 | $3.51 |
| Read Transcript | Q2 | 2024 | 2024-07-31 | N/A | N/A |
| Read Transcript | Q4 | 2023 | 2024-02-21 | N/A | N/A |
| Read Transcript | Q1 | 2023 | 2023-07-26 | $3.59 | $3.14 |

Rio Tinto Group engages in exploring, mining, and processing mineral resources worldwide. The company operates through Iron Ore, Aluminium, Copper, and Minerals Segments. The Iron Ore segment engages in the iron ore mining, and salt and gypsum production in Western Australia. The Aluminum segment is involved in bauxite mining; alumina refining; and aluminium smelting. The Copper segment engages in mining and refining of copper, gold, silver, molybdenum, and other by-products and exploration activities. The Minerals segment is involved in mining and processing of borates, titanium dioxide feedstock, and iron concentrate and pellets; diamond mining, sorting, and marketing; and development projects for battery materials, such as lithium. It also owns and operates open pit and underground mines; and refineries, smelters, processing plants and power, and shipping facilities. Rio Tinto Group was founded in 1873 and is headquartered in London, the United Kingdom.
$60.87
Stock Price
$98.89B
Market Cap
55.56K
Employees
London, None
Location
Financial Statements
Access annual & quarterly financial statements for Rio Tinto Group, including income statements, balance sheets, and cash flow statements..
Annual Income Statement
| Breakdown | December 31, 2024 | December 31, 2023 | December 31, 2022 | December 31, 2021 | December 31, 2020 |
|---|---|---|---|---|---|
| Revenue | $53.66B | $54.04B | $55.55B | $63.49B | $44.61B |
| Cost of Revenue | $23.38B | $36.74B | $21.28B | $18.56B | $15.48B |
| Gross Profit | $30.28B | $17.30B | $34.27B | $44.93B | $29.13B |
| Gross Profit Ratio | 56.43% | 32.01% | 61.69% | 70.77% | 65.29% |
| Research and Development Expenses | $398.00M | $245.00M | $76.00M | $65.00M | $45.00M |
| General and Administrative Expenses | $- | $5.29B | $4.25B | $3.48B | $2.74B |
| Selling and Marketing Expenses | $2.94B | $2.78B | $3.15B | $3.27B | $2.09B |
| Selling General and Administrative Expenses | $2.94B | $8.08B | $7.40B | $6.76B | $4.83B |
| Other Expenses | $11.29B | $-5.85B | $28.19B | $26.59B | $22.01B |
| Operating Expenses | $14.63B | $2.48B | $35.67B | $33.41B | $26.88B |
| Cost and Expenses | $38.01B | $39.22B | $35.67B | $33.41B | $26.88B |
| Interest Income | $514.00M | $532.00M | $179.00M | $64.00M | $141.00M |
| Interest Expense | $1.63B | $1.96B | $1.85B | $592.00M | $645.00M |
| Depreciation and Amortization | $5.92B | $6.29B | $6.53B | $5.11B | $4.65B |
| EBITDA | $22.31B | $20.38B | $24.76B | $35.08B | $19.66B |
| EBITDA Ratio | 41.58% | 37.71% | 44.57% | 55.25% | 44.07% |
| Operating Income | $15.65B | $14.82B | $19.93B | $29.82B | $16.83B |
| Operating Income Ratio | 29.17% | 27.43% | 35.88% | 46.96% | 37.72% |
| Total Other Income Expenses Net | $-38.00M | $-1.04B | $-1.27B | $1.02B | $-1.44B |
| Income Before Tax | $15.62B | $13.79B | $18.66B | $30.83B | $15.39B |
| Income Before Tax Ratio | 29.10% | 25.51% | 33.59% | 48.56% | 34.50% |
| Income Tax Expense | $4.04B | $3.83B | $5.59B | $8.26B | $4.99B |
| Net Income | $11.55B | $10.06B | $12.39B | $21.11B | $9.77B |
| Net Income Ratio | 21.53% | 18.61% | 22.31% | 33.25% | 21.90% |
| EPS | $7.12 | $6.20 | $7.65 | $13.03 | $6.04 |
| EPS Diluted | $7.07 | $6.16 | $7.60 | $12.95 | $6.00 |
| Weighted Average Shares Outstanding | 1.62B | 1.62B | 1.62B | 1.62B | 1.62B |
| Weighted Average Shares Outstanding Diluted | 1.63B | 1.63B | 1.63B | 1.63B | 1.63B |
| SEC Filing | Source | Source | Source | Source | Source |
| Breakdown | December 31, 2024 | June 30, 2024 | December 31, 2023 | June 30, 2023 | December 31, 2022 | June 30, 2022 | December 31, 2021 | June 30, 2021 | December 31, 2020 | June 30, 2020 | December 31, 2019 | June 30, 2019 | December 31, 2018 | June 30, 2018 | December 31, 2017 | May 31, 2017 | December 31, 2016 | June 30, 2016 | December 31, 2015 | June 30, 2015 |
|---|---|---|---|---|---|---|---|---|---|---|---|---|---|---|---|---|---|---|---|---|
| Revenue | $26.86B | $26.80B | $27.16B | $26.67B | $27.04B | $29.77B | $30.69B | $33.08B | $24.80B | $19.36B | $22.74B | $20.72B | $20.61B | $19.91B | $20.71B | $19.32B | $18.28B | $15.50B | $16.85B | $17.98B |
| Cost of Revenue | $19.39B | $18.10B | $20.25B | $18.82B | $18.98B | $17.57B | $17.94B | $15.65B | $14.12B | $12.50B | $15.03B | $13.11B | $12.86B | $13.47B | $14.33B | $12.65B | $13.32B | $13.48B | $13.92B | $14.01B |
| Gross Profit | $7.47B | $8.71B | $6.90B | $7.84B | $8.06B | $12.21B | $12.76B | $17.44B | $10.67B | $6.87B | $7.72B | $7.62B | $7.75B | $6.44B | $6.38B | $6.67B | $4.96B | $2.02B | $2.93B | $3.97B |
| Gross Profit Ratio | 27.82% | 32.48% | 25.43% | 29.41% | 29.80% | 40.99% | 41.57% | 52.71% | 43.04% | 35.46% | 33.94% | 36.76% | 37.62% | 32.35% | 30.80% | 34.51% | 27.13% | 13.05% | 17.39% | 22.10% |
| Research and Development Expenses | $398.00M | $- | $245.00M | $- | $76.00M | $- | $65.00M | $- | $45.00M | $- | $45.00M | $- | $45.00M | $- | $58.00M | $- | $60.00M | $- | $104.00M | $- |
| General and Administrative Expenses | $- | $- | $- | $- | $- | $- | $- | $- | $172.50M | $- | $- | $- | $- | $- | $- | $- | $- | $- | $- | $- |
| Selling and Marketing Expenses | $- | $- | $- | $- | $- | $- | $- | $- | $6.67B | $- | $- | $- | $- | $- | $- | $- | $- | $- | $- | $- |
| Selling General and Administrative Expenses | $711.00M | $488.00M | $829.00M | $710.00M | $1.04B | $367.00M | $931.00M | $324.00M | $690.00M | $280.00M | $680.00M | $287.00M | $1.04B | $232.00M | $270.00M | $175.00M | $230.00M | $267.00M | $333.00M | $243.00M |
| Other Expenses | $-1.03B | $-41.00M | $-5 | $- | $- | $- | $- | $- | $- | $- | $- | $- | $- | $- | $- | $- | $- | $- | $- | $- |
| Operating Expenses | $76.00M | $447.00M | $626.00M | $1.91B | $2.07B | $220.00M | $669.00M | $337.00M | $1.07B | $1.97B | $1.75B | $2.79B | $4.16B | $287.00M | $1.90B | $1.53B | $264.00M | $406.00M | $4.80B | $2.11B |
| Cost and Expenses | $19.46B | $18.54B | $20.25B | $18.82B | $18.98B | $17.57B | $17.94B | $15.65B | $14.12B | $12.50B | $15.03B | $13.11B | $17.02B | $13.76B | $16.23B | $14.19B | $13.59B | $13.88B | $18.72B | $16.11B |
| Interest Income | $-260.84M | $272.00M | $288.69M | $245.00M | $169.93M | $17.00M | $22.20M | $42.00M | $36.34M | $104.00M | $126.68M | $175.00M | $477.00M | $3.00M | $416.00M | $178.00M | $451.00M | $330.00M | $603.00M | $122.00M |
| Interest Expense | $378.16M | $603.00M | $585.31M | $656.00M | $511.89M | $263.00M | $339.13M | $265.00M | $259.27M | $344.00M | $441.86M | $439.00M | $- | $- | $- | $- | $- | $- | $- | $- |
| Depreciation and Amortization | $2.25B | $3.23B | $3.20B | $3.06B | $2.68B | $2.46B | $2.41B | $2.31B | $2.51B | $2.09B | $2.71B | $2.10B | $1.83B | $2.05B | $2.37B | $2.47B | $2.44B | $2.28B | $4.01B | $2.31B |
| EBITDA | $8.52B | $11.31B | $10.19B | $10.10B | $9.30B | $13.96B | $14.98B | $19.47B | $12.10B | $8.54B | $8.91B | $9.41B | $8.31B | $8.05B | $8.05B | $8.38B | $6.83B | $3.88B | $4.51B | $5.82B |
| EBITDA Ratio | 31.72% | 42.19% | 37.51% | 37.87% | 34.40% | 46.87% | 48.80% | 58.86% | 48.78% | 44.09% | 39.17% | 45.41% | 40.33% | 40.44% | 38.86% | 43.40% | 37.37% | 25.05% | 26.77% | 32.39% |
| Operating Income | $7.39B | $8.26B | $6.90B | $7.84B | $8.06B | $12.21B | $12.76B | $17.44B | $10.67B | $6.87B | $7.72B | $7.62B | $6.48B | $6.00B | $5.68B | $5.91B | $4.39B | $1.60B | $503.00M | $3.52B |
| Operating Income Ratio | 27.53% | 30.81% | 25.43% | 29.41% | 29.80% | 40.99% | 41.57% | 52.71% | 43.04% | 35.46% | 33.94% | 36.76% | 31.43% | 30.15% | 27.43% | 30.59% | 24.04% | 10.32% | 2.99% | 19.56% |
| Total Other Income Expenses Net | $106.00M | $-144.00M | $-346.23M | $-748.00M | $-1.72B | $-359.00M | $-347.20M | $612.00M | $-1.19B | $-1.78B | $-271.51M | $-2.64B | $4.38B | $-52.00M | $2.55B | $-1.17B | $-466.00M | $14.00M | $-2.77B | $-1.57B |
| Income Before Tax | $7.50B | $8.12B | $6.56B | $6.50B | $6.33B | $11.85B | $12.41B | $17.49B | $9.48B | $5.08B | $5.92B | $4.98B | $11.44B | $6.73B | $7.86B | $4.96B | $4.25B | $2.10B | $-2.47B | $1.75B |
| Income Before Tax Ratio | 27.93% | 30.28% | 24.15% | 24.37% | 23.42% | 39.79% | 40.44% | 52.88% | 38.25% | 26.24% | 26.02% | 24.02% | 55.49% | 33.81% | 37.95% | 25.65% | 23.22% | 13.54% | -14.67% | 9.71% |
| Income Tax Expense | $1.82B | $2.23B | $1.83B | $1.98B | $2.82B | $2.90B | $3.31B | $4.98B | $3.11B | $1.83B | $1.92B | $2.25B | $2.01B | $2.23B | $2.30B | $1.67B | $1.21B | $357.00M | $47.00M | $946.00M |
| Net Income | $5.74B | $5.81B | $4.90B | $5.12B | $3.68B | $8.91B | $8.86B | $12.31B | $6.34B | $3.32B | $3.93B | $4.13B | $9.26B | $4.38B | $5.46B | $3.31B | $2.90B | $1.71B | $-1.67B | $806.00M |
| Net Income Ratio | 21.39% | 21.67% | 18.05% | 19.19% | 13.62% | 29.92% | 28.87% | 37.22% | 25.56% | 17.13% | 17.29% | 19.93% | 44.92% | 21.99% | 26.35% | 17.11% | 15.89% | 11.05% | -9.92% | 4.48% |
| EPS | $3.54 | $3.58 | $3.02 | $3.16 | $2.27 | $5.50 | $5.48 | $7.61 | $3.92 | $2.05 | $2.43 | $2.53 | $5.41 | $2.50 | $3.05 | $1.83 | $1.60 | $0.95 | $-0.92 | $0.44 |
| EPS Diluted | $3.51 | $3.56 | $3.00 | $3.14 | $2.26 | $5.47 | $5.44 | $7.56 | $3.89 | $2.04 | $2.40 | $2.51 | $5.41 | $2.50 | $3.05 | $1.83 | $1.60 | $0.95 | $-0.92 | $0.44 |
| Weighted Average Shares Outstanding | 1.62B | 1.62B | 1.62B | 1.62B | 1.62B | 1.62B | 1.62B | 1.62B | 1.62B | 1.62B | 1.62B | 1.64B | 1.71B | 1.75B | 1.79B | 1.81B | 1.81B | 1.81B | 1.81B | 1.85B |
| Weighted Average Shares Outstanding Diluted | 1.63B | 1.63B | 1.63B | 1.63B | 1.63B | 1.63B | 1.63B | 1.63B | 1.63B | 1.63B | 1.64B | 1.65B | 1.71B | 1.75B | 1.79B | 1.81B | 1.81B | 1.81B | 1.81B | 1.85B |
| SEC Filing | Source | Source | Source | Source | Source | Source | Source | Source | Source | Source | Source | Source | Source | Source | Source | Source | Source | Source | Source | Source |
Annual Balance Sheet
| Breakdown | December 31, 2024 | December 31, 2023 | December 31, 2022 | December 31, 2021 | December 31, 2020 |
|---|---|---|---|---|---|
| Cash and Cash Equivalents | $6.83B | $9.67B | $6.78B | $12.81B | $10.38B |
| Short Term Investments | $370.00M | $1.08B | $2.16B | $2.54B | $2.85B |
| Cash and Short Term Investments | $7.20B | $10.79B | $8.94B | $15.35B | $13.23B |
| Net Receivables | $3.42B | $2.46B | $3.37B | $3.12B | $3.40B |
| Inventory | $5.86B | $6.66B | $6.21B | $5.44B | $3.92B |
| Other Current Assets | $2.64B | $1.64B | $1.67B | $1.47B | $1.29B |
| Total Current Assets | $19.12B | $21.51B | $18.97B | $24.43B | $20.86B |
| Property Plant Equipment Net | $69.14B | $66.47B | $64.73B | $64.93B | $62.88B |
| Goodwill | $727.00M | $797.00M | $826.00M | $879.00M | $946.00M |
| Intangible Assets | $2.24B | $2.41B | $3.65B | $2.83B | $2.75B |
| Goodwill and Intangible Assets | $2.97B | $3.21B | $4.47B | $3.71B | $3.70B |
| Long Term Investments | $4.99B | $4.79B | $1.54B | $1.49B | $1.74B |
| Tax Assets | $4.02B | $3.62B | $2.77B | $3.38B | $3.38B |
| Other Non-Current Assets | $2.56B | $3.95B | $4.26B | $4.96B | $4.83B |
| Total Non-Current Assets | $83.67B | $82.04B | $77.77B | $78.46B | $76.53B |
| Other Assets | $- | $- | $- | $- | $- |
| Total Assets | $102.79B | $103.55B | $96.74B | $102.90B | $97.39B |
| Account Payables | $3.20B | $3.27B | $3.27B | $3.41B | $3.12B |
| Short Term Debt | $534.00M | $1.17B | $1.22B | $1.14B | $584.00M |
| Tax Payables | $1.21B | $1.41B | $223.00M | $1.41B | $1.85B |
| Deferred Revenue | $- | $280.00M | $333.00M | $399.00M | $344.00M |
| Other Current Liabilities | $6.81B | $6.62B | $6.90B | $6.28B | $5.71B |
| Total Current Liabilities | $11.74B | $12.74B | $11.60B | $12.63B | $11.61B |
| Long Term Debt | $13.32B | $13.18B | $11.06B | $12.39B | $13.25B |
| Deferred Revenue Non-Current | $118.00M | $103.00M | $114.00M | $205.00M | $204.00M |
| Deferred Tax Liabilities Non-Current | $2.63B | $2.58B | $3.60B | $3.50B | $3.24B |
| Other Non-Current Liabilities | $17.00B | $18.59B | $18.10B | $17.58B | $17.19B |
| Total Non-Current Liabilities | $33.08B | $34.47B | $32.87B | $33.68B | $33.88B |
| Other Liabilities | $- | $- | $- | $- | $- |
| Total Liabilities | $44.82B | $47.21B | $44.47B | $46.31B | $45.49B |
| Preferred Stock | $- | $- | $- | $- | $- |
| Common Stock | $3.27B | $3.58B | $3.54B | $3.78B | $3.99B |
| Retained Earnings | $42.54B | $38.35B | $34.51B | $33.34B | $26.79B |
| Accumulated Other Comprehensive Income Loss | $- | $8.33B | $7.80B | $10.00B | $11.96B |
| Other Total Stockholders Equity | $9.44B | $4.32B | $4.32B | $4.32B | $4.31B |
| Total Stockholders Equity | $55.25B | $54.59B | $50.17B | $51.43B | $47.05B |
| Total Equity | $57.97B | $56.34B | $52.27B | $56.59B | $51.90B |
| Total Liabilities and Stockholders Equity | $102.79B | $103.55B | $96.74B | $102.90B | $97.39B |
| Minority Interest | $2.72B | $1.75B | $2.10B | $5.16B | $4.85B |
| Total Liabilities and Total Equity | $102.79B | $103.55B | $96.74B | $102.90B | $97.39B |
| Total Investments | $5.36B | $4.79B | $3.70B | $4.03B | $4.59B |
| Total Debt | $13.86B | $14.35B | $12.27B | $13.53B | $14.02B |
| Net Debt | $7.03B | $4.68B | $5.50B | $724.00M | $3.63B |
Balance Sheet Charts
| Breakdown | December 31, 2024 | June 30, 2024 | December 31, 2023 | June 30, 2023 | December 31, 2022 | June 30, 2022 | December 31, 2021 | June 30, 2021 | December 31, 2020 | June 30, 2020 | December 31, 2019 | June 30, 2019 | December 31, 2018 | June 30, 2018 | December 31, 2017 | May 31, 2017 | December 31, 2016 | June 30, 2016 | December 31, 2015 | June 30, 2015 |
|---|---|---|---|---|---|---|---|---|---|---|---|---|---|---|---|---|---|---|---|---|
| Cash and Cash Equivalents | $6.83B | $9.26B | $8.70B | $9.18B | $6.78B | $11.41B | $12.81B | $14.03B | $10.38B | $6.27B | $8.03B | $6.86B | $9.50B | $5.99B | $9.17B | $7.75B | $6.79B | $8.25B | $8.14B | $11.16B |
| Short Term Investments | $370.00M | $569.00M | $1.08B | $1.33B | $2.16B | $2.50B | $2.54B | $2.91B | $2.85B | $2.68B | $2.67B | $2.76B | $2.60B | $2.15B | $1.05B | $353.00M | $335.00M | $134.00M | $104.00M | $387.00M |
| Cash and Short Term Investments | $7.20B | $9.82B | $9.78B | $10.51B | $8.94B | $13.91B | $15.35B | $16.94B | $13.23B | $8.95B | $10.70B | $9.62B | $12.10B | $8.13B | $10.23B | $8.10B | $7.13B | $8.38B | $8.24B | $11.55B |
| Net Receivables | $3.42B | $3.88B | $3.47B | $3.85B | $3.37B | $3.65B | $3.12B | $4.32B | $3.40B | $2.45B | $2.92B | $3.13B | $3.07B | $2.84B | $3.29B | $2.90B | $3.29B | $2.05B | $1.39B | $2.80B |
| Inventory | $5.86B | $6.52B | $6.66B | $6.42B | $6.21B | $5.80B | $5.44B | $4.45B | $3.92B | $3.62B | $3.46B | $3.58B | $3.45B | $3.54B | $3.47B | $3.33B | $2.94B | $3.13B | $3.17B | $3.92B |
| Other Current Assets | $2.64B | $196.00M | $1.64B | $- | $1.67B | $60.00M | $1.47B | $55.00M | $1.29B | $133.00M | $1.05B | $534.00M | $1.86B | $3.11B | $1.75B | $1.22B | $1.30B | $287.00M | $1.52B | $82.00M |
| Total Current Assets | $19.12B | $20.42B | $21.51B | $20.78B | $18.97B | $23.42B | $24.43B | $25.77B | $20.86B | $15.15B | $17.30B | $16.86B | $20.90B | $17.63B | $19.17B | $15.55B | $15.09B | $13.85B | $15.55B | $18.36B |
| Property Plant Equipment Net | $69.14B | $66.58B | $68.45B | $63.10B | $64.73B | $64.38B | $64.93B | $63.84B | $62.88B | $55.84B | $57.37B | $56.35B | $56.59B | $57.74B | $62.49B | $60.32B | $59.57B | $60.97B | $61.76B | $65.41B |
| Goodwill | $727.00M | $785.00M | $797.00M | $776.00M | $826.00M | $849.00M | $879.00M | $945.00M | $946.00M | $821.00M | $922.00M | $919.00M | $912.00M | $953.00M | $1.04B | $1.00B | $951.00M | $922.00M | $892.00M | $1.15B |
| Intangible Assets | $2.24B | $3.77B | $2.41B | $3.70B | $3.65B | $3.61B | $2.83B | $2.81B | $2.75B | $2.50B | $2.64B | $2.65B | $2.55B | $3.00B | $2.73B | $2.99B | $2.57B | $3.43B | $2.63B | $5.58B |
| Goodwill and Intangible Assets | $2.97B | $4.56B | $3.21B | $4.47B | $4.47B | $4.46B | $3.71B | $3.75B | $3.70B | $3.32B | $3.56B | $3.56B | $3.46B | $3.95B | $3.76B | $3.99B | $3.52B | $4.35B | $3.52B | $6.73B |
| Long Term Investments | $4.99B | $5.03B | $3.71B | $2.65B | $1.54B | $1.37B | $1.34B | $1.43B | $1.38B | $2.21B | $1.65B | $2.36B | $2.00B | $2.95B | $3.66B | $5.14B | $4.96B | $6.09B | $5.10B | $5.41B |
| Tax Assets | $4.02B | $- | $3.62B | $3.08B | $2.77B | $3.41B | $3.38B | $3.40B | $3.38B | $3.17B | $3.10B | $3.14B | $3.14B | $3.30B | $3.40B | $3.76B | $3.73B | $3.49B | $3.31B | $3.23B |
| Other Non-Current Assets | $2.56B | $5.30B | $3.05B | $3.47B | $4.26B | $4.88B | $5.11B | $5.25B | $5.18B | $4.84B | $4.82B | $4.47B | $4.86B | $4.01B | $3.25B | $2.10B | $2.40B | $1.64B | $2.32B | $2.16B |
| Total Non-Current Assets | $83.67B | $81.47B | $82.04B | $76.78B | $77.77B | $78.49B | $78.46B | $77.68B | $76.53B | $69.38B | $70.50B | $69.89B | $70.05B | $71.96B | $76.55B | $75.30B | $74.18B | $76.53B | $76.01B | $82.95B |
| Other Assets | $- | $- | $- | $- | $- | $- | $- | $- | $- | $- | $- | $- | $- | $- | $- | $- | $- | $- | $- | $- |
| Total Assets | $102.79B | $101.89B | $103.55B | $97.56B | $96.74B | $101.91B | $102.90B | $103.44B | $97.39B | $84.53B | $87.80B | $86.75B | $90.95B | $89.59B | $95.73B | $90.85B | $89.26B | $90.39B | $91.56B | $101.30B |
| Account Payables | $3.21B | $7.69B | $3.27B | $7.63B | $3.27B | $7.99B | $3.41B | $7.52B | $3.12B | $6.19B | $2.85B | $6.38B | $3.18B | $6.41B | $3.25B | $5.96B | $2.79B | $5.56B | $2.57B | $6.03B |
| Short Term Debt | $534.00M | $1.10B | $1.17B | $474.00M | $1.22B | $1.41B | $1.14B | $- | $584.00M | $588.00M | $1.02B | $2.26B | $312.00M | $710.00M | $552.00M | $742.00M | $717.00M | $1.07B | $2.25B | $4.42B |
| Tax Payables | $1.21B | $227.00M | $1.41B | $204.00M | $223.00M | $1.04B | $1.41B | $2.02B | $1.85B | $1.08B | $1.87B | $1.42B | $2.33B | $1.67B | $2.48B | $1.27B | $1.28B | $187.00M | $480.00M | $307.00M |
| Deferred Revenue | $- | $227.00M | $- | $- | $- | $- | $-4.32B | $-704.00M | $-4.55B | $-645.00M | $-5.00B | $-2.00B | $7.37B | $-710.00M | $7.54B | $-742.00M | $5.89B | $-1.07B | $5.33B | $-4.42B |
| Other Current Liabilities | $6.79B | $3.02B | $6.90B | $2.14B | $6.90B | $2.67B | $6.67B | $2.54B | $6.05B | $1.54B | $5.37B | $1.01B | $5.04B | $1.86B | $5.07B | $2.00B | $4.62B | $1.28B | $4.86B | $1.30B |
| Total Current Liabilities | $11.74B | $12.03B | $12.74B | $10.45B | $11.60B | $13.11B | $12.63B | $12.08B | $11.61B | $9.40B | $11.12B | $11.07B | $10.87B | $10.65B | $11.35B | $9.97B | $9.40B | $8.10B | $10.16B | $12.06B |
| Long Term Debt | $13.32B | $13.20B | $13.18B | $13.60B | $11.06B | $13.25B | $12.39B | $13.21B | $13.25B | $14.65B | $13.09B | $14.26B | $12.44B | $13.02B | $14.62B | $15.11B | $16.91B | $20.80B | $21.09B | $20.94B |
| Deferred Revenue Non-Current | $118.00M | $- | $103.00M | $- | $114.00M | $- | $205.00M | $- | $204.00M | $-13.47B | $214.00M | $-13.32B | $252.00M | $-13.02B | $331.00M | $-15.11B | $325.00M | $-20.80B | $98.00M | $-20.94B |
| Deferred Tax Liabilities Non-Current | $2.63B | $2.44B | $2.58B | $3.08B | $3.60B | $3.73B | $3.50B | $3.50B | $3.24B | $2.90B | $3.22B | $3.52B | $3.67B | $3.81B | $3.63B | $3.17B | $3.12B | $2.96B | $3.29B | $3.60B |
| Other Non-Current Liabilities | $17.00B | $17.05B | $18.59B | $17.07B | $18.53B | $14.72B | $17.58B | $16.48B | $17.19B | $13.92B | $14.91B | $13.60B | $13.90B | $13.49B | $18.64B | $13.78B | $17.22B | $17.43B | $16.19B | $17.66B |
| Total Non-Current Liabilities | $33.08B | $32.69B | $34.47B | $33.75B | $32.87B | $31.70B | $33.68B | $33.20B | $33.88B | $31.47B | $31.43B | $31.39B | $30.26B | $30.32B | $33.26B | $32.05B | $34.13B | $38.23B | $37.28B | $38.61B |
| Other Liabilities | $- | $- | $- | $- | $- | $- | $- | $- | $- | $- | $- | $- | $- | $- | $- | $- | $- | $- | $- | $- |
| Total Liabilities | $44.82B | $44.72B | $47.21B | $44.20B | $44.47B | $44.81B | $46.31B | $45.27B | $45.49B | $40.87B | $42.56B | $42.45B | $41.13B | $40.98B | $44.61B | $42.03B | $43.53B | $46.33B | $47.44B | $50.67B |
| Preferred Stock | $- | $- | $- | $- | $- | $- | $- | $- | $- | $- | $- | $- | $- | $- | $- | $- | $- | $- | $- | $- |
| Common Stock | $3.27B | $3.48B | $3.58B | $3.47B | $3.54B | $3.59B | $3.78B | $3.91B | $3.99B | $3.58B | $3.65B | $3.65B | $3.69B | $4.12B | $4.36B | $4.38B | $4.14B | $4.25B | $4.17B | $4.39B |
| Retained Earnings | $42.54B | $40.15B | $38.35B | $36.43B | $34.51B | $34.08B | $33.34B | $33.24B | $26.79B | $22.96B | $23.39B | $22.67B | $27.02B | $23.75B | $23.76B | $22.36B | $21.63B | $18.94B | $19.74B | $23.90B |
| Accumulated Other Comprehensive Income Loss | $- | $7.29B | $8.33B | $7.40B | $7.80B | $8.56B | $10.00B | $11.51B | $11.96B | $8.37B | $-58.11B | $8.92B | $-50.05B | $10.14B | $-56.06B | $11.24B | $-50.86B | $10.00B | $-47.39B | $10.06B |
| Other Total Stockholders Equity | $9.44B | $4.32B | $4.32B | $4.32B | $4.32B | $4.32B | $4.32B | $4.32B | $4.31B | $4.31B | $4.31B | $4.31B | $4.31B | $4.31B | $4.31B | $4.30B | $4.30B | $4.30B | $4.30B | $4.30B |
| Total Stockholders Equity | $55.25B | $55.25B | $54.59B | $51.62B | $50.17B | $50.56B | $51.43B | $52.98B | $47.05B | $39.22B | $40.53B | $39.56B | $43.69B | $42.33B | $44.71B | $42.29B | $39.29B | $37.49B | $37.35B | $42.65B |
| Total Equity | $57.97B | $57.16B | $56.34B | $53.36B | $52.27B | $57.10B | $56.59B | $58.17B | $51.90B | $43.66B | $45.24B | $44.30B | $49.82B | $48.62B | $51.12B | $48.83B | $45.73B | $44.06B | $44.13B | $50.63B |
| Total Liabilities and Stockholders Equity | $102.79B | $101.89B | $103.55B | $97.56B | $96.74B | $101.91B | $102.90B | $103.44B | $97.39B | $84.53B | $87.80B | $86.75B | $90.95B | $89.59B | $95.73B | $90.85B | $89.26B | $90.39B | $91.56B | $101.30B |
| Minority Interest | $2.72B | $1.91B | $1.75B | $1.73B | $2.10B | $6.54B | $5.16B | $5.19B | $4.85B | $4.43B | $4.71B | $4.74B | $6.14B | $6.28B | $6.40B | $6.53B | $6.44B | $6.57B | $6.78B | $7.99B |
| Total Liabilities and Total Equity | $102.79B | $101.89B | $103.55B | $97.56B | $96.74B | $101.91B | $102.90B | $103.44B | $97.39B | $84.53B | $87.80B | $86.75B | $90.95B | $89.59B | $95.73B | $90.85B | $89.26B | $90.39B | $91.56B | $101.30B |
| Total Investments | $5.36B | $5.59B | $4.79B | $3.98B | $3.70B | $3.87B | $4.03B | $4.35B | $4.59B | $4.90B | $4.61B | $5.12B | $4.61B | $5.10B | $4.72B | $5.49B | $5.29B | $6.22B | $5.20B | $5.80B |
| Total Debt | $13.86B | $14.30B | $14.35B | $14.08B | $12.27B | $13.75B | $13.53B | $13.91B | $14.02B | $14.12B | $14.71B | $15.32B | $12.75B | $13.73B | $15.18B | $15.85B | $17.63B | $21.87B | $23.06B | $25.36B |
| Net Debt | $7.03B | $5.04B | $5.65B | $4.90B | $5.50B | $2.33B | $724.00M | $-113.00M | $3.63B | $7.85B | $6.69B | $8.46B | $3.25B | $7.74B | $6.00B | $8.10B | $10.84B | $13.62B | $14.93B | $14.20B |
Annual Cash Flow
| Breakdown | December 31, 2024 | December 31, 2023 | December 31, 2022 | December 31, 2021 | December 31, 2020 |
|---|---|---|---|---|---|
| Net Income | $11.55B | $9.95B | $13.08B | $22.57B | $10.40B |
| Depreciation and Amortization | $5.92B | $5.33B | $5.01B | $4.70B | $4.28B |
| Deferred Income Tax | $- | $- | $735.00M | $114.00M | $-178.00M |
| Stock Based Compensation | $- | $- | $122.00M | $126.00M | $138.00M |
| Change in Working Capital | $57.00M | $-926.00M | $-465.00M | $-1.08B | $-285.00M |
| Accounts Receivables | $-202.00M | $-418.00M | $20.00M | $-367.00M | $-562.00M |
| Inventory | $205.00M | $-422.00M | $-1.19B | $-1.40B | $-281.00M |
| Accounts Payables | $- | $-86.00M | $700.00M | $685.00M | $558.00M |
| Other Working Capital | $54.00M | $- | $-1.24B | $-480.00M | $-25.00M |
| Other Non Cash Items | $-1.93B | $799.00M | $-2.34B | $-1.09B | $1.52B |
| Net Cash Provided by Operating Activities | $15.60B | $15.16B | $16.13B | $25.34B | $15.88B |
| Investments in Property Plant and Equipment | $-9.62B | $-7.09B | $-6.75B | $-7.38B | $-6.19B |
| Acquisitions Net | $-703.00M | $-978.00M | $-845.00M | $10.00M | $-33.00M |
| Purchases of Investments | $-113.00M | $-183.00M | $-55.00M | $-45.00M | $-5.00M |
| Sales Maturities of Investments | $677.00M | $1.22B | $892.00M | $114.00M | $63.00M |
| Other Investing Activities | $166.00M | $65.00M | $51.00M | $146.00M | $-392.00M |
| Net Cash Used for Investing Activities | $-9.59B | $-6.96B | $-6.71B | $-7.16B | $-6.56B |
| Debt Repayment | $-599.00M | $1.52B | $-843.00M | $-577.00M | $-596.00M |
| Common Stock Issued | $- | $- | $- | $- | $- |
| Common Stock Repurchased | $- | $- | $- | $- | $-208.00M |
| Dividends Paid | $-7.03B | $-6.47B | $-11.73B | $-15.36B | $-6.13B |
| Other Financing Activities | $530.00M | $-330.00M | $-2.90B | $72.00M | $-194.00M |
| Net Cash Used Provided by Financing Activities | $-7.09B | $-5.28B | $-15.47B | $-15.86B | $-7.13B |
| Effect of Forex Changes on Cash | $-99.00M | $-23.00M | $15.00M | $100.00M | $165.00M |
| Net Change in Cash | $-1.19B | $2.90B | $-6.03B | $2.42B | $2.35B |
| Cash at End of Period | $8.48B | $9.67B | $6.77B | $12.80B | $10.38B |
| Cash at Beginning of Period | $9.67B | $6.77B | $12.80B | $10.38B | $8.03B |
| Operating Cash Flow | $15.60B | $15.16B | $16.13B | $25.34B | $15.88B |
| Capital Expenditure | $-9.62B | $-7.09B | $-6.75B | $-7.38B | $-6.19B |
| Free Cash Flow | $5.98B | $8.07B | $9.38B | $17.96B | $9.69B |
Cash Flow Charts
| Breakdown | December 31, 2024 | June 30, 2024 | December 31, 2023 | June 30, 2023 | December 31, 2022 | June 30, 2022 | December 31, 2021 | June 30, 2021 | December 31, 2020 | June 30, 2020 | December 31, 2019 | June 30, 2019 | December 31, 2018 | June 30, 2018 | December 31, 2017 | May 31, 2017 | December 31, 2016 | June 30, 2016 | December 31, 2015 | June 30, 2015 |
|---|---|---|---|---|---|---|---|---|---|---|---|---|---|---|---|---|---|---|---|---|
| Net Income | $5.74B | $5.81B | $4.90B | $5.12B | $3.68B | $8.91B | $8.86B | $12.31B | $6.34B | $3.32B | $3.93B | $4.13B | $9.26B | $4.38B | $5.46B | $3.31B | $2.90B | $1.71B | $-1.67B | $806.00M |
| Depreciation and Amortization | $3.13B | $2.82B | $3.20B | $3.06B | $2.68B | $2.46B | $2.41B | $2.31B | $2.51B | $2.09B | $2.71B | $2.10B | $1.83B | $2.05B | $2.37B | $2.47B | $2.44B | $2.28B | $4.01B | $2.31B |
| Deferred Income Tax | $- | $- | $-1.25B | $- | $770.98M | $- | $115.06M | $- | $-174.81M | $- | $-292.88M | $- | $560.00M | $- | $709.00M | $-187.00M | $1.04B | $-661.00M | $-997.00M | $-1.06B |
| Stock Based Compensation | $172.00M | $- | $144.00M | $- | $122.00M | $- | $126.00M | $- | $138.00M | $- | $126.00M | $- | $122.00M | $- | $44.00M | $54.00M | $61.00M | $64.00M | $66.00M | $62.00M |
| Change in Working Capital | $-18.00M | $-101.00M | $8.36M | $-927.00M | $-44.76M | $-443.00M | $244.96M | $-1.33B | $-236.89M | $-43.00M | $372.00M | $-372.00M | $-682.00M | $-326.00M | $-753.00M | $133.00M | $-1.10B | $597.00M | $931.00M | $999.00M |
| Accounts Receivables | $-309.00M | $107.00M | $-408.68M | $-6.00M | $148.98M | $-128.00M | $595.59M | $-966.00M | $-1.06B | $508.00M | $113.19M | $52.00M | $-558.00M | $137.00M | $-602.00M | $464.00M | $-1.27B | $478.00M | $534.00M | $870.00M |
| Inventory | $246.00M | $-41.00M | $-125.65M | $-293.00M | $-661.01M | $-582.00M | $-892.00M | $-518.00M | $13.03M | $-289.00M | $51.38M | $-23.00M | $-124.00M | $-463.00M | $-151.00M | $-331.00M | $173.00M | $119.00M | $397.00M | $129.00M |
| Accounts Payables | $- | $-751.00M | $542.68M | $-628.00M | $467.27M | $267.00M | $441.37M | $250.00M | $810.00M | $-262.00M | $207.43M | $-401.00M | $- | $- | $- | $- | $- | $- | $- | $- |
| Other Working Capital | $45.00M | $584.00M | $-112.00M | $-116.00M | $-865.00M | $-377.00M | $100.00M | $-100.00M | $-25.00M | $- | $2 | $- | $- | $- | $- | $- | $- | $- | $- | $- |
| Other Non Cash Items | $-490.00M | $-1.47B | $8.01B | $6.82B | $5.16B | $4.95B | $5.66B | $6.63B | $7.24B | $4.71B | $7.37B | $5.16B | $-3.94B | $-875.00M | $462.00M | $340.00M | $921.00M | $-1.42B | $1.62B | $261.00M |
| Net Cash Provided by Operating Activities | $8.54B | $7.06B | $8.48B | $7.02B | $6.85B | $10.52B | $12.61B | $14.07B | $10.42B | $5.84B | $9.05B | $6.45B | $6.59B | $5.23B | $7.58B | $6.31B | $5.22B | $3.24B | $4.95B | $4.43B |
| Investments in Property Plant and Equipment | $-5.60B | $-4.02B | $-4.03B | $-3.00B | $-3.93B | $-3.15B | $-4.12B | $-3.34B | $-3.39B | $-2.69B | $-3.17B | $-2.39B | $-3.07B | $-2.36B | $-2.72B | $-1.76B | $-1.69B | $-1.32B | $-2.21B | $-2.47B |
| Acquisitions Net | $-346.00M | $- | $-771.19M | $46.00M | $-3.85B | $23.00M | $68.22M | $64.00M | $63.70M | $117.00M | $-35.06M | $106.00M | $- | $-5.00M | $- | $- | $- | $- | $-3.00M | $- |
| Purchases of Investments | $- | $-89.00M | $-62.55M | $-119.00M | $802.64M | $-939.00M | $-27.42M | $-18.00M | $-13.14M | $-34.00M | $-18.02M | $-59.00M | $- | $- | $- | $- | $- | $- | $- | $- |
| Sales Maturities of Investments | $- | $- | $348.31M | $862.00M | $883.67M | $52.00M | $77.12M | $44.00M | $-25.13M | $87.00M | $77.12M | $7.00M | $- | $- | $- | $- | $- | $- | $- | $- |
| Other Investing Activities | $-101.00M | $563.00M | $-101.30M | $14.00M | $43.50M | $10.00M | $118.79M | $-33.00M | $-96.17M | $-333.00M | $6.15M | $5.00M | $7.39B | $-634.00M | $1.88B | $231.00M | $227.00M | $681.00M | $32.00M | $56.00M |
| Net Cash Used for Investing Activities | $-6.05B | $-3.54B | $-4.62B | $-2.20B | $-6.05B | $-4.00B | $-3.88B | $-3.28B | $-3.46B | $-2.86B | $-3.14B | $-2.33B | $4.32B | $-3.00B | $-846.00M | $-1.53B | $-1.47B | $-637.00M | $-2.18B | $-2.42B |
| Debt Repayment | $- | $-226.00M | $-75.10M | $1.37B | $-424.96M | $-250.00M | $-101.04M | $-290.00M | $-30.32M | $-709.00M | $-167.65M | $-93.00M | $- | $-2.07B | $- | $-2.59B | $- | $-1.91B | $- | $-42.00M |
| Common Stock Issued | $- | $- | $- | $- | $- | $- | $- | $- | $-164.20M | $-154.00M | $-183.23M | $-136.00M | $- | $3.59B | $- | $2.85B | $- | $- | $- | $2.36B |
| Common Stock Repurchased | $- | $- | $- | $- | $- | $- | $- | $- | $3.73M | $-208.00M | $-584.86M | $-988.00M | $-3.88B | $-1.50B | $-1.83B | $-252.00M | $- | $- | $-1.01B | $-1.02B |
| Dividends Paid | $-2.90B | $-4.12B | $-2.73B | $-3.69B | $-4.71B | $-7.59B | $-9.06B | $-6.43B | $-2.42B | $-3.61B | $-3.63B | $-6.84B | $-2.18B | $-3.18B | $-2.00B | $-2.25B | $-809.00M | $-1.92B | $-1.91B | $-2.16B |
| Other Financing Activities | $-289.00M | $446.00M | $-568.55M | $-46.00M | $-640.29M | $-40.00M | $-884.42M | $-401.00M | $-505.41M | $-215.00M | $44.41M | $-57.00M | $-128.00M | $-7.00M | $-199.65M | $-69.00M | $-2.96B | $106.00M | $-1.58B | $58.00M |
| Net Cash Used Provided by Financing Activities | $-3.19B | $-3.90B | $-3.42B | $-2.36B | $-5.77B | $-7.88B | $-10.05B | $-7.13B | $-3.06B | $-4.74B | $-4.89B | $-7.98B | $-6.19B | $-6.76B | $-3.99B | $-5.16B | $-3.77B | $-3.72B | $-4.50B | $-3.17B |
| Effect of Forex Changes on Cash | $-69.00M | $-30.00M | $36.00M | $-59.00M | $41.00M | $-26.00M | $121.00M | $-21.00M | $186.00M | $-21.00M | $-20.00M | $-34.00M | $171.00M | $-20.00M | $15.00M | $-27.00M | $-36.00M | $1.00M | $-69.00M | $-90.00M |
| Net Change in Cash | $-9.25B | $9.25B | $494.00M | $2.40B | $-4.64B | $-1.40B | $-1.22B | $3.65B | $4.11B | $-1.76B | $1.04B | $-3.90B | $4.89B | $-4.55B | $2.76B | $-403.00M | $-45.00M | $-1.12B | $-1.81B | $-1.24B |
| Cash at End of Period | $- | $9.25B | $9.67B | $9.18B | $6.78B | $11.41B | $12.81B | $14.03B | $10.38B | $6.27B | $8.03B | $6.86B | $10.89B | $5.99B | $10.55B | $7.79B | $8.19B | $8.23B | $9.35B | $11.16B |
| Cash at Beginning of Period | $9.25B | $- | $9.18B | $6.78B | $11.41B | $12.81B | $14.03B | $10.38B | $6.27B | $8.03B | $6.99B | $10.76B | $5.99B | $10.55B | $7.79B | $8.19B | $8.23B | $9.35B | $11.16B | $12.40B |
| Operating Cash Flow | $8.54B | $7.06B | $8.48B | $7.02B | $6.85B | $10.52B | $12.61B | $14.07B | $10.42B | $5.84B | $9.05B | $6.45B | $6.59B | $5.23B | $7.58B | $6.31B | $5.22B | $3.24B | $4.95B | $4.43B |
| Capital Expenditure | $-5.60B | $-4.02B | $-4.03B | $-3.00B | $-3.93B | $-3.15B | $-4.12B | $-3.34B | $-3.39B | $-2.69B | $-3.17B | $-2.39B | $-3.07B | $-2.36B | $-2.72B | $-1.76B | $-1.69B | $-1.32B | $-2.21B | $-2.47B |
| Free Cash Flow | $2.94B | $3.04B | $4.45B | $4.02B | $2.92B | $7.37B | $8.50B | $10.73B | $7.03B | $3.15B | $5.88B | $4.05B | $3.53B | $2.87B | $4.85B | $4.55B | $3.53B | $1.92B | $2.74B | $1.96B |
Rio Tinto Group Dividends
Explore Rio Tinto Group's dividend history, including dividend yield, payout ratio, and historical payments.
Dividend Yield
7.32%
Dividend Payout Ratio
60.81%
Dividend Paid & Capex Coverage Ratio
0.94x
Rio Tinto Group Dividend History
| Dividend | Adjusted Dividend | Date | Record Date | Payment Date | Declaration Date |
|---|---|---|---|---|---|
| $2.25 | $2.25 | March 07, 2025 | March 07, 2025 | April 17, 2025 | February 24, 2025 |
| $1.765 | $1.765 | August 16, 2024 | August 16, 2024 | September 26, 2024 | July 31, 2024 |
| $2.575 | $2.575 | March 07, 2024 | March 08, 2024 | April 18, 2024 | February 21, 2024 |
| $1.765 | $1.765 | August 10, 2023 | August 11, 2023 | September 21, 2023 | July 26, 2023 |
| $2.245 | $2.245 | March 09, 2023 | March 10, 2023 | April 20, 2023 | February 27, 2023 |
| $2.665 | $2.665 | August 11, 2022 | August 12, 2022 | September 22, 2022 | July 27, 2022 |
| $4.785 | $4.785 | March 10, 2022 | March 11, 2022 | April 21, 2022 | February 23, 2022 |
| $5.61 | $5.605 | August 12, 2021 | August 13, 2021 | September 23, 2021 | July 29, 2021 |
| $4.02 | $4.02 | March 04, 2021 | March 05, 2021 | April 15, 2021 | February 18, 2021 |
| $1.55 | $1.55 | August 06, 2020 | August 07, 2020 | September 17, 2020 | July 29, 2020 |
| $2.31 | $2.31 | March 06, 2020 | March 09, 2020 | April 16, 2020 | February 28, 2020 |
| $2.12 | $2.12 | August 08, 2019 | August 09, 2019 | September 19, 2019 | |
| $4.23 | $4.23 | March 07, 2019 | March 08, 2019 | April 18, 2019 | March 01, 2019 |
| $1.2679 | $1.271 | August 09, 2018 | August 10, 2018 | September 20, 2018 | August 02, 2018 |
| $1.795 | $1.795 | March 01, 2018 | March 02, 2018 | April 12, 2018 | January 07, 2018 |
| $1.1 | $1.1099 | August 09, 2017 | August 11, 2017 | September 21, 2017 | August 02, 2017 |
| $1.258 | $1.258 | February 22, 2017 | February 24, 2017 | April 06, 2017 | February 09, 2017 |
| $0.45 | $0.45 | August 10, 2016 | August 12, 2016 | September 22, 2016 | August 04, 2016 |
| $1.073 | $1.073 | February 24, 2016 | February 26, 2016 | April 07, 2016 | February 11, 2016 |
| $1.069 | $1.069 | August 12, 2015 | September 10, 2015 |
Rio Tinto Group News
Read the latest news about Rio Tinto Group, including recent articles, headlines, and updates.
Rio Tinto Vs. Vale: Inventory Doesn't Lie
Since my last analysis, new tariffs announced by President Trump have added additional – and large – uncertainties to mining stocks. I expect high tariffs to disrupt global trade flows, decrease demand for basic metals, and increase operational costs for both RIO and VALE. As a reflection of these macroscopic pressures, the latest data show that both companies are experiencing elevated inventory.

Livium in advanced talks for A$1 million-plus recycling contract with Sell & Parker
Livium Ltd is in advanced negotiations to secure a new contract with national metal recycler Sell & Parker Pty Ltd that is expected to generate revenue exceeding A$1 million. The Proposed Agreement would represent approximately 15% of Livium’s total revenue for the 2024 financial year, marking a significant step forward in the company’s commercial strategy. Sell & Parker is a nationally recognised metal recycling business, employing more than 400 people across eight facilities nationwide. Aiming to diversify end-of-life battery sources Under the terms of the Proposed Agreement, Livium’s wholly owned subsidiary Envirostream Australia Pty Ltd would provide recycling services for project-related materials, with operations expected to start in late April 2025. The contract is expected to drive a substantial uplift in collection volumes through the remainder of the 2025 financial year and into the first half of FY26, with the potential for an extended partnership. While the agreement is only proposed at this stage, once executed it would deliver on Livium’s focus to secure exclusive battery recycling contracts and diversify its end-of-life battery sources. Rio Tinto Ltd delivered a mixed performance in the March quarter of 2025, with strong output from its copper and bauxite operations offset by significant weather-related disruptions in iron ore production and shipments in Western Australia. Copper production rose 16% year-on-year to 210,000 tonnes, with record monthly output at the Oyu Tolgoi underground mine in March. Rio Tinto’s lithium strategy accelerated with the completion of the Arcadium acquisition in March. The new Rio Tinto Lithium business combines Arcadium’s assets and the Rincon project, which is progressing towards commissioning. Key capital projects are advancing: Commodities generally held steady. Iron ore prices rose slightly, copper strengthened on robust demand and tight smelter capacity, while aluminium prices were mixed. Global lithium demand rose 30% year-on-year, driven by electric vehicle sales. Rio Tinto continues to target diversified, profitable growth across its portfolio while navigating short-term operational challenges and advancing its energy transition ambitions.

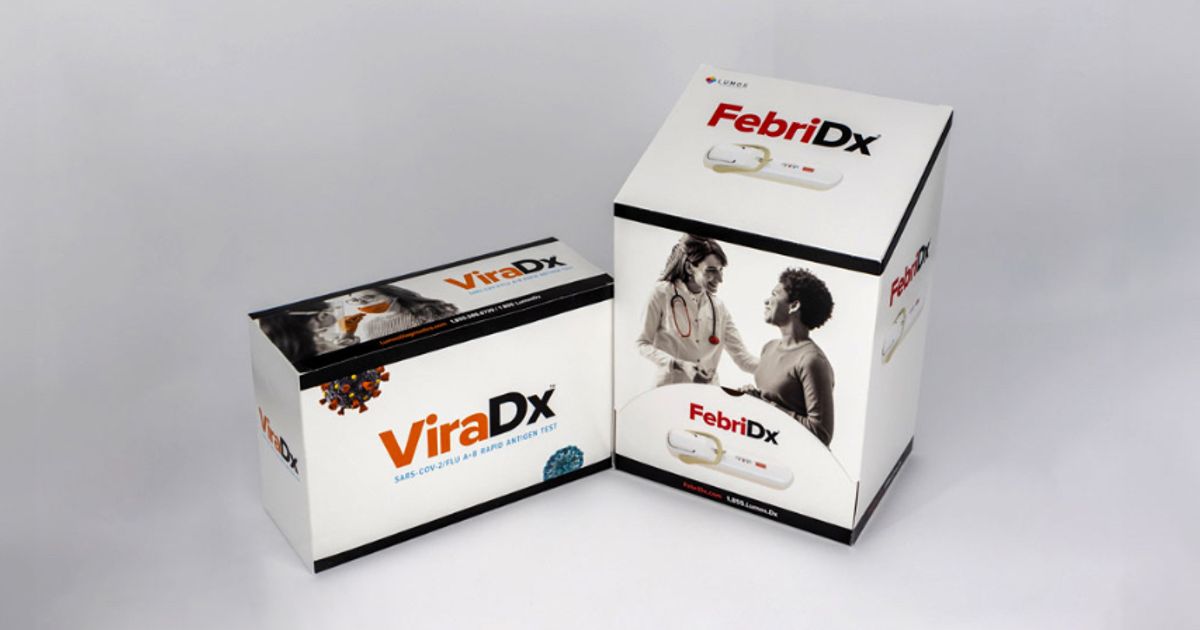
Lumos secures Medicare reimbursement for FebriDx® across key US regions
Lumos Diagnostics Holdings Ltd has achieved a significant milestone in the commercial rollout of its FebriDx® rapid diagnostic test in the United States, securing reimbursement coverage with two of the seven Medicare Administrative Contractors (MACs). The approved reimbursement rate of US$41.38 per test will take effect from April 2025. Medicare plays a critical role in the US healthcare reimbursement system, accounting for between 20% and 24% of the national payor mix. Securing MAC-level reimbursement is a key gateway to broader market access, including acceptance by private insurers who often follow Medicare’s lead. Lumos is currently in advanced negotiations with three of the remaining five MACs. The FebriDx® test, manufactured in the United States, provides rapid, point-of-care results to help clinicians differentiate between bacterial and viral causes of acute respiratory infections in approximately 10 minutes. This timely information supports antimicrobial stewardship by reducing unnecessary antibiotic prescribing. “It is extremely pleasing to achieve some early wins with two of the seven U.S. Medicare Administrative Contractors. This is an important and critical step in building the reimbursement framework to support clinical adoption for FebriDx®,” Lumos Diagnostics CEO Doug Ward said. “Manufactured proudly in the United States, FebriDx® is not only addressing a critical clinical need in primary care, urgent care, and emergency medicine, but it is also supporting American jobs and innovation in point-of-care diagnostics. Lumos looks forward to the day that FebriDx® has broad US reimbursement coverage across both public and private insurers and the team is working to deliver on that objective.” The Company continues to pursue broader reimbursement coverage across the remaining MAC regions and anticipates additional updates as discussions progress. Lumos continues to make headway in securing broad US reimbursement for its FebriDx® test, following its inclusion in the 2025 Clinical Laboratory Fee Schedule (CLFS) under Proprietary Laboratory Analyses (PLA) Code 0442U, effective 1 January 2025. The test carries a national reimbursement rate of US$41.38 per test, as set by the Centers for Medicare & Medicaid Services (CMS), confirming both its clinical utility and economic viability. As a critical first step, Lumos obtained the PLA code and associated reimbursement rate from CMS. However, actual payment to healthcare providers requires individual approval by Medicare Administrative Contractors (MACs) and private payors. Lumos has since engaged all seven MACs to drive Medicare coverage, which represents approximately 20%–24% of the US payor mix and often shapes private payor adoption. From April 2025, FebriDx® has been listed on the Medicare Fee Schedule in both the Palmetto and Novitas regions at the approved rate. Negotiations are also progressing with Noridian, WPS, and CGS MACs, with formal inclusion steps underway. To support broader coverage, Lumos is actively assisting healthcare providers with claim appeals, offering documentation on medical necessity and gathering clinician feedback. These field activities are expected to underpin adoption and reimbursement growth into 2026. Importantly, the reimbursement framework currently spans both Moderately Complex and Clinical Laboratory Improvement Amendments (CLIA)-Waived settings. A successful CLIA waiver for FebriDx® would allow seamless use across both environments without duplicating the reimbursement process. As Medicare adoption accelerates, Lumos anticipates increasing interest from private insurers, reinforcing FebriDx®’s value in supporting clinical decision-making, reducing unnecessary antibiotic use, and improving patient outcomes. Rio Tinto Ltd delivered a mixed performance in the March quarter of 2025, with strong output from its copper and bauxite operations offset by significant weather-related disruptions in iron ore production and shipments in Western Australia. Copper production rose 16% year-on-year to 210,000 tonnes, with record monthly output at the Oyu Tolgoi underground mine in March. Rio Tinto’s lithium strategy accelerated with the completion of the Arcadium acquisition in March. The new Rio Tinto Lithium business combines Arcadium’s assets and the Rincon project, which is progressing towards commissioning. Key capital projects are advancing: Commodities generally held steady. Iron ore prices rose slightly, copper strengthened on robust demand and tight smelter capacity, while aluminium prices were mixed. Global lithium demand rose 30% year-on-year, driven by electric vehicle sales. Rio Tinto continues to target diversified, profitable growth across its portfolio while navigating short-term operational challenges and advancing its energy transition ambitions.
Redfin Reports Home-Price Growth Is Losing Steam As Buyers Back Off Amid Economic Instability and High Costs
(NASDAQ: RDFN) — Nationwide, the median home-sale price rose 2.6% year over year during the four weeks ending April 13, according to a new report from Redfin (redfin.com), the technology-powered real estate brokerage. That’s roughly the same as the increases Redfin has seen over the past month, but down from 5% to 6% growth at the end of 2024 and the start of 2025. On a metro level, the median home-sale price is down from a year ago in 10 of the 50 most populous U.S. metro areas, mostly in Texas and Florida. aAdsList.push('Article'); aAdsListSize.push([300, 250]); aAdsListCA.push(null); Price growth is losing steam nationally—and prices are dropping in some metro areas—because supply is rising while demand is slow. New listings of homes for sale are up 11.2% year over year, and the total number of homes for sale is up 12.3%. Meanwhile, pending home sales declined roughly 1% from a year ago, mortgage-purchase applications are down 5% week over week, and Redfin agents in many parts of the country report that house hunters are backing off. Homebuying demand is slow for two key reasons:Record-high housing costs. The median U.S. monthly housing payment hit an all-time high of $2,819 this week due to stubbornly high mortgage rates and rising home prices, though buyers may get a bit of relief on prices in the coming months if growth continues to lose steam. Widespread economic instability. Tariffs, stock-market volatility and recession jitters are weighing heavily on consumer confidence, sending many would-be buyers to the sidelines. This sense of financial instability, along with concerns that home values could decline, is making many people think twice before making a big purchase. New listings are rising in part because some homeowners want to sell their house now before a potential economic downturn further dampens demand and possibly drives down home values. There’s also a holiday effect at play; part of the reason for the year-over-year increase in new listings is because Easter fell into the comparable period in 2024 but hasn’t occurred yet in 2025. “A lot of buyers, especially first-timers, are backing off because they’re nervous about a potential recession,” said Venus Martinez, a Redfin Premier agent in Los Angeles. “Some house hunters are hanging out on the sidelines because they’re hopeful mortgage rates will come down soon. The buyers who are still active, typically those who need to move, are picky and unwilling to pay over asking price. And those buyers have the right strategy: Many of today’s sellers are willing to negotiate the price down.” For Redfin economists’ takes on the housing market, please visit Redfin’s “From Our Economists” page. Leading indicators Indicators of homebuying demand and activity Value (if applicable) Recent change Year-over-year change Source Daily average 30-year fixed mortgage rate 6.86% (April 16) Near highest level in 2 months Down from 7.3% Mortgage News Daily Weekly average 30-year fixed mortgage rate 6.62% (week ending April 10) Lowest level since mid-December Down from 6.88% Freddie Mac Mortgage-purchase applications (seasonally adjusted) Down 5% from a week earlier (as of week ending April 11) Up 13% Mortgage Bankers Association Touring activity Up 39% from the start of the year (as of April 14) At this time last year, it was up 33% from the start of 2024 ShowingTime, a home touring technology company Google searches for “home for sale” Up 10% from a month earlier (as of April 14) Up 4% Google Trends The Redfin Homebuyer Demand Index has been excluded this week to ensure data accuracy. Key housing-market data U.S. highlights: Four weeks ending April 13, 2025 Redfin’s national metrics include data from 400+ U.S. metro areas, and are based on homes listed and/or sold during the period. Weekly housing-market data goes back through 2015. Subject to revision. Four weeks ending April 13, 2025 Year-over-year change Notes Median sale price $387,000 2.6% Median asking price $428,530 6.5% Median monthly mortgage payment $2,819 at a 6.62% mortgage rate 2.5% Record high Pending sales 87,434 -0.8% New listings 103,619 11.2% Active listings 1,008,599 12.3% Smallest increase in a year Months of supply 4.1 +0.7 pts. 4 to 5 months of supply is considered balanced, with a lower number indicating seller’s market conditions Share of homes off market in two weeks 39.4% Down from 42% Median days on market 41 +5 days Share of homes sold above list price 25.8% Down from 29% Average sale-to-list price ratio 98.7% Down from 99.1% Metro-level highlights: Four weeks ending April 13, 2025 Redfin’s metro-level data includes the 50 most populous U.S. metros. Select metros may be excluded from time to time to ensure data accuracy. Metros with biggest year-over-year increases Metros with biggest year-over-year decreases Notes Median sale price Newark, NJ (10.9%) Cleveland (10.6%) New Brunswick, NJ (9.2%) Milwaukee (9%) Philadelphia (8.3%) Jacksonville, FL (-2.8%) San Antonio (-1.8%) Montgomery County, PA (-1.7%) Oakland, CA (-1.5%) Austin, TX (-1.2%) Portland, OR (-1.1%) Dallas (-0.8%) Sacramento, CA (-0.6%) Orlando, FL (-0.4%) Fort Worth, TX (-0.2%) Declined in 10 metros Pending sales Columbus, OH (16.8%) Cincinnati (11.3%) Boston (11.1%) Indianapolis (9.5%) Montgomery County, PA (8.1%) Miami (-21.7%) Fort Lauderdale, FL (-18.6%) Houston (-12.5%) Las Vegas (-12.4%) West Palm Beach, FL (-11%) Declined in roughly half the metros New listings Washington, D.C. (28.8%) Boston (27.6%) Montgomery County, PA (26.8%) San Diego (26.6%) Pittsburgh (23.7%) Houston (-6.2%) San Antonio (-2.3%) San Jose, CA (-1.6%) Nassau County, NY (-1.3%) Declined in 4 metros To view the full report, including charts, please visit: https://www.redfin.com/news/housing-market-update-price-growth-losing-steam About Redfin Redfin (www.redfin.com) is a technology-powered real estate company. We help people find a place to live with brokerage, rentals, lending, and title insurance services. We run the country's #1 real estate brokerage site. Our customers can save thousands in fees while working with a top agent. Our home-buying customers see homes first with on-demand tours, and our lending and title services help them close quickly. Our rentals business empowers millions nationwide to find apartments and houses for rent. Since launching in 2006, we've saved customers more than $1.8 billion in commissions. We serve approximately 100 markets across the U.S. and Canada and employ over 4,000 people. Redfin’s subsidiaries and affiliated brands include: Bay Equity Home Loans®, Rent.™, Apartment Guide®, Title Forward® and WalkScore®. For more information or to contact a local Redfin real estate agent, visit www.redfin.com. To learn about housing market trends and download data, visit the Redfin Data Center. To be added to Redfin's press release distribution list, email press@redfin.com. To view Redfin's press center, click here. View source version on businesswire.com: https://www.businesswire.com/news/home/20250417013289/en/

NioCorp Developments : Elk Creek Project Featured on Fox Business Network
NioCorp's Elk Creek Project Featured on Fox Business Network Fox Business News' award-winning show "Mornings with Maria," hosted by Maria Bartiromo, interviewed NioCorp Executive Chairman and CEO Mark A. Smith today in a piece focusing on the impacts of China's recent moves to restrict exports to the U.S. and its allies of heavy rare earth elements, which NioCorp plans to produce at its Elk Creek Critical Minerals Project in Nebraska. The interview can be seen here: https://www.foxbusiness.com/video/6371563996112 aAdsList.push('Article'); aAdsListSize.push([300, 250]); aAdsListCA.push(null); AttachmentsOriginal documentPermalinkDisclaimer NioCorp Developments Ltd. published this content on April 17, 2025, and is solely responsible for the information contained herein. Distributed via Public Technologies (PUBT), unedited and unaltered, on April 17, 2025 at 12:04 UTC.

Rio Tinto and AMG Metals & Materials to assess low-carbon aluminium project in India
LONDON--(BUSINESS WIRE)--Rio Tinto and AMG Metals & Materials (AMG M&M), an energy transition solutions provider, have signed a Memorandum of Understanding (MOU) to jointly assess the feasibility of developing an integrated low-carbon aluminium project powered by renewable energy in India. AMG M&M is promoted by the two founders of Greenko and AM Green. Together, the parties will consider the potential development of up to a 1 million tonnes per annum (Mtpa) primary aluminium smelte.

Rio Tinto releases first quarter 2025 production results
MELBOURNE, Australia--(BUSINESS WIRE)--Rio Tinto Chief Executive Jakob Stausholm said: “We continued to see strong operational improvement with the Oyu Tolgoi copper mine and our bauxite operations delivering record months for production in March. Production was affected, however, by extreme weather events that impacted our Pilbara iron ore operations. “We are making excellent progress with our major projects to deliver profitable organic growth. We achieved first iron ore at Western Range in t.

Rio Tinto: Debt Before Dividend
Rio Tinto is diversifying from iron ore to copper and lithium to mitigate risks and capitalize on electrification, but this requires significant capital and increased debt. Iron ore's diminishing returns and reliance on China pose risks, leading to expected dividend reductions to service debt and fund diversification. I will hold Rio Tinto stock long-term, but won't reinvest dividends now, anticipating further stock price decline and lower dividends amidst diversification efforts.
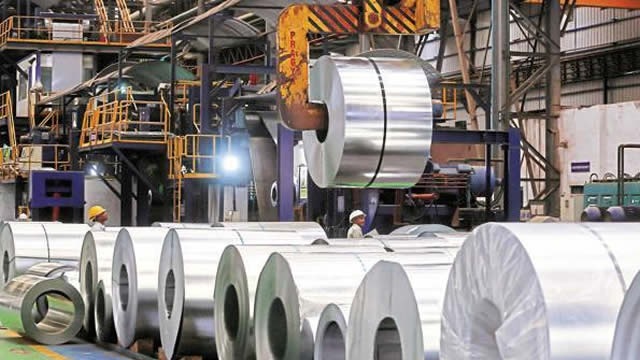
Rio Tinto increases Australian supplier spend to A$17.7 billion
MELBOURNE, Australia--(BUSINESS WIRE)--Rio Tinto strengthened its spend with Australian businesses to over A$17.7 billion in 2024, supporting both national and local suppliers. This is an increase of 9.9% from the previous year and was spent with more than 6,000 suppliers across the country. This spend has helped boost local, regional, and national economies, contributing to employment and strengthening Australian owned and managed businesses. As part of this spend, more than A$926 million was.

Best Gold Stocks in 2025
Markets are off to a rocky start in 2025, with U.S. stocks entering a quick correction following an all-time high in February. The S&P 500 is lagging behind international equities to a degree not seen in years, and consumer surveys are showing souring sentiment amidst sticky inflation, tariff fears, and geopolitical tension.

Construction begins on Rio Tinto's first Western Australian-made iron ore rail cars
PERTH, Australia--(BUSINESS WIRE)--Rio Tinto's first locally made iron ore rail car has been built in Western Australia, as it steps up its use of domestic manufacturing across its world class iron ore business. The company is investing about A$150 million to purchase 100 locally built rail cars, as well as continued investment in bearing refurbishment for its Pilbara operations. Its partnership with Gemco Rail and CRRC Qiqihar Rolling Stock Co. Ltd is also supported by the Western Australian g.

Copper's Surge: 3 Top Trades Before the Market Catches On
When it comes to connecting the dots across the financial markets, investors need to remember that price action in one area typically connects to the rest of the broader machine, where watching unusual moves in different asset classes can present some of the best opportunities elsewhere. Today, that is where the new all-time high price set by copper in the commodity markets will bring a big profit potential in the coming months for copper mining stocks.

Rio Tinto: Underappreciated Copper Growth
Rio Tinto has a supportive copper growth ahead, excluding M&A. China's economic activity started in 2025 with solid momentum. This will provide solid results on the iron ore EBITDA. A solid balance sheet, supportive shareholders' remuneration, and upside on critical metals make Rio Tinto a buy.
70 Graham All-Star Value (GASV) March Dividends Show 19 "Safer" Bearing 13 Ideal Dividend Dogs
The Large Cap Value and Ben Graham Formula strategies identify undervalued, stable stocks with strong fundamentals and low valuations, ideal for long-term investment. Analysts project significant gains (28.24% to 85.64%) from top-ten GASV Dogs by March 2026, based on dividend yields and target prices. Thirteen of nineteen "safer" GASV Dogs are recommended buys, offering reliable dividends and fair pricing relative to their intrinsic value.

Rio Tinto releases details of $8.4 billion of taxes and royalties paid in 2024
MELBOURNE, Australia--(BUSINESS WIRE)--Rio Tinto has published its 2024 Taxes and Royalties Paid Report, which details $8.4 billion of taxes and royalties paid globally during the year (2023: $8.5 billion). In Australia, taxes and royalties totalling $6.3 billion (A$9.5 billion) were paid in 2024, including corporate tax paid of $3.7 billion (A$5.5 billion). Rio Tinto also made significant tax and royalty payments in Chile ($615 million), Canada ($500 million), Mongolia ($482 million), and the.

JPMorgan reveals which sector to go long on in 2025
Analyst coverage is certainly one of the most important factors to consider when evaluating an investment. If a stock has suddenly garnered Wall Street's confidence, particularly after a period of underperformance, that's a pretty strong indicator that there's a solid reason as to why researchers have turned bullish.
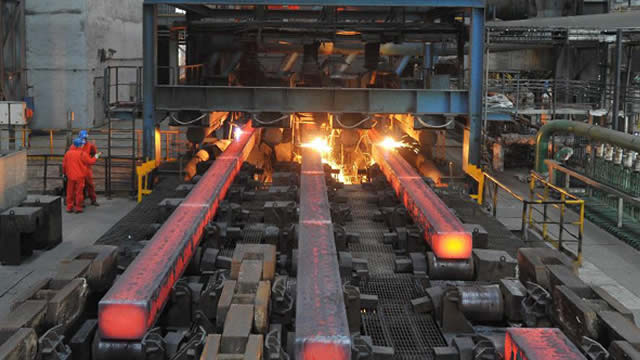
Rio Tinto one of US investment bank's top picks as it turns bullish on mining
JPMorgan has turned bullish on mining stocks, naming London-listed giants Rio Tinto, Antofagasta and Fresnillo among its top picks as it upgraded the global sector to 'overweight' for the first time in over a year. The bank's equity strategists said they expect a rebound in metals prices and mining shares in the coming months, after a long stretch of underperformance.
Palliser Capital Urges Fellow Shareholders to Vote FOR Resolution Demanding a Fully Transparent and Independent Review of Rio Tinto's Value Destructive Dual Listed Company Structure
LONDON--(BUSINESS WIRE)--Palliser Capital (“Palliser”) today published a letter to shareholders of Rio Tinto (the “Company”) calling for them to vote in favor of the long-overdue full and proper investigation into the merits of unification of Rio Tinto's dual listed company (“DLC”) structure, in line with the recommendations from leading international proxy advisors ISS and Glass Lewis. Palliser's letter to shareholders outlines the corporate governance shortcomings of Rio Tinto's cursory inter.

Rio Tinto one of the top copper picks as Wall Street bank stays bullish on the red metal
Rio Tinto Ltd (LSE:RIO, ASX:RIO, OTC:RTNTF) is one of JPMorgan's top picks in the copper sector, as the investment bank doubled down on its bullish outlook for the red metal in 2025. In a fresh research note, analysts said they expect global copper supply to fall short of demand starting next year, with the deficit widening significantly by the end of the decade.

Rio Tinto Has ‘Strong Desire' to Invest More in U.S., Copper Chief Says
The world's second-biggest miner by market value wants to increase its investment in the U.S. after President Trump signed an executive order to streamline permitting processes and boost government financing for minerals projects.
Is It Worth Investing in Rio Tinto (RIO) Based on Wall Street's Bullish Views?
Investors often turn to recommendations made by Wall Street analysts before making a Buy, Sell, or Hold decision about a stock. While media reports about rating changes by these brokerage-firm employed (or sell-side) analysts often affect a stock's price, do they really matter?
RAD's RIO Lineup Now Starlink-Compatible, Expanding Market Reach to Remote Industries
ROAMEO Up Next for Extended Off-Road Long-Distance Patrols Detroit, Michigan--(Newsfile Corp. - March 19, 2025) - Robotic Assistance Devices, Inc. (RAD), a subsidiary of Artificial Intelligence Technology Solutions, Inc. (OTC Pink: AITX), is thrilled to announce that its RIO (ROSA Independent Observatory) lineup is now fully compatible with Starlink, enabling seamless and high-speed satellite connectivity. This development significantly expands RIO's ability to operate in even the most remote and extreme environments, making it an even more valuable solution for industries such as oil and gas, mining, and other infrastructure operations in off-grid locations.

Rio Tinto says activist call to abandon London 'value destructive'
Rio Tinto Ltd's (LSE:RIO, ASX:RIO) board has called for shareholders to vote against a resolution proposed by activist Palliser Capital for the company to give up its London listing. The activist investor last year called for a committee of independent directors and an external shareholder representative to assess whether unification into an Australian-domiciled holding company would be in the best interests of shareholders.
ISS Joins Glass Lewis in Recommending Shareholders Vote FOR Palliser's Proposal at Rio Tinto's AGM
LONDON--(BUSINESS WIRE)--Palliser Capital (“Palliser”) today welcomed the endorsement of leading independent proxy advisory firm Institutional Shareholder Services (“ISS”) of its resolution at the Annual General Meeting (AGM) for Rio Tinto Plc (LSE:RIO) on April 3, 2025. This follows Glass Lewis' endorsement on 14 March 2025. ISS notes that the BHP transaction particularly sets “a precedent that is difficult to dismiss”, evidently unconvinced by Rio Tinto's explanation in its recent letter to s.

Rio Tinto boost as leading investment bank provides its seal of approval
JP Morgan has resumed coverage of Rio Tinto Ltd (LSE:RIO, ASX:RIO, OTC:RTNTF) with an upbeat assessment of the prospects for the mining major - encapsulated in its 'overweight' stance on the stock and its price target of 5,920p, implying a 20% upside. The investment bank now sees Rio as its top pick among European, Middle Eastern, and African diversified miners, citing strong growth prospects and an attractive valuation.

Similar Companies
Related Metrics
Explore detailed financial metrics and analysis for RIO.

