Republic Services Key Executives
This section highlights Republic Services's key executives, including their titles and compensation details.
Find Contacts at Republic Services
(Showing 0 of )
Republic Services Earnings
This section highlights Republic Services's earnings, including key dates, EPS, earnings reports, and earnings call transcripts.
Next Earnings Date
Last Earnings Results
Earnings Call Transcripts
| Transcript | Quarter | Year | Date | Estimated EPS | Actual EPS |
|---|---|---|---|---|---|
| Read Transcript | Q1 | 2025 | 2025-04-24 | $1.53 | $1.58 |
| Read Transcript | Q4 | 2024 | 2025-02-13 | $1.40 | $1.58 |
| Read Transcript | Q3 | 2024 | 2024-10-29 | $1.61 | $1.81 |
| Read Transcript | Q2 | 2024 | 2024-07-24 | $1.53 | $1.61 |
| Read Transcript | Q1 | 2024 | 2024-04-30 | $1.35 | $1.45 |
| Read Transcript | Q4 | 2023 | 2024-02-27 | $1.29 | $1.41 |
| Read Transcript | Q3 | 2023 | 2023-10-26 | $1.42 | $1.54 |
| Read Transcript | Q2 | 2023 | 2023-07-31 | $1.32 | $1.41 |
| Read Transcript | Q1 | 2023 | 2023-04-27 | $1.13 | $1.24 |

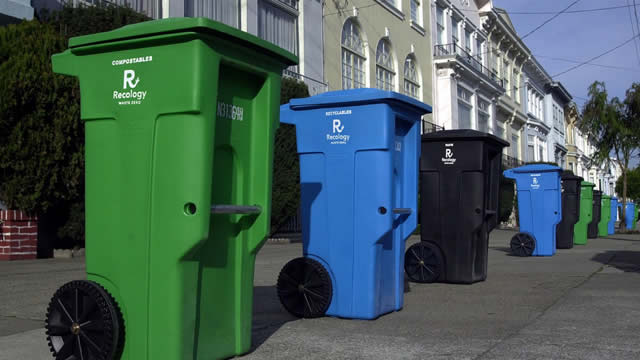
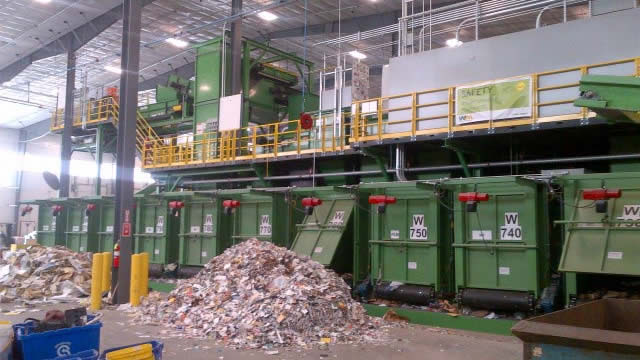
Republic Services, Inc., together with its subsidiaries, offers environmental services in the United States. The company offers collection and processing of recyclable materials, collection, transfer and disposal of non-hazardous solid waste, and other environmental solutions. Its collection services include curbside collection of material for transport to transfer stations, landfills, or recycling processing centers; supply of recycling and waste containers; and renting of compactors. In addition, the company engages in the processing and sale of old corrugated containers, old newsprint, aluminum, glass, and other materials; and provision of landfill and transfer services. Further, it offers disposal of non-hazardous solid and liquid material and in-plant services, such as transportation and logistics. It serves small-container, large-container, and residential customers. As of December 31, 2021, the company operated through 356 collection operations, 239 transfer stations, 198 active landfills, 71 recycling processing centers, 6 saltwater disposal wells, and 7 deep injection wells, as well as 3 treatment, recovery, and disposal facilities in 41 states. It also operated 77 landfill gas-to-energy and renewable energy projects and had 124 closed landfills. The company was incorporated in 1996 and is based in Phoenix, Arizona.
$246.11
Stock Price
$76.90B
Market Cap
42.00K
Employees
Phoenix, AZ
Location
Financial Statements
Access annual & quarterly financial statements for Republic Services, including income statements, balance sheets, and cash flow statements..
Annual Income Statement
| Breakdown | December 31, 2024 | December 31, 2023 | December 31, 2022 | December 31, 2021 | December 31, 2020 |
|---|---|---|---|---|---|
| Revenue | $16.03B | $14.96B | $13.51B | $11.29B | $10.15B |
| Cost of Revenue | $9.35B | $8.94B | $8.20B | $6.74B | $6.10B |
| Gross Profit | $6.68B | $6.02B | $5.31B | $4.56B | $4.05B |
| Gross Profit Ratio | 41.68% | 40.24% | 39.28% | 40.35% | 39.92% |
| Research and Development Expenses | $- | $- | $- | $- | $- |
| General and Administrative Expenses | $1.65B | $1.52B | $1.34B | $1.18B | $1.03B |
| Selling and Marketing Expenses | $- | $- | $118.50M | $- | $- |
| Selling General and Administrative Expenses | $1.65B | $1.52B | $1.34B | $1.18B | $1.03B |
| Other Expenses | $1.84B | $1.72B | $1.48B | $1.29B | $1.19B |
| Operating Expenses | $3.49B | $3.24B | $2.82B | $2.46B | $2.21B |
| Cost and Expenses | $12.84B | $12.18B | $11.02B | $9.20B | $8.31B |
| Interest Income | $9.00M | $6.50M | $3.30M | $2.50M | $5.20M |
| Interest Expense | $539.00M | $508.20M | $395.60M | $314.60M | $355.60M |
| Depreciation and Amortization | $1.78B | $1.60B | $1.44B | $1.27B | $1.16B |
| EBITDA | $4.75B | $4.32B | $3.66B | $3.38B | $3.00B |
| EBITDA Ratio | 29.66% | 28.87% | 27.08% | 29.97% | 29.55% |
| Operating Income | $3.20B | $2.78B | $2.39B | $2.08B | $1.71B |
| Operating Income Ratio | 19.94% | 18.58% | 17.70% | 18.38% | 16.83% |
| Total Other Income Expenses Net | $-764.00M | $-588.70M | $-560.20M | $-501.10M | $-566.40M |
| Income Before Tax | $2.43B | $2.19B | $1.83B | $1.58B | $1.14B |
| Income Before Tax Ratio | 15.17% | 14.64% | 13.56% | 13.95% | 11.25% |
| Income Tax Expense | $388.00M | $460.10M | $343.90M | $282.80M | $173.10M |
| Net Income | $2.04B | $1.73B | $1.49B | $1.29B | $967.20M |
| Net Income Ratio | 12.74% | 11.57% | 11.01% | 11.42% | 9.53% |
| EPS | $6.50 | $5.47 | $4.70 | $4.05 | $3.03 |
| EPS Diluted | $6.49 | $5.47 | $4.69 | $4.04 | $3.02 |
| Weighted Average Shares Outstanding | 314.40M | 316.45M | 316.53M | 318.81M | 319.28M |
| Weighted Average Shares Outstanding Diluted | 314.80M | 316.67M | 317.08M | 319.43M | 319.84M |
| SEC Filing | Source | Source | Source | Source | Source |
| Breakdown | March 31, 2025 | December 31, 2024 | September 30, 2024 | June 30, 2024 | March 31, 2024 | December 31, 2023 | September 30, 2023 | June 30, 2023 | March 31, 2023 | December 31, 2022 | September 30, 2022 | June 30, 2022 | March 31, 2022 | December 31, 2021 | September 30, 2021 | June 30, 2021 | March 31, 2021 | December 31, 2020 | September 30, 2020 | June 30, 2020 |
|---|---|---|---|---|---|---|---|---|---|---|---|---|---|---|---|---|---|---|---|---|
| Revenue | $4.01B | $4.05B | $4.08B | $4.05B | $3.86B | $3.83B | $3.83B | $3.73B | $3.58B | $3.53B | $3.60B | $3.41B | $2.97B | $2.95B | $2.93B | $2.81B | $2.60B | $2.57B | $2.57B | $2.45B |
| Cost of Revenue | $- | $2.32B | $2.82B | $2.82B | $2.28B | $2.69B | $2.28B | $2.22B | $2.17B | $2.18B | $2.19B | $2.06B | $1.76B | $1.81B | $1.74B | $1.65B | $1.53B | $1.55B | $1.54B | $1.47B |
| Gross Profit | $4.01B | $1.73B | $1.26B | $1.23B | $1.58B | $1.14B | $1.54B | $1.50B | $1.41B | $1.35B | $1.41B | $1.35B | $1.21B | $1.14B | $1.19B | $1.16B | $1.06B | $1.03B | $1.04B | $986.30M |
| Gross Profit Ratio | 100.00% | 42.73% | 30.93% | 30.28% | 40.88% | 29.77% | 40.29% | 40.30% | 39.42% | 38.20% | 39.06% | 39.53% | 40.64% | 38.71% | 40.56% | 41.31% | 40.91% | 39.87% | 40.31% | 40.18% |
| Research and Development Expenses | $- | $- | $- | $- | $- | $- | $- | $- | $- | $- | $- | $- | $- | $- | $- | $- | $- | $- | $- | $- |
| General and Administrative Expenses | $- | $439.30M | $406.00M | $395.10M | $406.70M | $407.60M | $377.00M | $373.60M | $363.80M | $369.70M | $342.90M | $330.10M | $296.40M | $314.30M | $291.80M | $308.60M | $261.10M | $251.90M | $250.00M | $249.30M |
| Selling and Marketing Expenses | $- | $- | $- | $12.50M | $- | $14.60M | $- | $- | $- | $115.20M | $- | $- | $- | $- | $- | $- | $- | $- | $- | $- |
| Selling General and Administrative Expenses | $427.00M | $439.30M | $406.00M | $407.60M | $406.70M | $422.20M | $377.00M | $373.60M | $363.80M | $369.70M | $342.90M | $330.10M | $296.40M | $314.30M | $291.80M | $308.60M | $261.10M | $251.90M | $250.00M | $249.30M |
| Other Expenses | $- | $486.00M | $- | $700.00K | $12.60M | $-4.50M | $1.30M | $-600.00K | $390.60M | $386.20M | $387.30M | $370.50M | $338.70M | $-1.10M | $-900.00K | $-300.00K | $1.80M | $400.00K | $1.90M | $2.60M |
| Operating Expenses | $427.00M | $925.30M | $406.00M | $407.60M | $839.80M | $426.70M | $802.80M | $768.20M | $754.40M | $755.90M | $730.20M | $700.60M | $635.10M | $635.30M | $621.10M | $639.50M | $568.00M | $545.70M | $547.50M | $550.20M |
| Cost and Expenses | $3.21B | $3.24B | $3.22B | $3.23B | $3.12B | $3.12B | $3.09B | $2.99B | $2.92B | $2.94B | $2.92B | $2.77B | $2.40B | $2.45B | $2.37B | $2.29B | $2.10B | $2.09B | $2.08B | $2.02B |
| Interest Income | $2.00M | $1.60M | $4.30M | $1.60M | $1.50M | $1.50M | $2.00M | $1.60M | $1.40M | $1.40M | $800.00K | $700.00K | $500.00K | $600.00K | $600.00K | $600.00K | $800.00K | $1.10M | $500.00K | $3.30M |
| Interest Expense | $-140.00M | $133.20M | $138.20M | $128.30M | $139.30M | $139.50M | $127.60M | $124.40M | $126.70M | $112.90M | $105.20M | $94.00M | $83.50M | $79.70M | $78.10M | $78.40M | $78.40M | $78.10M | $88.90M | $91.60M |
| Depreciation and Amortization | $434.00M | $362.80M | $448.70M | $439.70M | $425.80M | $426.70M | $406.90M | $382.80M | $382.80M | $372.50M | $376.70M | $360.00M | $332.10M | $319.80M | $322.10M | $323.70M | $302.60M | $288.00M | $291.40M | $289.90M |
| EBITDA | $959.00M | $1.14B | $1.23B | $1.26B | $1.16B | $1.05B | $1.14B | $1.12B | $1.04B | $848.40M | $1.05B | $932.40M | $903.50M | $659.50M | $895.00M | $862.60M | $796.70M | $567.50M | $780.60M | $724.40M |
| EBITDA Ratio | 23.92% | 28.07% | 30.21% | 31.07% | 30.16% | 27.28% | 29.88% | 29.96% | 29.04% | 24.04% | 29.22% | 27.31% | 30.43% | 22.33% | 30.51% | 30.67% | 30.68% | 22.05% | 30.35% | 29.51% |
| Operating Income | $804.00M | $803.00M | $845.90M | $818.10M | $732.80M | $714.10M | $727.80M | $707.20M | $644.10M | $577.20M | $664.30M | $589.60M | $560.60M | $501.60M | $564.20M | $517.90M | $492.40M | $432.70M | $447.90M | $395.20M |
| Operating Income Ratio | 20.05% | 19.85% | 20.75% | 20.21% | 18.98% | 18.64% | 19.02% | 18.98% | 17.99% | 16.35% | 18.46% | 17.27% | 18.88% | 16.99% | 19.23% | 18.41% | 18.96% | 16.81% | 17.41% | 16.10% |
| Total Other Income Expenses Net | $-139.00M | $-270.30M | $-199.40M | $-159.80M | $-133.90M | $-218.10M | $-121.50M | $-127.00M | $-122.00M | $-203.80M | $-156.50M | $-111.50M | $-88.40M | $-224.80M | $-93.50M | $-90.50M | $-92.30M | $-231.40M | $-129.20M | $-95.30M |
| Income Before Tax | $665.00M | $532.70M | $646.50M | $654.00M | $598.90M | $482.90M | $606.30M | $580.20M | $522.10M | $373.40M | $507.80M | $478.10M | $472.20M | $276.90M | $470.70M | $427.40M | $400.10M | $201.30M | $318.70M | $300.10M |
| Income Before Tax Ratio | 16.59% | 13.17% | 15.86% | 16.16% | 15.51% | 12.60% | 15.85% | 15.57% | 14.58% | 10.58% | 14.11% | 14.01% | 15.91% | 9.38% | 16.04% | 15.19% | 15.41% | 7.82% | 12.39% | 12.23% |
| Income Tax Expense | $170.00M | $20.20M | $80.60M | $142.10M | $145.20M | $43.20M | $126.00M | $152.60M | $138.20M | $26.40M | $90.90M | $106.30M | $120.30M | $-36.20M | $119.90M | $95.40M | $103.70M | $-35.00M | $58.50M | $73.80M |
| Net Income | $495.00M | $512.00M | $565.70M | $511.50M | $453.80M | $439.60M | $480.20M | $427.40M | $383.90M | $346.80M | $416.90M | $371.90M | $352.00M | $313.10M | $350.30M | $331.10M | $295.90M | $235.50M | $260.00M | $225.50M |
| Net Income Ratio | 12.35% | 12.65% | 13.88% | 12.64% | 11.75% | 11.47% | 12.55% | 11.47% | 10.72% | 9.83% | 11.59% | 10.89% | 11.86% | 10.60% | 11.94% | 11.77% | 11.40% | 9.15% | 10.11% | 9.19% |
| EPS | $1.58 | $1.63 | $1.80 | $1.62 | $1.44 | $1.40 | $1.52 | $1.35 | $1.21 | $1.10 | $1.32 | $1.18 | $1.11 | $0.99 | $1.10 | $1.04 | $0.93 | $0.74 | $0.81 | $0.71 |
| EPS Diluted | $1.58 | $1.63 | $1.80 | $1.62 | $1.44 | $1.39 | $1.52 | $1.35 | $1.21 | $1.09 | $1.32 | $1.17 | $1.11 | $0.98 | $1.10 | $1.03 | $0.93 | $0.74 | $0.81 | $0.71 |
| Weighted Average Shares Outstanding | 313.00M | 314.40M | 314.00M | 314.91M | 315.30M | 315.10M | 316.06M | 316.85M | 316.71M | 316.50M | 316.51M | 316.47M | 316.60M | 317.60M | 318.60M | 319.50M | 319.40M | 319.30M | 319.20M | 319.05M |
| Weighted Average Shares Outstanding Diluted | 313.00M | 314.40M | 314.37M | 315.24M | 315.70M | 315.70M | 316.56M | 317.31M | 317.14M | 317.10M | 317.00M | 317.00M | 317.20M | 318.50M | 319.40M | 320.00M | 319.80M | 319.90M | 319.70M | 319.56M |
| SEC Filing | Source | Source | Source | Source | Source | Source | Source | Source | Source | Source | Source | Source | Source | Source | Source | Source | Source | Source | Source | Source |
Annual Balance Sheet
| Breakdown | December 31, 2024 | December 31, 2023 | December 31, 2022 | December 31, 2021 | December 31, 2020 |
|---|---|---|---|---|---|
| Cash and Cash Equivalents | $74.00M | $140.00M | $143.40M | $29.00M | $38.20M |
| Short Term Investments | $208.00M | $- | $127.60M | $139.00M | $149.10M |
| Cash and Short Term Investments | $282.00M | $140.00M | $143.40M | $29.00M | $38.20M |
| Net Receivables | $1.82B | $1.99B | $1.68B | $1.27B | $1.09B |
| Inventory | $- | $97.30M | $96.60M | $72.20M | $59.10M |
| Other Current Assets | $303.00M | $150.40M | $439.90M | $101.20M | $96.20M |
| Total Current Assets | $2.41B | $2.38B | $2.36B | $1.71B | $1.52B |
| Property Plant Equipment Net | $11.88B | $11.59B | $10.74B | $9.23B | $8.73B |
| Goodwill | $15.98B | $15.83B | $14.45B | $12.83B | $12.05B |
| Intangible Assets | $546.00M | $496.20M | $347.20M | $259.50M | $173.10M |
| Goodwill and Intangible Assets | $16.53B | $16.33B | $14.80B | $13.09B | $12.22B |
| Long Term Investments | $- | $469.40M | $281.40M | $127.60M | $145.40M |
| Tax Assets | $- | $- | $1.53B | $-127.60M | $-145.40M |
| Other Non-Current Assets | $1.59B | $640.00M | $-658.30M | $926.60M | $966.50M |
| Total Non-Current Assets | $30.00B | $29.03B | $26.69B | $23.24B | $21.91B |
| Other Assets | $- | $- | $- | $- | $- |
| Total Assets | $32.40B | $31.41B | $29.05B | $24.95B | $23.43B |
| Account Payables | $1.34B | $1.41B | $1.22B | $910.00M | $779.00M |
| Short Term Debt | $917.00M | $987.10M | $513.90M | $46.40M | $201.60M |
| Tax Payables | $- | $182.90M | $168.50M | $143.70M | $132.30M |
| Deferred Revenue | $485.00M | $467.30M | $443.00M | $381.30M | $345.60M |
| Other Current Liabilities | $1.38B | $1.18B | $1.04B | $934.20M | $823.50M |
| Total Current Liabilities | $4.13B | $4.23B | $3.39B | $2.42B | $2.28B |
| Long Term Debt | $189.00M | $12.08B | $11.57B | $9.79B | $8.97B |
| Deferred Revenue Non-Current | $- | $- | $1.53B | $2.14B | $1.98B |
| Deferred Tax Liabilities Non-Current | $1.59B | $1.53B | $1.53B | $1.23B | $1.24B |
| Other Non-Current Liabilities | $15.08B | $3.03B | $2.88B | $2.54B | $2.45B |
| Total Non-Current Liabilities | $16.87B | $16.64B | $15.98B | $13.56B | $12.66B |
| Other Liabilities | $- | $- | $- | $- | $- |
| Total Liabilities | $21.00B | $20.87B | $19.36B | $15.98B | $14.95B |
| Preferred Stock | $- | $- | $- | $- | $- |
| Common Stock | $3.00M | $3.20M | $3.20M | $3.20M | $3.20M |
| Retained Earnings | $9.77B | $8.43B | $7.36B | $6.48B | $5.75B |
| Accumulated Other Comprehensive Income Loss | $-26.00M | $-12.10M | $-12.10M | $-14.60M | $-12.40M |
| Other Total Stockholders Equity | $1.65B | $2.12B | $2.34B | $2.51B | $2.74B |
| Total Stockholders Equity | $11.40B | $10.54B | $9.69B | $8.98B | $8.48B |
| Total Equity | $11.41B | $10.54B | $9.69B | $8.98B | $8.49B |
| Total Liabilities and Stockholders Equity | $32.40B | $31.41B | $29.05B | $24.95B | $23.43B |
| Minority Interest | $2.00M | $1.20M | $800.00K | $800.00K | $4.90M |
| Total Liabilities and Total Equity | $32.40B | $31.41B | $29.05B | $24.95B | $23.43B |
| Total Investments | $208.00M | $469.40M | $127.60M | $127.60M | $145.40M |
| Total Debt | $862.00M | $13.07B | $11.78B | $9.55B | $8.93B |
| Net Debt | $788.00M | $12.93B | $11.64B | $9.53B | $8.90B |
Balance Sheet Charts
| Breakdown | March 31, 2025 | December 31, 2024 | September 30, 2024 | June 30, 2024 | March 31, 2024 | December 31, 2023 | September 30, 2023 | June 30, 2023 | March 31, 2023 | December 31, 2022 | September 30, 2022 | June 30, 2022 | March 31, 2022 | December 31, 2021 | September 30, 2021 | June 30, 2021 | March 31, 2021 | December 31, 2020 | September 30, 2020 | June 30, 2020 |
|---|---|---|---|---|---|---|---|---|---|---|---|---|---|---|---|---|---|---|---|---|
| Cash and Cash Equivalents | $83.00M | $74.00M | $83.40M | $490.60M | $91.60M | $140.00M | $157.50M | $181.60M | $132.20M | $143.40M | $81.40M | $119.40M | $39.00M | $29.00M | $40.10M | $34.00M | $23.20M | $38.20M | $406.40M | $269.70M |
| Short Term Investments | $222.00M | $208.00M | $- | $178.00M | $143.30M | $163.60M | $153.30M | $149.60M | $132.70M | $127.60M | $121.70M | $121.50M | $117.20M | $139.00M | $155.60M | $151.00M | $134.60M | $149.10M | $145.20M | $142.60M |
| Cash and Short Term Investments | $305.00M | $282.00M | $83.40M | $490.60M | $91.60M | $140.00M | $157.50M | $181.60M | $132.20M | $143.40M | $81.40M | $119.40M | $39.00M | $29.00M | $40.10M | $34.00M | $23.20M | $38.20M | $406.40M | $269.70M |
| Net Receivables | $1.85B | $1.82B | $1.98B | $1.94B | $1.92B | $1.99B | $1.83B | $1.74B | $1.69B | $1.68B | $1.70B | $1.65B | $1.31B | $1.27B | $1.26B | $1.16B | $1.10B | $1.09B | $1.10B | $1.07B |
| Inventory | $- | $- | $97.70M | $99.90M | $101.40M | $97.30M | $100.00M | $96.10M | $97.90M | $96.60M | $101.10M | $100.20M | $80.50M | $72.20M | $68.20M | $63.90M | $61.10M | $59.10M | $58.80M | $58.50M |
| Other Current Assets | $162.00M | $303.00M | $190.50M | $126.60M | $161.30M | $150.40M | $261.20M | $244.00M | $324.90M | $439.90M | $163.90M | $116.00M | $103.10M | $101.20M | $118.70M | $83.40M | $99.60M | $96.20M | $109.90M | $79.40M |
| Total Current Assets | $2.32B | $2.41B | $2.35B | $2.66B | $2.27B | $2.38B | $2.35B | $2.26B | $2.24B | $2.36B | $2.20B | $2.14B | $1.70B | $1.71B | $1.57B | $1.48B | $1.44B | $1.52B | $1.77B | $1.57B |
| Property Plant Equipment Net | $11.95B | $11.88B | $11.76B | $11.68B | $11.54B | $11.59B | $10.70B | $10.56B | $10.66B | $10.74B | $10.44B | $10.40B | $9.19B | $9.23B | $8.94B | $8.82B | $8.68B | $8.73B | $8.53B | $8.50B |
| Goodwill | $16.59B | $15.98B | $15.88B | $15.86B | $15.85B | $15.83B | $15.29B | $15.35B | $14.62B | $14.45B | $14.19B | $14.17B | $12.83B | $12.83B | $12.74B | $12.48B | $12.05B | $12.05B | $11.71B | $11.67B |
| Intangible Assets | $632.00M | $546.00M | $454.80M | $463.40M | $482.60M | $496.20M | $447.20M | $431.50M | $355.50M | $347.20M | $399.30M | $398.70M | $258.00M | $259.50M | $228.10M | $209.60M | $181.50M | $173.10M | $127.50M | $126.70M |
| Goodwill and Intangible Assets | $17.22B | $16.53B | $16.34B | $16.33B | $16.33B | $16.33B | $15.74B | $15.79B | $14.98B | $14.80B | $14.59B | $14.56B | $13.09B | $13.09B | $12.96B | $12.69B | $12.23B | $12.22B | $11.84B | $11.80B |
| Long Term Investments | $- | $- | $672.70M | $941.10M | $584.20M | $821.10M | $371.60M | $-1.52B | $351.10M | $281.40M | $276.30M | $241.30M | $134.30M | $127.60M | $129.50M | $137.70M | $130.80M | $145.40M | $121.40M | $98.90M |
| Tax Assets | $- | $- | $- | $1.57B | $1.58B | $1.53B | $1.47B | $1.52B | $1.56B | $- | $1.48B | $1.43B | $1.25B | $1.23B | $1.22B | $1.28B | $1.25B | $-145.40M | $1.22B | $1.19B |
| Other Non-Current Assets | $1.62B | $1.59B | $699.00M | $-1.24B | $-928.00M | $-1.24B | $-591.40M | $1.21B | $-703.90M | $870.50M | $-589.60M | $-562.20M | $-484.70M | $-430.00M | $-391.30M | $-480.70M | $-483.90M | $966.50M | $-375.10M | $-327.50M |
| Total Non-Current Assets | $30.78B | $30.00B | $29.47B | $29.27B | $29.11B | $29.03B | $27.69B | $27.56B | $26.84B | $26.69B | $26.20B | $26.07B | $23.18B | $23.24B | $22.86B | $22.44B | $21.81B | $21.91B | $21.34B | $21.26B |
| Other Assets | $- | $- | $- | $1 | $- | $- | $- | $- | $- | $- | $- | $- | $- | $- | $- | $- | $- | $- | $- | $- |
| Total Assets | $33.10B | $32.40B | $31.81B | $31.93B | $31.38B | $31.41B | $30.04B | $29.82B | $29.08B | $29.05B | $28.40B | $28.21B | $24.88B | $24.95B | $24.43B | $23.92B | $23.25B | $23.43B | $23.11B | $22.83B |
| Account Payables | $1.15B | $1.34B | $1.23B | $1.29B | $1.18B | $1.41B | $1.20B | $1.10B | $984.20M | $1.22B | $1.02B | $1.04B | $846.60M | $910.00M | $815.00M | $728.10M | $678.30M | $779.00M | $646.30M | $657.40M |
| Short Term Debt | $421.00M | $917.00M | $567.00M | $1.49B | $1.48B | $987.10M | $984.80M | $203.70M | $517.30M | $513.90M | $513.20M | $369.80M | $45.10M | $46.40M | $45.10M | $171.40M | $204.50M | $201.60M | $220.10M | $94.40M |
| Tax Payables | $- | $- | $23.20M | $188.80M | $167.80M | $182.90M | $277.60M | $163.40M | $155.70M | $168.50M | $177.20M | $166.40M | $158.40M | $143.70M | $159.50M | $146.70M | $137.00M | $132.30M | $176.20M | $144.40M |
| Deferred Revenue | $504.00M | $485.00M | $485.50M | $472.50M | $472.20M | $467.30M | $484.80M | $467.40M | $467.10M | $443.00M | $463.10M | $419.60M | $408.20M | $381.30M | $381.50M | $366.60M | $359.30M | $345.60M | $341.60M | $334.60M |
| Other Current Liabilities | $1.41B | $1.38B | $1.34B | $1.10B | $1.02B | $1.18B | $1.12B | $1.05B | $905.00M | $1.04B | $986.00M | $934.20M | $799.80M | $934.20M | $932.30M | $902.00M | $769.70M | $823.50M | $806.60M | $835.30M |
| Total Current Liabilities | $3.49B | $4.13B | $3.64B | $4.53B | $4.33B | $4.23B | $4.07B | $2.99B | $3.03B | $3.39B | $3.16B | $2.93B | $2.26B | $2.42B | $2.33B | $2.31B | $2.15B | $2.28B | $2.19B | $2.07B |
| Long Term Debt | $- | $189.00M | $12.24B | $11.72B | $11.59B | $11.84B | $11.19B | $12.16B | $11.69B | $11.57B | $11.43B | $11.86B | $9.84B | $9.79B | $9.49B | $9.04B | $8.80B | $8.97B | $8.81B | $8.82B |
| Deferred Revenue Non-Current | $- | $- | $- | $-2.33B | $2.97B | $433.30M | $2.58B | $2.54B | $- | $1.53B | $1.48B | $1.43B | $- | $1.23B | $1.22B | $2.07B | $2.00B | $1.24B | $1.99B | $2.00B |
| Deferred Tax Liabilities Non-Current | $1.61B | $1.59B | $1.59B | $1.57B | $1.58B | $1.53B | $1.47B | $1.52B | $1.56B | $1.53B | $1.48B | $1.43B | $1.25B | $1.23B | $1.22B | $1.28B | $1.25B | $1.24B | $1.22B | $1.19B |
| Other Non-Current Liabilities | $16.34B | $15.08B | $3.12B | $3.11B | $3.07B | $3.27B | $2.98B | $2.95B | $2.89B | $2.88B | $2.84B | $2.77B | $2.54B | $2.54B | $2.51B | $2.50B | $2.41B | $2.45B | $2.51B | $2.53B |
| Total Non-Current Liabilities | $17.95B | $16.87B | $16.94B | $16.39B | $16.24B | $16.64B | $15.64B | $16.63B | $16.13B | $15.98B | $15.75B | $16.06B | $13.64B | $13.56B | $13.22B | $12.82B | $12.47B | $12.66B | $12.55B | $12.53B |
| Other Liabilities | $- | $- | $- | $1 | $- | $- | $- | $- | $- | $- | $- | $- | $- | $- | $- | $- | $- | $- | $- | $- |
| Total Liabilities | $21.44B | $21.00B | $20.58B | $20.93B | $20.56B | $20.87B | $19.71B | $19.62B | $19.16B | $19.36B | $18.91B | $19.00B | $15.90B | $15.98B | $15.55B | $15.14B | $14.61B | $14.95B | $14.74B | $14.60B |
| Preferred Stock | $- | $- | $- | $- | $- | $- | $- | $- | $- | $- | $- | $- | $- | $- | $- | $- | $- | $- | $- | $- |
| Common Stock | $3.00M | $3.00M | $3.20M | $3.20M | $3.20M | $3.20M | $3.20M | $3.20M | $3.20M | $3.20M | $3.20M | $3.20M | $3.20M | $3.20M | $3.20M | $3.20M | $3.20M | $3.20M | $3.50M | $3.50M |
| Retained Earnings | $10.09B | $9.77B | $9.44B | $9.06B | $8.72B | $8.43B | $8.16B | $7.85B | $7.58B | $7.36B | $7.17B | $6.91B | $6.68B | $6.48B | $6.31B | $6.11B | $5.91B | $5.75B | $5.65B | $5.53B |
| Accumulated Other Comprehensive Income Loss | $-31.00M | $-26.00M | $-18.60M | $-9.10M | $-5.30M | $-12.10M | $-2.50M | $-6.70M | $-9.30M | $-12.10M | $-10.60M | $-13.40M | $-13.50M | $-14.60M | $-9.60M | $-10.80M | $-11.30M | $-12.40M | $-15.50M | $-16.50M |
| Other Total Stockholders Equity | $1.60B | $1.65B | $1.80B | $1.95B | $2.10B | $2.12B | $2.17B | $2.35B | $2.34B | $2.34B | $2.33B | $2.32B | $2.31B | $2.51B | $2.57B | $2.68B | $2.73B | $2.74B | $2.73B | $2.71B |
| Total Stockholders Equity | $11.66B | $11.40B | $11.23B | $11.01B | $10.82B | $10.54B | $10.33B | $10.20B | $9.92B | $9.69B | $9.49B | $9.22B | $8.98B | $8.98B | $8.87B | $8.78B | $8.63B | $8.48B | $8.37B | $8.23B |
| Total Equity | $11.66B | $11.41B | $11.23B | $11.01B | $10.82B | $10.54B | $10.33B | $10.20B | $9.92B | $9.69B | $9.49B | $9.22B | $8.98B | $8.98B | $8.88B | $8.78B | $8.64B | $8.49B | $8.37B | $8.23B |
| Total Liabilities and Stockholders Equity | $33.10B | $32.40B | $31.81B | $31.93B | $31.38B | $31.41B | $30.04B | $29.82B | $29.08B | $29.05B | $28.40B | $28.21B | $24.88B | $24.95B | $24.43B | $23.92B | $23.25B | $23.43B | $23.11B | $22.83B |
| Minority Interest | $2.00M | $2.00M | $1.40M | $1.20M | $800.00K | $1.20M | $1.10M | $1.00M | $800.00K | $800.00K | $600.00K | $600.00K | $700.00K | $800.00K | $5.60M | $5.10M | $5.40M | $4.90M | $4.00M | $3.80M |
| Total Liabilities and Total Equity | $33.10B | $32.40B | $31.81B | $31.93B | $31.38B | $31.41B | $30.04B | $29.82B | $29.08B | $29.05B | $28.40B | $28.21B | $24.88B | $24.95B | $24.43B | $23.92B | $23.25B | $23.43B | $23.11B | $22.83B |
| Total Investments | $222.00M | $208.00M | $672.70M | $941.10M | $143.30M | $821.10M | $153.30M | $149.60M | $483.80M | $127.60M | $276.30M | $241.30M | $134.30M | $139.00M | $285.10M | $288.70M | $265.40M | $294.50M | $266.60M | $241.50M |
| Total Debt | $421.00M | $862.00M | $12.80B | $13.20B | $13.07B | $13.07B | $11.93B | $12.11B | $11.92B | $11.78B | $11.64B | $11.90B | $9.62B | $9.55B | $9.27B | $8.97B | $8.76B | $8.93B | $8.78B | $8.66B |
| Net Debt | $338.00M | $788.00M | $12.72B | $12.71B | $12.98B | $12.93B | $11.77B | $11.93B | $11.79B | $11.64B | $11.55B | $11.78B | $9.58B | $9.53B | $9.22B | $8.94B | $8.74B | $8.90B | $8.37B | $8.39B |
Annual Cash Flow
| Breakdown | December 31, 2024 | December 31, 2023 | December 31, 2022 | December 31, 2021 | December 31, 2020 |
|---|---|---|---|---|---|
| Net Income | $2.04B | $1.73B | $1.49B | $1.29B | $969.60M |
| Depreciation and Amortization | $1.78B | $1.60B | $1.44B | $1.27B | $1.16B |
| Deferred Income Tax | $87.00M | $101.70M | $181.10M | $-15.50M | $60.80M |
| Stock Based Compensation | $42.00M | $40.90M | $38.80M | $57.00M | $37.30M |
| Change in Working Capital | $- | $25.10M | $-111.70M | $22.70M | $-7.80M |
| Accounts Receivables | $-76.00M | $-71.30M | $-198.80M | $-135.40M | $13.80M |
| Inventory | $- | $- | $- | $- | $6.50M |
| Accounts Payables | $-27.00M | $82.80M | $106.40M | $113.80M | $-46.70M |
| Other Working Capital | $- | $13.60M | $-19.30M | $44.30M | $18.60M |
| Other Non Cash Items | $-21.00M | $119.40M | $153.00M | $162.00M | $252.90M |
| Net Cash Provided by Operating Activities | $3.94B | $3.62B | $3.19B | $2.79B | $2.47B |
| Investments in Property Plant and Equipment | $-1.85B | $-1.63B | $-1.45B | $-1.32B | $-1.19B |
| Acquisitions Net | $-753.00M | $-2.06B | $-2.99B | $-1.18B | $-736.60M |
| Purchases of Investments | $-26.00M | $-28.90M | $-19.60M | $-30.80M | $-32.90M |
| Sales Maturities of Investments | $24.00M | $- | $19.70M | $37.90M | $11.20M |
| Other Investing Activities | $49.00M | $52.10M | $18.80M | $18.50M | $30.10M |
| Net Cash Used for Investing Activities | $-2.56B | $-3.67B | $-4.42B | $-2.47B | $-1.92B |
| Debt Repayment | $-200.00M | $982.60M | $2.16B | $542.10M | $120.20M |
| Common Stock Issued | $-14.00M | $-1.20M | $-13.60M | $-12.00M | $3.90M |
| Common Stock Repurchased | $-482.00M | $-261.80M | $-203.50M | $-252.20M | $-98.80M |
| Dividends Paid | $-687.00M | $-638.10M | $-592.90M | $-552.60M | $-522.50M |
| Other Financing Activities | $-15.00M | $-19.60M | $-10.40M | $-54.50M | $-114.80M |
| Net Cash Used Provided by Financing Activities | $-1.40B | $61.90M | $1.34B | $-329.20M | $-612.00M |
| Effect of Forex Changes on Cash | $-2.00M | $300.00K | $-2.50M | $- | $- |
| Net Change in Cash | $-25.00M | $13.20M | $108.70M | $-8.60M | $-63.20M |
| Cash at End of Period | $203.00M | $227.50M | $214.30M | $105.60M | $114.20M |
| Cash at Beginning of Period | $228.00M | $214.30M | $105.60M | $114.20M | $177.40M |
| Operating Cash Flow | $3.94B | $3.62B | $3.19B | $2.79B | $2.47B |
| Capital Expenditure | $-1.85B | $-1.63B | $-1.45B | $-1.32B | $-1.19B |
| Free Cash Flow | $2.08B | $1.99B | $1.74B | $1.47B | $1.28B |
Cash Flow Charts
| Breakdown | March 31, 2025 | December 31, 2024 | September 30, 2024 | June 30, 2024 | March 31, 2024 | December 31, 2023 | September 30, 2023 | June 30, 2023 | March 31, 2023 | December 31, 2022 | September 30, 2022 | June 30, 2022 | March 31, 2022 | December 31, 2021 | September 30, 2021 | June 30, 2021 | March 31, 2021 | December 31, 2020 | September 30, 2020 | June 30, 2020 |
|---|---|---|---|---|---|---|---|---|---|---|---|---|---|---|---|---|---|---|---|---|
| Net Income | $495.00M | $512.50M | $565.67M | $511.54M | $453.70M | $439.57M | $480.30M | $427.50M | $383.90M | $347.00M | $416.90M | $371.80M | $351.90M | $313.10M | $350.80M | $332.00M | $296.40M | $236.30M | $260.20M | $226.30M |
| Depreciation and Amortization | $462.00M | $469.70M | $448.70M | $439.70M | $425.80M | $426.70M | $424.00M | $358.30M | $382.80M | $372.50M | $376.70M | $359.90M | $332.10M | $319.80M | $322.10M | $323.70M | $302.60M | $288.00M | $291.40M | $289.90M |
| Deferred Income Tax | $1.00M | $16.80M | $22.70M | $- | $47.50M | $49.50M | $18.80M | $18.90M | $14.50M | $80.90M | $47.40M | $27.90M | $24.90M | $17.30M | $-75.30M | $27.20M | $15.30M | $15.10M | $34.30M | $-6.20M |
| Stock Based Compensation | $13.00M | $11.00M | $9.20M | $10.60M | $11.20M | $9.20M | $10.30M | $9.80M | $11.60M | $8.00M | $9.60M | $8.80M | $12.40M | $7.90M | $10.50M | $26.00M | $12.60M | $8.30M | $9.60M | $9.50M |
| Change in Working Capital | $- | $-96.20M | $-102.80M | $78.30M | $-145.80M | $-159.50M | $24.60M | $229.60M | $-113.40M | $-70.70M | $-78.10M | $66.60M | $-29.50M | $-132.30M | $37.30M | $97.90M | $19.80M | $-162.80M | $-45.70M | $202.30M |
| Accounts Receivables | $-18.00M | $23.90M | $-30.50M | $-68.30M | $-1.10M | $89.70M | $-109.00M | $-48.70M | $-3.30M | $7.30M | $-55.70M | $-112.00M | $-38.40M | $2.30M | $-69.60M | $-59.20M | $-8.90M | $10.40M | $-42.10M | $17.50M |
| Inventory | $- | $- | $- | $- | $- | $- | $- | $- | $- | $- | $- | $- | $- | $-400.00K | $825.90M | $964.20M | $706.80M | $-128.50M | $-57.10M | $103.90M |
| Accounts Payables | $-42.00M | $-700.00K | $-45.80M | $20.70M | $-1.20M | $-10.70M | $58.40M | $106.20M | $-71.10M | $8.70M | $-69.40M | $94.10M | $73.00M | $14.40M | $45.00M | $26.80M | $27.60M | $13.70M | $400.00K | $2.70M |
| Other Working Capital | $- | $-119.40M | $-26.50M | $125.90M | $-162.20M | $-238.50M | $75.20M | $172.10M | $-39.00M | $-86.70M | $47.00M | $84.50M | $-64.10M | $-148.60M | $-764.00M | $-833.90M | $-705.70M | $-58.40M | $53.10M | $78.20M |
| Other Non Cash Items | $54.00M | $108.20M | $59.63M | $996.86M | $3.20M | $133.03M | $-4.90M | $34.40M | $8.30M | $68.90M | $47.40M | $22.90M | $13.80M | $123.10M | $9.60M | $15.00M | $14.30M | $177.70M | $25.70M | $42.20M |
| Net Cash Provided by Operating Activities | $1.02B | $1.02B | $1.00B | $1.10B | $811.50M | $898.50M | $953.10M | $1.08B | $687.70M | $806.60M | $819.90M | $857.90M | $705.60M | $648.90M | $655.00M | $821.80M | $661.00M | $562.60M | $575.50M | $764.00M |
| Investments in Property Plant and Equipment | $-459.00M | $-497.60M | $-439.50M | $-403.40M | $-514.50M | $-547.90M | $-368.90M | $-335.70M | $-378.60M | $-529.20M | $-277.50M | $-313.20M | $-334.10M | $-412.10M | $-295.60M | $-277.60M | $-331.00M | $-305.60M | $-234.30M | $-307.90M |
| Acquisitions Net | $-834.00M | $-353.10M | $-198.60M | $-30.10M | $-166.30M | $-1.01B | $-61.40M | $-696.40M | $-291.60M | $-190.40M | $-142.50M | $-2.57B | $-81.60M | $-285.40M | $-359.30M | $-513.50M | $-17.20M | $-579.20M | $-89.10M | $-7.10M |
| Purchases of Investments | $-3.00M | $- | $-900.00K | $-5.00M | $-12.00M | $-15.10M | $-4.10M | $-5.20M | $-4.50M | $-10.50M | $-6.60M | $-9.10M | $-2.50M | $-30.00M | $-7.20M | $-9.20M | $-7.40M | $-32.90M | $- | $- |
| Sales Maturities of Investments | $2.00M | $- | $- | $4.90M | $11.50M | $17.20M | $4.00M | $4.70M | $4.40M | $11.20M | $6.90M | $8.50M | $2.10M | $37.00M | $7.00M | $6.00M | $8.90M | $11.20M | $- | $- |
| Other Investing Activities | $6.00M | $38.20M | $3.20M | $-200.00K | $-500.00K | $-14.90M | $3.90M | $11.60M | $17.00M | $-3.20M | $2.70M | $2.70M | $16.70M | $10.00M | $2.40M | $2.60M | $2.10M | $16.60M | $12.30M | $28.60M |
| Net Cash Used for Investing Activities | $-1.29B | $-812.50M | $-635.80M | $-433.80M | $-678.90M | $-1.57B | $-426.50M | $-1.02B | $-653.30M | $-722.10M | $-417.00M | $-2.88B | $-399.40M | $-680.50M | $-652.50M | $-788.50M | $-344.60M | $-889.90M | $-311.10M | $-286.40M |
| Debt Repayment | $- | $130.20M | $-429.30M | $103.10M | $-4.00M | $883.50M | $-198.80M | $168.30M | $129.60M | $143.60M | $-287.60M | $2.26B | $48.00M | $277.40M | $282.90M | $161.90M | $-180.10M | $156.00M | $31.60M | $-339.20M |
| Common Stock Issued | $-19.00M | $- | $3.20M | $4.30M | $-25.30M | $3.10M | $2.70M | $4.00M | $-11.00M | $-700.00K | $2.60M | $- | $-11.50M | $-4.90M | $2.40M | $- | $-12.30M | $2.60M | $8.00M | $- |
| Common Stock Repurchased | $-55.00M | $-157.50M | $-153.10M | $-167.60M | $- | $-71.40M | $-190.40M | $4.00M | $- | $-700.00K | $2.60M | $-4.00M | $-203.50M | $-73.20M | $-138.90M | $-27.40M | $-12.70M | $- | $- | $2.80M |
| Dividends Paid | $-181.00M | $-182.20M | $-168.00M | $-168.50M | $-168.30M | $-168.60M | $-156.50M | $-156.60M | $-156.40M | $-156.40M | $-145.30M | $-145.30M | $-145.90M | $-146.10M | $-135.40M | $-135.60M | $-135.50M | $-135.40M | $-129.20M | $-128.70M |
| Other Financing Activities | $465.00M | $-400.00K | $-6.30M | $-4.70M | $-3.60M | $-5.50M | $-2.50M | $-7.40M | $-4.20M | $-5.10M | $-2.40M | $-5.10M | $-1.80M | $-38.90M | $-2.60M | $-11.30M | $-1.70M | $-70.90M | $-36.30M | $-5.20M |
| Net Cash Used Provided by Financing Activities | $284.00M | $-209.90M | $-753.50M | $-233.40M | $-201.20M | $641.10M | $-545.50M | $8.30M | $-42.00M | $-22.00M | $-432.70M | $2.11B | $-314.70M | $14.30M | $8.40M | $-9.60M | $-342.30M | $-47.70M | $-125.90M | $-470.30M |
| Effect of Forex Changes on Cash | $- | $-3.10M | $400.00K | $1.20M | $-500.00K | $100.00K | $-300.00K | $500.00K | $- | $600.00K | $-3.00M | $-100.00K | $- | $700.00K | $- | $- | $- | $- | $- | $- |
| Net Change in Cash | $21.00M | $-3.00M | $-284.60M | $399.00M | $-69.10M | $-17.50M | $-19.20M | $66.30M | $-7.60M | $66.50M | $-35.90M | $86.60M | $-8.50M | $-17.30M | $10.90M | $23.70M | $-25.90M | $-375.00M | $138.50M | $7.30M |
| Cash at End of Period | $224.00M | $203.00M | $206.00M | $490.60M | $158.40M | $140.00M | $253.80M | $273.00M | $206.70M | $214.30M | $147.80M | $183.70M | $97.10M | $105.60M | $122.90M | $112.00M | $88.30M | $114.20M | $489.20M | $350.70M |
| Cash at Beginning of Period | $203.00M | $206.00M | $490.60M | $91.60M | $227.50M | $157.50M | $273.00M | $206.70M | $214.30M | $147.80M | $183.70M | $97.10M | $105.60M | $122.90M | $112.00M | $88.30M | $114.20M | $489.20M | $350.70M | $343.40M |
| Operating Cash Flow | $1.02B | $1.02B | $1.00B | $1.10B | $811.50M | $898.50M | $953.10M | $1.08B | $687.70M | $806.60M | $819.90M | $857.90M | $705.60M | $648.90M | $655.00M | $821.80M | $661.00M | $562.60M | $575.50M | $764.00M |
| Capital Expenditure | $-459.00M | $-497.60M | $-439.50M | $-403.40M | $-514.50M | $-547.90M | $-368.90M | $-335.70M | $-378.60M | $-529.20M | $-277.50M | $-313.20M | $-334.10M | $-412.10M | $-295.60M | $-277.60M | $-331.00M | $-305.60M | $-234.30M | $-307.90M |
| Free Cash Flow | $566.00M | $524.40M | $563.60M | $696.00M | $297.00M | $350.60M | $584.20M | $742.80M | $309.10M | $277.40M | $542.40M | $544.70M | $371.50M | $236.80M | $359.40M | $544.20M | $330.00M | $257.00M | $341.20M | $456.10M |
Republic Services Dividends
Explore Republic Services's dividend history, including dividend yield, payout ratio, and historical payments.
Dividend Yield
1.09%
Dividend Payout Ratio
33.63%
Dividend Paid & Capex Coverage Ratio
1.55x
Republic Services Dividend History
| Dividend | Adjusted Dividend | Date | Record Date | Payment Date | Declaration Date |
|---|---|---|---|---|---|
| $0.58 | $0.58 | July 02, 2025 | July 02, 2025 | July 15, 2025 | April 24, 2025 |
| $0.58 | $0.58 | April 02, 2025 | April 02, 2025 | April 15, 2025 | February 05, 2025 |
| $0.58 | $0.58 | January 02, 2025 | January 02, 2025 | January 15, 2025 | October 23, 2024 |
| $0.58 | $0.58 | October 02, 2024 | October 02, 2024 | October 15, 2024 | July 24, 2024 |
| $0.535 | $0.535 | July 02, 2024 | July 02, 2024 | July 15, 2024 | April 24, 2024 |
| $0.535 | $0.535 | April 01, 2024 | April 02, 2024 | April 15, 2024 | February 06, 2024 |
| $0.535 | $0.535 | December 29, 2023 | January 02, 2024 | January 16, 2024 | October 25, 2023 |
| $0.535 | $0.535 | September 29, 2023 | October 02, 2023 | October 13, 2023 | July 27, 2023 |
| $0.495 | $0.495 | June 30, 2023 | July 03, 2023 | July 14, 2023 | April 19, 2023 |
| $0.495 | $0.495 | March 31, 2023 | April 03, 2023 | April 14, 2023 | February 08, 2023 |
| $0.495 | $0.495 | December 30, 2022 | January 03, 2023 | January 13, 2023 | October 27, 2022 |
| $0.495 | $0.495 | September 30, 2022 | October 03, 2022 | October 14, 2022 | July 28, 2022 |
| $0.46 | $0.46 | June 30, 2022 | July 01, 2022 | July 15, 2022 | May 05, 2022 |
| $0.46 | $0.46 | March 31, 2022 | April 01, 2022 | April 14, 2022 | February 10, 2022 |
| $0.46 | $0.46 | December 31, 2021 | January 03, 2022 | January 14, 2022 | October 28, 2021 |
| $0.46 | $0.46 | September 30, 2021 | October 01, 2021 | October 15, 2021 | July 29, 2021 |
| $0.425 | $0.425 | June 30, 2021 | July 01, 2021 | July 15, 2021 | May 05, 2021 |
| $0.425 | $0.425 | March 31, 2021 | April 01, 2021 | April 15, 2021 | February 16, 2021 |
| $0.425 | $0.425 | December 31, 2020 | January 04, 2021 | January 15, 2021 | October 27, 2020 |
| $0.425 | $0.425 | September 30, 2020 | October 01, 2020 | October 15, 2020 | July 29, 2020 |
Republic Services News
Read the latest news about Republic Services, including recent articles, headlines, and updates.


Republic Services (RSG) Reports Q1 Earnings: What Key Metrics Have to Say
Although the revenue and EPS for Republic Services (RSG) give a sense of how its business performed in the quarter ended March 2025, it might be worth considering how some key metrics compare with Wall Street estimates and the year-ago numbers.

Republic Services, Inc. (RSG) Q1 2025 Earnings Call Transcript
Republic Services, Inc. (NYSE:RSG ) Q1 2025 Earnings Conference Call April 24, 2025 5:00 PM ET Company Participants Aaron Evans - VP of IR Jon Vander Ark - CEO Brian DelGhiaccio - CFO Conference Call Participants Sabahat Khan - RBC Capital Markets Bryan Burgmeier - Citi Tyler Brown - Raymond James Toni Kaplan - Morgan Stanley Jerry Revich - Goldman Sachs Noah Kaye - Oppenheimer Tami Zakaria - JPMorgan Kevin Chiang - CIBC Trevor Romeo - William Blair Stephanie Moore - Jefferies Tobey Sommer - Truist Security Tony Bancroft - Gabelli Funds Michael Feniger - Bank of America James Schumm - TD Cowen Operator Good afternoon, and welcome to the Republic Services First Quarter 2025 Investor Conference Call. Republic Services is traded on the New York Stock Exchange under the symbol RSG.


Republic Services, Inc. Reports First Quarter 2025 Results
First Quarter Earnings Per Share of $1.58 Expanded First Quarter Net Income Margin 50 Basis Points and Adjusted EBITDA Margin 140 Basis Points Generated Cash Flow from Operations of $1,025 Million and Adjusted Free Cash Flow of $727 Million Invested More Than $800 Million in Value-Creating Acquisitions Named to Barron's 2025 100 Most Sustainable Companies List PHOENIX , April 24, 2025 /PRNewswire/ -- Republic Services, Inc. (NYSE: RSG) today reported net income of $495 million, or $1.58 per diluted share, for the three months ended March 31, 2025, versus $454 million, or $1.44 per diluted share, for the comparable 2024 period. Excluding certain expenses and other items, on an adjusted basis, net income for the three months ended March 31, 2025, was $496 million, or $1.58 per diluted share, versus $458 million, or $1.45 per diluted share, for the comparable 2024 period.

Countdown to Republic Services (RSG) Q1 Earnings: A Look at Estimates Beyond Revenue and EPS
Get a deeper insight into the potential performance of Republic Services (RSG) for the quarter ended March 2025 by going beyond Wall Street's top -and-bottom-line estimates and examining the estimates for some of its key metrics.

Republic Services: Even More Attractive In Light Of Tariff Risks
Republic Services has shown resilience, outperforming the S&P by meaningfully since Liberation Day and YTD, driven by recession-resistant cash flows and a defensive trading history. Despite a high valuation, RSG's stable revenue, minimal exposure to tariffs, and strategic investments in Polymer Centers bolster its long-term growth and defensive appeal. The company's recent earnings beat, significant planned acquisitions, and ongoing shareholder returns highlight its robust financial health and commitment to growth.


Republic Services Charitable Foundation Announces 2025 National Neighborhood Promise® Grants
More than 2 million people will be positively impacted through projects with fourteen nonprofit organizations throughout North America PHOENIX , April 8, 2025 /PRNewswire/ -- Republic Services, Inc. (NYSE: RSG) and the Republic Services Charitable Foundation today announced the 14 nonprofit organizations receiving 2025 grants through the Foundation's National Neighborhood Promise® (NNP) Program. The NNP program works to revitalize communities and enhance the quality of life of residents through volunteer projects, monetary donations and in-kind services.


Trump's Liberation Day: What's Working In A Tariff Tantrum?
Focus on oil & gas, waste management, and REITs as they have been performing well and are tariff-agnostic. Avoiding investments in the auto sector and hard asset Mag 7 stocks due to their tariff focus. The tariff policy details are crucial for understanding market dynamics and making informed investment decisions.

Republic Services, Inc. Sets Date for First Quarter 2025 Earnings Release and Conference Call
PHOENIX , April 1, 2025 /PRNewswire/ -- Republic Services, Inc. (NYSE: RSG) will release its first quarter financial results after market close on Thursday, April 24, 2025, and host an investor conference call at 5 p.m. Eastern Time that day.


Republic Services, Blue Polymers Celebrate Opening of Indianapolis Plastics Recycling Complex
Polymer Center and Blue Polymers facilities are designed to produce 175 million pounds of recycled plastics annually for sustainable packaging and other uses INDIANAPOLIS , March 18, 2025 /PRNewswire/ -- Leaders from Republic Services, Inc. (NYSE: RSG) and Blue Polymers, LLC, today celebrated the opening of North America's first Polymer Center and Blue Polymers plastics recycling complex, transforming plastics circularity from curbside collection to consumer packaging and back again. Republic Services and Blue Polymers opened North America's first Polymer Center-Blue Polymers complex.

Republic Services Named One of the World's Most Ethical Companies for Seventh Time
Company recognized for robust ethics, compliance and governance programs PHOENIX , March 11, 2025 /PRNewswire/ -- For the seventh year, Republic Services, Inc. (NYSE: RSG) has received the World's Most Ethical Companies® recognition by Ethisphere, a global leader in defining and advancing the standards of the ethical business practices. Republic Services is one of 136 companies spanning 19 countries and 44 industries to be recognized in 2025.

3 Stocks to Consider With a Possible Recession on the Table
As of early March 2025, investors—and consumers—have once again begun to feel skittish about the possibility of an impending recession. At least two major factors have contributed most recently to this sentiment: first, a dreaded inverted yield curve in the final days of February, and second, the Atlanta Fed's model to predict GDP growth for the first quarter of the year was revised down to -2.8% on March 3, when it had been +4.0% about a month before.


Republic Services Celebrates Winners of 2025 ROAD-EO National Championship
Safety and skills competition recognizes best-of-the-best drivers, equipment operators and technicians PHOENIX , Feb. 25, 2025 /PRNewswire/ -- Republic Services, Inc. (NYSE: RSG), a leader in the environmental services industry, today announced the winners of its 2025 ROAD-EO National Championship. Held every two years in Phoenix, the event recognizes the company's most skilled collection drivers, equipment operators and technicians from across North America.

BGL Announces the Sale of Shamrock Environmental to Republic Services
CLEVELAND , Feb. 24, 2025 /PRNewswire/ -- Brown Gibbons Lang & Company (BGL), a leading independent investment bank and financial advisory firm, is pleased to announce the sale of Shamrock Environmental (Shamrock), a premier, vertically integrated industrial waste and wastewater services platform and portfolio company of CenterOak Partners, to Republic Services, Inc. (NYSE: RSG). BGL's Environmental Infrastructure investment banking team served as a financial advisor to Shamrock in the transaction.

Republic Services: A Buy-And-Hold Forever? Maybe Not At This Price
Republic Services boasts a strong economic moat and competitive advantages, making it a highly profitable and stable business in the waste management industry. The company's efficient operations, valuable assets, and strategic franchise contracts contribute to its significant pricing power and market position. 2024 was a strong year for the firm with great revenue growth being accompanied by a massive expansion in operating earnings.

Rocky Shore Engages CHF Capital Markets Inc. and Grants Equity Incentives
TORONTO, Feb. 19, 2025 (GLOBE NEWSWIRE) -- Rocky Shore Gold Ltd. (the “Company” or “Rocky”) (CSE: RSG) is pleased to announce that it has engaged CHF Capital Markets Inc. (“CHF”), a distinguished Canadian firm specializing in investor relations and capital markets.


Republic Services, Inc. (RSG) Q4 2024 Earnings Call Transcript
Republic Services, Inc. (NYSE:RSG ) Q4 2024 Earnings Conference Call February 13, 2025 5:00 PM ET Company Participants Aaron Evans - VP of IR Jon Vander Ark - CEO Brian DelGhiaccio - CFO Conference Call Participants Bryan Burgmeier - Citi Tyler Brown - Raymond James Noah Kaye - Oppenheimer Jerry Revich - Goldman Sachs Trevor Romeo - William Blair Sabahat Khan - RBC Capital Markets Tobey Sommer - Truist Security Harold Antor - Jefferies Brian Butler - Stifel Tony Bancroft - Gabelli Funds Konark Gupta - Scotia Capital Kevin Chiang - CIBC James Schumm - TD Cowen Devin Dodge - BMO Capital Markets Operator Good afternoon, and welcome to the Republic Services Fourth Quarter and Full Year 2024 Investor Conference Call. Republic Services is traded on the New York Stock Exchange under the symbol RSG.

Compared to Estimates, Republic Services (RSG) Q4 Earnings: A Look at Key Metrics
The headline numbers for Republic Services (RSG) give insight into how the company performed in the quarter ended December 2024, but it may be worthwhile to compare some of its key metrics to Wall Street estimates and the year-ago actuals.


Republic Services, Inc. Reports Fourth Quarter and Full-Year 2024 Results; Provides 2025 Full-Year Financial Guidance
Exceeded Adjusted EBITDA, Adjusted Earnings Per Share and Adjusted Free Cash Flow Full-Year 2024 Guidance Fourth Quarter Total Revenue Growth of 5.6 Percent Fourth Quarter Earnings Per Share of $1.63 and Adjusted Earnings Per Share of $1.58 Expanded Fourth Quarter Net Income Margin 120 Basis Points and Adjusted EBITDA Margin 110 Basis Points Generated Cash Flow from Operations of $3.94 Billion and Adjusted Free Cash Flow of $2.18 Billion in 2024 Returned $1.18 Billion to Shareholders in 2024 PHOENIX , Feb. 13, 2025 /PRNewswire/ -- Republic Services, Inc. (NYSE: RSG) today reported net income of $512 million, or $1.63 per diluted share, for the three months ended December 31, 2024, versus $440 million, or $1.39 per diluted share, for the comparable 2023 period. Excluding certain expenses and other items, on an adjusted basis, net income for the three months ended December 31, 2024, was $497 million, or $1.58 per diluted share, versus $446 million, or $1.41 per diluted share, for the comparable 2023 period.

Similar Companies
Related Metrics
Explore detailed financial metrics and analysis for RSG.