Schnitzer Steel Industries Key Executives
This section highlights Schnitzer Steel Industries's key executives, including their titles and compensation details.
Find Contacts at Schnitzer Steel Industries
(Showing 0 of )
Schnitzer Steel Industries Earnings
This section highlights Schnitzer Steel Industries's earnings, including key dates, EPS, earnings reports, and earnings call transcripts.
Next Earnings Date
Last Earnings Results
Earnings Call Transcripts
| Transcript | Quarter | Year | Date | Estimated EPS | Actual EPS |
|---|---|---|---|---|---|
| Read Transcript | Q3 | 2023 | 2023-06-27 | $0.71 | $0.67 |
| Read Transcript | Q2 | 2023 | 2023-04-05 | $0.22 | $0.14 |
| Read Transcript | Q1 | 2023 | 2023-01-05 | $0.45 | $0.44 |

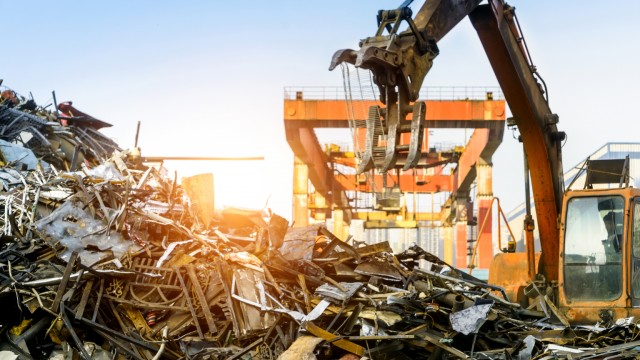
Schnitzer Steel Industries, Inc. recycles ferrous and nonferrous metal, and manufactures finished steel products worldwide. The company acquires, processes, and recycles salvaged vehicles, rail cars, home appliances, industrial machinery, manufacturing scrap, and construction and demolition scrap. It offers recycled ferrous metal, a feedstock used in the production of finished steel products; and nonferrous products, including mixed metal joint products recovered from the shredding process, such as zorba, zurik, aluminum, copper, stainless steel, nickel, brass, titanium, lead, and high temperature alloys. The company also procures salvaged vehicles and sells serviceable used auto parts from these vehicles through its 50 self-service auto parts stores in the United States and Western Canada, as well as sells auto bodies. In addition, it produces various finished steel products using ferrous recycled metal and other raw materials, as well as semi-finished goods, which include billets; and finished goods consisting of rebar, coiled rebar, wire rods, merchant bars, and other specialty products. Further, the company sells catalytic converters to specialty processors that extract the nonferrous precious metals, including platinum, palladium, and rhodium; ferrous and nonferrous recycled metal products to steel mills, foundries, refineries, smelters, wholesalers, and recycled metal processors; and finished steel customers are primarily steel service centers, construction industry subcontractors, steel fabricators, wire drawers, and major farm and wood products suppliers. Schnitzer Steel Industries, Inc. was founded in 1906 and is headquartered in Portland, Oregon.
$33.20
Stock Price
$906.73M
Market Cap
3.01K
Employees
Portland, OR
Location
Financial Statements
Access annual & quarterly financial statements for Schnitzer Steel Industries, including income statements, balance sheets, and cash flow statements..
Annual Income Statement
| Breakdown | August 31, 2023 | August 31, 2022 | August 31, 2021 | August 31, 2020 | August 31, 2019 |
|---|---|---|---|---|---|
| Revenue | $2.88B | $3.49B | $2.76B | $1.71B | $2.13B |
| Cost of Revenue | $2.57B | $3.00B | $2.31B | $1.50B | $1.86B |
| Gross Profit | $307.71M | $488.07M | $453.19M | $208.62M | $274.25M |
| Gross Profit Ratio | 10.70% | 14.00% | 16.40% | 12.18% | 12.86% |
| Research and Development Expenses | $- | $- | $- | $- | $- |
| General and Administrative Expenses | $265.50M | $260.56M | $240.31M | $186.26M | $- |
| Selling and Marketing Expenses | $432.00K | $2.69M | $2.15M | $1.62M | $- |
| Selling General and Administrative Expenses | $265.93M | $263.26M | $242.46M | $187.88M | $191.41M |
| Other Expenses | $-5.56M | $-692.00K | $-455.00K | $-124.00K | $641.00K |
| Operating Expenses | $265.93M | $263.26M | $242.46M | $187.88M | $191.41M |
| Cost and Expenses | $2.84B | $3.26B | $2.55B | $1.69B | $2.05B |
| Interest Income | $18.59M | $8.54M | $5.29M | $8.67M | $8.27M |
| Interest Expense | $18.59M | $8.54M | $5.29M | $8.67M | $8.27M |
| Depreciation and Amortization | $42.23M | $75.05M | $58.60M | $58.17M | $53.34M |
| EBITDA | $38.31M | $226.86M | $214.28M | $21.45M | $84.93M |
| EBITDA Ratio | 1.33% | 6.51% | 7.77% | 1.25% | 3.98% |
| Operating Income | $-3.92M | $151.81M | $155.68M | $-36.72M | $31.60M |
| Operating Income Ratio | -0.14% | 4.36% | 5.64% | -2.14% | 1.48% |
| Total Other Income Expenses Net | $-24.15M | $-9.23M | $-5.74M | $-8.79M | $-7.62M |
| Income Before Tax | $-28.08M | $216.68M | $207.99M | $-1.94M | $76.24M |
| Income Before Tax Ratio | -0.97% | 6.22% | 7.54% | -0.11% | 3.57% |
| Income Tax Expense | $-2.75M | $44.60M | $37.94M | $166.00K | $17.67M |
| Net Income | $-25.79M | $168.80M | $165.11M | $-2.10M | $56.34M |
| Net Income Ratio | -0.89% | 4.84% | 5.99% | -0.12% | 2.64% |
| EPS | $-0.92 | $6.01 | $5.90 | $-0.08 | $2.05 |
| EPS Diluted | $-0.92 | $5.72 | $5.66 | $-0.08 | $2.00 |
| Weighted Average Shares Outstanding | 27.92M | 28.08M | 27.98M | 27.00M | 27.53M |
| Weighted Average Shares Outstanding Diluted | 28.01M | 29.53M | 29.19M | 27.67M | 28.22M |
| SEC Filing | Source | Source | Source | Source | Source |
| Breakdown | February 29, 2024 | November 30, 2023 | August 31, 2023 | May 31, 2023 | February 28, 2023 | November 30, 2022 | August 31, 2022 | May 31, 2022 | February 28, 2022 | November 30, 2021 | August 31, 2021 | May 31, 2021 | February 28, 2021 | November 30, 2020 | August 31, 2020 | May 31, 2020 | February 29, 2020 | November 30, 2019 | August 31, 2019 | May 31, 2019 |
|---|---|---|---|---|---|---|---|---|---|---|---|---|---|---|---|---|---|---|---|---|
| Revenue | $621.06M | $672.90M | $717.93M | $809.61M | $755.95M | $598.73M | $894.41M | $1.01B | $783.20M | $798.12M | $845.62M | $820.72M | $600.11M | $492.11M | $464.59M | $402.68M | $439.48M | $405.58M | $547.80M | $547.40M |
| Cost of Revenue | $583.00M | $637.42M | $627.88M | $713.68M | $682.94M | $550.01M | $809.59M | $834.38M | $670.54M | $683.24M | $719.94M | $678.30M | $487.02M | $420.09M | $402.23M | $356.22M | $380.52M | $364.76M | $479.12M | $474.60M |
| Gross Profit | $38.06M | $35.48M | $90.05M | $95.92M | $73.02M | $48.72M | $84.83M | $175.71M | $112.66M | $114.87M | $125.67M | $142.42M | $113.09M | $72.01M | $62.37M | $46.47M | $58.96M | $40.82M | $68.68M | $72.80M |
| Gross Profit Ratio | 6.10% | 5.30% | 12.50% | 11.80% | 9.70% | 8.10% | 9.50% | 17.40% | 14.40% | 14.40% | 14.90% | 17.40% | 18.80% | 14.60% | 13.42% | 11.54% | 13.42% | 10.07% | 12.54% | 13.30% |
| Research and Development Expenses | $- | $- | $- | $- | $- | $- | $- | $- | $- | $- | $- | $- | $- | $- | $- | $- | $- | $- | $- | $- |
| General and Administrative Expenses | $62.02M | $63.01M | $69.19M | $68.46M | $63.85M | $63.99M | $68.62M | $76.75M | $60.54M | $54.65M | $74.37M | $- | $- | $- | $49.10M | $44.75M | $- | $- | $- | $- |
| Selling and Marketing Expenses | $140.00K | $90.00K | $23.00K | $71.00K | $103.00K | $235.00K | $614.00K | $920.00K | $545.00K | $614.00K | $2.15M | $- | $- | $- | $27.00K | $791.00K | $- | $- | $- | $- |
| Selling General and Administrative Expenses | $62.16M | $63.10M | $69.22M | $68.53M | $63.96M | $64.23M | $69.24M | $77.67M | $61.08M | $55.27M | $76.53M | $61.89M | $54.14M | $49.91M | $49.13M | $45.54M | $46.43M | $46.77M | $51.92M | $48.58M |
| Other Expenses | $- | $- | $-273.00K | $-1.31M | $-99.00K | $-3.88M | $-556.00K | $-34.00K | $-55.00K | $-47.00K | $66.00K | $-114.00K | $-242.00K | $-165.00K | $-142.00K | $-90.00K | $-98.00K | $206.00K | $268.00K | $29.00K |
| Operating Expenses | $65.04M | $58.63M | $69.22M | $68.53M | $63.96M | $64.23M | $69.24M | $77.67M | $61.08M | $55.27M | $76.53M | $61.89M | $54.14M | $49.91M | $49.13M | $45.54M | $46.43M | $46.77M | $51.92M | $48.58M |
| Cost and Expenses | $648.04M | $696.05M | $697.10M | $782.21M | $746.89M | $614.24M | $878.82M | $912.05M | $731.62M | $738.51M | $796.47M | $740.18M | $541.17M | $470.00M | $451.36M | $401.76M | $426.95M | $411.53M | $531.04M | $523.17M |
| Interest Income | $- | $- | $5.21M | $5.15M | $4.91M | $3.32M | $3.04M | $- | $- | $- | $- | $- | $- | $- | $- | $- | $- | $- | $- | $- |
| Interest Expense | $-5.80M | $-4.81M | $5.21M | $5.15M | $4.91M | $3.32M | $3.04M | $2.22M | $1.90M | $1.37M | $898.00K | $1.38M | $1.22M | $1.78M | $3.27M | $2.66M | $1.32M | $1.42M | $2.00M | $2.29M |
| Depreciation and Amortization | $24.31M | $23.47M | $44.94M | $11.60M | $22.40M | $-3.09M | $20.49M | $18.75M | $18.60M | $17.22M | $14.98M | $14.33M | $14.47M | $14.83M | $14.96M | $14.74M | $14.38M | $14.09M | $13.69M | $13.15M |
| EBITDA | $214.00K | $-4.15M | $21.27M | $26.38M | $9.27M | $-18.60M | $16.18M | $117.52M | $52.11M | $77.02M | $51.09M | $95.70M | $73.62M | $22.67M | $13.23M | $15.88M | $27.01M | $8.54M | $17.50M | $37.72M |
| EBITDA Ratio | 0.03% | -0.62% | 2.96% | 3.26% | 1.23% | -3.11% | 1.81% | 11.63% | 6.65% | 9.65% | 6.04% | 11.66% | 12.27% | 4.61% | 2.85% | 3.94% | 6.15% | 2.11% | 3.19% | 6.89% |
| Operating Income | $-24.10M | $-27.62M | $-23.67M | $14.78M | $-13.13M | $-15.51M | $16.08M | $97.84M | $52.16M | $59.82M | $50.99M | $81.38M | $58.58M | $22.77M | $10.78M | $-3.71M | $7.69M | $-7.91M | $17.68M | $24.46M |
| Operating Income Ratio | -3.88% | -4.11% | -3.30% | 1.83% | -1.74% | -2.59% | 1.80% | 9.69% | 6.66% | 7.50% | 6.03% | 9.92% | 9.76% | 4.63% | 2.32% | -0.92% | 1.75% | -1.95% | 3.23% | 4.47% |
| Total Other Income Expenses Net | $-8.69M | $-342.00K | $-39.09M | $-6.45M | $-5.01M | $-7.21M | $-3.60M | $-2.26M | $-1.96M | $-1.42M | $-832.00K | $-1.50M | $-1.47M | $-1.95M | $-3.41M | $-2.75M | $-1.42M | $-1.22M | $-1.73M | $-2.27M |
| Income Before Tax | $-32.78M | $-27.97M | $-29.15M | $21.06M | $3.54M | $-23.52M | $12.48M | $95.59M | $50.21M | $58.40M | $50.16M | $79.88M | $57.12M | $20.82M | $7.37M | $-6.45M | $6.27M | $-9.13M | $15.95M | $22.19M |
| Income Before Tax Ratio | -5.28% | -4.16% | -4.06% | 2.60% | 0.47% | -3.93% | 1.40% | 9.46% | 6.41% | 7.32% | 5.93% | 9.73% | 9.52% | 4.23% | 1.59% | -1.60% | 1.43% | -2.25% | 2.91% | 4.05% |
| Income Tax Expense | $1.20M | $10.17M | $-3.42M | $7.22M | $-513.00K | $-6.03M | $1.39M | $20.04M | $12.07M | $11.10M | $6.35M | $14.40M | $11.47M | $5.72M | $2.73M | $-1.80M | $1.77M | $-2.53M | $3.94M | $5.76M |
| Net Income | $-33.95M | $-17.96M | $-25.82M | $13.46M | $4.35M | $-17.49M | $10.35M | $74.63M | $37.62M | $46.20M | $42.78M | $63.63M | $44.59M | $14.10M | $3.96M | $-5.00M | $3.88M | $-7.00M | $11.57M | $15.69M |
| Net Income Ratio | -5.47% | -2.67% | -3.60% | 1.66% | 0.58% | -2.92% | 1.16% | 7.39% | 4.80% | 5.79% | 5.06% | 7.75% | 7.43% | 2.87% | 0.85% | -1.24% | 0.88% | -1.72% | 2.11% | 2.87% |
| EPS | $-1.19 | $-0.64 | $-0.92 | $0.48 | $0.16 | $-0.63 | $0.36 | $2.52 | $1.27 | $1.64 | $1.52 | $2.27 | $1.59 | $0.50 | $0.14 | $-0.18 | $0.14 | $-0.26 | $0.42 | $0.57 |
| EPS Diluted | $-1.19 | $-0.64 | $-0.92 | $0.47 | $0.15 | $-0.63 | $0.36 | $2.52 | $1.27 | $1.55 | $1.43 | $2.15 | $1.54 | $0.50 | $0.14 | $-0.18 | $0.14 | $-0.25 | $0.41 | $0.56 |
| Weighted Average Shares Outstanding | 28.45M | 28.07M | 28.02M | 28.11M | 28.08M | 27.69M | 27.80M | 29.62M | 28.23M | 28.16M | 28.08M | 28.05M | 27.99M | 27.81M | 27.73M | 27.37M | 27.72M | 27.01M | 27.46M | 27.51M |
| Weighted Average Shares Outstanding Diluted | 28.45M | 28.22M | 28.11M | 28.66M | 28.62M | 27.72M | 28.89M | 29.62M | 29.71M | 29.89M | 29.88M | 29.54M | 28.86M | 28.48M | 28.30M | 27.72M | 28.14M | 27.52M | 28.34M | 28.07M |
| SEC Filing | Source | Source | Source | Source | Source | Source | Source | Source | Source | Source | Source | Source | Source | Source | Source | Source | Source | Source | Source | Source |
Annual Balance Sheet
| Breakdown | August 31, 2023 | August 31, 2022 | August 31, 2021 | August 31, 2020 | August 31, 2019 |
|---|---|---|---|---|---|
| Cash and Cash Equivalents | $6.03M | $43.80M | $27.82M | $17.89M | $12.38M |
| Short Term Investments | $1.16M | $- | $- | $- | $- |
| Cash and Short Term Investments | $6.03M | $43.80M | $27.82M | $17.89M | $12.38M |
| Net Receivables | $210.44M | $237.65M | $214.10M | $139.15M | $145.62M |
| Inventory | $278.64M | $315.19M | $256.43M | $157.27M | $187.32M |
| Other Current Assets | $55.22M | $74.74M | $44.77M | $48.33M | $120.97M |
| Total Current Assets | $550.34M | $671.39M | $543.11M | $362.63M | $466.29M |
| Property Plant Equipment Net | $822.49M | $786.53M | $693.89M | $627.59M | $456.40M |
| Goodwill | $343.12M | $368.68M | $257.35M | $239.71M | $238.06M |
| Intangible Assets | $32.54M | $26.16M | $3.98M | $4.58M | $4.48M |
| Goodwill and Intangible Assets | $343.12M | $368.68M | $257.35M | $239.71M | $238.06M |
| Long Term Investments | $10.75M | $12.84M | $12.84M | $10.06M | $10.28M |
| Tax Assets | $22.71M | $24.60M | $27.56M | $27.15M | $28.85M |
| Other Non-Current Assets | $-33.46M | $-37.44M | $-40.41M | $-37.21M | $-39.13M |
| Total Non-Current Assets | $1.17B | $1.16B | $951.25M | $867.30M | $694.46M |
| Other Assets | $- | $- | $- | $- | $- |
| Total Assets | $1.72B | $1.83B | $1.49B | $1.23B | $1.16B |
| Account Payables | $209.42M | $217.69M | $179.92M | $106.68M | $110.30M |
| Short Term Debt | $25.65M | $27.70M | $25.07M | $2.18M | $1.32M |
| Tax Payables | $3.25M | $3.86M | $3.52M | $18.25M | $5.87M |
| Deferred Revenue | $-195.68M | $24.60M | $-179.92M | $-106.68M | $-110.30M |
| Other Current Liabilities | $281.29M | $107.73M | $324.26M | $203.23M | $261.04M |
| Total Current Liabilities | $323.93M | $381.57M | $352.85M | $223.66M | $268.23M |
| Long Term Debt | $339.67M | $344.17M | $184.46M | $227.24M | $103.78M |
| Deferred Revenue Non-Current | $-5.58M | $63.33M | $11.79M | $-38.29M | $-25.47M |
| Deferred Tax Liabilities Non-Current | $58.62M | $63.33M | $40.59M | $38.29M | $25.47M |
| Other Non-Current Liabilities | $87.66M | $15.72M | $64.89M | $98.59M | $87.44M |
| Total Non-Current Liabilities | $480.36M | $486.55M | $301.73M | $325.83M | $191.22M |
| Other Liabilities | $- | $- | $- | $- | $- |
| Total Liabilities | $804.29M | $868.12M | $654.58M | $549.49M | $459.45M |
| Preferred Stock | $- | $- | $- | $- | $- |
| Common Stock | $27.51M | $26.95M | $27.53M | $27.10M | $26.66M |
| Retained Earnings | $894.32M | $941.15M | $793.71M | $649.86M | $675.36M |
| Accumulated Other Comprehensive Income Loss | $-39.68M | $-37.09M | $-34.55M | $-36.87M | $-38.76M |
| Other Total Stockholders Equity | $26.04M | $22.98M | $49.07M | $36.62M | $33.70M |
| Total Stockholders Equity | $908.18M | $953.98M | $835.76M | $676.71M | $696.96M |
| Total Equity | $911.66M | $958.47M | $839.78M | $680.44M | $701.30M |
| Total Liabilities and Stockholders Equity | $1.72B | $1.83B | $1.49B | $1.23B | $1.16B |
| Minority Interest | $3.48M | $4.50M | $4.01M | $3.73M | $4.33M |
| Total Liabilities and Total Equity | $1.72B | $1.83B | $1.49B | $1.23B | $1.16B |
| Total Investments | $10.75M | $12.84M | $12.84M | $10.06M | $10.28M |
| Total Debt | $365.31M | $371.87M | $209.53M | $229.42M | $105.10M |
| Net Debt | $359.28M | $328.07M | $181.72M | $211.53M | $92.72M |
Balance Sheet Charts
| Breakdown | February 29, 2024 | November 30, 2023 | August 31, 2023 | May 31, 2023 | February 28, 2023 | November 30, 2022 | August 31, 2022 | May 31, 2022 | February 28, 2022 | November 30, 2021 | August 31, 2021 | May 31, 2021 | February 28, 2021 | November 30, 2020 | August 31, 2020 | May 31, 2020 | February 29, 2020 | November 30, 2019 | August 31, 2019 | May 31, 2019 |
|---|---|---|---|---|---|---|---|---|---|---|---|---|---|---|---|---|---|---|---|---|
| Cash and Cash Equivalents | $13.56M | $4.41M | $6.03M | $4.51M | $11.46M | $3.54M | $43.80M | $16.12M | $17.82M | $19.08M | $27.82M | $17.93M | $11.33M | $7.26M | $17.89M | $307.65M | $10.33M | $9.62M | $12.38M | $8.12M |
| Short Term Investments | $853.00K | $930.00K | $1.16M | $- | $- | $- | $- | $- | $- | $- | $- | $- | $- | $- | $- | $- | $- | $- | $- | $- |
| Cash and Short Term Investments | $14.41M | $5.34M | $6.03M | $4.51M | $11.46M | $3.54M | $43.80M | $16.12M | $17.82M | $19.08M | $27.82M | $17.93M | $11.33M | $7.26M | $17.89M | $307.65M | $10.33M | $9.62M | $12.38M | $8.12M |
| Net Receivables | $218.75M | $191.41M | $210.44M | $297.44M | $240.63M | $218.19M | $237.65M | $285.10M | $280.25M | $304.18M | $214.10M | $266.52M | $217.02M | $166.22M | $139.15M | $151.84M | $164.44M | $120.79M | $145.62M | $171.97M |
| Inventory | $314.42M | $281.06M | $278.64M | $298.98M | $286.73M | $345.20M | $315.19M | $439.70M | $323.93M | $313.87M | $256.43M | $257.23M | $252.27M | $185.35M | $157.27M | $161.54M | $183.57M | $177.93M | $187.32M | $202.19M |
| Other Current Assets | $47.01M | $57.63M | $55.22M | $58.44M | $54.67M | $67.64M | $74.74M | $46.99M | $37.30M | $35.30M | $44.77M | $43.52M | $34.62M | $42.21M | $48.33M | $32.19M | $28.00M | $31.53M | $120.97M | $35.07M |
| Total Current Assets | $594.59M | $535.45M | $550.34M | $659.38M | $593.49M | $634.56M | $671.39M | $787.92M | $659.30M | $672.43M | $543.11M | $585.19M | $515.23M | $401.03M | $362.63M | $653.23M | $386.34M | $339.88M | $466.29M | $417.35M |
| Property Plant Equipment Net | $809.66M | $813.68M | $822.49M | $815.79M | $801.97M | $800.54M | $786.53M | $756.41M | $723.42M | $707.74M | $693.89M | $643.75M | $638.76M | $635.70M | $627.59M | $586.73M | $575.60M | $581.17M | $456.40M | $437.46M |
| Goodwill | $229.32M | $229.34M | $343.12M | $391.26M | $385.63M | $387.51M | $368.68M | $254.51M | $341.61M | $232.37M | $257.35M | $171.23M | $170.10M | $240.81M | $239.71M | $168.59M | $169.12M | $169.29M | $238.06M | $168.95M |
| Intangible Assets | $31.28M | $32.72M | $32.54M | $34.05M | $35.57M | $35.44M | $26.16M | $26.20M | $23.22M | $23.10M | $3.98M | $4.13M | $4.28M | $4.43M | $4.58M | $4.13M | $3.65M | $3.81M | $4.48M | $4.03M |
| Goodwill and Intangible Assets | $260.60M | $262.06M | $343.12M | $391.26M | $385.63M | $387.51M | $368.68M | $280.71M | $341.61M | $255.47M | $257.35M | $175.37M | $174.38M | $240.81M | $239.71M | $172.72M | $172.77M | $173.10M | $238.06M | $172.97M |
| Long Term Investments | $10.49M | $10.27M | $10.75M | $10.12M | $11.68M | $11.25M | $12.84M | $13.46M | $13.01M | $13.26M | $12.84M | $11.34M | $10.38M | $10.93M | $10.06M | $9.90M | $9.67M | $10.43M | $10.28M | $10.63M |
| Tax Assets | $19.46M | $22.44M | $22.71M | $22.70M | $22.25M | $23.11M | $24.60M | $24.99M | $25.98M | $26.57M | $27.56M | $27.20M | $26.20M | $26.08M | $27.15M | $26.69M | $27.74M | $28.30M | $28.85M | $28.53M |
| Other Non-Current Assets | $50.73M | $48.76M | $-33.46M | $-32.81M | $-33.94M | $-34.35M | $-37.44M | $48.94M | $-38.99M | $44.30M | $-40.41M | $42.89M | $40.37M | $-37.01M | $-37.21M | $24.82M | $25.13M | $25.71M | $-39.13M | $25.68M |
| Total Non-Current Assets | $1.15B | $1.16B | $1.17B | $1.21B | $1.19B | $1.19B | $1.16B | $1.12B | $1.07B | $1.05B | $951.25M | $900.55M | $890.10M | $876.50M | $867.30M | $820.87M | $810.91M | $818.71M | $694.46M | $675.27M |
| Other Assets | $- | $- | $- | $- | $- | $- | $- | $- | $- | $- | $- | $- | $- | $- | $- | $- | $- | $- | $- | $- |
| Total Assets | $1.75B | $1.69B | $1.72B | $1.87B | $1.78B | $1.82B | $1.83B | $1.91B | $1.72B | $1.72B | $1.49B | $1.49B | $1.41B | $1.28B | $1.23B | $1.47B | $1.20B | $1.16B | $1.16B | $1.09B |
| Account Payables | $192.20M | $200.57M | $209.42M | $209.79M | $212.60M | $185.17M | $217.69M | $223.82M | $191.42M | $196.85M | $179.92M | $153.45M | $142.72M | $116.51M | $106.68M | $68.48M | $92.48M | $72.17M | $110.30M | $100.39M |
| Short Term Debt | $5.46M | $5.64M | $25.65M | $27.08M | $27.13M | $27.92M | $27.70M | $27.73M | $29.32M | $25.20M | $25.07M | $23.30M | $22.65M | $22.07M | $2.18M | $20.08M | $19.56M | $20.25M | $1.32M | $1.23M |
| Tax Payables | $3.43M | $3.13M | $358.00K | $2.30M | $763.00K | $4.19M | $3.86M | $10.14M | $2.44M | $2.87M | $3.52M | $1.17M | $6.54M | $13.40M | $18.25M | $17.30M | $5.68M | $5.78M | $5.87M | $3.98M |
| Deferred Revenue | $- | $3.13M | $-209.42M | $-198.27M | $22.25M | $23.11M | $-217.69M | $- | $-191.42M | $- | $-179.92M | $- | $- | $-116.51M | $-106.68M | $- | $- | $- | $-110.30M | $- |
| Other Current Liabilities | $102.89M | $92.68M | $297.92M | $301.26M | $58.47M | $68.62M | $350.02M | $119.18M | $297.42M | $123.73M | $324.26M | $118.79M | $92.58M | $177.95M | $203.23M | $59.40M | $65.04M | $59.23M | $261.04M | $71.34M |
| Total Current Liabilities | $303.98M | $305.16M | $323.93M | $342.16M | $321.21M | $309.01M | $381.57M | $380.86M | $329.17M | $348.64M | $352.85M | $296.70M | $264.48M | $213.42M | $223.66M | $165.27M | $182.76M | $157.43M | $268.23M | $176.94M |
| Long Term Debt | $513.73M | $422.67M | $339.67M | $442.26M | $396.63M | $448.74M | $344.17M | $422.85M | $360.93M | $365.41M | $184.46M | $266.96M | $288.19M | $265.40M | $227.24M | $538.75M | $246.20M | $234.68M | $103.78M | $140.90M |
| Deferred Revenue Non-Current | $-46.19M | $-47.66M | $-58.62M | $-7.42M | $55.97M | $57.03M | $-7.86M | $54.95M | $1.55M | $55.09M | $11.79M | $53.89M | $53.97M | $-41.84M | $-38.29M | $48.00M | $45.75M | $45.78M | $-25.47M | $45.51M |
| Deferred Tax Liabilities Non-Current | $46.19M | $47.66M | $58.62M | $61.76M | $55.97M | $57.03M | $63.33M | $62.13M | $53.29M | $51.27M | $40.59M | $42.41M | $42.17M | $41.84M | $38.29M | $32.67M | $23.35M | $22.23M | $25.47M | $20.34M |
| Other Non-Current Liabilities | $126.55M | $128.21M | $140.69M | $88.08M | $22.88M | $22.32M | $86.91M | $23.77M | $74.74M | $24.61M | $64.89M | $23.19M | $22.48M | $110.17M | $98.59M | $15.06M | $14.24M | $13.44M | $87.44M | $15.23M |
| Total Non-Current Liabilities | $594.09M | $503.22M | $480.36M | $584.68M | $531.44M | $585.11M | $486.55M | $563.71M | $490.51M | $496.37M | $301.73M | $386.45M | $406.81M | $375.56M | $325.83M | $634.48M | $329.54M | $316.12M | $191.22M | $221.98M |
| Other Liabilities | $- | $- | $- | $- | $- | $- | $- | $- | $- | $- | $- | $- | $- | $- | $- | $- | $- | $- | $- | $- |
| Total Liabilities | $898.06M | $808.38M | $804.29M | $926.84M | $852.66M | $894.12M | $868.12M | $944.57M | $819.68M | $845.01M | $654.58M | $683.15M | $671.29M | $588.99M | $549.49M | $799.75M | $512.30M | $473.56M | $459.45M | $398.92M |
| Preferred Stock | $- | $- | $- | $- | $- | $- | $- | $- | $- | $- | $- | $- | $- | $- | $- | $- | $- | $- | $- | $- |
| Common Stock | $27.98M | $27.86M | $27.51M | $27.51M | $27.45M | $27.36M | $26.95M | $27.45M | $27.63M | $27.82M | $27.53M | $27.52M | $27.46M | $27.45M | $27.10M | $27.10M | $27.10M | $27.14M | $26.66M | $26.78M |
| Retained Earnings | $831.64M | $870.98M | $894.32M | $925.40M | $917.27M | $918.09M | $941.15M | $936.06M | $866.78M | $834.50M | $793.71M | $756.26M | $697.97M | $658.71M | $649.86M | $651.16M | $661.42M | $662.71M | $675.36M | $668.93M |
| Accumulated Other Comprehensive Income Loss | $-39.68M | $-40.10M | $-39.68M | $-40.19M | $-40.60M | $-39.30M | $-37.09M | $-34.24M | $-34.44M | $-35.28M | $-34.55M | $-30.73M | $-35.28M | $-36.89M | $-36.87M | $-40.90M | $-39.04M | $-38.52M | $-38.76M | $-39.42M |
| Other Total Stockholders Equity | $24.50M | $22.26M | $26.04M | $23.29M | $20.83M | $18.58M | $22.98M | $34.43M | $40.82M | $43.64M | $49.07M | $44.98M | $39.70M | $35.31M | $36.62M | $33.26M | $31.17M | $29.53M | $33.70M | $32.74M |
| Total Stockholders Equity | $844.44M | $880.99M | $908.18M | $936.01M | $924.95M | $924.74M | $953.98M | $963.69M | $900.79M | $870.69M | $835.76M | $798.03M | $729.84M | $684.58M | $676.71M | $670.63M | $680.65M | $680.85M | $696.96M | $689.03M |
| Total Equity | $847.47M | $884.28M | $911.66M | $939.59M | $928.44M | $928.50M | $958.47M | $967.87M | $904.65M | $874.76M | $839.78M | $802.58M | $734.04M | $688.55M | $680.44M | $674.35M | $684.95M | $685.04M | $701.30M | $693.70M |
| Total Liabilities and Stockholders Equity | $1.75B | $1.69B | $1.72B | $1.87B | $1.78B | $1.82B | $1.83B | $1.91B | $1.72B | $1.72B | $1.49B | $1.49B | $1.41B | $1.28B | $1.23B | $1.47B | $1.20B | $1.16B | $1.16B | $1.09B |
| Minority Interest | $3.03M | $3.28M | $3.48M | $3.58M | $3.49M | $3.77M | $4.50M | $4.18M | $3.86M | $4.07M | $4.01M | $4.55M | $4.20M | $3.97M | $3.73M | $3.72M | $4.30M | $4.18M | $4.33M | $4.68M |
| Total Liabilities and Total Equity | $1.75B | $1.69B | $1.72B | $1.87B | $1.78B | $1.82B | $1.83B | $1.91B | $1.72B | $1.72B | $1.49B | $1.49B | $1.41B | $1.28B | $1.23B | $1.47B | $1.20B | $1.16B | $1.16B | $1.09B |
| Total Investments | $11.34M | $11.20M | $10.75M | $10.12M | $11.68M | $11.25M | $12.84M | $13.46M | $13.01M | $13.26M | $12.84M | $11.34M | $10.38M | $10.93M | $10.06M | $9.90M | $9.67M | $10.43M | $10.28M | $10.63M |
| Total Debt | $473.00M | $380.65M | $365.31M | $469.34M | $423.75M | $476.65M | $371.87M | $450.58M | $390.25M | $390.60M | $209.53M | $290.25M | $310.84M | $287.47M | $229.42M | $558.84M | $265.76M | $254.93M | $105.10M | $142.13M |
| Net Debt | $459.44M | $376.24M | $359.28M | $464.83M | $412.30M | $473.11M | $328.07M | $434.46M | $372.43M | $371.52M | $181.72M | $272.32M | $299.52M | $280.21M | $211.53M | $251.18M | $255.44M | $245.31M | $92.72M | $134.01M |
Annual Cash Flow
| Breakdown | August 31, 2023 | August 31, 2022 | August 31, 2021 | August 31, 2020 | August 31, 2019 |
|---|---|---|---|---|---|
| Net Income | $-25.44M | $172.00M | $169.97M | $-2.20M | $58.32M |
| Depreciation and Amortization | $89.76M | $75.05M | $58.60M | $58.17M | $53.34M |
| Deferred Income Tax | $-3.93M | $25.05M | $6.88M | $15.10M | $14.61M |
| Stock Based Compensation | $11.19M | $18.52M | $18.21M | $10.03M | $17.30M |
| Change in Working Capital | $16.49M | $-59.01M | $-61.70M | $36.10M | $391.00K |
| Accounts Receivables | $11.64M | $633.00K | $-84.09M | $-2.25M | $9.48M |
| Inventory | $48.04M | $-37.23M | $-88.62M | $39.23M | $33.47M |
| Accounts Payables | $5.46M | $20.58M | $64.96M | $-7.97M | $-17.07M |
| Other Working Capital | $-48.64M | $-42.99M | $46.06M | $7.10M | $-25.48M |
| Other Non Cash Items | $51.30M | $6.07M | $-1.91M | $7.39M | $778.00K |
| Net Cash Provided by Operating Activities | $139.36M | $237.68M | $190.06M | $124.60M | $144.74M |
| Investments in Property Plant and Equipment | $-129.52M | $-150.12M | $-118.87M | $-82.00M | $-94.61M |
| Acquisitions Net | $-26.90M | $-184.72M | $- | $- | $-912.00K |
| Purchases of Investments | $- | $-5.00M | $- | $- | $94.61M |
| Sales Maturities of Investments | $- | $- | $- | $- | $1.89M |
| Other Investing Activities | $12.45M | $23.70M | $1.22M | $3.15M | $-90.54M |
| Net Cash Used for Investing Activities | $-143.97M | $-316.15M | $-117.65M | $-78.86M | $-89.56M |
| Debt Repayment | $- | $- | $- | $- | $- |
| Common Stock Issued | $7.63M | $- | $5.64M | $690.16M | $431.05M |
| Common Stock Repurchased | $-7.63M | $-34.25M | $-5.64M | $-914.00K | $-13.08M |
| Dividends Paid | $-21.19M | $-21.29M | $-21.26M | $-20.88M | $-20.61M |
| Other Financing Activities | $-11.95M | $115.86M | $-41.56M | $-19.62M | $-26.65M |
| Net Cash Used Provided by Financing Activities | $-33.13M | $94.57M | $-62.82M | $-40.50M | $-47.27M |
| Effect of Forex Changes on Cash | $-32.00K | $-119.00K | $337.00K | $272.00K | $-255.00K |
| Net Change in Cash | $-37.77M | $15.98M | $9.93M | $5.51M | $7.65M |
| Cash at End of Period | $6.03M | $43.80M | $27.82M | $17.89M | $12.38M |
| Cash at Beginning of Period | $43.80M | $27.82M | $17.89M | $12.38M | $4.72M |
| Operating Cash Flow | $139.36M | $237.68M | $190.06M | $124.60M | $144.74M |
| Capital Expenditure | $-129.52M | $-150.12M | $-118.87M | $-82.00M | $-94.61M |
| Free Cash Flow | $9.85M | $87.56M | $71.20M | $42.59M | $50.13M |
Cash Flow Charts
| Breakdown | February 29, 2024 | November 30, 2023 | August 31, 2023 | May 31, 2023 | February 28, 2023 | November 30, 2022 | August 31, 2022 | May 31, 2022 | February 28, 2022 | November 30, 2021 | August 31, 2021 | May 31, 2021 | February 28, 2021 | November 30, 2020 | August 31, 2020 | May 31, 2020 | February 29, 2020 | November 30, 2019 | August 31, 2019 | May 31, 2019 |
|---|---|---|---|---|---|---|---|---|---|---|---|---|---|---|---|---|---|---|---|---|
| Net Income | $-33.98M | $-17.96M | $-25.76M | $13.61M | $4.27M | $-17.56M | $11.05M | $75.50M | $38.16M | $47.28M | $43.80M | $65.44M | $45.68M | $15.06M | $4.58M | $-4.72M | $4.50M | $-6.57M | $11.97M | $16.44M |
| Depreciation and Amortization | $24.31M | $23.47M | $23.37M | $22.54M | $22.40M | $21.45M | $20.49M | $18.75M | $18.60M | $17.22M | $14.98M | $14.33M | $14.47M | $14.83M | $14.96M | $14.74M | $14.38M | $14.09M | $13.69M | $13.15M |
| Deferred Income Tax | $1.20M | $-10.83M | $-3.00M | $5.40M | $-596.00K | $-5.74M | $1.20M | $9.86M | $2.76M | $11.23M | $-4.51M | $5.85M | $774.00K | $4.77M | $6.53M | $9.63M | $1.40M | $-2.46M | $5.21M | $4.51M |
| Stock Based Compensation | $2.37M | $1.38M | $2.75M | $3.29M | $2.33M | $2.82M | $4.47M | $4.82M | $4.84M | $4.39M | $4.23M | $6.71M | $4.29M | $2.98M | $3.32M | $2.07M | $2.49M | $2.15M | $3.86M | $3.63M |
| Change in Working Capital | $-43.87M | $2.23M | $93.41M | $-69.32M | $59.88M | $-67.47M | $141.93M | $-67.22M | $-19.09M | $-114.63M | $82.12M | $-38.20M | $-61.21M | $-44.40M | $37.59M | $15.30M | $-19.46M | $2.67M | $48.42M | $732.00K |
| Accounts Receivables | $-30.34M | $15.83M | $82.65M | $-57.10M | $-30.84M | $16.93M | $43.97M | $4.42M | $20.73M | $-68.49M | $49.08M | $-57.20M | $-46.84M | $-29.12M | $-6.17M | $22.25M | $-46.54M | $28.20M | $19.26M | $-6.46M |
| Inventory | $-30.72M | $293.00K | $24.82M | $-10.62M | $61.68M | $-27.85M | $126.96M | $-111.57M | $-7.04M | $-45.58M | $3.49M | $-1.96M | $-64.22M | $-25.93M | $6.47M | $23.69M | $-2.80M | $11.87M | $18.63M | $-963.00K |
| Accounts Payables | $- | $353.00K | $-4.80M | $-1.99M | $30.94M | $-18.69M | $-24.30M | $33.11M | $-8.75M | $20.51M | $8.56M | $11.34M | $26.04M | $19.02M | $24.52M | $-24.19M | $20.66M | $-28.95M | $2.41M | $4.13M |
| Other Working Capital | $17.18M | $-13.89M | $-9.27M | $385.00K | $-1.90M | $-37.86M | $-4.71M | $6.82M | $-24.03M | $-21.07M | $20.99M | $9.62M | $23.82M | $-8.37M | $12.76M | $-6.45M | $9.23M | $-8.44M | $8.12M | $4.01M |
| Other Non Cash Items | $-3.92M | $-10.41M | $44.07M | $3.32M | $-438.00K | $4.35M | $527.00K | $3.58M | $1.71M | $498.00K | $-2.28M | $-1.84M | $1.64M | $-1.35M | $3.58M | $4.32M | $4.41M | $2.48M | $-2.89M | $2.47M |
| Net Cash Provided by Operating Activities | $-55.09M | $-1.30M | $134.83M | $-21.16M | $87.84M | $-62.15M | $179.67M | $45.29M | $46.98M | $-34.27M | $139.47M | $53.20M | $4.82M | $-7.43M | $68.76M | $39.18M | $5.52M | $11.13M | $81.71M | $39.70M |
| Investments in Property Plant and Equipment | $-14.98M | $-24.81M | $-28.25M | $-26.76M | $-26.99M | $-47.52M | $-52.15M | $-28.56M | $-29.69M | $-39.72M | $-42.14M | $-21.65M | $-23.26M | $-31.83M | $-22.72M | $-22.19M | $-13.13M | $-23.97M | $-33.61M | $-19.70M |
| Acquisitions Net | $- | $- | $- | $- | $- | $-26.90M | $-2.65M | $-68.13M | $- | $-113.94M | $- | $- | $- | $- | $- | $- | $- | $- | $912.00K | $- |
| Purchases of Investments | $- | $- | $- | $- | $- | $- | $-5.00M | $- | $- | $- | $- | $- | $- | $- | $- | $- | $- | $- | $- | $- |
| Sales Maturities of Investments | $- | $- | $- | $- | $- | $- | $- | $- | $- | $- | $- | $- | $- | $- | $- | $- | $- | $- | $630.00K | $- |
| Other Investing Activities | $-4.48M | $609.00K | $1.67M | $7.75M | $807.00K | $2.22M | $532.00K | $7.12M | $406.00K | $-29.08M | $-42.01M | $-21.50M | $-22.39M | $-31.75M | $-20.94M | $-22.06M | $-11.89M | $-23.97M | $-31.18M | $-18.20M |
| Net Cash Used for Investing Activities | $-19.46M | $-24.20M | $-26.57M | $-19.01M | $-26.18M | $-72.20M | $-54.27M | $-89.58M | $-29.28M | $-143.01M | $-42.01M | $-21.50M | $-22.39M | $-31.75M | $-20.94M | $-22.06M | $-11.89M | $-23.97M | $-30.55M | $-18.20M |
| Debt Repayment | $- | $- | $- | $- | $- | $- | $- | $- | $- | $- | $- | $- | $- | $- | $- | $- | $- | $- | $- | $- |
| Common Stock Issued | $- | $- | $18.00K | $802.00K | $2.00K | $6.81M | $159.93M | $490.08M | $- | $- | $- | $- | $- | $- | $- | $- | $130.04M | $- | $114.37M | $- |
| Common Stock Repurchased | $-1.00K | $-4.80M | $-18.00K | $-802.00K | $-2.00K | $-6.81M | $-16.39M | $-9.99M | $-7.87M | $-9.58M | $-203.00K | $-1.46M | $-1.00K | $-3.97M | $- | $- | $-914.00K | $-5.84M | $-3.00M | $-21.00K |
| Dividends Paid | $-5.25M | $-5.55M | $-5.16M | $-5.35M | $-5.13M | $-5.54M | $-5.12M | $-5.33M | $-5.27M | $-5.57M | $-5.19M | $-5.24M | $-5.15M | $-5.68M | $-5.08M | $-5.07M | $-5.08M | $-5.65M | $-5.01M | $-5.03M |
| Other Financing Activities | $89.03M | $29.37M | $-101.60M | $38.56M | $-48.59M | $99.67M | $-92.68M | $48.07M | $-13.70M | $174.17M | $-82.09M | $-20.31M | $26.60M | $34.24M | $-332.98M | $285.44M | $12.20M | $15.72M | $-41.80M | $-21.48M |
| Net Cash Used Provided by Financing Activities | $83.78M | $23.82M | $-106.76M | $33.21M | $-53.72M | $94.13M | $-97.80M | $42.74M | $-18.98M | $168.61M | $-87.29M | $-25.55M | $21.45M | $28.56M | $-338.06M | $280.37M | $7.12M | $10.07M | $-46.82M | $-26.50M |
| Effect of Forex Changes on Cash | $-73.00K | $58.00K | $23.00K | $9.00K | $-24.00K | $-40.00K | $76.00K | $-154.00K | $18.00K | $-59.00K | $-282.00K | $444.00K | $186.00K | $-11.00K | $467.00K | $-164.00K | $-44.00K | $13.00K | $-79.00K | $-58.00K |
| Net Change in Cash | $9.15M | $-1.62M | $1.52M | $-6.95M | $7.92M | $-40.26M | $27.68M | $-1.70M | $-1.26M | $-8.74M | $9.89M | $6.60M | $4.07M | $-10.63M | $-289.77M | $297.33M | $702.00K | $-2.75M | $4.26M | $-5.05M |
| Cash at End of Period | $13.56M | $4.41M | $6.03M | $4.51M | $11.46M | $3.54M | $43.80M | $16.12M | $17.82M | $19.08M | $27.82M | $17.93M | $11.33M | $7.26M | $17.89M | $307.65M | $10.33M | $9.62M | $12.38M | $8.12M |
| Cash at Beginning of Period | $4.41M | $6.03M | $4.51M | $11.46M | $3.54M | $43.80M | $16.12M | $17.82M | $19.08M | $27.82M | $17.93M | $11.33M | $7.26M | $17.89M | $307.65M | $10.33M | $9.62M | $12.38M | $8.12M | $13.17M |
| Operating Cash Flow | $-55.09M | $-1.30M | $134.83M | $-21.16M | $87.84M | $-62.15M | $179.67M | $45.29M | $46.98M | $-34.27M | $139.47M | $53.20M | $4.82M | $-7.43M | $68.76M | $39.18M | $5.52M | $11.13M | $81.71M | $39.70M |
| Capital Expenditure | $-14.98M | $-24.81M | $-28.25M | $-26.76M | $-26.99M | $-47.52M | $-52.15M | $-28.56M | $-29.69M | $-39.72M | $-42.14M | $-21.65M | $-23.26M | $-31.83M | $-22.72M | $-22.19M | $-13.13M | $-23.97M | $-33.61M | $-19.70M |
| Free Cash Flow | $-70.08M | $-26.11M | $106.58M | $-47.92M | $60.85M | $-109.67M | $127.52M | $16.73M | $17.29M | $-73.99M | $97.33M | $31.56M | $-18.44M | $-39.26M | $46.04M | $17.00M | $-7.61M | $-12.84M | $48.09M | $20.00M |
Schnitzer Steel Industries Dividends
Explore Schnitzer Steel Industries's dividend history, including dividend yield, payout ratio, and historical payments.
Dividend Yield
2.29%
Dividend Payout Ratio
-82.14%
Dividend Paid & Capex Coverage Ratio
0.92x
Schnitzer Steel Industries Dividend History
| Dividend | Adjusted Dividend | Date | Record Date | Payment Date | Declaration Date |
|---|---|---|---|---|---|
| $0.1875 | $0.1875 | July 14, 2023 | July 17, 2023 | July 31, 2023 | June 27, 2023 |
| $0.1875 | $0.1875 | April 21, 2023 | April 24, 2023 | May 08, 2023 | April 05, 2023 |
| $0.188 | $0.1875 | January 30, 2023 | January 31, 2023 | February 14, 2023 | January 05, 2023 |
| $0.188 | $0.1875 | November 09, 2022 | November 10, 2022 | November 29, 2022 | October 24, 2022 |
| $0.188 | $0.1875 | July 08, 2022 | July 11, 2022 | July 25, 2022 | June 29, 2022 |
| $0.188 | $0.1875 | April 14, 2022 | April 18, 2022 | May 02, 2022 | April 06, 2022 |
| $0.1875 | $0.1875 | January 28, 2022 | January 31, 2022 | February 14, 2022 | January 04, 2022 |
| $0.188 | $0.1875 | November 05, 2021 | November 08, 2021 | November 22, 2021 | October 21, 2021 |
| $0.188 | $0.1875 | July 09, 2021 | July 12, 2021 | July 26, 2021 | June 30, 2021 |
| $0.1875 | $0.1875 | April 16, 2021 | April 19, 2021 | May 03, 2021 | April 07, 2021 |
| $0.1875 | $0.1875 | January 14, 2021 | January 18, 2021 | February 01, 2021 | January 07, 2021 |
| $0.188 | $0.1875 | October 30, 2020 | November 02, 2020 | November 16, 2020 | October 22, 2020 |
| $0.1875 | $0.1875 | August 07, 2020 | August 10, 2020 | August 24, 2020 | July 31, 2020 |
| $0.1875 | $0.1875 | May 08, 2020 | May 11, 2020 | May 26, 2020 | April 30, 2020 |
| $0.1875 | $0.1875 | February 07, 2020 | February 10, 2020 | February 24, 2020 | January 28, 2020 |
| $0.1875 | $0.1875 | November 15, 2019 | November 18, 2019 | November 29, 2019 | November 05, 2019 |
| $0.1875 | $0.1875 | August 12, 2019 | August 13, 2019 | August 27, 2019 | July 30, 2019 |
| $0.1875 | $0.1875 | May 10, 2019 | May 13, 2019 | May 28, 2019 | April 26, 2019 |
| $0.1875 | $0.1875 | February 08, 2019 | February 11, 2019 | February 25, 2019 | January 29, 2019 |
| $0.1875 | $0.1875 | November 08, 2018 | November 12, 2018 | November 26, 2018 | October 31, 2018 |
Schnitzer Steel Industries News
Read the latest news about Schnitzer Steel Industries, including recent articles, headlines, and updates.
Radius Recycling Announces Ticker Symbol Change
PORTLAND, Ore.--(BUSINESS WIRE)--Schnitzer Steel Industries, Inc. dba Radius Recycling (NASDAQ: SCHN) announced that the Company's common stock will begin trading on NASDAQ under the symbol ‘RDUS' at the open of market trading on September 1, 2023, which coincides with the start of the Company's fiscal year. ‘RDUS' will replace the Company's current ticker symbol ‘SCHN,' which has been used since its initial public offering in 1993. The new ticker symbol aligns with the Company's rebranding fro.

Schnitzer Steel Rebrands as Radius Recycling to Reflect Company's Vision, Purpose, and Impact on Circular Economy
PORTLAND, Ore.--(BUSINESS WIRE)--Schnitzer Steel Industries, Inc. (NASDAQ: SCHN) today unveiled its new corporate name and identity, Radius Recycling, as part of a rebranding initiative to reflect the Company's vision, purpose, and impact on the global economy. For more than a century, the Company has developed robust networks to collect, process, and deliver recycled metals to customers around the world. As the global economy accelerates its shift toward low carbon technologies, the demand for.

Schnitzer Steel Industries: Justifying The High Current Valuation
Schnitzer Steel Industries is a promising investment, despite its high forward P/E, due to its growth projections and strong balance sheet. The company's focus on recycled metals offers exposure to a niche industry and aligns with global efforts to reduce emissions. Despite fluctuations in commodity prices, SCHN maintains a positive bottom line and is expected to benefit from increasing demand for recycled metals.

Schnitzer Steel: Set Up For Long-Term Strength
Schnitzer Steel's NASDAQ: SCHN Q3 results echoed those of Commercial Metals Company NYSE: CMC but the impact on the stock price was the opposite. The report's takeaways are that industry normalization has revenue and earnings down compared to last year, but signs of normalization and underlying market strength have emerged.

Schnitzer Steel Industries, Inc. (SCHN) Q2 2023 Earnings Call Transcript
Schnitzer Steel Industries, Inc. (NASDAQ:SCHN ) Q2 2023 Earnings Conference Call April 5, 2023 11:30 AM ET Company Participants Michael Bennett - Investor Relations Tamara Lundgren - Chairman and Chief Executive Officer Stefano Gaggini - Chief Financial Officer Conference Call Participants Emily Chieng - Goldman Sachs Operator Good day and thank you for standing by and welcome to Q2 Fiscal 2023 Earnings Call. [Operator Instructions] Please be advised that today's conference is being recorded.

7 of the Most Highly Rated ESG Companies to Invest in Now
One of the secondary consequences of Russia's invasion of Ukraine was the impact of environmental, social, and governance ( ESG ) initiatives, negatively affecting even the most highly rated ESG companies. Essentially, the war sparked immediate demand for weaponry, resulting in poor outcomes for the environment.

AMC Networks And 2 Other Undervalued Acquisition Candidates With Unexploited Potential
AMC Network: strong content and underlying asset base. Totally unqualified board and management. HNI Corporation: Stock has gone nowhere in 25 years. Two autonomous divisions would allow an acquirer to sell off one and offset most or all of the purchase cost.

Schnitzer Steel Industries, Inc. (SCHN) Q1 2023 Earnings Call Transcript
Schnitzer Steel Industries, Inc. (NASDAQ:SCHN ) Q1 2023 Earnings Conference Call January 5, 2023 11:30 AM ET Company Participants Michael Bennett - VP, IR Tamara Lundgren - Chairman and CEO Stefano Gaggini - CFO Conference Call Participants Emily Chang - Goldman Sachs Operator Good day and thank you for standing by. Welcome to the Schnitzer Steel's First Quarter Fiscal 2023 Earnings Presentation.

Schnitzer Reports First Quarter Fiscal 2023 Financial Results
PORTLAND, Ore.--(BUSINESS WIRE)--Schnitzer Steel Industries, Inc. (NASDAQ: SCHN) today reported results for its first quarter of fiscal 2023 ended November 30, 2022. First Quarter Fiscal 2023 Highlights Diluted loss per share from continuing operations of $(0.64). Net loss of $(18) million and net loss per ferrous ton of $(21). Adjusted diluted loss per share from continuing operations of $(0.44), which excludes charges of $7 million related primarily to asset impairments and restructuring charges and other exit-related activities. Adjusted EBITDA of $8 million and adjusted EBITDA per ferrous ton of $10. Results reflect an adverse impact of approximately $18 million or $21 per ferrous ton from extended operational disruptions at the Everett and Oakland metals recycling facilities that were resolved in November. The Company's performance in the quarter reflected lower demand and lower average selling prices for recycled metals and finished steel products. Demand softened throughout the quarter, influenced by macro concerns, including slower growth, inflationary pressures, and steel inventory destocking. Lower prices led to tighter supply flows and compression of metal spreads. Ferrous and nonferrous sales volumes declined sequentially reflecting the impact of the disruptions in Everett and Oakland, the tighter supply flows and several ferrous shipments slipping into December. In the first quarter, the Company achieved nearly the full run rate of benefits from the $40 million of cost reduction and productivity initiatives previously announced in October, which mitigated the impact of inflation on operating costs and has increased the full-year target of productivity initiatives by $20 million. During the quarter, the Company made progress on its strategic growth investments in advanced metal recovery technologies and began the commissioning of two primary nonferrous recovery systems in Massachusetts and California. In addition, on November 18, 2022, the Company purchased the operating assets of ScrapSource LLC, a recycling services business based in Dallas, Texas. ScrapSource provides metals recycling management services and solutions to over five hundred customers, representing manufacturers, fabrication facilities and service centers across North America. Combined with the Company's existing national accounts team, this acquisition is expected to significantly expand the Company's recycled services volumes and extend this business into additional regional markets across the U.S. Tamara Lundgren, Chairman and Chief Executive Officer, stated, “Although the past several months have been challenging as we faced weakening market conditions and short-term operational disruptions that are now resolved, we are continuing to progress our strategic initiatives centered on advanced metal recovery technologies, volume growth, and productivity improvements. Since the end of the quarter, we have seen a strengthening in selling prices and demand for recycled metals in both the export and domestic markets and we are expecting significant sequential improvements in our second quarter results.” Ms. Lundgren continued, “Last month, we published our Fiscal 2022 Sustainability Report, Recycled Metals for a Low-Carbon Future. We made significant progress towards our People, Planet, and Profit goals, including achieving 100% net carbon-free electricity use across our operations for a second consecutive year and reducing Scope 1 and 2 greenhouse gas emissions from recycling operations by 24% against a 2019 baseline. We also launched GRN Steel™, our line of net zero carbon emissions steel products. By supplying our global customers with high quality, low-carbon recycled metals that are critical to the production of sustainable products and infrastructure, we are continuing to deliver on our commitment to creating a more sustainable future.” Summary Results ($ in millions, except per share amounts, and prices per ton/pound) Quarter 1Q23 4Q22 1Q22 Revenues $ 599 $ 894 $ 798 Gross margin (total revenues less cost of goods sold) $ 49 $ 85 $ 115 Selling, general and administrative expense $ 64 $ 69 $ 55 Net (loss) income $ (18 ) $ 11 $ 47 Net (loss) income per ferrous ton $ (21 ) $ 9 $ 41 Diluted (loss) earnings per share from continuing operations attributable to SSI shareholders Reported $ (0.64 ) $ 0.36 $ 1.55 Adjusted(1) $ (0.44 ) $ 0.50 $ 1.58 Adjusted EBITDA(1) $ 8 $ 40 $ 78 Adjusted EBITDA per ferrous ton(1)(4) $ 10 $ 32 $ 68 Ferrous sales volumes (LT, in thousands) 851 1,268 1,148 Avg. net ferrous sales prices ($/LT)(2) $ 340 $ 387 $ 446 Nonferrous sales volumes (pounds, in millions)(3) 163 186 153 Avg. nonferrous sales prices ($/pound)(2)(3) $ 0.90 $ 1.05 $ 1.05 Finished steel average net sales price ($/ST)(2) $ 1,015 $ 1,118 $ 979 Finished steel sales volumes (ST, in thousands) 118 125 99 Rolling mill utilization (%) 81 % 93 % 78 % (1) See Non-GAAP Financial Measures for reconciliation to U.S. GAAP. (2) Price information is shown after netting the cost of freight incurred to deliver the product to the customer. (3) Nonferrous sales volumes and average nonferrous prices excludes platinum group metals (“PGMs”) in catalytic converters. (4) May not foot due to rounding. First Quarter Fiscal 2023 Financial Review and Analysis Net loss per ferrous ton was $(21) and adjusted EBITDA per ferrous ton was $10 in the first quarter of fiscal 2023. Sequential performance was impacted by lower average selling prices and sales volumes for recycled ferrous and nonferrous metals and finished steel products. Lower prices led to tighter supply flows and compression of metal spreads. Results reflected an estimated adverse impact of approximately $18 million or $21 per ferrous ton from the extended operational disruptions at the Everett and Oakland recycling facilities that were resolved in November. After delivering a nearly full run rate of benefits in the first quarter from the previously announced productivity initiatives targeting annual benefits of $40 million, the Company is expanding the scope of the initiatives by targeting an additional $20 million in cost reductions annually, which primarily focus on SG&A expense. Ferrous and nonferrous sales volumes in the first quarter of fiscal 2023 were down 33% and 12% sequentially, which included the impact on supply flows and sales volumes from the disruptions in Everett and Oakland and several ferrous shipments slipping into December. Average ferrous and nonferrous net selling prices were down sequentially 12% and 14%, respectively. Finished steel sales volumes were down 6% sequentially, and rolling mill utilization averaged 81% in the quarter. Average net selling prices for finished steel products were down 9% sequentially. The detriment from average inventory accounting was approximately $2 per ferrous ton. The first quarter of fiscal 2023 had negative operating cash flow of $62 million, reflecting an increase in net working capital due to higher inventories due to the shipment delays and the annual payment of incentive compensation accrued in fiscal 2022. Total debt at the end of the quarter was $358 million, and debt, net of cash, was $354 million. Capital expenditures were $48 million in the quarter, including investments in advanced metal recovery technologies, maintaining the business and environmental projects. The sequential increase in debt also reflects a $25 million investment for the purchase of the assets of ScrapSource in November (for a reconciliation of adjusted results and debt, net of cash, to U.S. GAAP, see the table provided in the Non-GAAP Financial Measures section). The Company’s effective tax rate for the first quarter of fiscal 2023 was a benefit of 26%. During the first quarter, the Company returned capital to shareholders through its 115th consecutive quarterly dividend. Declaration of Quarterly Dividend The Board of Directors declared a cash dividend of $0.1875 per common share, payable February 14, 2023 to shareholders of record on January 31, 2023. Schnitzer has paid a dividend every quarter since going public in November 1993. Analysts’ Conference Call: First Quarter of Fiscal 2023 A conference call and slide presentation to discuss results will be held today, January 5, 2023, at 11:30 a.m. Eastern and will be hosted by Tamara L. Lundgren, Chairman and Chief Executive Officer, and Stefano Gaggini, Senior Vice President and Chief Financial Officer. The call and the slide presentation will be webcast and accessible on the Company’s website under Company > Investors > Event Calendar at www.schnitzersteel.com/company/investors/event-calendar. Summary financial data is provided in the following pages. The slide presentation and related materials will be available prior to the call on the above website. About Schnitzer Steel Industries, Inc. Schnitzer Steel Industries, Inc. operates at the intersection of metals recovery, reuse, recycling, and manufacturing. Schnitzer is one of the largest manufacturers and exporters of recycled metal products in North America with operating facilities located in 25 states, Puerto Rico, and Western Canada. Schnitzer has seven deep water export facilities located on both the East and West Coasts and in Hawaii and Puerto Rico. The Company’s integrated operating platform also includes 51 stores which sell serviceable used auto parts from salvaged vehicles and receive over 4.1 million annual retail visits. The Company’s steel manufacturing operations produce finished steel products, including rebar, wire rod, and other specialty products. The Company began operations in 1906 in Portland, Oregon. SCHNITZER STEEL INDUSTRIES, INC. CONDENSED CONSOLIDATED STATEMENTS OF OPERATIONS ($ in thousands, except per share amounts) (Unaudited) Three Months Ended November 30, 2022 August 31, 2022 November 30, 2021 Revenues $ 598,730 $ 894,412 $ 798,118 Cost of goods sold 550,011 809,587 683,244 Selling, general and administrative expense 64,228 69,237 55,267 Income from joint ventures (790 ) (1,151 ) (236 ) Asset impairment charges — 638 — Restructuring charges and other exit-related activities 1,592 25 22 Operating (loss) income (16,311 ) 16,076 59,821 Interest expense (3,324 ) (3,042 ) (1,372 ) Other loss, net (3,884 ) (556 ) (47 ) (Loss) income from continuing operations before income taxes (23,519 ) 12,478 58,402 Income tax benefit (expense) 6,032 (1,390 ) (11,097 ) (Loss) income from continuing operations (17,487 ) 11,088 47,305 Loss from discontinued operations, net of tax (69 ) (37 ) (29 ) Net (loss) income (17,556 ) 11,051 47,276 Net income attributable to noncontrolling interests (232 ) (699 ) (1,077 ) Net (loss) income attributable to SSI shareholders $ (17,788 ) $ 10,352 $ 46,199 Net (loss) income per share attributable to SSI shareholders: Basic: (Loss) income per share from continuing operations $ (0.64 ) $ 0.37 $ 1.64 Net (loss) income per share $ (0.64 ) $ 0.37 $ 1.64 Diluted: (Loss) income per share from continuing operations $ (0.64 ) $ 0.36 $ 1.55 Net (loss) income per share $ (0.64 ) $ 0.36 $ 1.55 Weighted average number of common shares: Basic 27,723 27,803 28,159 Diluted 27,723 28,892 29,885 Dividends declared per common share $ 0.1875 $ 0.1875 $ 0.1875 SELECTED OPERATING STATISTICS (Unaudited) 1Q23 Total ferrous volumes (LT, in thousands)(1) 851 Total nonferrous volumes (pounds, in thousands)(1)(2) 162,720 Ferrous selling prices ($/LT)(3) Domestic $ 313 Foreign $ 356 Average $ 340 Ferrous sales volume (LT, in thousands) Domestic 432 Foreign 418 Total(6) 851 Nonferrous average price ($/pound)(2)(3) $ 0.90 Cars purchased (in thousands)(4) 69 Auto stores at period end 51 Finished steel average sales price ($/ST)(3) $ 1,015 Sales volume (ST, in thousands) Rebar 101 Coiled products 16 Merchant bar and other 1 Finished steel products sold 118 Rolling mill utilization(5) 81 % (1) Ferrous and nonferrous volumes sold externally and delivered to our steel mill for finished steel production. (2) Excludes platinum group metals (“PGMs”) in catalytic converters. (3) Price information is shown after netting the cost of freight incurred to deliver the product to the customer. (4) Cars purchased by auto parts stores only. (5) Rolling mill utilization is based on effective annual production capacity under current conditions of 580 thousand tons of finished steel products. (6) May not foot due to rounding. SELECTED OPERATING STATISTICS (Unaudited) FY 1Q22 2Q22 3Q22 4Q22 2022(6) Total ferrous volumes (LT, in thousands)(1) 1,148 1,071 1,129 1,268 4,616 Total nonferrous volumes (pounds, in thousands)(1)(2) 153,227 147,145 201,413 185,634 687,419 Ferrous selling prices ($/LT)(3) Domestic $ 431 $ 418 $ 516 $ 389 $ 438 Foreign $ 450 $ 455 $ 552 $ 387 $ 457 Average $ 446 $ 445 $ 541 $ 387 $ 452 Ferrous sales volume (LT, in thousands) Domestic 430 408 490 477 1,806 Foreign 718 663 639 791 2,810 Total 1,148 1,071 1,129 1,268 4,616 Nonferrous average price ($/pound)(2)(3) $ 1.05 $ 1.10 $ 1.12 $ 1.05 $ 1.08 Cars purchased (in thousands)(4) 80 73 84 76 312 Auto stores at period end 50 50 50 51 51 Finished steel average sales price ($/ST)(3) $ 979 $ 1,045 $ 1,129 $ 1,118 $ 1,075 Sales volume (ST, in thousands) Rebar 74 73 99 96 343 Coiled products 25 32 35 28 119 Merchant bar and other — 1 1 1 3 Finished steel products sold 99 106 135 125 465 Rolling mill utilization(5) 78 % 86 % 96 % 93 % 88 % (1) Ferrous and nonferrous volumes sold externally and delivered to our steel mill for finished steel production. (2) Excludes platinum group metals (“PGMs”) in catalytic converters. (3) Price information is shown after netting the cost of freight incurred to deliver the product to the customer. (4) Cars purchased by auto parts stores only. (5) Rolling mill utilization is based on effective annual production capacity under current conditions of 580 thousand tons of finished steel products. 1Q22 impacted by mill shutdown beginning in May 2021 and subsequent ramp-up of operations. (6) May not foot due to rounding. CONDENSED CONSOLIDATED BALANCE SHEETS ($ in thousands) (Unaudited) November 30, 2022 August 31, 2022 Assets Current assets: Cash and cash equivalents $ 3,539 $ 43,803 Accounts receivable, net 218,189 237,654 Inventories 345,198 315,189 Other current assets 67,638 74,740 Total current assets 634,564 671,386 Property, plant and equipment, net 682,738 664,120 Operating lease right-of-use assets 117,806 122,413 Goodwill and other assets 387,511 368,678 Total assets $ 1,822,619 $ 1,826,597 Liabilities and Equity Current liabilities: Short-term borrowings $ 6,379 $ 6,041 Operating lease liabilities 21,538 21,660 Other current liabilities 281,090 353,872 Total current liabilities 309,007 381,573 Long-term debt, net of current maturities 351,200 242,521 Environmental liabilities, net of current portion 55,066 55,469 Operating lease liabilities, net of current maturities 97,536 101,651 Other long-term liabilities 81,306 86,909 Total liabilities 894,115 868,123 Total Schnitzer Steel Industries, Inc. ("SSI") shareholders' equity 924,739 953,979 Noncontrolling interests 3,765 4,495 Total equity 928,504 958,474 Total liabilities and equity $ 1,822,619 $ 1,826,597 Non-GAAP Financial Measures This press release contains performance based on adjusted diluted (loss) earnings per share from continuing operations attributable to SSI shareholders, adjusted EBITDA, adjusted EBITDA per ferrous ton, and adjusted selling, general, and administration expense which are non-GAAP financial measures as defined under SEC rules. As required by SEC rules, the Company has provided a reconciliation of these measures for each period discussed to the most directly comparable U.S. GAAP measure. Management believes that providing these non-GAAP financial measures adds a meaningful presentation of our results from business operations excluding adjustments for asset impairment charges, restructuring charges and other exit-related activities, legacy environmental matters (net of recoveries), business development costs not related to ongoing operations including pre-acquisition expenses, and the income tax benefit allocated to these adjustments, items which are not related to underlying business operational performance, and improves the period-to-period comparability of our results from business operations. We believe that presenting debt, net of cash is useful to investors as a measure of our leverage, as cash and cash equivalents can be used, among other things, to repay indebtedness. These non-GAAP financial measures should be considered in addition to, but not as a substitute for, the most directly comparable U.S. GAAP measures. Reconciliation of adjusted diluted (loss) earnings per share from continuing operations attributable to SSI shareholders ($ per share) Three Months Ended 1Q23 4Q22 1Q22 As reported $ (0.64 ) $ 0.36 $ 1.55 Asset impairment charges, per share(1) 0.14 0.02 — Restructuring charges and other exit-related activities, per share 0.06 — — Charges for legacy environmental matters, net, per share(2) 0.05 0.10 0.02 Business development costs, per share 0.01 0.02 0.02 Income tax benefit allocated to adjustments, per share(3) (0.06 ) — (0.01 ) Adjusted $ (0.44 ) $ 0.50 $ 1.58 Reconciliation of adjusted EBITDA and adjusted EBITDA per ferrous ton ($ in millions) Three Months Ended 1Q23(4) 4Q22 1Q22(4) Net (loss) income $ (18 ) $ 11 $ 47 Plus interest expense 3 3 1 Plus tax (benefit) expense(3) (6 ) 1 11 Plus depreciation and amortization 21 20 17 Plus asset impairment charges(1) 4 1 — Plus restructuring charges and other exit-related activities 2 — — Plus charges for legacy environmental matters, net(2) 1 3 — Plus business development costs — 1 1 Adjusted EBITDA(4) $ 8 $ 40 $ 78 Ferrous sales volume (LT, in thousands) 851 1,268 1,148 Adjusted EBITDA per ferrous ton sold ($/LT) $ 10 $ 32 $ 68 (1) For the first quarter of fiscal 2023, asset impairment charges included $4 million ($0.14 per share) reported within "Other loss, net" on the Unaudited Condensed Consolidated Statement of Operations. (2) Legal and environmental charges, net of recoveries, for legacy environmental matters including those related to the Portland Harbor Superfund site and to other legacy environmental loss contingencies. (3) Income tax allocated to the aggregate adjustments reconciling reported and adjusted diluted earnings per share from continuing operations attributable to SSI shareholders is determined based on a tax provision calculated with and without the adjustments. (4) May not foot due to rounding. ($ in millions) Three Months Ended 1Q23 4Q22(2) 1Q22 As reported $ 64 $ 69 $ 55 Charges for legacy environmental matters, net(1) (1 ) (3 ) — Business development costs — (1 ) (1 ) Adjusted(2) $ 63 $ 66 $ 54 (1) Legal and environmental charges, net of recoveries, for legacy environmental matters including those related to the Portland Harbor Superfund site and to other legacy environmental loss contingencies. (2) May not foot due to rounding. Reconciliation of debt, net of cash ($ in thousands) November 30, 2022 August 31, 2022 November 30, 2021 Short-term borrowings $ 6,379 $ 6,041 $ 3,501 Long-term debt, net of current maturities 351,200 242,521 256,215 Total debt 357,579 248,562 259,716 Less: cash and cash equivalents 3,539 43,803 19,081 Total debt, net of cash $ 354,040 $ 204,759 $ 240,635 Forward-Looking Statements Statements and information included in this press release that are not purely historical are forward-looking statements within the meaning of Section 21E of the Securities Exchange Act of 1934 and are made pursuant to the “safe harbor” provisions of the Private Securities Litigation Reform Act of 1995. Except as noted herein or as the context may otherwise require, all references in this press release to “we,” “our,” “us,” “the Company,” and “SSI” refer to Schnitzer Steel Industries, Inc. and its consolidated subsidiaries. Forward-looking statements in this press release include statements regarding future events or our expectations, intentions, beliefs, and strategies regarding the future, which may include statements regarding the impact of equipment upgrades, equipment failures, and facility damage on production, including timing of repairs and resumption of operations; the realization of insurance recoveries; the impact of pandemics, epidemics, or other public health emergencies, such as the coronavirus disease 2019 (“COVID-19”) pandemic; the Company’s outlook, growth initiatives, or expected results or objectives, including pricing, margins, sales volumes, and profitability; completion of acquisitions and integration of acquired businesses; the impacts of supply chain disruptions, inflation, and rising interest rates; liquidity positions; our ability to generate cash from continuing operations; trends, cyclicality, and changes in the markets we sell into; strategic direction or goals; targets; changes to manufacturing and production processes; the realization of deferred tax assets; planned capital expenditures; the cost of and the status of any agreements or actions related to our compliance with environmental and other laws; expected tax rates, deductions, and credits; the impact of sanctions and tariffs, quotas, and other trade actions and import restrictions; the impact of labor shortages or increased labor costs; obligations under our retirement plans; benefits, savings, or additional costs from business realignment, cost containment, and productivity improvement programs; the potential impact of adopting new accounting pronouncements; and the adequacy of accruals. Forward-looking statements by their nature address matters that are, to different degrees, uncertain, and often contain words such as “outlook,” “target,” “aim,” “believes,” “expects,” “anticipates,” “intends,” “assumes,” “estimates,” “evaluates,” “may,” “will,” “should,” “could,” “opinions,” “forecasts,” “projects,” “plans,” “future,” “forward,” “potential,” “probable,” and similar expressions. However, the absence of these words or similar expressions does not mean that a statement is not forward-looking. We may make other forward-looking statements from time to time, including in reports filed with the Securities and Exchange Commission, press releases, presentations, and on public conference calls. All forward-looking statements we make are based on information available to us at the time the statements are made, and we assume no obligation to update any forward-looking statements, except as may be required by law. Our business is subject to the effects of changes in domestic and global economic conditions and a number of other risks and uncertainties that could cause actual results to differ materially from those included in, or implied by, such forward-looking statements. Some of these risks and uncertainties are discussed in “Item 1A. Risk Factors” of Part I of our most recent Annual Report on Form 10-K. Examples of these risks include: potential environmental cleanup costs related to the Portland Harbor Superfund site or other locations; the impact of equipment upgrades, equipment failures, and facility damage on production; failure to realize or delays in realizing expected benefits from capital projects, including investments in processing and manufacturing technology improvements; the cyclicality and impact of general economic conditions; the impact of inflation, rising interest rates, and foreign currency fluctuations; changing conditions in global markets including the impact of sanctions and tariffs, quotas, and other trade actions and import restrictions; increases in the relative value of the U.S. dollar; economic and geopolitical instability including as a result of military conflict; volatile supply and demand conditions affecting prices and volumes in the markets for raw materials and other inputs we purchase; significant decreases in recycled metal prices; imbalances in supply and demand conditions in the global steel industry; difficulties associated with acquisitions and integration of acquired businesses; supply chain disruptions; reliance on third-party shipping companies, including with respect to freight rates and the availability of transportation; the impact of goodwill impairment charges; the impact of long-lived asset and equity investment impairment charges; the impact of pandemics, epidemics, or other public health emergencies, such as the COVID-19 pandemic; inability to achieve or sustain the benefits from productivity, cost savings, and restructuring initiatives; inability to renew facility leases; customer fulfillment of their contractual obligations; potential limitations on our ability to access capital resources and existing credit facilities; restrictions on our business and financial covenants under the agreement governing our bank credit facilities; the impact of consolidation in the steel industry; product liability claims; the impact of legal proceedings and legal compliance; the adverse impact of climate change; the impact of not realizing deferred tax assets; the impact of tax increases and changes in tax rules; the impact of one or more cybersecurity incidents; translation risks associated with fluctuation in foreign exchange rates; inability to obtain or renew business licenses and permits; environmental compliance costs and potential environmental liabilities; increased environmental regulations and enforcement; compliance with climate change and greenhouse gas emission laws and regulations; the impact of labor shortages or increased labor costs; reliance on employees subject to collective bargaining agreements; and the impact of the underfunded status of multiemployer plans in which we participate.


Are Investors Undervaluing Schnitzer Steel Industries (SCHN) Right Now?
Here at Zacks, our focus is on the proven Zacks Rank system, which emphasizes earnings estimates and estimate revisions to find great stocks. Nevertheless, we are always paying attention to the latest value, growth, and momentum trends to underscore strong picks.


Schnitzer Steel Industries, Inc. (SCHN) Q4 2022 Earnings Call Transcript
Schnitzer Steel Industries, Inc. (NASDAQ:SCHN ) Q4 2022 Earnings Conference Call October 24, 2022 11:30 AM ET Company Participants Michael Bennett - Vice President, Investor Relations Tamara Lundgren - Chairman and Chief Executive Officer Stefano Gaggini - Chief Financial Officer Conference Call Participants Emily Chang - Goldman Sachs Operator Good day, and welcome to the Schnitzer Steel's Conference Call, Fourth Quarter 2022 Earnings Release Call and Webcast. At this time, all participants are in a listen-only mode.

Schnitzer Steel: How The Junkman Took Over
Corporate strongman now of the strength materials industry, all Schnitzer Steel Industries, Inc. had to do was watch prior Dow-Jones component, U.S. Steel (X), fail to keep up with technology in the post-WW2 era. As Vladimir P. learns, technology even changes warfare's materials needs. And what used to be an essential resource yesterday is leftover, and won't easily go away.

Fourth Quarter and Fiscal 2022 Preliminary Results and Announcement of Earnings Date
PORTLAND, Ore.--(BUSINESS WIRE)--Schnitzer Steel Industries, Inc. (NASDAQ: SCHN) today announced preliminary results for its fourth quarter and fiscal year ended August 31, 2022. Fiscal 2022 Expected Performance The Company expects fiscal 2022 results to be the second best year in its history. Diluted earnings per share from continuing operations are expected to be in the range of $5.67 - $5.72, net income is expected to be in the range of $170 million - $172 million, adjusted diluted earnings per share are expected to be in the range of $6.00 - $6.05, and adjusted EBITDA is expected to be in the range of $311 million - $313 million. The Company also expects strong operating cash flow of approximately $238 million for the full fiscal year. The Company delivered record performance in the first nine months of fiscal 2022 but fourth quarter results were adversely impacted by declining ferrous and nonferrous sales prices and demand, tighter supply flows, and disruptions due to an extended shredding operation outage at the Company's Everett, MA facility to replace equipment damaged by the December 2021 fire, offset in part by benefits of strong prices for the Company's finished steel products. Fourth Quarter Fiscal 2022 Expected Performance The Company anticipates: Fourth quarter diluted earnings per share from continuing operations to be in the range of $0.31 - $0.36. Net income to be in the range of $9 million - $11 million and net income per ferrous ton in the range of $7 - $9. Adjusted diluted earnings per share from continuing operations to be in the range of $0.42 - $0.47, which excludes expected charges of approximately $4 million or $0.11 per share related primarily to legacy environmental matters. Adjusted EBITDA to be in the range of $38 million - $40 million and adjusted EBITDA per ferrous ton in the range of $30 - $32. The sharp decline in selling prices for recycled metals in the fourth quarter is expected to lead to both a compression in metal spreads and an adverse impact from average inventory accounting of approximately $23 per ferrous ton. Strong operating cash flow to be in the range of approximately $180 million, resulting in a $70 million sequential reduction in debt. Total debt is expected to be $249 million at the end of the fourth quarter, and debt, net of cash, is expected to be $205 million. The Company repurchased approximately 1.8% of its Class A outstanding shares during the quarter. Average net ferrous and nonferrous selling prices are expected to decrease from the third quarter by 28% and 7%, respectively. Ferrous sales volumes are expected to increase 12% sequentially, reflecting primarily the benefit from shipments delayed from the third quarter, and nonferrous volumes are expected to decrease 8%. Average net finished steel selling prices are expected to decrease by 1% and finished steel sales volumes are expected to be down by 7%, sequentially. Lower SG&A expense primarily as a result of lower incentive compensation accruals and benefits from productivity initiatives are expected to partially offset inflationary pressure on operating costs, including rising costs of compliance to meet regulatory requirements and the aforementioned Everett shredding operation outage since late June, net of insurance recoveries. The Company repurchased 500,000 shares of its Class A common stock in open market transactions during the quarter pursuant to its ongoing authorized share repurchase program, bringing share repurchases for fiscal 2022 to approximately 3.5% of outstanding shares. The effective tax rate for the fourth quarter is expected to be an expense of approximately 11%, including certain discrete tax benefits. Tamara Lundgren, Chairman and Chief Executive Officer, said, "We expect our full year fiscal 2022 results to be the second best in our Company's history, supported by high finished steel and recycled metal prices, successful implementation of productivity initiatives to partially offset inflationary cost pressures, and progress on our strategic initiatives, including closing two acquisitions. We also progressed our investments in advanced metal recovery technology systems and launched GRN SteelTM, a line of net zero carbon emissions products from our Cascade steel mill. Our fourth quarter results were adversely impacted by a significant decline in ferrous and nonferrous sales prices and demand, tighter supply flows resulting from the drop in prices and the weaker economic environment, and an extended operational outage." Ms. Lundgren continued, "Despite the current headwinds, we believe the long-term structural trends for recycled metal demand remain positive and are well-aligned with our strategy and investments. The transition to low carbon technologies, which are more metal intensive, the increased focus on decarbonization, and the expected funding related to the Infrastructure Investment and Jobs Act and the Inflation Reduction Act, including Buy Clean provisions, underpin anticipated increased future demand for ferrous and nonferrous recycled metals." The preliminary information provided above is based on the Company’s current estimates of its financial results for the quarter and fiscal year ended August 31, 2022 and remains subject to change based on management's final review of the Company’s fourth quarter financial results and the completion of the Company's annual audit. Earnings Call Date The Company will report financial results for its fourth quarter and fiscal year 2022 ended August 31, 2022 on Monday, October 24, 2022. The Company will host a webcast conference call to discuss the results at 11:30 a.m. Eastern Time on the same day. The webcast of the call and the accompanying slide presentation may be accessed at www.schnitzersteel.com/company/investors/event-calendar on Schnitzer’s website under Company > Investors > Event Calendar. The call will be hosted by Tamara Lundgren, Chairman and Chief Executive Officer, and Stefano Gaggini, Senior Vice President and Chief Financial Officer. About Schnitzer Steel Industries, Inc. Schnitzer Steel Industries, Inc. is one of the largest manufacturers and exporters of recycled metal products in North America with operating facilities located in 25 states, Puerto Rico and Western Canada. Schnitzer has seven deep water export facilities located on both the East and West Coasts and in Hawaii and Puerto Rico. The Company’s integrated operating platform also includes 51 stores which sell serviceable used auto parts from salvaged vehicles and receive over 4.1 million annual retail visits. The Company’s steel manufacturing operations produce finished steel products, including rebar, wire rod and other specialty products. The Company began operations in 1906 in Portland, Oregon. Non-GAAP Financial Measures This press release contains expected performance based on adjusted diluted earnings per share from continuing operations attributable to SSI shareholders, adjusted EBITDA and adjusted EBITDA per ferrous ton which are non-GAAP financial measures as defined under SEC rules. As required by SEC rules, the Company has provided a reconciliation of these measures for each period discussed to the most directly comparable U.S. GAAP measure. Management believes that providing these non-GAAP financial measures adds a meaningful presentation of our results from business operations excluding adjustments for legacy environmental matters (net of recoveries), business development costs not related to ongoing operations including pre-acquisition expenses, charges related to non-ordinary course legal settlements, asset impairment charges, restructuring charges and other exit-related activities, and the income tax benefit allocated to these adjustments, items which are not related to underlying business operational performance, and improves the period-to-period comparability of our results from business operations. We believe that presenting debt, net of cash is useful to investors as a measure of our leverage, as cash and cash equivalents can be used, among other things, to repay indebtedness. These non-GAAP financial measures should be considered in addition to, but not as a substitute for, the most directly comparable U.S. GAAP measures. Reconciliation of adjusted diluted earnings per share from continuing operations attributable to SSI shareholders ($ per share) 4Q22 High Low As reported $ 0.36 $ 0.31 Charges for legacy environmental matters, net, per share(1) 0.10 0.10 Charges related to legal settlements, per share(1) — — Business development costs, per share 0.02 0.02 Restructuring charges and other exit-related activities, per share — — Asset impairment charges, per share 0.02 0.02 Income tax benefit allocated to adjustments, per share(2) (0.03 ) (0.03 ) Adjusted(3) $ 0.47 $ 0.42 Reconciliation of adjusted diluted earnings per share from continuing operations attributable to SSI shareholders ($ per share) FY22 High Low As reported $ 5.72 $ 5.67 Charges for legacy environmental matters, net, per share(1) $ 0.25 $ 0.25 Charges related to legal settlements, per share(1) $ 0.02 $ 0.02 Business development costs, per share $ 0.09 $ 0.09 Restructuring charges and other exit-related activities, per share $ — $ — Asset impairment charges, per share $ 0.05 $ 0.05 Income tax benefit allocated to adjustments, per share(2) $ (0.09 ) $ (0.09 ) Adjusted(3) $ 6.05 $ 6.00 Reconciliation of adjusted EBITDA ($ in millions) 4Q22 High Low Net income $ 11 $ 9 Plus interest expense 3 3 Plus tax expense 1 1 Plus depreciation and amortization 20 20 Plus charges for legacy environmental matters, net(1) 3 3 Plus restructuring charges and other exit-related activities — — Plus charges related to legal settlements — — Plus business development costs 1 1 Plus asset impairment charges 1 1 Adjusted EBITDA (3) $ 40 $ 38 Ferrous sales volume (LT, in thousands) 1,268 1,268 Adjusted EBITDA per ferrous ton sold ($/LT) $ 32 $ 30 Reconciliation of adjusted EBITDA ($ in millions) FY22 High Low Net income $ 172 $ 170 Plus interest expense 9 9 Plus tax expense 45 45 Plus depreciation and amortization 75 75 Plus charges for legacy environmental matters, net(1) 8 8 Plus restructuring charges and other exit-related activities — — Plus charges related to legal settlements 1 1 Plus business development costs 3 3 Plus asset impairment charges 2 2 Adjusted EBITDA (3) $ 313 $ 311 (1) Legal and environmental charges, net of recoveries, for legacy environmental matters including those related to the Portland Harbor Superfund site and to other legacy environmental loss contingencies. (2) Income tax allocated to the aggregate adjustments reconciling reported and adjusted diluted earnings per share from continuing operations attributable to SSI shareholders is determined based on a tax provision calculated with and without the adjustments. (3) May not foot due to rounding. Reconciliation of debt, net of cash ($ in thousands) August 31, 2022 May 31, 2022 August 31, 2021 Short-term borrowings $ 6,041 $ 5,764 $ 3,654 Long-term debt, net of current maturities 242,521 316,108 71,299 Total debt 248,562 321,872 74,953 Less: cash and cash equivalents 43,803 16,125 27,818 Total debt, net of cash $ 204,759 $ 305,747 $ 47,135 Forward Looking Statements Statements and information included in this press release that are not purely historical are forward-looking statements within the meaning of Section 21E of the Securities Exchange Act of 1934 and are made pursuant to the “safe harbor” provisions of the Private Securities Litigation Reform Act of 1995. Except as noted herein or as the context may otherwise require, all references in this press release to “we,” “our,” “us,” “the Company,” and “SSI” refer to Schnitzer Steel Industries, Inc. and its consolidated subsidiaries. Forward-looking statements in this press release include statements regarding future events or our expectations, intentions, beliefs, and strategies regarding the future, which may include statements regarding the impact of equipment upgrades, equipment failures, and facility damage on production, including timing of repairs and resumption of operations; the realization of insurance recoveries; the impact of pandemics, epidemics, or other public health emergencies, such as the coronavirus disease 2019 ("COVID-19") pandemic; the Company’s outlook, growth initiatives, or expected results or objectives, including pricing, margins, sales volumes, and profitability; completion of acquisitions and integration of acquired businesses; the impacts of supply chain disruptions, inflation, and rising interest rates; liquidity positions; our ability to generate cash from continuing operations; trends, cyclicality, and changes in the markets we sell into; strategic direction or goals; targets; changes to manufacturing and production processes; the realization of deferred tax assets; planned capital expenditures; the cost of and the status of any agreements or actions related to our compliance with environmental and other laws; expected tax rates, deductions, and credits; the impact of sanctions and tariffs, quotas, and other trade actions and import restrictions; the impact of labor shortages or increased labor costs; obligations under our retirement plans; benefits, savings, or additional costs from business realignment, cost containment, and productivity improvement programs; the potential impact of adopting new accounting pronouncements; and the adequacy of accruals. Forward-looking statements by their nature address matters that are, to different degrees, uncertain, and often contain words such as “outlook,” “target,” “aim,” “believes,” “expects,” “anticipates,” “intends,” “assumes,” “estimates,” “evaluates,” “may,” “will,” “should,” “could,” “opinions,” “forecasts,” “projects,” “plans,” “future,” “forward,” “potential,” “probable,” and similar expressions. However, the absence of these words or similar expressions does not mean that a statement is not forward-looking. We may make other forward-looking statements from time to time, including in reports filed with the Securities and Exchange Commission, press releases, presentations, and on public conference calls. All forward-looking statements we make are based on information available to us at the time the statements are made, and we assume no obligation to update any forward-looking statements, except as may be required by law. Our business is subject to the effects of changes in domestic and global economic conditions and a number of other risks and uncertainties that could cause actual results to differ materially from those included in, or implied by, such forward-looking statements. Some of these risks and uncertainties are discussed in “Item 1A. Risk Factors” of Part I of our most recent Annual Report on Form 10-K, as supplemented by our subsequently filed Quarterly Reports on Form 10-Q. Examples of these risks include: potential environmental cleanup costs related to the Portland Harbor Superfund site or other locations; the impact of equipment upgrades, equipment failures, and facility damage on production; failure to realize or delays in realizing expected benefits from investments in processing and manufacturing technology improvements; the cyclicality and impact of general economic conditions; changing conditions in global markets including the impact of sanctions and tariffs, quotas, and other trade actions and import restrictions; increases in the relative value of the U.S. dollar; economic and geopolitical instability including as a result of military conflict; volatile supply and demand conditions affecting prices and volumes in the markets for raw materials and other inputs we purchase; significant decreases in recycled metal prices; imbalances in supply and demand conditions in the global steel industry; difficulties associated with acquisitions and integration of acquired businesses; supply chain disruptions; reliance on third-party shipping companies, including with respect to freight rates and the availability of transportation; inability to obtain or renew business licenses and permits; the impact of goodwill impairment charges; the impact of long-lived asset and equity investment impairment charges; the impact of pandemics, epidemics, or other public health emergencies, such as the COVID-19 pandemic; inability to achieve or sustain the benefits from productivity, cost savings, and restructuring initiatives; inability to renew facility leases; customer fulfillment of their contractual obligations; the impact of inflation, rising interest rates, and foreign currency fluctuations; potential limitations on our ability to access capital resources and existing credit facilities; restrictions on our business and financial covenants under the agreement governing our bank credit facilities; the impact of consolidation in the steel industry; product liability claims; the impact of legal proceedings and legal compliance; the adverse impact of climate change; the impact of not realizing deferred tax assets; the impact of tax increases and changes in tax rules; the impact of one or more cybersecurity incidents; environmental compliance costs and potential environmental liabilities; increased environmental regulations and enforcement; compliance with climate change and greenhouse gas emission laws and regulations; the impact of labor shortages or increased labor costs; reliance on employees subject to collective bargaining agreements; and the impact of the underfunded status of multiemployer plans in which we participate.

Insiders Buying Rocket Companies, Schnitzer Steel And This Energy Stock
Although US stocks closed mixed on Friday following the release of June's jobs report, there were a few notable insider trades. When insiders purchase shares, it indicates their confidence in the company's prospects or that they view the stock as a bargain.

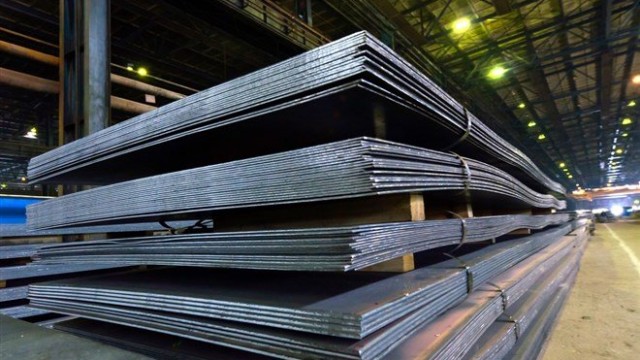
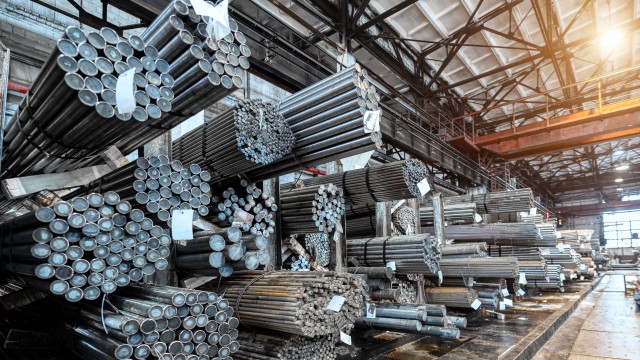
Schnitzer Steel Industries, Inc. (SCHN) CEO Tamara Lundgren on Q3 2022 Results Earnings Call Transcript
Schnitzer Steel Industries, Inc. (NASDAQ:SCHN ) Q3 2022 Earnings Conference Call June 29, 2022 11:30 AM ET Company Participants Michael Bennett - VP, IR Tamara Lundgren - Chairman and CEO Richard Peach - CFO and CSO Conference Call Participants Michael Leshock - Keybanc Capital Markets Operator Good day and thank you for standing by. Welcome to the Schnitzer Steel's Third Quarter 2022 Earnings Release Call and Webcast.

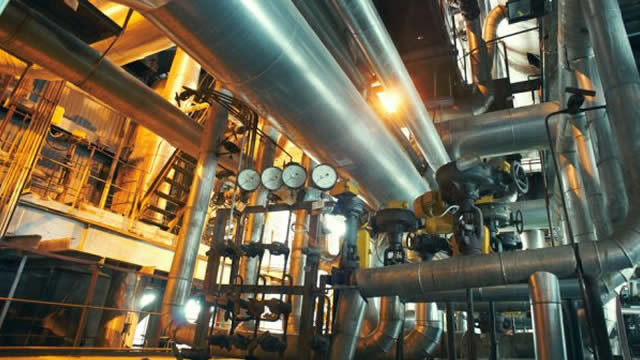
Schnitzer Steel shares advance on earnings
Schnitzer Steel Industries Inc. SCHN, +4.43% rose 3.4% on Wednesday despite losses in other steel stocks after the company beat its earnings and revenue targets. Schnitzer Steel's third-quarter earnings of $2.59 a share beat the estimate of $2.30 a share and its revenue of $1.01 billion came in ahead of the forecast of $919.1 million, according to FactSet data.
Schnitzer Reports Third Quarter Fiscal 2022 Financial Results
PORTLAND, Ore.--(BUSINESS WIRE)--Schnitzer Steel Industries, Inc. (NASDAQ: SCHN) today reported results for its third quarter of fiscal 2022 ended May 31, 2022. Third Quarter Fiscal 2022 Highlights Diluted earnings per share from continuing operations of $2.52 compared to $2.16 in the third quarter of fiscal 2021 Adjusted diluted earnings per share from continuing operations of $2.59 compared to adjusted diluted earnings per share of $2.20 in the third quarter of fiscal 2021 Net income of $76 million compared to $65 million in the third quarter of fiscal 2021 Adjusted EBITDA of $119 million compared to $97 million in the third quarter of fiscal 2021 The Company’s third quarter performance benefited from strong global demand for recycled metals and robust West Coast market conditions for finished steel products which was reflected in higher average selling prices for ferrous, nonferrous and finished steel products. Average ferrous and nonferrous selling prices in the quarter were at or near multi-year highs, while average finished steel selling prices were the highest on record. Tamara Lundgren, Chairman and Chief Executive Officer, stated, “Our record results this quarter reflected excellent operational performance during a quarter marked by strong movements in demand and prices, reflecting both short-term disruptions and underlying positive structural trends supporting increased use of recycled metals in manufacturing. At the end of April, we acquired the assets of Encore Recycling in Georgia, including our first metal shredding operation in the Southeast, which increases our Southeast regional footprint to 24 facilities across five states. We expect this region to see both a significant increase in steelmaking and in auto and industrial manufacturing in the coming years.” Ms. Lundgren continued, “Low carbon technologies are widely acknowledged to be more metal intensive than the technologies that they are replacing. The use of recycled metals, which require less carbon to produce than mined metals, provides an important solution for companies, industries and governments that are focused on carbon reduction and are committed to reducing material directed to landfills. Our investments in advanced metal recovery technology systems and the expansion of our operating platform are providing us with recycled ferrous and nonferrous products that can serve this increasing demand.” Summary Results ($ in millions, except per share amounts, and prices per ton/pound) Quarter Nine Months Ended 3Q22 2Q22 3Q21 2022 2021 Revenues $ 1,010 $ 783 $ 821 $ 2,591 $ 1,913 Gross margin (total revenues less cost of goods sold) $ 176 $ 113 $ 142 $ 403 $ 328 Selling, general and administrative expense $ 78 $ 61 $ 62 $ 194 $ 166 Net income $ 76 $ 38 $ 65 $ 161 $ 126 Net income per ferrous ton $ 67 $ 36 $ 54 $ 48 $ 39 Diluted earnings per share from continuing operations attributable to SSI shareholders Reported $ 2.52 $ 1.27 $ 2.16 $ 5.33 $ 4.23 Adjusted(1) $ 2.59 $ 1.38 $ 2.20 $ 5.54 $ 4.31 Adjusted EBITDA(1) $ 119 $ 75 $ 97 $ 272 $ 209 Adjusted EBITDA per ferrous ton(1) $ 105 $ 70 $ 80 $ 81 $ 64 Ferrous sales volumes (LT, in thousands) 1,129 1,071 1,215 3,349 3,245 Avg. net ferrous sales prices ($/LT)(2) $ 541 $ 445 $ 400 $ 477 $ 354 Nonferrous sales volumes (pounds, in millions)(3) 201 147 156 502 430 Avg. nonferrous sales prices ($/pound)(2)(3) $ 1.12 $ 1.10 $ 0.97 $ 1.10 $ 0.82 Finished steel average net sales price ($/ST)(2) $ 1,129 $ 1,045 $ 802 $ 1,059 $ 709 Finished steel sales volumes (ST, in thousands) 135 106 153 340 423 Rolling mill utilization (%) 96 % 86 % 98 % 87 % 94 % (1) See Non-GAAP Financial Measures for reconciliation to U.S. GAAP. (2) Price information is shown after netting the cost of freight incurred to deliver the product to the customer. (3) Nonferrous sales volumes and average nonferrous prices excludes platinum group metals (PGMs) in catalytic converters. Third Quarter Fiscal 2022 Financial Review and Analysis Net income of $76 million and adjusted EBITDA of $119 million in the third quarter of fiscal 2022 reflected significantly higher year-over-year average net selling prices for ferrous, nonferrous and finished steel products. Contributing to the strong performance during the quarter were higher year-over-year sales volumes for nonferrous metals and an expansion in metal spreads on certain ferrous sales contracted prior to the market price declines that occurred during the latter part of the quarter. In addition, contributions from recent acquisitions and productivity initiatives helped to partially offset inflationary pressure on operating costs. The benefit from average inventory accounting was approximately $4 per ferrous ton in the quarter compared to $7 per ferrous ton in the prior year quarter. Ferrous sales volumes were up 5% sequentially, supported by contributions from acquisitions, but down 7% year-over-year due to the impact of market volatility on demand in the second half of the quarter, which delayed contracting and shipping bulk cargoes. Nonferrous sales volumes were up 29% year-over-year, benefiting from strong global demand and an easing of supply chain and logistics disruptions. Average ferrous and nonferrous net selling prices were up year-over-year by 35% and 15%, respectively, supported by strong global demand. Finished steel sales volumes were down year-over-year 12%, reflecting ongoing logistics challenges, but up sequentially 27% as sales volumes benefited from an improvement in supply chain disruptions and the resolution in April of the Seattle, WA concrete industry drivers' strike. The mill achieved an average utilization of 96% in the quarter. Average net selling prices for finished steel products increased year-over-year by 41%, reaching all-time highs. Operating cash flow in the quarter was $45 million, as cash flows associated with profitability more than offset the increase in working capital resulting primarily from the higher price environment and inventories. Capital expenditures were $29 million in the quarter, including investments in advanced metal recovery technologies, maintaining the business and environmental projects. Total debt at the end of the quarter was $322 million, and debt, net of cash, was $306 million. The increase in debt in fiscal 2022 was primarily driven by the acquisition of the assets of Columbus Recycling and Encore Recycling and higher working capital. The Company’s effective tax rate for the third quarter was an expense of 21%, and included benefits from certain discrete tax items during the quarter. For a reconciliation of adjusted results and debt, net of cash, to U.S. GAAP, see the table provided in the Non-GAAP Financial measures section. During the third quarter, the Company returned capital to shareholders through its 113th consecutive quarterly dividend and the repurchase of 243,792 shares, or 0.9%, of its Class A common stock in open market transactions pursuant to its authorized share repurchase program. Declaration of Quarterly Dividend The Board of Directors declared a cash dividend of $0.1875 per common share, payable July 25, 2022 to shareholders of record on July 11, 2022. Schnitzer has paid a dividend every quarter since going public in November 1993. Analysts’ Conference Call: Third Quarter of Fiscal 2022 A conference call and slide presentation to discuss results will be held today, June 29, 2022, at 11:30 a.m. Eastern and will be hosted by Tamara L. Lundgren, Chairman and Chief Executive Officer, and Richard Peach, Executive Vice President, Chief Financial Officer and Chief Strategy Officer. The call and the slide presentation will be webcast and accessible on the Company’s website under Company > Investors > Event Calendar at www.schnitzersteel.com/company/investors/event-calendar. Summary financial data is provided in the following pages. The slide presentation and related materials will be available prior to the call on the above website. About Schnitzer Steel Industries, Inc. Schnitzer Steel Industries, Inc. operates at the intersection of metals recovery, reuse, recycling, and manufacturing. Schnitzer is one of the largest manufacturers and exporters of recycled metal products in North America with operating facilities located in 25 states, Puerto Rico and Western Canada. Schnitzer has seven deep water export facilities located on both the East and West Coasts and in Hawaii and Puerto Rico. The Company’s integrated operating platform also includes 50 stores which sell serviceable used auto parts from salvaged vehicles and receive over 4.3 million annual retail visits. The Company’s steel manufacturing operations produce finished steel products, including rebar, wire rod and other specialty products. The Company began operations in 1906 in Portland, Oregon. SCHNITZER STEEL INDUSTRIES, INC. CONDENSED CONSOLIDATED STATEMENTS OF OPERATIONS ($ in thousands, except per share amounts) (Unaudited) Three Months Ended Nine Months Ended May 31, 2022 February 28, 2022 May 31, 2021 May 31, 2022 May 31, 2021 Revenues $ 1,010,087 $ 783,198 $ 820,718 $ 2,591,403 $ 1,912,936 Cost of goods sold 834,375 670,539 678,297 2,188,158 1,585,416 Selling, general and administrative expense 77,672 61,081 61,887 194,020 165,935 Income from joint ventures (762 ) (591 ) (950 ) (1,589 ) (2,131 ) Asset impairment charges 932 — — 932 — Restructuring charges and other exit-related activities 26 4 104 52 982 Operating income 97,844 52,165 81,380 209,830 162,734 Interest expense (2,223 ) (1,901 ) (1,383 ) (5,496 ) (4,387 ) Other loss, net (34 ) (55 ) (114 ) (136 ) (521 ) Income from continuing operations before income taxes 95,587 50,209 79,883 204,198 157,826 Income tax expense (20,037 ) (12,073 ) (14,401 ) (43,207 ) (31,589 ) Income from continuing operations 75,550 38,136 65,482 160,991 126,237 Gain (loss) from discontinued operations, net of tax (46 ) 29 (46 ) (46 ) (58 ) Net income 75,504 38,165 65,436 160,945 126,179 Net income attributable to noncontrolling interests (870 ) (550 ) (1,801 ) (2,497 ) (3,852 ) Net income attributable to SSI shareholders $ 74,634 $ 37,615 $ 63,635 $ 158,448 $ 122,327 Net income per share attributable to SSI shareholders: Basic: Income per share from continuing operations $ 2.65 $ 1.33 $ 2.27 $ 5.63 $ 4.38 Net income per share $ 2.65 $ 1.33 $ 2.27 $ 5.63 $ 4.38 Diluted: Income per share from continuing operations $ 2.52 $ 1.27 $ 2.16 $ 5.33 $ 4.23 Net income per share $ 2.52 $ 1.27 $ 2.15 $ 5.33 $ 4.22 Weighted average number of common shares: Basic 28,143 28,231 28,047 28,161 27,948 Diluted 29,625 29,712 29,543 29,741 28,963 Dividends declared per common share $ 0.1875 $ 0.1875 $ 0.1875 $ 0.5625 $ 0.5625 SCHNITZER STEEL INDUSTRIES, INC. SELECTED OPERATING STATISTICS (Unaudited) YTD 1Q22 2Q22 3Q22 2022 Total ferrous volumes (LT, in thousands)(1) 1,148 1,071 1,129 3,349 Total nonferrous volumes (pounds, in thousands)(1)(2) 153,227 147,145 201,413 501,785 Ferrous selling prices ($/LT)(3) Domestic $ 431 418 $ 516 $ 458 Foreign $ 450 455 $ 552 $ 484 Average $ 446 445 $ 541 $ 477 Ferrous sales volume (LT, in thousands) Domestic 430 408 490 1,329 Foreign 718 663 639 2,020 Total 1,148 1,071 1,129 3,349 Nonferrous average price ($/pound)(2)(3) $ 1.05 $ 1.10 $ 1.12 $ 1.10 Cars purchased (in thousands)(4) 80 73 84 237 Auto stores at period end 50 50 50 50 Finished steel average sales price ($/ST)(3) $ 979 $ 1,045 $ 1,129 $ 1,059 Sales volume (ST, in thousands) Rebar 74 73 99 246 Coiled products 25 32 35 92 Merchant bar and other — 1 1 2 Finished steel products sold 99 106 135 340 Rolling mill utilization(5) 78 % 86 % 96 % 87 % (1) Ferrous and nonferrous volumes sold externally and delivered to our steel mill for finished steel production. (2) Excludes platinum group metals (“PGMs”) in catalytic converters. (3) Price information is shown after netting the cost of freight incurred to deliver the product to the customer. (4) Cars purchased by auto parts stores only. (5) Rolling mill utilization is based on effective annual production capacity under current conditions of 580 thousand tons of finished steel products. (1Q22 impacted by mill shutdown beginning in May 2021 and subsequent ramp-up of operations.) SCHNITZER STEEL INDUSTRIES, INC. SELECTED OPERATING STATISTICS (Unaudited) Fiscal Year 1Q21 2Q21 3Q21 4Q21 2021 Total ferrous volumes (LT, in thousands)(1) 1,053 977 1,215 1,163 4,408 Total nonferrous volumes (pounds, in thousands)(1)(2) 138,236 135,899 155,657 163,586 593,378 Ferrous selling prices ($/LT)(3) Domestic $ 242 $ 349 $ 395 $ 453 $ 364 Foreign $ 276 $ 399 $ 401 $ 446 $ 385 Average $ 269 $ 387 $ 400 $ 449 $ 381 Ferrous sales volume (LT, in thousands) Domestic 388 391 412 309 1,500 Foreign 665 586 803 854 2,908 Total 1,053 977 1,215 1,163 4,408 Nonferrous average price ($/pound)(2)(3) $ 0.64 $ 0.83 $ 0.97 $ 1.01 $ 0.88 Cars purchased (in thousands)(4) 78 80 91 89 338 Auto stores at period end 50 50 50 50 50 Finished steel average sales price ($/ST)(3) $ 621 $ 690 $ 802 $ 920 $ 737 Sales volume (ST, in thousands) Rebar 94 103 106 50 353 Coiled products 39 32 47 14 132 Merchant bar and other 1 1 — 1 3 Finished steel products sold 134 136 153 65 488 Rolling mill utilization(5) 97 % 88 % 98 % 28 % 78 % ST = Short Ton, which is equivalent to 2,000 pounds (1) Ferrous and nonferrous volumes sold externally and delivered to our steel mill for finished steel production. (2) Excludes platinum group metals (“PGMs”) in catalytic converters. (3) Price information is shown after netting the cost of freight incurred to deliver the product to the customer. (4) Cars purchased by auto parts stores only. (5) Rolling mill utilization is based on effective annual production capacity under current conditions of 580 thousand tons of finished steel products. (4Q21 impacted by mill shutdown beginning in May 2021 and subsequent ramp-up of operations.) SCHNITZER STEEL INDUSTRIES, INC. CONDENSED CONSOLIDATED BALANCE SHEETS ($ in thousands) (Unaudited) May 31, 2022 August 31, 2021 Assets Current assets: Cash and cash equivalents $ 16,125 $ 27,818 Accounts receivable, net 283,819 214,098 Inventories 439,704 256,427 Other current assets 48,277 44,771 Total current assets 787,925 543,114 Property, plant and equipment, net 629,104 562,674 Operating lease right-of-use assets 127,311 131,221 Goodwill and other assets 368,101 257,354 Total assets $ 1,912,441 $ 1,494,363 Liabilities and Equity Current liabilities: Short-term borrowings $ 5,764 $ 3,654 Operating lease liabilities 21,964 21,417 Other current liabilities 353,135 327,779 Total current liabilities 380,863 352,850 Long-term debt, net of current maturities 316,108 71,299 Environmental liabilities, net of current portion 54,950 52,385 Operating lease liabilities, net of current maturities 106,745 113,165 Other long-term liabilities 85,905 64,885 Total liabilities 944,571 654,584 Total Schnitzer Steel Industries, Inc. ("SSI") shareholders' equity 963,688 835,764 Noncontrolling interests 4,182 4,015 Total equity 967,870 839,779 Total liabilities and equity $ 1,912,441 $ 1,494,363 Non-GAAP Financial Measures This press release contains performance based on adjusted diluted earnings per share from continuing operations attributable to SSI shareholders, adjusted EBITDA and adjusted EBITDA per ferrous ton which are non-GAAP financial measures as defined under SEC rules. As required by SEC rules, the Company has provided a reconciliation of these measures for each period discussed to the most directly comparable U.S. GAAP measure. Management believes that providing these non-GAAP financial measures adds a meaningful presentation of our results from business operations excluding adjustments for legacy environmental matters (net of recoveries), business development costs not related to ongoing operations including pre-acquisition expenses, charges related to non-ordinary course legal settlements, restructuring charges and other exit-related activities, asset impairment charges, and the income tax (benefit) expense allocated to these adjustments, items which are not related to underlying business operational performance, and improves the period-to-period comparability of our results from business operations. We believe that presenting debt, net of cash is useful to investors as a measure of our leverage, as cash and cash equivalents can be used, among other things, to repay indebtedness. These non-GAAP financial measures should be considered in addition to, but not as a substitute for, the most directly comparable U.S. GAAP measures. Reconciliation of adjusted diluted earnings per share from continuing operations attributable to SSI shareholders ($ per share) Three Months Ended Nine Months Ended 3Q22 2Q22 3Q21 2022 2021 As reported $ 2.52 $ 1.27 $ 2.16 $ 5.33 $ 4.23 Charges (recoveries) for legacy environmental matters, net, per share(1) — 0.13 0.01 0.15 0.03 Business development costs, per share 0.03 0.02 0.03 0.07 0.03 Charges related to legal settlements, per share(4) 0.02 — 0.01 0.02 0.01 Restructuring charges and other exit-related activities, per share — — — — 0.03 Asset impairment charges, per share 0.03 — — 0.03 — Income tax benefit allocated to adjustments, per share(2) (0.02 ) (0.04 ) (0.01 ) (0.06 ) (0.02 ) Adjusted(3) $ 2.59 $ 1.38 $ 2.20 $ 5.54 $ 4.31 Reconciliation of adjusted EBITDA and adjusted EBITDA per ferrous ton ($ in millions) Three Months Ended Nine Months Ended 3Q22 2Q22 3Q21 2022 2021 Net income $ 76 $ 38 $ 65 $ 161 $ 126 Plus interest expense 2 2 1 5 4 Plus tax expense 20 12 14 43 32 Plus depreciation and amortization 19 19 14 55 44 Plus charges (recoveries) for legacy environmental matters, net(1) — 4 — 5 1 Plus business development costs 1 1 1 2 1 Plus restructuring charges and other exit-related activities — — — — 1 Plus charges related to legal settlements(4) 1 — — 1 — Plus asset impairment charges 1 — — 1 — Adjusted EBITDA(3) $ 119 $ 75 $ 97 $ 272 $ 209 Ferrous sales volume (LT, in thousands) 1,129 1,071 1,215 3,349 3,245 Adjusted EBITDA per ferrous ton sold ($/LT) $ 105 $ 70 $ 80 $ 81 $ 64 LT = Long Ton, which is equivalent to 2,240 pounds (1) Legal and environmental charges, net of recoveries, for legacy environmental matters including those related to the Portland Harbor Superfund site and to other legacy environmental loss contingencies. (2) Income tax allocated to the aggregate adjustments reconciling reported and adjusted diluted earnings per share from continuing operations attributable to SSI shareholders is determined based on a tax provision calculated with and without the adjustments. (3) May not foot due to rounding. (4) Charges related to legal settlements in the three and nine months ended May 31, 2022 and 2021 related to a claim with a utility provider for past charges. Reconciliation of debt, net of cash ($ in thousands) May 31, 2022 February 28, 2022 August 31, 2021 Short-term borrowings $ 5,764 $ 7,451 $ 3,654 Long-term debt, net of current maturities 316,108 254,126 71,299 Total debt 321,872 261,577 74,953 Less: cash and cash equivalents 16,125 17,823 27,818 Total debt, net of cash $ 305,747 $ 243,754 $ 47,135 Forward Looking Statements Statements and information included in this press release that are not purely historical are forward-looking statements within the meaning of Section 21E of the Securities Exchange Act of 1934 and are made pursuant to the “safe harbor” provisions of the Private Securities Litigation Reform Act of 1995. Except as noted herein or as the context may otherwise require, all references in this press release to “we,” “our,” “us,” “the Company,” and “SSI” refer to Schnitzer Steel Industries, Inc. and its consolidated subsidiaries. Forward-looking statements in this press release include statements regarding future events or our expectations, intentions, beliefs, and strategies regarding the future, which may include statements regarding the impact of pandemics, epidemics, or other public health emergencies, such as the coronavirus disease 2019 (“COVID-19”) pandemic; the impact of equipment upgrades, equipment failures, and facility damage on production, including timing of repairs and resumption of operations; the realization of insurance recoveries; the Company’s outlook, growth initiatives, or expected results or objectives, including pricing, margins, sales volumes, and profitability; completion of acquisitions and integration of acquired businesses; the impacts of supply chain disruptions and inflation; liquidity positions; our ability to generate cash from continuing operations; trends, cyclicality, and changes in the markets we sell into; strategic direction or goals; targets; changes to manufacturing and production processes; the realization of deferred tax assets; planned capital expenditures; the cost of and the status of any agreements or actions related to our compliance with environmental and other laws; expected tax rates, deductions, and credits; the impact of sanctions and tariffs, quotas, and other trade actions and import restrictions; the potential impact of adopting new accounting pronouncements; the impact of labor shortages or increased labor costs; obligations under our retirement plans; benefits, savings, or additional costs from business realignment, cost containment, and productivity improvement programs; and the adequacy of accruals. Forward-looking statements by their nature address matters that are, to different degrees, uncertain, and often contain words such as “outlook,” “target,” “aim,” “believes,” “expects,” “anticipates,” “intends,” “assumes,” “estimates,” “evaluates,” “may,” “will,” “should,” “could,” “opinions,” “forecasts,” “projects,” “plans,” “future,” “forward,” “potential,” “probable,” and similar expressions. However, the absence of these words or similar expressions does not mean that a statement is not forward-looking. We may make other forward-looking statements from time to time, including in reports filed with the Securities and Exchange Commission, press releases, presentations, and on public conference calls. All forward-looking statements we make are based on information available to us at the time the statements are made, and we assume no obligation to update any forward-looking statements, except as may be required by law. Our business is subject to the effects of changes in domestic and global economic conditions and a number of other risks and uncertainties that could cause actual results to differ materially from those included in, or implied by, such forward-looking statements. Some of these risks and uncertainties are discussed in “Item 1A. Risk Factors” of Part I of our most recent Annual Report on Form 10-K, as supplemented by our subsequently filed Quarterly Reports on Form 10-Q. Examples of these risks include: the impact of pandemics, epidemics, or other public health emergencies, such as the COVID-19 pandemic; the impact of equipment upgrades, equipment failures, and facility damage on production; potential environmental cleanup costs related to the Portland Harbor Superfund site or other locations; the cyclicality and impact of general economic conditions; changing conditions in global markets including the impact of sanctions and tariffs, quotas, and other trade actions and import restrictions; economic and geopolitical instability including as a result of military conflict; volatile supply and demand conditions affecting prices and volumes in the markets for raw materials and other inputs we purchase; significant decreases in recycled metal prices; imbalances in supply and demand conditions in the global steel industry; difficulties associated with acquisitions and integration of acquired businesses; supply chain disruptions; reliance on third-party shipping companies, including with respect to freight rates and the availability of transportation; inability to obtain or renew business licenses and permits; the impact of goodwill impairment charges; the impact of long-lived asset and equity investment impairment charges; failure to realize or delays in realizing expected benefits from investments in processing and manufacturing technology improvements; inability to achieve or sustain the benefits from productivity, cost savings, and restructuring initiatives; inability to renew facility leases; customer fulfillment of their contractual obligations; increases in the relative value of the U.S. dollar; the impact of inflation and foreign currency fluctuations; potential limitations on our ability to access capital resources and existing credit facilities; restrictions on our business and financial covenants under the agreement governing our bank credit facilities; the impact of consolidation in the steel industry; product liability claims; the impact of legal proceedings and legal compliance; the adverse impact of climate change; the impact of not realizing deferred tax assets; the impact of tax increases and changes in tax rules; the impact of one or more cybersecurity incidents; environmental compliance costs and potential environmental liabilities; increased environmental regulations and enforcement; compliance with climate change and greenhouse gas emission laws and regulations; the impact of labor shortages or increased labor costs; reliance on employees subject to collective bargaining agreements; and the impact of the underfunded status of multiemployer plans in which we participate.


Schnitzer Announces Third Quarter Fiscal 2022 Earnings Date and Conference Call Webcast Details
PORTLAND, Ore.--(BUSINESS WIRE)--Schnitzer Steel Industries, Inc. (NASDAQ: SCHN) announced that the Company will report financial results for its third quarter fiscal 2022 ended May 31, 2022 on Wednesday, June 29, 2022. The Company will host a webcast conference call to discuss the results at 11:30 a.m. Eastern Time on the same day. The webcast of the call and the accompanying slide presentation may be accessed on Schnitzer's website under Company > Investors > Event Calendar at www.schni

Schnitzer Steel (SCHN) Loses 23.3% in 4 Weeks, Here's Why a Trend Reversal May be Around the Corner
Schnitzer Steel (SCHN) is technically in oversold territory now, so the heavy selling pressure might have exhausted. This along with strong agreement among Wall Street analysts in raising earnings estimates could lead to a trend reversal for the stock.
Similar Companies
Related Metrics
Explore detailed financial metrics and analysis for SCHN.