Companhia Siderúrgica Nacional Key Executives
This section highlights Companhia Siderúrgica Nacional's key executives, including their titles and compensation details.
Find Contacts at Companhia Siderúrgica Nacional
(Showing 0 of )
Companhia Siderúrgica Nacional Earnings
This section highlights Companhia Siderúrgica Nacional's earnings, including key dates, EPS, earnings reports, and earnings call transcripts.
Next Earnings Date
Last Earnings Results
Earnings Call Transcripts
| Transcript | Quarter | Year | Date | Estimated EPS | Actual EPS |
|---|---|---|---|---|---|
| Read Transcript | Q4 | 2024 | 2025-03-13 | N/A | N/A |
| Read Transcript | Q3 | 2024 | 2024-11-13 | N/A | N/A |
| Read Transcript | Q2 | 2024 | 2024-08-13 | N/A | N/A |
| Read Transcript | Q1 | 2024 | 2024-05-10 | N/A | N/A |
| Read Transcript | Q4 | 2023 | 2024-03-07 | $0.19 | $0.13 |
| Read Transcript | Q3 | 2023 | 2023-11-14 | N/A | N/A |
| Read Transcript | Q2 | 2023 | 2023-08-03 | N/A | N/A |
Financial Statements
Access annual & quarterly financial statements for Companhia Siderúrgica Nacional, including income statements, balance sheets, and cash flow statements..
Annual Income Statement
| Breakdown | December 31, 2024 | December 31, 2023 | December 31, 2022 | December 31, 2021 | December 31, 2020 |
|---|---|---|---|---|---|
| Revenue | $43.69B | $45.44B | $44.36B | $47.91B | $30.06B |
| Cost of Revenue | $28.38B | $34.14B | $31.05B | $25.84B | $19.12B |
| Gross Profit | $15.31B | $11.30B | $13.31B | $22.07B | $10.94B |
| Gross Profit Ratio | 35.04% | 24.87% | 30.00% | 46.07% | 36.39% |
| Research and Development Expenses | $- | $58.30M | $58.90M | $77.41M | $27.76M |
| General and Administrative Expenses | $826.12M | $760.89M | $647.78M | $667.21M | $621.65M |
| Selling and Marketing Expenses | $5.40B | $3.73B | $2.56B | $2.37B | $2.00B |
| Selling General and Administrative Expenses | $6.23B | $4.49B | $3.21B | $3.04B | $2.63B |
| Other Expenses | $4.81B | $1.57B | $1.30B | $544.38M | $821.18M |
| Operating Expenses | $11.04B | $6.11B | $4.57B | $3.66B | $3.48B |
| Cost and Expenses | $39.42B | $40.25B | $36.96B | $29.50B | $22.60B |
| Interest Income | $- | $112.67M | $763.26M | $279.47M | $58.06M |
| Interest Expense | $- | $4.17B | $3.28B | $2.27B | $2.25B |
| Depreciation and Amortization | $3.46B | $3.38B | $2.88B | $2.22B | $2.50B |
| EBITDA | $7.28B | $8.58B | $10.07B | $23.08B | $9.69B |
| EBITDA Ratio | 16.67% | 18.89% | 22.70% | 48.17% | 32.24% |
| Operating Income | $4.27B | $5.19B | $7.40B | $18.50B | $7.53B |
| Operating Income Ratio | 9.77% | 11.42% | 16.69% | 38.61% | 25.05% |
| Total Other Income Expenses Net | $-5.81B | $-4.15B | $-3.17B | $98.17M | $-770.34M |
| Income Before Tax | $-1.54B | $1.04B | $4.13B | $18.60B | $4.92B |
| Income Before Tax Ratio | -3.53% | 2.28% | 9.30% | 38.81% | 16.36% |
| Income Tax Expense | $5.21M | $632.72M | $1.96B | $5.00B | $625.51M |
| Net Income | $-1.54B | $-318.21M | $2.17B | $12.26B | $3.79B |
| Net Income Ratio | -3.52% | -0.70% | 4.89% | 25.59% | 12.62% |
| EPS | $-1.16 | $-0.24 | $1.63 | $8.91 | $2.75 |
| EPS Diluted | $-1.16 | $-0.24 | $1.63 | $8.91 | $2.75 |
| Weighted Average Shares Outstanding | 1.33B | 1.33B | 1.33B | 1.38B | 1.38B |
| Weighted Average Shares Outstanding Diluted | 1.33B | 1.33B | 1.33B | 1.38B | 1.38B |
| SEC Filing | Source | Source | Source | Source | Source |
| Breakdown | December 31, 2024 | September 30, 2024 | June 30, 2024 | March 31, 2024 | December 31, 2023 | September 30, 2023 | June 30, 2023 | March 31, 2023 | December 31, 2022 | September 30, 2022 | June 30, 2022 | March 31, 2022 | December 31, 2021 | September 30, 2021 | June 30, 2021 | March 31, 2021 | December 31, 2020 | September 30, 2020 | June 30, 2020 | March 31, 2020 |
|---|---|---|---|---|---|---|---|---|---|---|---|---|---|---|---|---|---|---|---|---|
| Revenue | $12.03B | $11.07B | $10.88B | $9.71B | $12.01B | $11.13B | $10.99B | $11.32B | $11.13B | $10.90B | $10.57B | $11.77B | $10.36B | $10.25B | $15.39B | $11.91B | $9.79B | $8.71B | $6.22B | $5.33B |
| Cost of Revenue | $7.30B | $8.33B | $7.95B | $7.57B | $8.39B | $8.32B | $8.75B | $8.07B | $7.85B | $8.36B | $7.56B | $7.29B | $6.61B | $5.94B | $7.11B | $6.18B | $5.60B | $5.13B | $4.38B | $4.02B |
| Gross Profit | $4.73B | $2.73B | $2.93B | $2.14B | $3.61B | $2.81B | $2.24B | $3.25B | $3.28B | $2.54B | $3.01B | $4.48B | $3.75B | $4.30B | $8.28B | $5.73B | $4.20B | $3.58B | $1.84B | $1.32B |
| Gross Profit Ratio | 39.30% | 24.70% | 26.95% | 22.03% | 30.10% | 25.22% | 20.42% | 28.67% | 29.49% | 23.29% | 28.45% | 38.09% | 36.24% | 42.01% | 53.80% | 48.14% | 42.86% | 41.10% | 29.62% | 24.69% |
| Research and Development Expenses | $- | $14.67M | $16.22M | $9.40M | $19.10M | $14.09M | $16.17M | $8.94M | $26.09M | $15.10M | $12.21M | $13.88M | $30.74M | $14.67M | $19.86M | $12.15M | $12.21M | $5.57M | $4.70M | $5.27M |
| General and Administrative Expenses | $202.61M | $386.62M | $215.00M | $213.16M | $268.08M | $182.31M | $194.45M | $153.35M | $229.49M | $163.23M | $171.90M | $169.51M | $140.34M | $175.66M | $180.74M | $163.38M | $175.86M | $144.06M | $153.85M | $139.58M |
| Selling and Marketing Expenses | $1.39B | $1.49B | $1.35B | $1.19B | $1.00B | $977.64M | $875.69M | $856.68M | $976.12M | $647.94M | $503.93M | $444.00M | $662.74M | $603.62M | $680.19M | $422.59M | $606.10M | $606.94M | $400.46M | $387.64M |
| Selling General and Administrative Expenses | $1.59B | $1.88B | $1.60B | $1.41B | $1.15B | $1.16B | $1.07B | $1.01B | $1.21B | $811.18M | $675.83M | $613.51M | $803.07M | $779.27M | $860.93M | $585.97M | $781.96M | $751.00M | $554.31M | $527.22M |
| Other Expenses | $1.85B | $58.69M | $-189.29M | $-147.91M | $37.06M | $4.42M | $-236.78M | $1.67B | $933.18M | $299.96M | $171.69M | $223.35M | $2.32M | $2.76M | $3.32M | $3.28M | $2.52M | $1.80M | $2.32M | $2.46M |
| Operating Expenses | $3.43B | $1.95B | $1.38B | $1.57B | $1.13B | $1.29B | $1.21B | $2.69B | $2.16B | $1.13B | $859.73M | $850.73M | $1.20B | $957.14M | $1.05B | $736.59M | $1.11B | $878.90M | $796.30M | $807.10M |
| Cost and Expenses | $10.73B | $10.29B | $9.27B | $9.14B | $9.53B | $9.61B | $9.96B | $10.76B | $10.01B | $9.49B | $8.42B | $8.14B | $7.80B | $6.90B | $8.16B | $6.92B | $6.71B | $6.01B | $5.17B | $4.82B |
| Interest Income | $- | $-382.75M | $335.81M | $13.59M | $838.51M | $205.00M | $249.01M | $194.54M | $63.82M | $293.41M | $324.13M | $21.86M | $88.00M | $88.71M | $791.00M | $585.59M | $17.92M | $10.09M | $95.96M | $65.13M |
| Interest Expense | $- | $1.10B | $1.18B | $1.07B | $1.01B | $1.43B | $1.35B | $1.17B | $824.33M | $841.72M | $727.34M | $674.65M | $548.00M | $703.05M | $495.69M | $520.72M | $643.88M | $549.24M | $551.10M | $506.81M |
| Depreciation and Amortization | $993.49M | $963.37M | $937.79M | $909.30M | $907.34M | $867.41M | $811.05M | $804.30M | $855.05M | $709.46M | $660.24M | $655.62M | $648.72M | $562.31M | $527.81M | $482.36M | $1.15B | $486.61M | $452.31M | $437.51M |
| EBITDA | $2.15B | $1.62B | $2.45B | $1.43B | $3.18B | $2.72B | $1.85B | $1.21B | $1.68B | $2.36B | $2.69B | $4.08B | $3.31B | $4.41B | $7.58B | $5.33B | $4.13B | $3.04B | $1.84B | $782.72M |
| EBITDA Ratio | 17.89% | 14.66% | 22.55% | 14.70% | 26.45% | 24.44% | 16.79% | 10.70% | 15.08% | 21.66% | 25.49% | 34.64% | 31.96% | 43.03% | 49.27% | 44.72% | 42.13% | 34.88% | 29.60% | 14.67% |
| Operating Income | $1.29B | $781.48M | $1.35B | $568.23M | $2.48B | $1.65B | $1.03B | $559.01M | $1.12B | $1.62B | $2.03B | $3.42B | $2.66B | $3.35B | $7.23B | $5.00B | $3.09B | $2.70B | $1.05B | $509.85M |
| Operating Income Ratio | 10.74% | 7.06% | 12.39% | 5.85% | 20.65% | 14.81% | 9.41% | 4.94% | 10.04% | 14.83% | 19.22% | 29.05% | 25.70% | 32.67% | 46.98% | 41.95% | 31.54% | 31.01% | 16.82% | 9.56% |
| Total Other Income Expenses Net | $-1.26B | $-1.93B | $-1.23B | $-1.08B | $-635.49M | $-1.22B | $-1.04B | $-1.17B | $-940.49M | $-807.86M | $-835.61M | $-989.25M | $-554.14M | $-658.14M | $-460.88M | $1.91B | $-85.97M | $-701.41M | $-302.97M | $-1.64B |
| Income Before Tax | $30.23M | $-1.15B | $118.12M | $-634.91M | $1.17B | $424.04M | $-44.95M | $-609.11M | $6.65M | $808.43M | $881.27M | $2.43B | $2.11B | $2.74B | $6.77B | $6.98B | $3.18B | $2.00B | $838.13M | $-1.11B |
| Income Before Tax Ratio | 0.25% | -10.39% | 1.09% | -6.54% | 9.78% | 3.81% | -0.41% | -5.38% | 0.06% | 7.42% | 8.34% | 20.65% | 20.41% | 26.70% | 43.98% | 58.55% | 32.49% | 22.99% | 13.47% | -20.72% |
| Income Tax Expense | $115.23M | $-399.24M | $340.73M | $-61.93M | $414.27M | $333.25M | $-328.24M | $213.44M | $-190.14M | $570.79M | $511.94M | $1.07B | $1.05B | $1.41B | $1.26B | $1.28B | $-714.72M | $741.80M | $392.23M | $206.20M |
| Net Income | $-85.00M | $-840.34M | $-528.78M | $-589.70M | $579.07M | $90.79M | $283.30M | $-822.55M | $196.79M | $237.63M | $369.33M | $1.36B | $1.06B | $1.15B | $4.97B | $5.24B | $3.73B | $1.08B | $345.18M | $-1.31B |
| Net Income Ratio | -0.71% | -7.59% | -4.86% | -6.07% | 4.82% | 0.82% | 2.58% | -7.27% | 1.77% | 2.18% | 3.50% | 11.59% | 10.24% | 11.22% | 32.26% | 43.98% | 38.08% | 12.40% | 5.55% | -24.59% |
| EPS | $-0.06 | $0.00 | $-0.40 | $-0.44 | $0.44 | $-0.12 | $0.21 | $-0.62 | $0.15 | $0.18 | $0.28 | $1.03 | $0.79 | $0.83 | $3.60 | $3.80 | $2.70 | $0.78 | $0.25 | $-0.95 |
| EPS Diluted | $-0.06 | $0.00 | $-0.40 | $-0.44 | $0.44 | $-0.12 | $0.21 | $-0.62 | $0.15 | $0.18 | $0.27 | $1.03 | $0.79 | $0.83 | $3.60 | $3.80 | $2.70 | $0.78 | $0.25 | $-0.95 |
| Weighted Average Shares Outstanding | 1.33B | - | 1.33B | 1.33B | 1.33B | 1.33B | 1.33B | 1.33B | 1.33B | 1.33B | 1.33B | 1.33B | 1.34B | 1.33B | 1.38B | 1.38B | 1.38B | 1.38B | 1.38B | 1.38B |
| Weighted Average Shares Outstanding Diluted | 1.33B | - | 1.33B | 1.33B | 1.33B | 1.33B | 1.33B | 1.33B | 1.33B | 1.33B | 1.39B | 1.33B | 1.34B | 1.33B | 1.38B | 1.38B | 1.38B | 1.38B | 1.38B | 1.38B |
| SEC Filing | Source | Source | Source | Source | Source | Source | Source | Source | Source | Source | Source | Source | Source | Source | Source | Source | Source | Source | Source | Source |
Annual Balance Sheet
| Breakdown | December 31, 2024 | December 31, 2023 | December 31, 2022 | December 31, 2021 | December 31, 2020 |
|---|---|---|---|---|---|
| Cash and Cash Equivalents | $23.31B | $16.05B | $11.99B | $16.65B | $9.94B |
| Short Term Investments | $911.38M | $1.54B | $1.46B | $2.66B | $3.79B |
| Cash and Short Term Investments | $24.22B | $17.59B | $13.45B | $19.30B | $13.73B |
| Net Receivables | $2.90B | $3.27B | $3.23B | $2.60B | $2.87B |
| Inventory | $10.44B | $9.56B | $11.29B | $10.94B | $4.82B |
| Other Current Assets | $2.22B | $2.70B | $622.71M | $345.33M | $290.37M |
| Total Current Assets | $39.79B | $33.08B | $30.61B | $34.97B | $23.39B |
| Property Plant Equipment Net | $30.43B | $27.93B | $26.37B | $21.53B | $19.72B |
| Goodwill | $- | $4.13B | $4.13B | $3.73B | $3.61B |
| Intangible Assets | $10.44B | $6.41B | $11.54T | $3.93B | $3.71B |
| Goodwill and Intangible Assets | $10.44B | $10.54B | $10.79B | $7.66B | $7.32B |
| Long Term Investments | $5.92B | $5.35B | $5.22B | $4.00B | $3.82B |
| Tax Assets | $- | $- | $5.10B | $5.07B | $3.87B |
| Other Non-Current Assets | $17.34B | $14.64B | $7.27B | $6.15B | $4.89B |
| Total Non-Current Assets | $64.12B | $58.45B | $54.74B | $44.41B | $39.62B |
| Other Assets | $- | $- | $- | $- | $- |
| Total Assets | $103.91B | $91.53B | $85.35B | $79.38B | $63.00B |
| Account Payables | $7.03B | $7.76B | $12.31B | $10.89B | $5.44B |
| Short Term Debt | $9.03B | $7.75B | $5.37B | $5.61B | $4.22B |
| Tax Payables | $- | $864.61M | $870.33M | $3.36B | $2.10B |
| Deferred Revenue | $- | $- | $1.12B | $2.14B | $1.10B |
| Other Current Liabilities | $9.06B | $8.64B | $2.81B | $2.55B | $1.86B |
| Total Current Liabilities | $25.12B | $25.02B | $22.48B | $24.54B | $14.73B |
| Long Term Debt | $48.73B | $37.84B | $36.24B | $27.51B | $31.58B |
| Deferred Revenue Non-Current | $- | $- | $943.92M | $947.90M | $1.73B |
| Deferred Tax Liabilities Non-Current | $- | $- | $1.63B | $1.01B | $1.17B |
| Other Non-Current Liabilities | $14.60B | $8.99B | $4.82B | $3.95B | $5.44B |
| Total Non-Current Liabilities | $63.33B | $46.83B | $41.06B | $31.46B | $37.02B |
| Other Liabilities | $- | $- | $- | $- | $- |
| Total Liabilities | $88.45B | $71.84B | $63.54B | $56.00B | $51.75B |
| Preferred Stock | $- | $- | $- | $- | $- |
| Common Stock | $10.24B | $10.24B | $10.24B | $10.24B | $6.04B |
| Retained Earnings | $1.80B | $6.07B | $1.61B | $11.03B | $5.88B |
| Accumulated Other Comprehensive Income Loss | $232.05M | $7.26B | $9.25B | $11.01B | $3.93B |
| Other Total Stockholders Equity | $- | $-6.07B | $-1.61B | $-11.97B | $-5.94B |
| Total Stockholders Equity | $12.27B | $17.50B | $19.49B | $20.31B | $9.91B |
| Total Equity | $15.46B | $19.68B | $21.82B | $23.37B | $11.25B |
| Total Liabilities and Stockholders Equity | $103.91B | $91.53B | $85.35B | $79.38B | $63.00B |
| Minority Interest | $3.19B | $2.18B | $2.33B | $3.06B | $1.34B |
| Total Liabilities and Total Equity | $103.91B | $91.53B | $85.35B | $79.38B | $63.00B |
| Total Investments | $6.83B | $7.23B | $6.67B | $6.65B | $7.61B |
| Total Debt | $57.75B | $45.59B | $41.61B | $33.12B | $35.80B |
| Net Debt | $34.44B | $29.55B | $29.62B | $16.47B | $25.86B |
Balance Sheet Charts
| Breakdown | December 31, 2024 | September 30, 2024 | June 30, 2024 | March 31, 2024 | December 31, 2023 | September 30, 2023 | June 30, 2023 | March 31, 2023 | December 31, 2022 | September 30, 2022 | June 30, 2022 | March 31, 2022 | December 31, 2021 | September 30, 2021 | June 30, 2021 | March 31, 2021 | December 31, 2020 | September 30, 2020 | June 30, 2020 | March 31, 2020 |
|---|---|---|---|---|---|---|---|---|---|---|---|---|---|---|---|---|---|---|---|---|
| Cash and Cash Equivalents | $23.31B | $18.45B | $15.55B | $14.86B | $16.05B | $15.30B | $11.98B | $13.67B | $11.99B | $14.32B | $14.92B | $13.30B | $16.65B | $15.26B | $21.76B | $13.91B | $9.94B | $5.72B | $4.21B | $3.28B |
| Short Term Investments | $911.38M | $1.03B | $1.30B | $1.60B | $1.54B | $1.14B | $1.20B | $1.54B | $1.46B | $1.48B | $1.63B | $2.44B | $2.66B | $3.20B | $3.59B | $4.30B | $3.79B | $2.81B | $2.17B | $1.65B |
| Cash and Short Term Investments | $24.22B | $19.48B | $16.80B | $16.46B | $17.59B | $16.45B | $13.18B | $15.21B | $13.45B | $15.80B | $16.55B | $15.74B | $19.30B | $18.46B | $25.34B | $18.21B | $13.73B | $8.53B | $6.39B | $4.93B |
| Net Receivables | $2.90B | $2.32B | $2.55B | $2.49B | $3.27B | $3.18B | $2.67B | $3.55B | $3.23B | $2.73B | $2.74B | $4.09B | $2.60B | $3.24B | $5.31B | $4.22B | $2.87B | $2.67B | $1.81B | $2.21B |
| Inventory | $10.44B | $10.53B | $9.94B | $9.64B | $9.57B | $9.28B | $9.51B | $10.23B | $11.29B | $10.43B | $10.56B | $10.24B | $10.94B | $10.04B | $7.05B | $5.67B | $4.82B | $4.96B | $5.92B | $5.43B |
| Other Current Assets | $2.22B | $408.31M | $2.67B | $1.48B | $553.32M | $499.77M | $656.10M | $624.71M | $622.71M | $731.99M | $493.98M | $368.55M | $345.33M | $508.83M | $283.30M | $380.70M | $290.37M | $347.10M | $287.65M | $341.41M |
| Total Current Assets | $39.79B | $34.89B | $31.96B | $32.52B | $33.08B | $31.71B | $28.28B | $31.67B | $30.61B | $31.12B | $31.78B | $31.83B | $34.97B | $33.61B | $38.80B | $29.77B | $23.39B | $18.54B | $16.05B | $14.39B |
| Property Plant Equipment Net | $30.43B | $29.19B | $28.63B | $28.00B | $27.93B | $27.16B | $26.81B | $26.48B | $26.37B | $25.35B | $21.90B | $21.51B | $21.53B | $20.95B | $19.91B | $19.76B | $19.72B | $20.03B | $19.90B | $19.86B |
| Goodwill | $- | $4.13B | $4.13B | $4.13B | $4.13B | $4.13B | $4.13B | $4.13B | $4.13B | $3.83B | $3.73B | $3.73B | $3.73B | $3.71B | $3.61B | $3.61B | $3.61B | $3.61B | $3.61B | $3.61B |
| Intangible Assets | $10.44B | $6.29B | $6.33B | $6.37B | $6.41B | $6.49B | $6.52B | $6.59B | $6.66B | $3.86B | $3.82B | $3.83B | $3.93B | $3.96B | $3.65B | $3.71B | $3.71B | $3.75B | $3.73B | $3.71B |
| Goodwill and Intangible Assets | $10.44B | $10.42B | $10.46B | $10.49B | $10.54B | $10.61B | $10.62B | $10.73B | $10.79B | $7.69B | $7.55B | $7.56B | $7.66B | $7.67B | $7.25B | $7.32B | $7.32B | $7.35B | $7.34B | $7.32B |
| Long Term Investments | $5.92B | $5.94B | $5.77B | $10.02B | $10.89B | $5.38B | $5.28B | $5.22B | $5.22B | $5.67B | $4.46B | $4.18B | $4.00B | $4.03B | $3.90B | $3.72B | $3.82B | $3.66B | $3.61B | $3.56B |
| Tax Assets | $- | $- | $-1 | $5.51B | $5.03B | $5.41B | $4.98B | $4.94B | $5.10B | $5.07B | $4.46B | $3.81B | $5.07B | $4.02B | $4.25B | $3.93B | $3.87B | $2.50B | $2.50B | $2.48B |
| Other Non-Current Assets | $17.34B | $16.43B | $16.61B | $5.31B | $4.06B | $8.13B | $7.86B | $7.57B | $7.27B | $7.75B | $6.70B | $6.25B | $6.15B | $5.79B | $5.33B | $5.18B | $4.89B | $4.93B | $5.55B | $5.12B |
| Total Non-Current Assets | $64.12B | $61.99B | $61.46B | $59.33B | $58.45B | $56.70B | $55.56B | $54.92B | $54.74B | $51.52B | $45.06B | $43.32B | $44.41B | $42.46B | $40.64B | $39.91B | $39.62B | $38.48B | $38.91B | $38.34B |
| Other Assets | $- | $- | $1 | $- | $1 | $- | $- | $- | $- | $- | $- | $- | $- | $- | $- | $- | $- | $- | $- | $- |
| Total Assets | $103.91B | $96.88B | $93.42B | $91.84B | $91.53B | $88.41B | $83.84B | $86.60B | $85.35B | $82.64B | $76.84B | $75.15B | $79.38B | $76.07B | $79.44B | $69.68B | $63.00B | $57.02B | $54.96B | $52.72B |
| Account Payables | $7.03B | $10.96B | $5.70B | $11.51B | $11.95B | $10.04B | $9.13B | $9.90B | $12.31B | $11.77B | $10.01B | $9.93B | $10.89B | $10.03B | $9.19B | $7.63B | $5.44B | $5.17B | $4.56B | $4.39B |
| Short Term Debt | $9.03B | $8.79B | $9.02B | $9.19B | $7.75B | $6.20B | $5.78B | $5.37B | $5.37B | $5.15B | $5.06B | $4.61B | $5.61B | $4.04B | $4.19B | $3.71B | $4.22B | $3.68B | $4.89B | $5.35B |
| Tax Payables | $- | $615.38M | $853.88M | $748.22M | $864.61M | $823.11M | $702.21M | $826.47M | $870.33M | $1.16B | $1.22B | $1.12B | $3.36B | $3.63B | $3.21B | $2.07B | $2.10B | $1.69B | $1.11B | $506.34M |
| Deferred Revenue | $- | $2.86B | $- | $2.02B | $2.06B | $1.92B | $1.47B | $1.09B | $1.12B | $1.54B | $1.05B | $1.20B | $2.14B | $2.84B | $1.17B | $1.15B | $1.10B | $962.79M | $780.39M | $809.17M |
| Other Current Liabilities | $9.06B | $2.88B | $9.28B | $1.69B | $2.39B | $1.71B | $1.45B | $2.63B | $2.81B | $1.77B | $1.55B | $2.40B | $2.55B | $1.65B | $1.20B | $2.00B | $1.86B | $1.36B | $1.15B | $919.32M |
| Total Current Liabilities | $25.12B | $26.11B | $24.84B | $25.15B | $25.02B | $20.68B | $18.53B | $19.82B | $22.48B | $21.39B | $18.89B | $19.26B | $24.54B | $22.19B | $18.96B | $16.55B | $14.73B | $12.86B | $12.49B | $11.97B |
| Long Term Debt | $48.73B | $42.90B | $42.63B | $37.99B | $37.84B | $38.12B | $36.65B | $37.70B | $36.24B | $32.72B | $30.32B | $26.89B | $27.51B | $26.24B | $30.94B | $30.97B | $31.58B | $32.98B | $32.58B | $30.74B |
| Deferred Revenue Non-Current | $- | $- | $- | $4.67B | $5.14B | $5.53B | $3.83B | $3.34B | $943.92M | $1.08B | $913.57M | $783.71M | $947.90M | $1.13B | $1.25B | $1.51B | $1.73B | $- | $1.54B | $1.70B |
| Deferred Tax Liabilities Non-Current | $- | $- | $- | $710.03M | $304.00M | $1.74B | $1.96B | $1.79B | $1.63B | $1.32B | $813.07M | $977.51M | $1.01B | $1.07B | $1.10B | $1.13B | $1.17B | $1.09B | $1.11B | $1.16B |
| Other Non-Current Liabilities | $14.60B | $12.63B | $9.52B | $8.94B | $8.99B | $9.51B | $8.04B | $7.38B | $4.82B | $4.74B | $3.76B | $3.90B | $3.95B | $4.34B | $4.44B | $2.25B | $5.44B | $4.84B | $4.42B | $4.61B |
| Total Non-Current Liabilities | $63.33B | $55.54B | $52.15B | $46.93B | $46.83B | $47.62B | $44.69B | $45.09B | $41.06B | $37.46B | $34.09B | $30.79B | $31.46B | $30.58B | $35.38B | $35.86B | $37.02B | $37.82B | $37.00B | $35.35B |
| Other Liabilities | $- | $- | $- | $- | $1 | $- | $- | $- | $- | $- | $- | $- | $- | $- | $- | $- | $- | $- | $- | $- |
| Total Liabilities | $88.45B | $81.64B | $76.99B | $72.08B | $71.84B | $68.31B | $63.22B | $64.90B | $63.54B | $58.85B | $52.98B | $50.05B | $56.00B | $52.77B | $54.34B | $52.40B | $51.75B | $50.68B | $49.49B | $47.32B |
| Preferred Stock | $- | $- | $- | $- | $- | $- | $- | $- | $- | $- | $- | $- | $- | $- | $- | $- | $- | $- | $58.26M | $58.26M |
| Common Stock | $10.24B | $10.24B | $10.24B | $10.24B | $10.24B | $10.24B | $10.24B | $10.24B | $10.24B | $10.24B | $10.24B | $10.24B | $10.24B | $6.04B | $6.04B | $6.04B | $6.04B | $4.54B | $4.54B | $4.54B |
| Retained Earnings | $1.80B | $-1.96B | $-1.12B | $-589.70M | $6.07B | $-897.27M | $-742.79M | $-926.40M | $1.61B | $1.54B | $1.40B | $1.21B | $11.03B | $9.61B | $10.21B | $5.24B | $5.88B | $65.11M | $-1.02B | $-1.36B |
| Accumulated Other Comprehensive Income Loss | $232.05M | $5.14B | $4.93B | $7.06B | $7.26B | $8.42B | $8.98B | $9.91B | $9.25B | $9.34B | $9.62B | $11.75B | $11.01B | $4.61B | $5.53B | $3.17B | $3.93B | $449.88M | $628.89M | $990.86M |
| Other Total Stockholders Equity | $- | $- | $- | $-6.07B | $-6.07B | $- | $- | $- | $-1.61B | $- | $- | $-1.32B | $-11.97B | $-58.26M | $-58.26M | $-58.26M | $-5.94B | $-58.26M | $-58.26M | $-58.26M |
| Total Stockholders Equity | $12.27B | $13.42B | $14.05B | $17.30B | $17.50B | $17.76B | $18.48B | $19.23B | $19.49B | $21.11B | $21.27B | $21.88B | $20.31B | $20.19B | $21.72B | $14.39B | $9.91B | $5.00B | $4.15B | $4.17B |
| Total Equity | $15.46B | $15.24B | $16.43B | $19.76B | $19.68B | $20.10B | $20.62B | $21.69B | $21.82B | $23.79B | $23.86B | $25.10B | $23.37B | $23.30B | $25.10B | $17.28B | $11.25B | $6.34B | $5.46B | $5.41B |
| Total Liabilities and Stockholders Equity | $103.91B | $96.88B | $93.42B | $91.84B | $91.53B | $88.41B | $83.84B | $86.60B | $85.35B | $82.64B | $76.84B | $75.15B | $79.38B | $76.07B | $79.44B | $69.68B | $63.00B | $57.02B | $54.96B | $52.72B |
| Minority Interest | $3.19B | $1.82B | $2.38B | $2.46B | $2.18B | $2.34B | $2.14B | $2.47B | $2.33B | $2.68B | $2.59B | $3.22B | $3.06B | $3.11B | $3.38B | $2.89B | $1.34B | $1.35B | $1.31B | $1.24B |
| Total Liabilities and Total Equity | $103.91B | $96.88B | $93.42B | $91.84B | $91.53B | $88.41B | $83.84B | $86.60B | $85.35B | $82.64B | $76.84B | $75.15B | $79.38B | $76.07B | $79.44B | $69.68B | $63.00B | $57.02B | $54.96B | $52.72B |
| Total Investments | $6.83B | $6.97B | $12.87B | $11.61B | $12.43B | $6.52B | $6.48B | $6.76B | $6.67B | $7.14B | $6.09B | $6.62B | $6.82B | $7.23B | $7.49B | $8.02B | $7.61B | $6.47B | $5.79B | $5.21B |
| Total Debt | $57.75B | $51.69B | $51.64B | $47.18B | $45.59B | $44.31B | $42.43B | $43.07B | $41.61B | $37.87B | $35.38B | $31.50B | $33.12B | $30.28B | $35.13B | $34.68B | $35.80B | $36.24B | $37.47B | $36.09B |
| Net Debt | $34.44B | $33.24B | $36.10B | $32.32B | $29.55B | $29.01B | $30.45B | $29.40B | $29.62B | $23.55B | $20.46B | $18.20B | $16.47B | $15.03B | $13.37B | $20.77B | $25.86B | $30.52B | $33.26B | $32.81B |
Annual Cash Flow
| Breakdown | December 31, 2024 | December 31, 2023 | December 31, 2022 | December 31, 2021 | December 31, 2020 |
|---|---|---|---|---|---|
| Net Income | $-1.54B | $-318.21M | $1.55B | $27.05B | $4.29B |
| Depreciation and Amortization | $- | $- | $2.88B | $2.22B | $2.50B |
| Deferred Income Tax | $- | $-543.41M | $513.04M | $697.95M | $-1.42B |
| Stock Based Compensation | $- | $- | $- | $- | $- |
| Change in Working Capital | $- | $-4.32B | $-4.33B | $503.42M | $3.99B |
| Accounts Receivables | $- | $238.51M | $-1.40B | $1.21B | $-545.32M |
| Inventory | $- | $1.30B | $-734.99M | $-6.35B | $755.57M |
| Accounts Payables | $- | $1.16B | $391.83M | $4.99B | $1.61B |
| Other Working Capital | $- | $-7.02B | $-2.58B | $655.85M | $2.18B |
| Other Non Cash Items | $1.54B | $12.48B | $4.31B | $-11.82B | $2.71B |
| Net Cash Provided by Operating Activities | $- | $7.29B | $2.04B | $16.43B | $9.58B |
| Investments in Property Plant and Equipment | $- | $-4.41B | $-5.38B | $-2.86B | $-1.68B |
| Acquisitions Net | $- | $- | $-5.32B | $-208.98M | $- |
| Purchases of Investments | $- | $-338.57M | $-662.76M | $-1.02B | $-132.20M |
| Sales Maturities of Investments | $- | $136.68M | $21.57M | $4.67B | $39.43M |
| Other Investing Activities | $- | $20.88M | $-120.93M | $-123.66M | $-87.05M |
| Net Cash Used for Investing Activities | $- | $-4.59B | $-11.45B | $447.93M | $-1.86B |
| Debt Repayment | $- | $5.51B | $9.25B | $-4.91B | $1.53B |
| Common Stock Issued | $- | $- | $- | $1.35B | $- |
| Common Stock Repurchased | $- | $- | $-410.57M | $-1.52B | $- |
| Dividends Paid | $- | $-3.98B | $-3.76B | $-3.29B | $-309.35M |
| Other Financing Activities | $- | $-201.92M | $-334.71M | $-162.85M | $-39.17M |
| Net Cash Used Provided by Financing Activities | $- | $1.32B | $4.75B | $-8.53B | $1.19B |
| Effect of Forex Changes on Cash | $- | $27.80M | $9.59M | $-9.44M | $-42.66M |
| Net Change in Cash | $-16.05B | $4.05B | $-4.66B | $6.70B | $8.86B |
| Cash at End of Period | $- | $16.05B | $11.99B | $16.65B | $9.94B |
| Cash at Beginning of Period | $16.05B | $11.99B | $16.65B | $9.94B | $1.09B |
| Operating Cash Flow | $- | $7.29B | $2.04B | $16.43B | $9.58B |
| Capital Expenditure | $- | $-4.41B | $-5.38B | $-2.86B | $-1.68B |
| Free Cash Flow | $- | $2.88B | $-3.33B | $13.57B | $7.89B |
Cash Flow Charts
| Breakdown | December 31, 2024 | September 30, 2024 | June 30, 2024 | March 31, 2024 | December 31, 2023 | September 30, 2023 | June 30, 2023 | March 31, 2023 | December 31, 2022 | September 30, 2022 | June 30, 2022 | March 31, 2022 | December 31, 2021 | September 30, 2021 | June 30, 2021 | March 31, 2021 | December 31, 2020 | September 30, 2020 | June 30, 2020 | March 31, 2020 |
|---|---|---|---|---|---|---|---|---|---|---|---|---|---|---|---|---|---|---|---|---|
| Net Income | $-85.00M | $-750.77M | $-222.61M | $-589.70M | $579.07M | $90.79M | $283.30M | $-926.40M | $16.94M | $-1.38B | $369.33M | $1.21B | $903.30M | $1.15B | $4.97B | $5.24B | $3.90B | $1.26B | $445.90M | $-1.31B |
| Depreciation and Amortization | $993.49M | $963.37M | $938.65M | $909.30M | $907.34M | $867.01M | $811.86M | $803.00M | $847.27M | $710.34M | $662.25M | $657.80M | $648.30M | $562.31M | $527.81M | $482.36M | $1.15B | $486.61M | $452.31M | $437.51M |
| Deferred Income Tax | $- | $-334.00M | $-359.33M | $-305.15M | $206.12M | $-311.14M | $-345.30M | $-94.17M | $-107.08M | $321.90M | $-175.36M | $489.44M | $458.51M | $683.27M | $-340.78M | $-103.06M | $-1.32B | $11.89M | $-91.59M | $-20.04M |
| Stock Based Compensation | $- | $- | $- | $- | $- | $- | $- | $- | $- | $- | $- | $- | $- | $- | $- | $- | $- | $- | $- | $- |
| Change in Working Capital | $-2.65B | $2.93B | $555.15M | $-825.69M | $10.90M | $2.88B | $1.17B | $333.24M | $-1.19B | $-4.90B | $894.31M | $-5.34B | $-1.79B | $2.10B | $76.82M | $-167.52M | $1.34B | $2.06B | $789.28M | $-188.01M |
| Accounts Receivables | $-546.93M | $4.63M | $189.56M | $326.51M | $-749.47M | $-303.23M | $921.66M | $-343.69M | $-821.70M | $-1.05B | $1.62B | $-2.56B | $-43.56M | $3.79B | $-1.18B | $-1.36B | $-152.22M | $-713.24M | $441.56M | $-121.42M |
| Inventory | $298.68M | $-725.81M | $-208.14M | $-270.76M | $-308.02M | $158.18M | $593.20M | $859.92M | $-818.26M | $178.71M | $-565.33M | $234.05M | $-1.62B | $-2.35B | $-1.57B | $-813.71M | $206.81M | $990.26M | $-427.98M | $-13.51M |
| Accounts Payables | $- | $687.16M | $-637.16M | $-690.53M | $718.48M | $906.47M | $-800.18M | $-21.48M | $54.73M | $1.42B | $54.93M | $-2.87M | $15.92M | $777.49M | $1.51B | $1.84B | $868.81M | $442.32M | $157.45M | $137.26M |
| Other Working Capital | $-2.40B | $2.96B | $1.21B | $-190.91M | $349.91M | $2.12B | $451.00M | $-161.50M | $397.03M | $-5.46B | $-211.12M | $-3.01B | $-145.89M | $-117.91M | $1.32B | $161.35M | $412.90M | $1.34B | $618.26M | $-190.34M |
| Other Non Cash Items | $5.29B | $659.31M | $1.34B | $2.65B | $2.10B | $1.15B | $811.73M | $438.43M | $342.32M | $6.26B | $1.13B | $-872.10M | $976.65M | $1.27B | $90.62M | $-1.51B | $80.30M | $288.03M | $356.72M | $1.99B |
| Net Cash Provided by Operating Activities | $3.55B | $3.47B | $2.25B | $-616.09M | $1.65B | $3.97B | $1.11B | $554.10M | $-88.75M | $1.01B | $2.88B | $-3.86B | $1.34B | $5.21B | $4.79B | $3.46B | $3.99B | $3.62B | $1.50B | $466.93M |
| Investments in Property Plant and Equipment | $-2.06B | $-1.31B | $-1.34B | $-784.08M | $-1.56B | $-1.19B | $-919.13M | $-735.83M | $-3.02B | $-1.72B | $-838.42M | $-700.99M | $-964.88M | $-792.52M | $-734.22M | $-373.09M | $-565.68M | $-397.59M | $-366.87M | $-353.70M |
| Acquisitions Net | $- | $- | $- | $- | $- | $114.76M | $- | $- | $-582.51M | $-4.27B | $-459.67M | $- | $-727.75M | $792.52M | $- | $- | $- | $- | $- | $- |
| Purchases of Investments | $- | $-2.25M | $2.50M | $-34.50M | $-87.25M | $-115.56M | $-141.37M | $-20.38M | $-232.75M | $-428.01M | $-142.74M | $-129.50M | $-145.36M | $-816.23M | $-62.52M | $- | $10.82M | $-106.48M | $-36.54M | $- |
| Sales Maturities of Investments | $- | $- | $96.91M | $- | $-235.47M | $-5.61M | $283.37M | $- | $-46.79M | $68.36M | $-4.36M | $10.85M | $727.75M | $-219.28M | $1.36B | $3.18B | $- | $-21.72M | $-6.20M | $27.91M |
| Other Investing Activities | $4.37B | $-18.72M | $-28.12M | $-15.92M | $116.64M | $7.62M | $-15.57M | $-82.19M | $-4.51M | $-149.75M | $-22.45M | $-97.86M | $339.48M | $-1.01B | $-97.61M | $-70.39M | $39.43M | $-19.68M | $-16.21M | $-51.15M |
| Net Cash Used for Investing Activities | $2.32B | $-1.33B | $-1.27B | $-834.50M | $-1.77B | $-1.19B | $-792.70M | $-838.39M | $-3.89B | $-6.51B | $-1.47B | $-928.35M | $-770.76M | $-2.05B | $529.10M | $2.74B | $-515.43M | $-523.76M | $-419.61M | $-404.85M |
| Debt Repayment | $414.78M | $1.14B | $1.07B | $289.66M | $2.16B | $614.68M | $766.13M | $1.97B | $4.20B | $1.51B | $1.62B | $1.93B | $2.20B | $-2.04B | $-1.69B | $-3.37B | $-4.40B | $-4.40B | $484.15M | $4.53B |
| Common Stock Issued | $- | $- | $- | $- | $- | $- | $- | $- | $- | $- | $- | $- | $- | $- | $- | $1.35B | $- | $- | $- | $- |
| Common Stock Repurchased | $-9.09M | $-327.07M | $- | $- | $- | $- | $- | $- | $- | $-2.09M | $-19.05M | $-391.52M | $-1.37B | $-145.14M | $- | $- | $- | $- | $- | $- |
| Dividends Paid | $-1.30B | $- | $-1.23B | $-78.00K | $-1.26B | $-2.00K | $-2.72B | $- | $-2.49B | $- | $-1.18B | $-82.44M | $-57.00K | $-2.21B | $-900.56M | $-176.22M | $-174.43M | $-134.75M | $-34.00K | $-136.00K |
| Other Financing Activities | $-55.26M | $-26.11M | $-45.85M | $-17.98M | $-33.21M | $-61.63M | $-101.96M | $-5.12M | $-36.90M | $2.87B | $-173.77M | $-58.42M | $-3.06M | $3.39B | $6.44B | $-11.42M | $5.32B | $2.96B | $-620.14M | $-2.37B |
| Net Cash Used Provided by Financing Activities | $-951.96M | $787.02M | $-210.49M | $271.60M | $865.00M | $553.05M | $-2.06B | $1.96B | $1.67B | $4.38B | $239.56M | $1.40B | $826.28M | $-9.64B | $2.50B | $-2.21B | $742.88M | $-1.58B | $-136.02M | $2.16B |
| Effect of Forex Changes on Cash | $-54.40M | $-15.59M | $-84.11M | $-8.87M | $-7.31M | $-5.87M | $36.49M | $4.49M | $-21.73M | $11.13M | $-24.96M | $45.14M | $-1.87M | $-21.02M | $30.11M | $-16.66M | $1.84M | $-5.21M | $-12.26M | $-27.03M |
| Net Change in Cash | $4.86B | $2.91B | $687.01M | $-1.19B | $743.60M | $3.33B | $-1.70B | $1.68B | $-2.33B | $9.89B | $1.62B | $-3.35B | $1.39B | $-6.50B | $7.85B | $3.96B | $4.22B | $1.51B | $932.41M | $1.10B |
| Cash at End of Period | $23.31B | $18.45B | $15.55B | $14.86B | $16.05B | $15.30B | $11.98B | $13.67B | $11.99B | $14.32B | $14.92B | $13.30B | $16.65B | $15.26B | $21.76B | $13.91B | $9.94B | $5.72B | $4.21B | $2.19B |
| Cash at Beginning of Period | $18.45B | $15.55B | $14.86B | $16.05B | $15.30B | $11.98B | $13.67B | $11.99B | $14.32B | $4.43B | $13.30B | $16.65B | $15.26B | $21.76B | $13.91B | $9.94B | $5.72B | $4.21B | $3.28B | $1.09B |
| Operating Cash Flow | $3.55B | $3.47B | $2.25B | $-616.09M | $1.65B | $3.97B | $1.11B | $554.10M | $-88.75M | $1.01B | $2.88B | $-3.86B | $1.34B | $5.21B | $4.79B | $3.46B | $3.99B | $3.62B | $1.50B | $466.93M |
| Capital Expenditure | $-2.06B | $-1.31B | $-1.34B | $-784.08M | $-1.56B | $-1.19B | $-919.13M | $-735.83M | $-3.02B | $-1.72B | $-838.42M | $-700.99M | $-964.88M | $-792.52M | $-734.22M | $-373.09M | $-565.68M | $-397.59M | $-366.87M | $-353.70M |
| Free Cash Flow | $1.49B | $2.16B | $910.32M | $-1.40B | $91.98M | $2.78B | $195.41M | $-181.72M | $-3.11B | $-712.53M | $2.04B | $-4.56B | $372.85M | $4.42B | $4.06B | $3.08B | $3.43B | $3.22B | $1.13B | $113.23M |

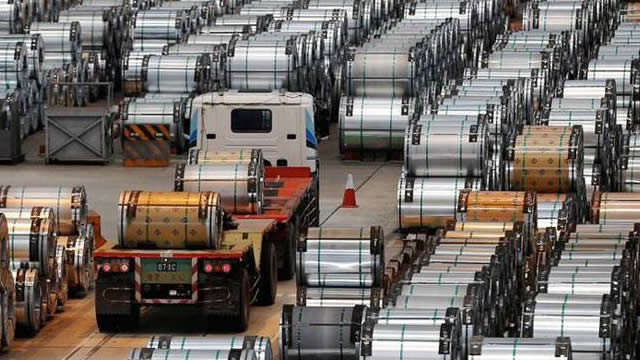
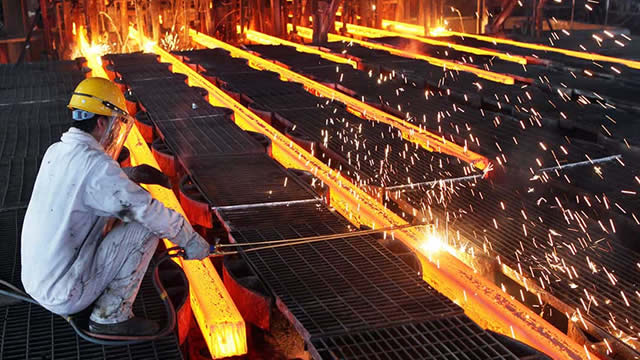
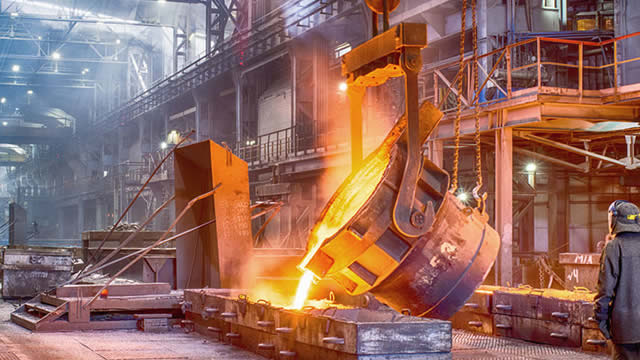
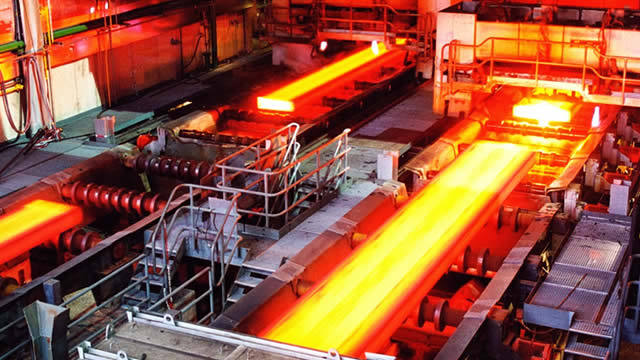
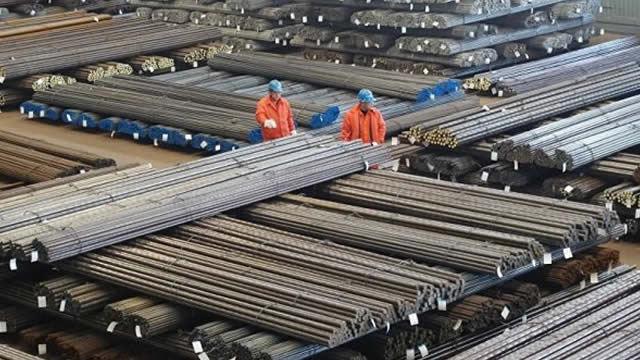
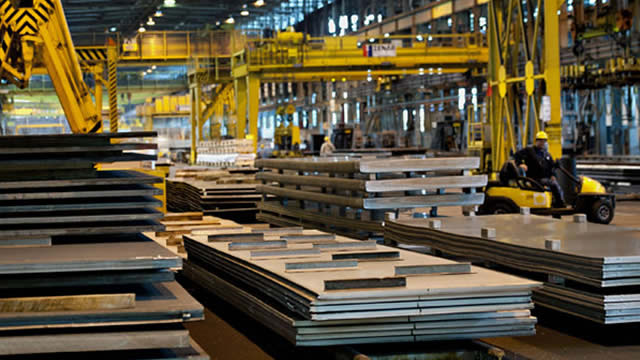
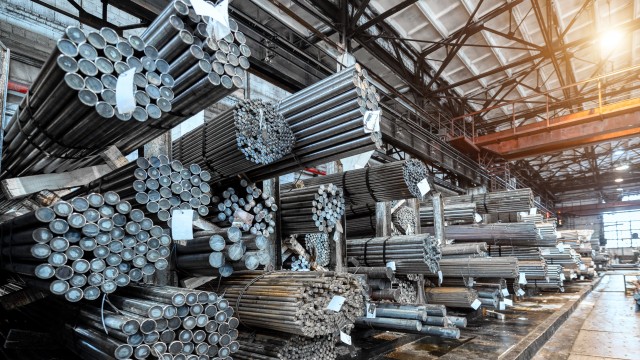
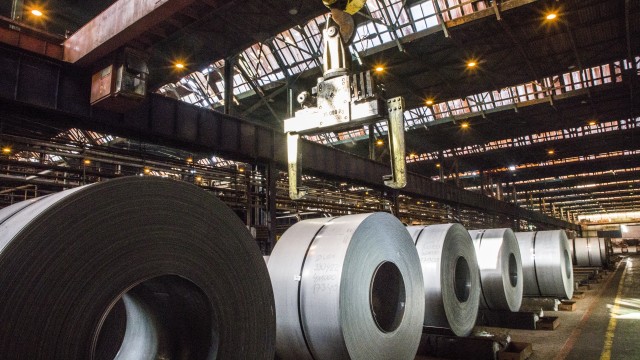
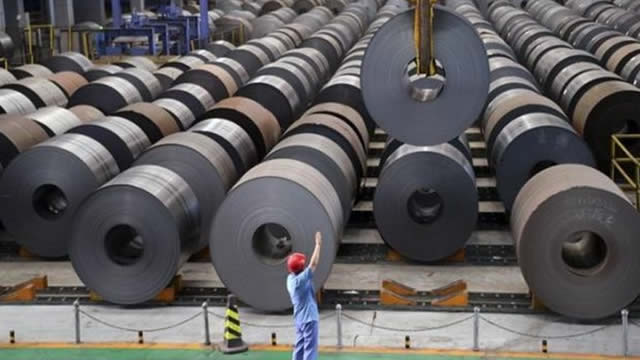
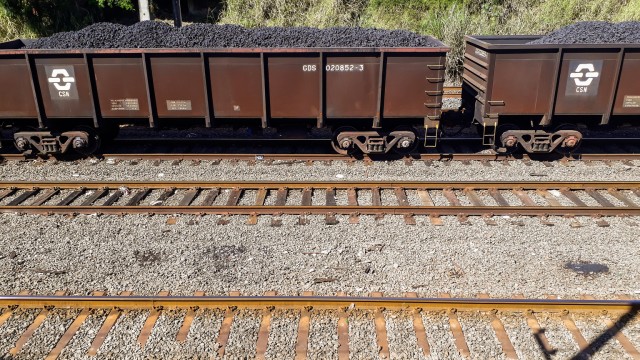
Companhia Siderúrgica Nacional operates as an integrated steel producer in Brazil and Latin America. It operates in five segments: Steel, Mining, Logistics, Energy, and Cement. The company offers flat steel products, such as high, medium, low carbon, micro-alloyed, ultra-low-carbon, and interstitial free slabs; hot-rolled products, including heavy and light-gauge hot-rolled coils and sheets; cold-rolled products comprising cold-rolled coils and sheets; galvanized products; tin mill products that consist of flat-rolled low-carbon steel coils or sheets; and profiles, channels, UPE sections, and steel sleepers for the distribution, packaging, automotive, home appliance, and construction industries. It primarily explores for iron ore reserves at Casa de Pedra and Engenho mines located in the city of Congonhas; and limestone and dolomite at the Bocaina mine located in the city of Arcos in the state of Minas Gerais, Brazil, as well as produces tin. In addition, the company operates railway and port facilities; produces and sells cement to construction material stores, home centers, concrete producers, construction companies, mortar industries, and cement artifact producers; and generates electric power from its thermoelectric co-generation and hydroelectric power plants. It also exports its products. The company was incorporated in 1941 and is headquartered in São Paulo, Brazil. Companhia Siderúrgica Nacional operates as a subsidiary of Vicunha Aços S.A.
$1.68
Stock Price
$2.23B
Market Cap
29.70K
Employees
São Paulo, SP
Location
Revenue (FY 2024)
$43.69B
-3.9% YoY
Net Income (FY 2024)
$-1.54B
-383.4% YoY
EPS (FY 2024)
$-1.16
-383.3% YoY
Free Cash Flow (FY 2024)
$-
-100.0% YoY
Profitability
Gross Margin
26.1%
Net Margin
-5.9%
ROE
-21.1%
ROA
-2.5%
Valuation
P/E Ratio
-4.53
P/S Ratio
0.27
EV/EBITDA
6.02
Market Cap
$2.23B
Revenue & Net Income
Profit Margins
Cash Flow Summary
Operating Cash Flow
$-
-100.0% YoY
Free Cash Flow
$-
-100.0% YoY
Balance Sheet Summary
Total Assets
$103.91B
13.5% YoY
Total Debt
$57.75B
26.7% YoY
Shareholder Equity
$12.27B
-21.5% YoY
Dividend Overview
$0.08
Latest Dividend
%
Dividend Yield
%
Payout Ratio
Recent Dividend History
| Date | Amount | Type |
|---|---|---|
| 2024-11-29 | $0.08 | November 29, 24 |
| 2024-05-22 | $0.14 | May 22, 24 |
| 2023-11-22 | $0.15 | November 22, 23 |
| 2023-05-10 | $0.24 | May 10, 23 |
| 2023-01-05 | $0.10 | January 05, 23 |
| 2022-12-01 | $0.20 | December 01, 22 |
| 2022-05-11 | $0.14 | May 11, 22 |
| 2022-01-07 | $0.03 | January 07, 22 |
| 2021-08-06 | $0.22 | August 06, 21 |
| 2021-05-12 | $0.12 | May 12, 21 |
Companhia Siderúrgica Nacional Dividends
Explore Companhia Siderúrgica Nacional's dividend history, including dividend yield, payout ratio, and historical payments.
Dividend Yield
21.58%
Dividend Payout Ratio
-97.82%
Dividend Paid & Capex Coverage Ratio
1.08x
Companhia Siderúrgica Nacional Dividend History
| Dividend | Adjusted Dividend | Date | Record Date | Payment Date | Declaration Date |
|---|---|---|---|---|---|
| $0.081899 | $0.081899 | November 29, 2024 | November 29, 2024 | December 05, 2024 | November 19, 2024 |
| $0.13951 | $0.13951 | May 22, 2024 | May 23, 2024 | June 06, 2024 | May 13, 2024 |
| $0.15261 | $0.15261 | November 22, 2023 | November 24, 2023 | December 06, 2023 | November 14, 2023 |
| $0.244 | $0.244 | May 10, 2023 | May 11, 2023 | May 24, 2023 | May 01, 2023 |
| $0.1 | $0.090601 | January 05, 2023 | January 06, 2023 | May 24, 2023 | |
| $0.201 | $0.225 | December 01, 2022 | December 02, 2022 | December 09, 2022 | November 22, 2022 |
| $0.136 | $0.136 | May 11, 2022 | May 12, 2022 | May 31, 2022 | May 02, 2022 |
| $0.029 | $0.034 | January 07, 2022 | January 10, 2022 | June 07, 2022 | December 30, 2021 |
| $0.223 | $0.25 | August 06, 2021 | August 09, 2021 | August 17, 2021 | July 30, 2021 |
| $0.1228 | $0.121 | May 12, 2021 | May 13, 2021 | May 21, 2021 | May 03, 2021 |
| $0.002 | $0.001715 | May 04, 2020 | May 05, 2020 | January 11, 2021 | April 21, 2020 |
| $0.073 | $0.0728 | September 27, 2019 | September 30, 2019 | October 07, 2019 | September 19, 2019 |
| $0.165 | $0.165 | May 06, 2019 | May 07, 2019 | June 05, 2019 | May 29, 2018 |
| $0.1627 | $0.1627 | August 29, 2018 | August 30, 2018 | September 07, 2018 | August 21, 2018 |
| $0.065 | $0.0647 | March 19, 2015 | March 23, 2015 | March 30, 2015 | March 20, 2015 |
| $0.078 | $0.078 | January 08, 2015 | January 23, 2015 | ||
| $0.124 | $0.124 | March 11, 2014 | March 20, 2014 | March 11, 2014 | |
| $0.148 | $0.148 | November 21, 2013 | |||
| $0.09 | $0.09 | August 15, 2013 | August 26, 2013 | August 16, 2013 | |
| $0.19 | $0.19 | April 10, 2013 |
Companhia Siderúrgica Nacional News
Read the latest news about Companhia Siderúrgica Nacional, including recent articles, headlines, and updates.
Companhia Siderúrgica Nacional (SID) Q4 2024 Earnings Call Transcript
Companhia Siderúrgica Nacional (NYSE:SID ) Q4 2024 Earnings Conference Call March 13, 2025 10:30 AM ET Company Participants Marco Rabello - CFO and IRO Helena Guerra - ESG and Sustainability Director Benjamin Steinbruch - President, Executive Board, Chairman and CEO Edvaldo Rabelo - Director, Cement Business Luis Martinez - Executive Director, Commercial and Logistics Area & Member of Executive Board Conference Call Participants Caio Ribeiro - Bank of America Rafael Barcellos - Bradesco BBI Daniel Sasson - Itau BBA Yuri Pereira - Santander Bank Operator Good morning, ladies and gentlemen, and thank you for holding. We would like to welcome everyone to CSN's conference call to present results for the fourth quarter and full year 2024.

Should Value Investors Buy National Steel (SID) Stock?
Here at Zacks, our focus is on the proven Zacks Rank system, which emphasizes earnings estimates and estimate revisions to find great stocks. Nevertheless, we are always paying attention to the latest value, growth, and momentum trends to underscore strong picks.
Companhia Siderúrgica Nacional (SID) Q3 2024 Earnings Call Transcript
Companhia Siderúrgica Nacional (NYSE:SID ) Q3 2024 Earnings Conference Call November 13, 2024 9:30 AM ET Company Participants Marco Rabello - CFO and IRO Helena Guerra - ESG and Sustainability Director Benjamin Steinbruch - President, Executive Board, Chairman and CEO Luis Martinez - Executive Director, Commercial and Logistics Area & Member of Executive Board Edvaldo Rabelo - Director, Cement Business Conference Call Participants Barbara Soares - Itau BBA Ricardo Monegaglia - Safra Gabriel Simões - Goldman Sachs Pamela Bordes - Bradesco BBI Operator Good morning, ladies and gentlemen. At this time, we would like to welcome everyone to CSN Conference Call to present Results for the Third Quarter 2024.

Google Big Earnings Pop (Technical Analysis)
Alphabet (GOOGL) saw a 5.8% after-market pop post-earnings, challenging our SID Sell signal driven by technical and fundamental analysis. Positive signals before earnings included strong Demand on the 20-day chart and a Buy signal in the SAR column, indicating smart money activity. Despite the earnings bounce, our SID signal remains Sell due to a price drop testing the 200-day uptrend, requiring further good news for a Buy signal.

Arista Networks: Buy On Weakness Signal (Technical Analysis)
Arista Networks tops our SID system's buy-on-weakness list, signaling a potential retest of old high resistance because it has our SID Buy Signal. Strong fundamental and technical signals, including improving money flow and MACD, support our buy signals. Positive SA analyst ratings and technical indicators like CMF and Full Stochastic suggest rising demand and price movement towards previous highs.

Companhia Siderúrgica Nacional (SID) Q1 2024 Earnings Call Transcript
Companhia Siderúrgica Nacional (NYSE:SID ) Q1 2024 Earnings Conference Call May 10, 2024 10:30 AM ET Company Participants Antonio Marco Campos Rabello - CFO and IRO Helena Guerra - ESG and Sustainability Director Benjamin Steinbruch - President, Executive Board, Chairman and CEO Luis Martinez - Executive Director, Commercial and Logistics Area & Member of Executive Board Edvaldo Rabelo - Director, Cement Business Conference Call Participants Daniel Sasson - Itau BBA Rafael Barcellos - Banco Bradesco BBI Ricardo Monegaglia - Safra Marcio Farid - Goldman Sachs Operator Good morning, ladies and gentlemen. At this time, we would like to welcome everyone to CSN Conference Call to present Results for the First Quarter 2024.

Companhia Siderúrgica Nacional: A Positive Outlook Beyond Q3
Companhia Siderúrgica Nacional, facing challenges in a cyclical sector, demonstrated resilience amid weaker global economic growth, influencing iron ore and steel prices. Limited demand in the Brazilian and Chinese steel markets affected CSN's revenues, putting pressure on costs due to reduced expense distribution. A notable rebound in iron ore prices in H2 2023, driven by a positive turnaround in China's construction sector, signals a favorable outlook for CSN's performance.
Announcement of Expiration of Tender Offer for Any and All 2026 Notes by CSN Resources S.A.
SAO PAULO , Dec. 5, 2023 /PRNewswire/ -- Companhia Siderúrgica Nacional ("CSN") (NYSE: SID) announced today that the cash tender offer (the "Tender Offer") by its subsidiary, CSN Resources S.A. ("CSN Resources"), for any and all of its outstanding US$300,000,000 in aggregate principal amount of 7.625% Senior Unsecured Guaranteed Notes due 2026 (the "Notes") (144A CUSIP / ISIN: 12644VAC2 / US12644VAC28 and Regulation S CUSIP / ISIN: L21779AD2 / USL21779AD28), fully, unconditionally and irrevocably guaranteed by CSN, expired today at 5:00 p.m.

Announcement of Tender Offer for Any and All 2026 Notes by CSN Resources S.A.
SÃO PAULO, Nov. 29, 2023 /PRNewswire/ -- Companhia Siderúrgica Nacional ("CSN") (NYSE: SID) announced today that its subsidiary, CSN Resources S.A. ("CSN Resources"), has commenced a cash tender offer (the "Tender Offer") for any and all of its outstanding 7.625% Senior Unsecured Guaranteed Notes due 2026 (the "Notes").

Companhia Siderúrgica Nacional (SID) Q2 2023 Earnings Call Transcript
Companhia Siderúrgica Nacional (NYSE:SID ) Q2 2023 Results Conference Call August 3, 2023 10:30 AM ET Company Participants Marcelo Cunha Ribeiro - CFO and IR Executive Officer Helena Guerra - Sustainability Director Benjamin Steinbruch - Chairman and CEO Conference Call Participants Caio Greiner - BTG Pactual Daniel Sasson - Itau BBA Thiago Lofiego - Bradesco BBI Caio Ribeiro - Bank of America Carlos De Alba - Morgan Stanley Vanessa Quiroga - Credit Suisse Operator Good morning, ladies and gentlemen, and thank you for holding. At this time, we would like to welcome you to CSN's conference call to present results for the second quarter 2023.

Seoul Semiconductor Unveils 2nd-generation LED Technology for Future Displays at Display Week 2023
ANSAN, South Korea–(BUSINESS WIRE)–#DisplayWeek2023—Seoul Semiconductor Co., Ltd. (KOSDAQ:046890), a global optical semiconductor company, will participate in the Society for Information Display (SID)’s Display Week 2023, scheduled for May 23 to 25, to unveil its second-generation LED technologies for future displays, including WICOP-Pixel-based microLED displays and Low Blue Light (LBL) displays that help maintain the health […]...
E Ink Showcases Latest Color Products, E Ink Spectra™ 6 and E Ink Gallery™ 3 Outdoor, at SID Display Week 2023
BILLERICA, Mass.--(BUSINESS WIRE)--E Ink (8069.TWO), the originator, pioneer, and global commercial leader in ePaper technology, today announced its participation during SID Display Week 2023 at the Los Angeles Convention Center. As the premier event for the global electronic display and visual information technology industries, E Ink will be showcasing its latest color ePaper innovations products at booth 807, including: E Ink Spectra™ 6 provides a print quality replacement for paper signage, including POP displays, posters, and in-store advertising. Spectra™ 6 features an enhanced color spectrum and an advanced color imaging algorithm to provide full color to improve marketing and advertising performance. E Ink Kaleido™ 3 Outdoor, the print-color ePaper tailored for Digital Out-of-Home (DOOH) advertising signage, can function effectively in a wide range of temperatures. It presents dynamic color display features, produces poster-like visual quality, and provides a low-carbon and eco-friendly display option. E Ink Gallery™ 3 is based on the E Ink ACeP™ Advanced Color ePaper platform, and enables a full-color gamut through a four particle ink system: cyan, magenta, yellow and white. This combination allows a full color gamut at pixel-level and is designed for a more vivid consumer experience. E Ink Prism™ 3 bridges the gap between traditional static surfaces and digital technology with dynamically changing materials. Fully programmable, designers can now integrate endless materials with changeable colors and patterns. SID continues to be a catalyst for E Ink to showcase its industry-leading ePaper technologies and innovations, as well as new applications across emerging markets that rely on delivering information to end users. E Ink has been participating in SID Display Week since the Company’s founding twenty-five years ago and is presenting the following technical papers during 2023’s event: Tuesday, May 23 | 2 p.m. - 3 p.m. PT: Dirk Hertel will present, Combining Annulus and Variable Aperture Source Methods to Separate Specular, Haze and Lambertian Reflection Components of ePaper Displays Wednesday, May 24 | 04:10 p.m. - 4:30 p.m. PT: Ian French & Jonathan Margalit presents, Ultra Low Power Color ePaper Signage Displays for Outdoor Use Thursday, May 25 | 3:10 p.m. - 4:30 p.m PT: Hongmei Zhang presents, Highly Saturated Color Electrophoretic Display Thursday, May 25 | 3:50 p.m. - 4:10 p.m. PT: W.T. Chen presents, IGZO backplane for Full-color Electrophoretic Display “Our core technologies enable customers to open new doors in product innovation and embody sustainable innovation,” said Timothy O'Malley, AVP US RBU at E Ink Corporation. "We believe that sustainability is not only a responsibility but a commitment towards a better future, and we strive to innovate and implement eco-friendly practices, from sustainable product design to optimizing manufacturing processes.” E Ink is committed to sustainable manufacturing and innovation and is working with ecosystem partners to promote applications where E Ink's low power consumption and energy-saving ePaper is an ideal fit. The company is also committed to reducing its carbon footprint and has joined international initiatives related to carbon reduction, with the goal of achieving Net Zero Carbon Emissions by 2040 and RE100 by 2030. E Ink has also signed Power Purchase Agreements and purchased Renewable Energy Certificates to accelerate the implementation of renewable energy. In December 2022, E Ink announced 20% of its energy use was generated from renewable sources, and with individual sites in the United States, Japan and South Korea operating on 100% renewable energy sources. E Ink is also committed to providing the healthiest reading experience. In March, the Company announced the results of a peer-reviewed study about the effect of displays on human retinal cells, commissioned through the Cellular Profiling Service Core of T.H. Chan Harvard School of Public Health. Displays using E Ink ComfortGaze™ reduce hazardous blue light output without creating an amber-white tint in nightlight mode. Devices with E Ink ComfortGaze™ in warm-white mode can be used three times as long as an LCD in cold-white mode, and twice as long as that same LCD in warm-white mode, before reaching the same level of ROS stress in retinal cells (as LCDs). ePaper displays without front lights show advantages even when compared to print paper. Bright white paper contains fluorescent brighteners, which are not contained in E Ink displays. These brighteners produce not only the clean blueish brilliant white of print paper, but also increase blue light reflection. In other words, E Ink displays can be considered safer for your eyes than print paper. About E Ink Holdings E Ink Holdings Inc. (8069.TWO), based on technology from MIT’s Media Lab, provides an ideal display medium for applications spanning eReaders and eNotes, retail, home, hospital, transportation, logistics, and more, enabling customers to put displays in locations previously impossible. E Ink’s electrophoretic display products make it the worldwide leader for ePaper. Its low power displays enable customers to reach their sustainability goals, and E Ink has pledged using 100% renewable energy in 2030 and reaching net zero carbon emissions by 2040. E Ink is a member of the Climate Pledge, has joined the Science Based Targets Initiative (SBTi), and has been listed as one of the Asia-Pacific Climate Leaders by the Financial Times, Nikkei and Statista in 2022. Listed in Taiwan's Taipei Exchange (TPEx) and the Luxembourg market, E Ink Holdings is now the world's largest supplier of ePaper displays. For more information please visit www.eink.com. E Ink. We Make Surfaces Smart and Green.
Here Is Why Bargain Hunters Would Love Fast-paced Mover Siderurgica Nacional (SID)
If you are looking for stocks that have gained strong momentum recently but are still trading at reasonable prices, Siderurgica Nacional (SID) could be a great choice. It is one of the several stocks that passed through our 'Fast-Paced Momentum at a Bargain' screen.

Companhia Siderúrgica Nacional (SID) Q3 2022 Results - Earnings Call Transcript
Companhia Siderúrgica Nacional (NYSE:SID ) Q3 2022 Earnings Conference Call November 1, 2022 10:30 AM ET Company Participants Marcelo Cunha Ribeiro - CFO and IR Executive Officer Helena Guerra - Sustainability Director Benjamin Steinbruch - Chairman and CEO Conference Call Participants Daniel Sasson - Itau BBA Rafael Barcellos - Santander Bank Carlos de Alba - Morgan Stanley Caio Ribeiro - Bank of America Isabella Vasconcelos - Bradesco BBI Leonardo Correa - BTG Pactual Operator Good morning ladies and gentlemen. At this time, we would like to welcome everyone to CSN's Conference Call to present Results for the Third Quarter 2022.

Companhia Siderúrgica Nacional (SID) Management on Q2 2022 Results - Earnings Call Transcript
Companhia Siderúrgica Nacional (NYSE:SID ) Q2 2022 Results Conference Call August 16, 2022 10:30 AM ET Company Participants Marcelo Cunha Ribeiro - CFO and IR Executive Officer Benjamin Steinbruch - Chairman Helena Guerra - Sustainability Director Conference Call Participants Isabella Vasconcelos - Bradesco BBI Daniel Sasson - Itau BBA Carlos De Alba - Morgan Stanley Operator Good morning, ladies and gentlemen, and thank you for holding. At this time, we would like to welcome everyone to CSN's conference call to present results for the second quarter '22.

Similar Companies
Related Metrics
Explore detailed financial metrics and analysis for SID.
