Spirit AeroSystems Holdings Key Executives
This section highlights Spirit AeroSystems Holdings's key executives, including their titles and compensation details.
Find Contacts at Spirit AeroSystems Holdings
(Showing 0 of )
Spirit AeroSystems Holdings Earnings
This section highlights Spirit AeroSystems Holdings's earnings, including key dates, EPS, earnings reports, and earnings call transcripts.
Next Earnings Date
Last Earnings Results
Earnings Call Transcripts
| Transcript | Quarter | Year | Date | Estimated EPS | Actual EPS |
|---|---|---|---|---|---|
| Read Transcript | Q1 | 2024 | 2024-05-07 | $-0.44 | $-3.93 |
| Read Transcript | Q4 | 2023 | 2024-02-06 | $0.87 | $0.48 |
| Read Transcript | Q3 | 2023 | 2023-11-01 | $-1.56 | $-1.42 |
| Read Transcript | Q2 | 2023 | 2023-08-02 | $-0.79 | $-1.46 |
| Read Transcript | Q1 | 2023 | 2023-05-03 | $-0.31 | $-1.69 |

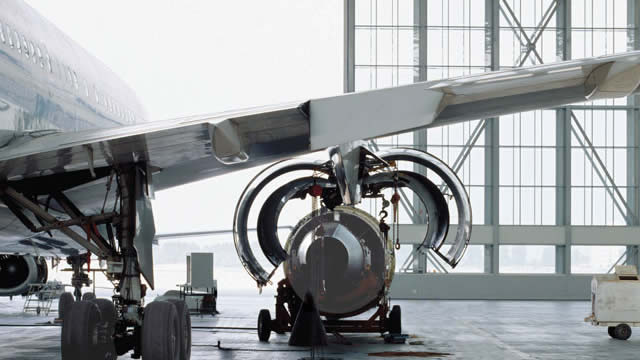
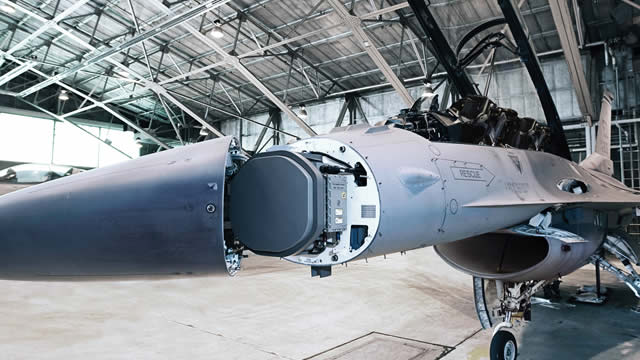
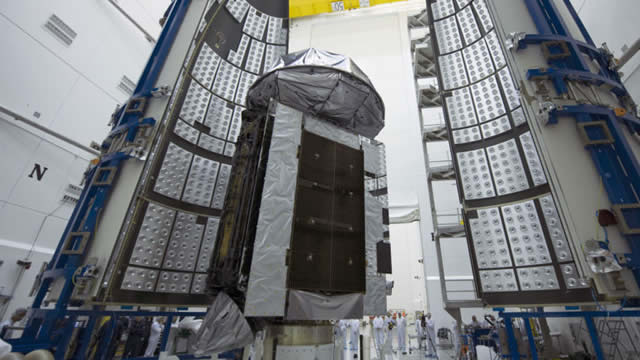
Spirit AeroSystems Holdings, Inc. designs, engineers, manufactures, and markets commercial aerostructures worldwide. It operates through three segments: Commercial, Defense & Space, and Aftermarket. The Commercial segment offers forward, mid, and rear fuselage sections and systems, struts/pylons, nacelles, and related engine structural components; and wings and wing components, including flight control surfaces, as well as other structural parts. This segment primarily serves the aircraft original equipment manufacturers (OEMs) or engine OEMs of large commercial aircraft and/or business/regional jet programs. The Defense & Space segment provides fuselage, strut, nacelle, and wing aerostructures primarily for U.S. Government defense programs, including Boeing P-8, C40, and KC-46 Tanker. This segment also engages in the fabrication, bonding, assembly, testing, tooling, processing, engineering analysis, and training on fixed wing aircraft aerostructures, missiles, and hypersonics works, such as solid rocket motor throats, nozzles, re-entry vehicle thermal protections systems, forward cockpit and cabin, and fuselage work on rotorcraft aerostructures. The Aftermarket segment offers spare parts and MRO services, repairs for flight control surfaces and nacelles, radome repairs, rotable assets, engineering services, advanced composite repairs, and other repair and overhaul services. Spirit AeroSystems Holdings, Inc. has a strategic partnership with Sierra Space to enhance access to commercial space economy of the future. The company was formerly known as Mid-Western Aircraft Systems Holdings, Inc. Spirit AeroSystems Holdings, Inc. was founded in 1927 and is headquartered in Wichita, Kansas.
$29.90
Stock Price
$3.51B
Market Cap
20.37K
Employees
Wichita, KS
Location
Financial Statements
Access annual & quarterly financial statements for Spirit AeroSystems Holdings, including income statements, balance sheets, and cash flow statements..
Annual Income Statement
| Breakdown | December 31, 2024 | December 31, 2023 | December 31, 2022 | December 31, 2021 | December 31, 2020 |
|---|---|---|---|---|---|
| Revenue | $6.32B | $6.05B | $5.03B | $3.95B | $3.40B |
| Cost of Revenue | $7.69B | $5.84B | $4.98B | $4.07B | $3.85B |
| Gross Profit | $-1.37B | $206.20M | $48.60M | $-117.80M | $-440.70M |
| Gross Profit Ratio | -21.73% | 3.41% | 0.97% | -2.98% | -12.94% |
| Research and Development Expenses | $47.50M | $45.40M | $50.40M | $53.30M | $38.80M |
| General and Administrative Expenses | $- | $- | $- | $- | $- |
| Selling and Marketing Expenses | $- | $- | $- | $- | $- |
| Selling General and Administrative Expenses | $365.50M | $281.90M | $279.20M | $279.90M | $237.40M |
| Other Expenses | $700.00K | $13.10M | $-14.10M | $146.60M | $-77.80M |
| Operating Expenses | $413.70M | $333.20M | $329.60M | $333.20M | $276.20M |
| Cost and Expenses | $8.10B | $6.17B | $5.31B | $4.40B | $4.12B |
| Interest Income | $9.50M | $12.90M | $6.20M | $1.80M | $10.00M |
| Interest Expense | $353.50M | $318.70M | $244.10M | $242.60M | $195.30M |
| Depreciation and Amortization | $2.00M | $315.60M | $337.10M | $327.60M | $277.60M |
| EBITDA | $-1.79B | $41.00M | $41.80M | $15.00M | $-613.00M |
| EBITDA Ratio | -28.28% | 0.68% | 0.83% | 0.38% | -18.00% |
| Operating Income | $-1.79B | $-134.20M | $-295.10M | $-304.40M | $-812.80M |
| Operating Income Ratio | -28.28% | -2.22% | -5.87% | -7.70% | -23.87% |
| Total Other Income Expenses Net | $-355.50M | $-459.10M | $-258.20M | $-96.00M | $-273.10M |
| Income Before Tax | $-2.14B | $-593.30M | $-539.40M | $-555.20M | $-1.09B |
| Income Before Tax Ratio | -33.90% | -9.81% | -10.72% | -14.05% | -31.89% |
| Income Tax Expense | $-2.40M | $22.50M | $5.20M | $-17.20M | $-220.20M |
| Net Income | $-2.14B | $-616.20M | $-544.60M | $-538.00M | $-865.70M |
| Net Income Ratio | -33.88% | -10.19% | -10.83% | -13.61% | -25.43% |
| EPS | $-18.26 | $-5.78 | $-5.21 | $-5.16 | $-8.33 |
| EPS Diluted | $-18.26 | $-5.78 | $-5.21 | $-5.16 | $-8.33 |
| Weighted Average Shares Outstanding | 117.20M | 106.60M | 104.60M | 104.20M | 103.90M |
| Weighted Average Shares Outstanding Diluted | 117.20M | 106.60M | 104.60M | 104.20M | 103.90M |
| SEC Filing | Source | Source | Source | Source | Source |
| Breakdown | December 31, 2024 | September 26, 2024 | June 27, 2024 | March 28, 2024 | December 31, 2023 | September 28, 2023 | June 29, 2023 | March 30, 2023 | December 31, 2022 | September 29, 2022 | June 30, 2022 | March 31, 2022 | December 31, 2021 | September 30, 2021 | July 01, 2021 | April 01, 2021 | December 31, 2020 | October 01, 2020 | July 02, 2020 | April 02, 2020 |
|---|---|---|---|---|---|---|---|---|---|---|---|---|---|---|---|---|---|---|---|---|
| Revenue | $3.35B | $1.47B | $1.49B | $1.70B | $1.81B | $1.44B | $1.36B | $1.43B | $1.32B | $1.28B | $1.26B | $1.17B | $1.07B | $980.00M | $1.00B | $900.80M | $876.60M | $806.30M | $644.60M | $1.08B |
| Cost of Revenue | $4.25B | $1.72B | $1.73B | $2.14B | $1.54B | $1.49B | $1.40B | $1.43B | $1.37B | $1.19B | $1.28B | $1.14B | $1.06B | $1.04B | $1.01B | $958.80M | $904.50M | $903.40M | $925.10M | $1.11B |
| Gross Profit | $-892.90M | $-246.00M | $-233.50M | $-435.50M | $274.60M | $-53.60M | $-30.80M | $-800.00K | $-49.50M | $82.90M | $-19.60M | $34.80M | $8.70M | $-56.20M | $-12.30M | $-58.00M | $-27.90M | $-97.10M | $-280.50M | $-35.20M |
| Gross Profit Ratio | -26.62% | -16.73% | -15.65% | -25.58% | 15.15% | -3.73% | -2.26% | -0.06% | -3.75% | 6.49% | -1.56% | 2.96% | 0.81% | -5.73% | -1.23% | -6.44% | -3.18% | -12.04% | -43.52% | -3.27% |
| Research and Development Expenses | $23.70M | $10.40M | $13.40M | $10.60M | $11.50M | $10.10M | $13.20M | $10.60M | $13.90M | $9.30M | $14.90M | $12.30M | $19.00M | $12.80M | $13.30M | $8.20M | $10.70M | $7.50M | $8.30M | $12.30M |
| General and Administrative Expenses | $- | $- | $- | $- | $- | $- | $- | $- | $- | $- | $- | $- | $- | $- | $- | $- | $58.20M | $- | $49.00M | $76.90M |
| Selling and Marketing Expenses | $- | $- | $- | $- | $- | $- | $- | $- | $- | $- | $- | $- | $- | $- | $- | $- | $-500.00K | $- | $- | $500.00K |
| Selling General and Administrative Expenses | $188.10M | $93.80M | $83.60M | $81.50M | $64.60M | $69.20M | $70.60M | $77.40M | $75.40M | $69.10M | $70.20M | $64.50M | $68.60M | $86.80M | $66.90M | $57.60M | $58.20M | $52.80M | $49.00M | $77.40M |
| Other Expenses | $- | $-100.00K | $-1.40M | $-6.30M | $200.00K | $800.00K | $-9.90M | $6.30M | $-44.30M | $-43.00M | $37.90M | $24.00M | $7.90M | $85.30M | $31.10M | $25.80M | $-12.40M | $-10.00M | $-5.40M | $-58.30M |
| Operating Expenses | $212.50M | $104.20M | $97.00M | $92.10M | $76.10M | $80.10M | $88.70M | $94.30M | $89.30M | $78.40M | $91.90M | $76.80M | $87.60M | $99.60M | $80.20M | $68.10M | $68.90M | $60.30M | $57.30M | $89.70M |
| Cost and Expenses | $4.46B | $1.82B | $1.82B | $2.23B | $1.61B | $1.57B | $1.48B | $1.53B | $1.46B | $1.27B | $1.37B | $1.22B | $1.15B | $1.14B | $1.09B | $1.03B | $973.40M | $963.70M | $982.40M | $1.20B |
| Interest Income | $1.70M | $1.20M | $2.30M | $4.30M | $4.90M | $2.40M | $2.70M | $2.90M | $6.20M | $2.30M | $800.00K | $500.00K | $1.80M | $- | $- | $600.00K | $1.00M | $900.00K | $1.20M | $6.90M |
| Interest Expense | $100.20M | $90.80M | $82.30M | $80.20M | $97.60M | $75.10M | $73.60M | $72.40M | $73.30M | $56.80M | $55.10M | $58.90M | $64.90M | $58.80M | $59.10M | $59.80M | $61.50M | $53.00M | $48.60M | $32.20M |
| Depreciation and Amortization | $72.50M | $77.30M | $77.70M | $77.90M | $78.70M | $79.20M | $77.80M | $79.90M | $83.90M | $84.20M | $83.80M | $85.20M | $85.70M | $81.60M | $80.00M | $80.30M | $75.10M | $67.10M | $68.10M | $67.30M |
| EBITDA | $-476.30M | $-305.80M | $-253.20M | $-447.40M | $256.60M | $-47.20M | $-52.50M | $-132.60M | $-99.20M | $46.60M | $13.70M | $80.70M | $15.00M | $19.80M | $13.40M | $-32.40M | $-38.70M | $-119.80M | $-304.80M | $-149.20M |
| EBITDA Ratio | -14.20% | -20.79% | -16.97% | -26.27% | 14.15% | -3.28% | -3.85% | -9.26% | -7.51% | 3.65% | 1.09% | 6.87% | 1.40% | 2.02% | 1.34% | -3.60% | -4.41% | -14.86% | -47.29% | -13.85% |
| Operating Income | $-1.11B | $-350.10M | $-330.50M | $-527.60M | $198.50M | $-133.70M | $-120.40M | $-95.10M | $-138.80M | $4.50M | $-104.70M | $-17.50M | $-79.00M | $-156.60M | $-97.70M | $-125.90M | $-101.40M | $-176.90M | $-367.00M | $-167.50M |
| Operating Income Ratio | -32.96% | -23.81% | -22.15% | -30.98% | 10.95% | -9.29% | -8.82% | -6.64% | -10.51% | 0.35% | -8.32% | -1.49% | -7.38% | -15.98% | -9.75% | -13.98% | -11.57% | -21.94% | -56.93% | -15.55% |
| Total Other Income Expenses Net | $-149.00M | $-123.80M | $-82.70M | $-77.90M | $-118.00M | $-67.80M | $-83.50M | $-189.80M | $-103.50M | $-98.90M | $-20.50M | $-45.90M | $-57.00M | $36.00M | $-28.00M | $-47.00M | $-73.90M | $-63.00M | $-55.00M | $-81.20M |
| Income Before Tax | $-1.25B | $-473.90M | $-413.20M | $-605.50M | $80.30M | $-201.50M | $-203.90M | $-284.90M | $-256.40M | $-94.40M | $-125.20M | $-63.40M | $-136.00M | $-120.60M | $-125.70M | $-172.90M | $-175.30M | $-239.90M | $-422.00M | $-248.70M |
| Income Before Tax Ratio | -37.40% | -32.22% | -27.70% | -35.56% | 4.43% | -14.00% | -14.94% | -19.90% | -19.42% | -7.39% | -9.95% | -5.40% | -12.71% | -12.31% | -12.54% | -19.19% | -20.00% | -29.75% | -65.47% | -23.09% |
| Income Tax Expense | $-18.30M | $2.80M | $2.10M | $11.00M | $21.40M | $-2.40M | $3.00M | $-4.30M | $-13.20M | $32.90M | $-3.50M | $-11.00M | $-16.60M | $-7.90M | $9.00M | $-1.70M | $119.80M | $-85.20M | $-167.60M | $-87.20M |
| Net Income | $-630.90M | $-476.90M | $-415.30M | $-616.70M | $58.70M | $-204.10M | $-206.30M | $-281.20M | $-243.20M | $-127.60M | $-122.20M | $-52.40M | $-120.30M | $-113.60M | $-135.30M | $-171.60M | $-295.90M | $-155.50M | $-255.90M | $-163.00M |
| Net Income Ratio | -18.81% | -32.43% | -27.84% | -36.22% | 3.24% | -14.18% | -15.12% | -19.65% | -18.42% | -9.99% | -9.71% | -4.46% | -11.24% | -11.59% | -13.50% | -19.05% | -33.76% | -19.29% | -39.70% | -15.13% |
| EPS | $-5.38 | $-4.07 | $-3.56 | $-5.31 | $0.53 | $-1.94 | $-1.96 | $-2.68 | $-2.32 | $-1.22 | $-1.17 | $-0.51 | $-1.15 | $-1.09 | $-1.30 | $-1.65 | $-2.85 | $-1.50 | $-2.46 | $-1.57 |
| EPS Diluted | $-5.38 | $-4.07 | $-3.56 | $-5.31 | $0.51 | $-1.94 | $-1.96 | $-2.68 | $-2.32 | $-1.22 | $-1.17 | $-0.50 | $-1.15 | $-1.09 | $-1.30 | $-1.65 | $-2.85 | $-1.50 | $-2.46 | $-1.57 |
| Weighted Average Shares Outstanding | 117.23M | 117.20M | 116.60M | 116.20M | 111.00M | 105.20M | 105.20M | 104.90M | 104.80M | 104.70M | 104.60M | 103.53M | 104.20M | 104.22M | 104.08M | 104.00M | 103.73M | 103.67M | 103.90M | 103.64M |
| Weighted Average Shares Outstanding Diluted | 117.30M | 117.20M | 116.60M | 116.20M | 116.20M | 105.20M | 105.20M | 104.90M | 104.80M | 104.70M | 104.60M | 104.40M | 104.30M | 104.30M | 104.20M | 104.10M | 104.00M | 103.90M | 103.90M | 103.70M |
| SEC Filing | Source | Source | Source | Source | Source | Source | Source | Source | Source | Source | Source | Source | Source | Source | Source | Source | Source | Source | Source | Source |
Annual Balance Sheet
| Breakdown | December 31, 2024 | December 31, 2023 | December 31, 2022 | December 31, 2021 | December 31, 2020 |
|---|---|---|---|---|---|
| Cash and Cash Equivalents | $537.00M | $823.50M | $658.60M | $1.48B | $1.87B |
| Short Term Investments | $- | $- | $- | $- | $- |
| Cash and Short Term Investments | $537.00M | $823.50M | $658.60M | $1.48B | $1.87B |
| Net Receivables | $1.18B | $1.11B | $994.40M | $918.80M | $1.17B |
| Inventory | $1.89B | $1.77B | $1.47B | $1.38B | $1.42B |
| Other Current Assets | $152.00M | $47.30M | $34.60M | $26.00M | $21.30M |
| Total Current Assets | $3.76B | $3.75B | $3.16B | $3.81B | $4.49B |
| Property Plant Equipment Net | $2.03B | $2.18B | $2.30B | $2.47B | $2.57B |
| Goodwill | $630.00M | $631.20M | $630.50M | $623.70M | $565.30M |
| Intangible Assets | $149.50M | $196.20M | $211.40M | $212.30M | $215.20M |
| Goodwill and Intangible Assets | $779.50M | $827.40M | $841.90M | $836.00M | $780.50M |
| Long Term Investments | $900.00K | $800.00K | $1.10M | $800.00K | $3.10M |
| Tax Assets | $100.00K | $100.00K | $4.80M | $400.00K | $100.00K |
| Other Non-Current Assets | $194.90M | $193.70M | $359.90M | $623.30M | $540.80M |
| Total Non-Current Assets | $3.00B | $3.20B | $3.51B | $3.93B | $3.90B |
| Other Assets | $- | $- | $- | $- | $- |
| Total Assets | $6.76B | $6.95B | $6.67B | $7.74B | $8.38B |
| Account Payables | $1.01B | $1.11B | $919.80M | $720.30M | $558.90M |
| Short Term Debt | $434.50M | $73.90M | $112.50M | $108.10M | $387.00M |
| Tax Payables | $34.40M | $36.00M | $32.00M | $49.40M | $47.20M |
| Deferred Revenue | $75.40M | $49.60M | $132.80M | $170.60M | $119.80M |
| Other Current Liabilities | $2.02B | $932.00M | $866.50M | $925.50M | $694.10M |
| Total Current Liabilities | $3.57B | $2.20B | $1.95B | $1.88B | $1.71B |
| Long Term Debt | $4.04B | $4.10B | $3.90B | $4.02B | $3.79B |
| Deferred Revenue Non-Current | $- | $443.80M | $320.00M | $347.60M | $439.00M |
| Deferred Tax Liabilities Non-Current | $7.80M | $9.10M | $1.30M | $21.80M | $13.00M |
| Other Non-Current Liabilities | $1.76B | $691.80M | $1.01B | $1.34B | $1.61B |
| Total Non-Current Liabilities | $5.81B | $5.25B | $4.96B | $5.41B | $5.82B |
| Other Liabilities | $- | $- | $- | $- | $- |
| Total Liabilities | $9.38B | $7.45B | $6.91B | $7.29B | $7.53B |
| Preferred Stock | $- | $- | $- | $- | $- |
| Common Stock | $1.20M | $1.20M | $1.10M | $1.10M | $1.10M |
| Retained Earnings | $-1.52B | $616.30M | $1.23B | $1.78B | $2.33B |
| Accumulated Other Comprehensive Income Loss | $-100.10M | $-89.60M | $-203.90M | $-23.70M | $-154.10M |
| Other Total Stockholders Equity | $-999.10M | $-1.03B | $-1.28B | $-1.31B | $-1.32B |
| Total Stockholders Equity | $-2.62B | $-499.70M | $-247.50M | $448.30M | $856.50M |
| Total Equity | $-2.62B | $-495.90M | $-243.80M | $448.80M | $857.00M |
| Total Liabilities and Stockholders Equity | $6.76B | $6.95B | $6.67B | $7.74B | $8.38B |
| Minority Interest | $5.50M | $3.80M | $3.70M | $500.00K | $500.00K |
| Total Liabilities and Total Equity | $6.76B | $6.95B | $6.67B | $7.74B | $8.38B |
| Total Investments | $900.00K | $800.00K | $1.10M | $800.00K | $3.10M |
| Total Debt | $4.47B | $4.18B | $3.96B | $3.88B | $3.95B |
| Net Debt | $3.94B | $3.35B | $3.30B | $2.40B | $2.07B |
Balance Sheet Charts
| Breakdown | December 31, 2024 | September 26, 2024 | June 27, 2024 | March 28, 2024 | December 31, 2023 | September 28, 2023 | June 29, 2023 | March 30, 2023 | December 31, 2022 | September 29, 2022 | June 30, 2022 | March 31, 2022 | December 31, 2021 | September 30, 2021 | July 01, 2021 | April 01, 2021 | December 31, 2020 | October 01, 2020 | July 02, 2020 | April 02, 2020 |
|---|---|---|---|---|---|---|---|---|---|---|---|---|---|---|---|---|---|---|---|---|
| Cash and Cash Equivalents | $537.00M | $217.60M | $206.00M | $352.00M | $823.60M | $374.10M | $525.70M | $567.80M | $658.60M | $670.50M | $770.20M | $1.15B | $1.48B | $1.43B | $1.27B | $1.36B | $1.87B | $1.44B | $1.95B | $1.83B |
| Short Term Investments | $- | $- | $- | $- | $- | $- | $- | $- | $- | $- | $- | $- | $- | $- | $- | $- | $- | $- | $- | $- |
| Cash and Short Term Investments | $537.00M | $217.60M | $206.00M | $352.00M | $823.60M | $374.10M | $525.70M | $567.80M | $658.60M | $670.50M | $770.20M | $1.15B | $1.48B | $1.43B | $1.27B | $1.36B | $1.87B | $1.44B | $1.95B | $1.83B |
| Net Receivables | $1.18B | $1.63B | $1.57B | $1.40B | $1.11B | $1.21B | $1.08B | $1.12B | $994.40M | $1.07B | $1.06B | $1.03B | $918.80M | $1.03B | $1.18B | $1.20B | $1.17B | $392.90M | $627.60M | $889.50M |
| Inventory | $1.89B | $2.02B | $1.89B | $1.80B | $1.77B | $1.69B | $1.64B | $1.55B | $1.47B | $1.39B | $1.35B | $1.39B | $1.38B | $1.33B | $1.31B | $1.40B | $1.42B | $1.18B | $1.23B | $1.17B |
| Other Current Assets | $152.00M | $63.40M | $57.70M | $54.40M | $47.30M | $48.10M | $49.00M | $53.00M | $34.60M | $33.60M | $30.60M | $39.20M | $26.00M | $33.40M | $34.70M | $32.40M | $21.30M | $590.40M | $99.60M | $134.30M |
| Total Current Assets | $3.76B | $3.93B | $3.73B | $3.61B | $3.75B | $3.32B | $3.29B | $3.29B | $3.16B | $3.17B | $3.21B | $3.61B | $3.81B | $3.82B | $3.79B | $3.99B | $4.49B | $3.61B | $3.90B | $4.03B |
| Property Plant Equipment Net | $2.03B | $2.07B | $2.10B | $2.13B | $2.18B | $2.18B | $2.22B | $2.25B | $2.30B | $2.30B | $2.34B | $2.41B | $2.47B | $2.49B | $2.53B | $2.53B | $2.57B | $2.19B | $2.23B | $2.30B |
| Goodwill | $630.00M | $631.30M | $631.20M | $631.20M | $631.20M | $631.10M | $631.20M | $631.10M | $630.50M | $623.20M | $623.40M | $623.60M | $623.70M | $623.60M | $619.00M | $583.90M | $565.30M | $78.40M | $78.30M | $78.50M |
| Intangible Assets | $149.50M | $184.80M | $188.60M | $192.40M | $196.20M | $200.00M | $203.80M | $207.70M | $211.40M | $201.40M | $205.00M | $208.60M | $212.30M | $216.20M | $214.90M | $207.00M | $215.20M | $29.50M | $30.10M | $30.60M |
| Goodwill and Intangible Assets | $779.50M | $816.10M | $819.80M | $823.60M | $827.40M | $831.10M | $835.00M | $838.80M | $841.90M | $824.60M | $828.40M | $832.20M | $836.00M | $839.80M | $833.90M | $790.90M | $780.50M | $107.90M | $108.40M | $109.10M |
| Long Term Investments | $900.00K | $1.00M | $44.90M | $700.00K | $23.10M | $49.20M | $43.90M | $400.00K | $1.10M | $5.20M | $2.10M | $400.00K | $800.00K | $1.70M | $2.60M | $2.70M | $3.10M | $3.90M | $4.70M | $6.20M |
| Tax Assets | $100.00K | $100.00K | $100.00K | $100.00K | $100.00K | $100.00K | $300.00K | $4.30M | $4.80M | $1.10M | $3.50M | $7.90M | $400.00K | $487.50M | $1.20M | $300.00K | $100.00K | $136.70M | $162.20M | $192.60M |
| Other Non-Current Assets | $194.90M | $225.10M | $171.40M | $200.90M | $171.40M | $158.90M | $159.40M | $190.10M | $359.90M | $410.20M | $600.50M | $628.60M | $623.30M | $101.40M | $581.20M | $559.30M | $540.80M | $556.20M | $641.20M | $366.40M |
| Total Non-Current Assets | $3.00B | $3.12B | $3.13B | $3.16B | $3.20B | $3.22B | $3.25B | $3.29B | $3.51B | $3.54B | $3.78B | $3.88B | $3.93B | $3.92B | $3.95B | $3.88B | $3.90B | $3.00B | $3.14B | $2.98B |
| Other Assets | $- | $- | $- | $- | $- | $- | $- | $- | $- | $- | $- | $- | $- | $- | $- | $-0 | $- | $- | $- | $- |
| Total Assets | $6.76B | $7.05B | $6.86B | $6.76B | $6.95B | $6.54B | $6.55B | $6.57B | $6.67B | $6.71B | $6.99B | $7.49B | $7.74B | $7.74B | $7.74B | $7.87B | $8.38B | $6.60B | $7.04B | $7.00B |
| Account Payables | $1.01B | $1.09B | $1.11B | $1.14B | $1.11B | $1.03B | $974.40M | $948.20M | $919.80M | $848.00M | $810.70M | $762.90M | $720.30M | $644.80M | $607.10M | $540.80M | $558.90M | $483.10M | $512.00M | $740.70M |
| Short Term Debt | $434.50M | $878.00M | $140.60M | $146.40M | $131.30M | $128.90M | $119.40M | $63.30M | $112.50M | $412.40M | $405.00M | $107.60M | $108.10M | $107.00M | $106.00M | $45.70M | $387.00M | $380.70M | $392.90M | $92.70M |
| Tax Payables | $34.40M | $- | $- | $- | $36.00M | $- | $- | $- | $32.00M | $- | $- | $- | $49.40M | $- | $- | $- | $47.20M | $- | $- | $- |
| Deferred Revenue | $75.40M | $430.50M | $325.70M | $209.30M | $280.50M | $205.60M | $179.70M | $133.70M | $132.80M | $114.10M | $106.30M | $97.80M | $170.60M | $321.80M | $105.20M | $134.30M | $119.80M | $116.60M | $134.80M | $184.80M |
| Other Current Liabilities | $2.02B | $1.03B | $1.54B | $1.03B | $874.60M | $1.14B | $1.04B | $950.30M | $866.50M | $957.00M | $942.10M | $932.80M | $925.50M | $776.90M | $800.20M | $714.10M | $694.10M | $616.80M | $522.80M | $582.80M |
| Total Current Liabilities | $3.57B | $3.43B | $2.85B | $2.37B | $2.20B | $2.35B | $2.19B | $2.10B | $1.95B | $2.24B | $2.18B | $1.82B | $1.88B | $1.85B | $1.53B | $1.49B | $1.71B | $1.50B | $1.44B | $1.43B |
| Long Term Debt | $4.04B | $4.26B | $4.06B | $4.24B | $4.10B | $4.07B | $4.08B | $3.90B | $3.90B | $3.69B | $3.68B | $3.81B | $4.02B | $3.84B | $3.85B | $3.59B | $3.79B | $2.87B | $3.09B | $3.18B |
| Deferred Revenue Non-Current | $- | $267.00M | $494.40M | $246.90M | $719.90M | $308.20M | $289.20M | $303.00M | $320.00M | $312.70M | $329.80M | $340.60M | $347.60M | $562.90M | $363.80M | $414.40M | $439.00M | $432.70M | $454.20M | $453.10M |
| Deferred Tax Liabilities Non-Current | $7.80M | $- | $18.70M | $16.50M | $9.10M | $8.20M | $3.80M | $1.60M | $1.30M | $2.60M | $9.50M | $1.20M | $21.80M | $26.00M | $26.90M | $10.90M | $13.00M | $10.00M | $7.60M | $8.20M |
| Other Non-Current Liabilities | $1.76B | $1.02B | $1.38B | $1.18B | $1.06B | $881.80M | $858.70M | $719.20M | $1.01B | $812.50M | $871.10M | $1.44B | $1.34B | $1.06B | $1.74B | $1.67B | $1.61B | $1.03B | $1.20B | $474.30M |
| Total Non-Current Liabilities | $5.81B | $5.55B | $5.49B | $5.51B | $5.22B | $5.04B | $4.99B | $4.92B | $4.96B | $4.52B | $4.58B | $5.28B | $5.41B | $5.47B | $5.65B | $5.69B | $5.82B | $3.94B | $4.33B | $4.11B |
| Other Liabilities | $- | $- | $- | $- | $- | $- | $- | $- | $- | $- | $- | $- | $- | $- | $- | $- | $- | $- | $- | $- |
| Total Liabilities | $9.38B | $8.99B | $8.35B | $7.88B | $7.42B | $7.39B | $7.17B | $7.02B | $6.91B | $6.76B | $6.76B | $7.11B | $7.29B | $7.32B | $7.18B | $7.17B | $7.53B | $5.43B | $5.77B | $5.54B |
| Preferred Stock | $- | $- | $- | $- | $- | $- | $- | $- | $- | $- | $- | $- | $- | $- | $- | $- | $100.00K | $600.00K | $- | $- |
| Common Stock | $1.20M | $1.20M | $1.20M | $1.20M | $1.20M | $1.10M | $1.10M | $1.10M | $1.10M | $1.10M | $1.10M | $1.10M | $1.10M | $1.10M | $1.10M | $1.10M | $1.10M | $1.10M | $1.10M | $1.10M |
| Retained Earnings | $-1.52B | $-892.60M | $-415.70M | $-400.00K | $616.30M | $540.90M | $745.00M | $951.30M | $1.23B | $1.48B | $1.60B | $1.73B | $1.78B | $1.90B | $2.02B | $2.15B | $2.33B | $2.62B | $2.78B | $3.04B |
| Accumulated Other Comprehensive Income Loss | $-100.10M | $-51.10M | $-94.90M | $-97.20M | $-89.60M | $-150.00M | $-117.90M | $-127.60M | $-203.90M | $-236.00M | $-83.00M | $-41.30M | $-23.70M | $-163.30M | $-152.10M | $-150.00M | $-154.10M | $-129.60M | $-181.30M | $-250.90M |
| Other Total Stockholders Equity | $-999.10M | $-998.40M | $-1.01B | $-1.02B | $-1.03B | $-1.25B | $-1.26B | $-1.27B | $-1.28B | $-1.29B | $-1.30B | $-1.31B | $-1.31B | $-1.32B | $-1.31B | $-1.31B | $-1.32B | $-1.32B | $-1.33B | $-1.33B |
| Total Stockholders Equity | $-2.62B | $-1.94B | $-1.52B | $-1.12B | $-499.70M | $-859.40M | $-632.40M | $-448.20M | $-247.50M | $-46.10M | $225.40M | $381.70M | $448.30M | $424.30M | $559.80M | $692.50M | $856.50M | $1.17B | $1.27B | $1.46B |
| Total Equity | $-2.62B | $-1.94B | $-1.51B | $-1.11B | $-495.90M | $-855.70M | $-628.90M | $-444.60M | $-243.80M | $-45.60M | $225.90M | $382.20M | $448.80M | $424.80M | $560.30M | $693.00M | $857.00M | $1.17B | $1.27B | $1.46B |
| Total Liabilities and Stockholders Equity | $6.76B | $7.05B | $6.86B | $6.76B | $6.95B | $6.54B | $6.55B | $6.57B | $6.67B | $6.71B | $6.99B | $7.49B | $7.74B | $7.74B | $7.74B | $7.87B | $8.38B | $6.60B | $7.04B | $7.00B |
| Minority Interest | $5.50M | $4.40M | $4.10M | $3.90M | $3.80M | $3.70M | $3.50M | $3.60M | $3.70M | $500.00K | $500.00K | $500.00K | $500.00K | $500.00K | $500.00K | $500.00K | $500.00K | $500.00K | $500.00K | $500.00K |
| Total Liabilities and Total Equity | $6.76B | $7.05B | $6.86B | $6.76B | $6.95B | $6.54B | $6.55B | $6.57B | $6.67B | $6.71B | $6.99B | $7.49B | $7.74B | $7.74B | $7.74B | $7.87B | $8.38B | $6.60B | $7.04B | $7.00B |
| Total Investments | $900.00K | $1.00M | $44.90M | $700.00K | $23.10M | $49.20M | $43.90M | $400.00K | $1.10M | $5.20M | $2.10M | $400.00K | $800.00K | $1.70M | $2.60M | $2.70M | $3.10M | $3.90M | $4.70M | $6.20M |
| Total Debt | $4.47B | $5.14B | $4.15B | $4.17B | $4.18B | $3.97B | $3.96B | $3.96B | $3.96B | $3.87B | $3.85B | $3.87B | $3.88B | $3.68B | $3.69B | $3.64B | $3.95B | $3.04B | $3.45B | $3.08B |
| Net Debt | $3.94B | $4.92B | $3.95B | $3.81B | $3.35B | $3.59B | $3.44B | $3.40B | $3.30B | $3.20B | $3.08B | $2.72B | $2.40B | $2.25B | $2.42B | $2.28B | $2.07B | $1.60B | $1.50B | $1.24B |
Annual Cash Flow
| Breakdown | December 31, 2024 | December 31, 2023 | December 31, 2022 | December 31, 2021 | December 31, 2020 |
|---|---|---|---|---|---|
| Net Income | $-2.14B | $-616.20M | $-546.20M | $-540.80M | $-870.30M |
| Depreciation and Amortization | $305.40M | $315.60M | $337.10M | $327.60M | $277.60M |
| Deferred Income Tax | $-2.00M | $18.10M | $8.50M | $-4.50M | $95.50M |
| Stock Based Compensation | $38.10M | $29.20M | $36.60M | $25.80M | $24.20M |
| Change in Working Capital | $- | $127.00M | $-177.40M | $400.60M | $-607.80M |
| Accounts Receivables | $198.00M | $-114.60M | $-39.40M | $51.50M | $168.30M |
| Inventory | $-152.40M | $-295.10M | $-118.20M | $30.90M | $-39.50M |
| Accounts Payables | $-49.90M | $213.80M | $160.20M | $92.00M | $-445.50M |
| Other Working Capital | $- | $322.90M | $-180.00M | $226.20M | $-291.10M |
| Other Non Cash Items | $676.60M | $-99.50M | $-53.20M | $-271.90M | $335.90M |
| Net Cash Provided by Operating Activities | $-1.12B | $-225.80M | $-394.60M | $-63.20M | $-744.90M |
| Investments in Property Plant and Equipment | $-152.50M | $-148.00M | $-121.60M | $-150.60M | $-118.90M |
| Acquisitions Net | $- | $- | $-31.30M | $-21.10M | $-388.50M |
| Purchases of Investments | $- | $- | $- | $- | $- |
| Sales Maturities of Investments | $- | $- | $- | $- | $- |
| Other Investing Activities | $100.00K | $200.00K | $-2.60M | $7.90M | $5.40M |
| Net Cash Used for Investing Activities | $-152.40M | $-147.80M | $-155.50M | $-163.80M | $-502.00M |
| Debt Repayment | $292.00M | $177.50M | $67.20M | $-157.00M | $828.70M |
| Common Stock Issued | $7.60M | $220.70M | $3.00M | $3.00M | $2.60M |
| Common Stock Repurchased | $- | $- | $-296.70M | $-5.20M | $-100.00K |
| Dividends Paid | $- | $- | $-4.20M | $-4.30M | $-15.40M |
| Other Financing Activities | $702.50M | $133.40M | $-324.00M | $-2.20M | $-43.90M |
| Net Cash Used Provided by Financing Activities | $994.50M | $531.60M | $-261.00M | $-163.50M | $769.50M |
| Effect of Forex Changes on Cash | $-600.00K | $9.50M | $-8.90M | $-4.20M | $3.30M |
| Net Change in Cash | $-279.40M | $167.50M | $-820.00M | $-394.70M | $-474.10M |
| Cash at End of Period | $566.50M | $845.90M | $678.40M | $1.50B | $1.89B |
| Cash at Beginning of Period | $845.90M | $678.40M | $1.50B | $1.89B | $2.37B |
| Operating Cash Flow | $-1.12B | $-225.80M | $-394.60M | $-63.20M | $-744.90M |
| Capital Expenditure | $-152.50M | $-148.00M | $-121.60M | $-150.60M | $-118.90M |
| Free Cash Flow | $-1.27B | $-373.80M | $-516.20M | $-213.80M | $-863.80M |
Cash Flow Charts
| Breakdown | December 31, 2024 | September 26, 2024 | June 27, 2024 | March 28, 2024 | December 31, 2023 | September 28, 2023 | June 29, 2023 | March 30, 2023 | December 31, 2022 | September 29, 2022 | June 30, 2022 | March 31, 2022 | December 31, 2021 | September 30, 2021 | July 01, 2021 | April 01, 2021 | December 31, 2020 | October 01, 2020 | July 02, 2020 | April 02, 2020 |
|---|---|---|---|---|---|---|---|---|---|---|---|---|---|---|---|---|---|---|---|---|
| Net Income | $-630.70M | $-476.90M | $-415.30M | $-616.60M | $58.70M | $-203.90M | $-206.40M | $-281.20M | $-243.60M | $-127.60M | $-122.20M | $-52.80M | $-120.30M | $-113.60M | $-135.30M | $-171.60M | $-295.90M | $-155.50M | $-255.90M | $-163.00M |
| Depreciation and Amortization | $72.50M | $77.30M | $77.70M | $77.90M | $78.70M | $79.20M | $77.80M | $79.90M | $83.90M | $84.20M | $83.80M | $85.20M | $85.70M | $81.60M | $80.00M | $80.30M | $75.10M | $67.10M | $68.10M | $67.30M |
| Deferred Income Tax | $-3.20M | $-3.30M | $1.20M | $9.00M | $21.90M | $7.70M | $4.90M | $-16.40M | $-7.20M | $29.30M | $13.60M | $-27.20M | $-18.00M | $1.00M | $15.30M | $-2.80M | $129.80M | $17.00M | $10.20M | $-61.50M |
| Stock Based Compensation | $7.30M | $10.10M | $9.90M | $10.80M | $-100.00K | $9.50M | $10.80M | $9.00M | $7.90M | $10.40M | $10.10M | $8.20M | $6.20M | $6.20M | $6.80M | $6.60M | $7.10M | $6.30M | $1.00M | $9.80M |
| Change in Working Capital | $426.50M | $-1.40M | $-295.40M | $-265.10M | $50.40M | $10.50M | $-59.00M | $90.80M | $60.00M | $-13.00M | $-11.80M | $-212.60M | $139.80M | $291.00M | $44.10M | $-74.30M | $-62.00M | $-67.70M | $-246.80M | $-231.30M |
| Accounts Receivables | $443.20M | $1.20M | $23.20M | $7.40M | $126.90M | $-109.90M | $99.50M | $-138.60M | $49.60M | $35.70M | $-1.40M | $-123.30M | $56.20M | $6.50M | $27.10M | $-38.30M | $-1.00M | $-75.10M | $208.30M | $36.10M |
| Inventory | $93.40M | $-113.90M | $-97.10M | $-34.80M | $-68.10M | $-65.60M | $-85.60M | $-75.80M | $-70.30M | $-61.80M | $28.20M | $-14.30M | $-52.50M | $-28.40M | $88.70M | $23.10M | $26.60M | $49.30M | $-56.00M | $-59.40M |
| Accounts Payables | $- | $57.80M | $-92.10M | $99.70M | $-8.40M | $157.90M | $-90.40M | $- | $220.70M | $- | $25.40M | $80.10M | $160.20M | $57.60M | $3.40M | $-6.40M | $-592.70M | $11.80M | $-208.00M | $-278.60M |
| Other Working Capital | $-110.10M | $53.50M | $-129.40M | $-39.80M | $3.40M | $28.10M | $17.50M | $305.20M | $-140.00M | $9.60M | $3.50M | $-155.10M | $-24.10M | $255.30M | $-75.10M | $-52.70M | $505.10M | $-53.70M | $-191.10M | $70.60M |
| Other Non Cash Items | $264.20M | $117.80M | $387.70M | $-100.00K | $-95.90M | $-13.50M | $-10.90M | $71.70M | $71.80M | $-8.40M | $25.20M | $-71.00M | $-169.90M | $-55.20M | $-38.40M | $-8.40M | $13.80M | $79.70M | $195.00M | $47.40M |
| Net Cash Provided by Operating Activities | $136.60M | $-276.40M | $-565.50M | $-415.60M | $113.70M | $-110.50M | $-182.80M | $-46.20M | $-27.20M | $-35.70M | $-61.50M | $-270.20M | $-76.50M | $211.00M | $-27.50M | $-170.20M | $-132.10M | $-53.10M | $-228.40M | $-331.30M |
| Investments in Property Plant and Equipment | $-45.70M | $-46.50M | $-31.60M | $-28.70M | $-71.50M | $-25.20M | $-28.40M | $-22.90M | $-38.90M | $-37.50M | $-17.50M | $-27.70M | $-60.60M | $-36.70M | $-25.70M | $-27.60M | $-48.50M | $-19.20M | $-20.20M | $-31.00M |
| Acquisitions Net | $- | $- | $- | $- | $- | $- | $- | $- | $-31.30M | $- | $- | $- | $- | $- | $-21.10M | $- | $-270.60M | $- | $-1.30M | $-116.60M |
| Purchases of Investments | $- | $- | $- | $- | $- | $- | $- | $- | $- | $- | $- | $- | $- | $- | $- | $- | $- | $- | $- | $- |
| Sales Maturities of Investments | $- | $- | $- | $- | $- | $- | $- | $- | $- | $- | $- | $- | $- | $- | $- | $- | $- | $- | $- | $- |
| Other Investing Activities | $- | $100.00K | $- | $- | $200.00K | $- | $- | $- | $3.50M | $-3.90M | $-2.20M | $- | $3.20M | $2.50M | $1.00M | $1.20M | $500.00K | $2.20M | $2.40M | $300.00K |
| Net Cash Used for Investing Activities | $-45.70M | $-46.40M | $-31.60M | $-28.70M | $-71.30M | $-25.20M | $-28.40M | $-22.90M | $-66.70M | $-41.40M | $-19.70M | $-27.70M | $-57.40M | $-34.20M | $-45.80M | $-26.40M | $-318.60M | $-17.00M | $-19.10M | $-147.30M |
| Debt Repayment | $-487.10M | $- | $448.60M | $-16.50M | $226.10M | $-4.80M | $163.70M | $-14.80M | $103.90M | $-11.20M | $-12.90M | $-12.60M | $183.60M | $-11.20M | $-12.20M | $-313.30M | $891.10M | $-436.20M | $386.80M | $-13.00M |
| Common Stock Issued | $- | $- | $3.80M | $- | $3.70M | $- | $2.60M | $- | $3.90M | $- | $- | $1.90M | $3.00M | $1.60M | $- | $1.40M | $2.60M | $- | $- | $1.30M |
| Common Stock Repurchased | $- | $5.10M | $-600.00K | $-4.50M | $-500.00K | $-6.20M | $-1.10M | $- | $-289.70M | $-500.00K | $-1.20M | $-1.90M | $-200.00K | $-600.00K | $-1.10M | $-3.30M | $-500.00K | $-200.00K | $-700.00K | $-13.10M |
| Dividends Paid | $- | $- | $- | $- | $- | $- | $- | $- | $-1.00M | $-1.00M | $-1.10M | $-1.10M | $-1.10M | $-1.00M | $-1.10M | $-1.10M | $-1.00M | $-1.00M | $-1.00M | $-12.40M |
| Other Financing Activities | $716.80M | $335.90M | $1.80M | $-5.00M | $171.40M | $-6.20M | $1.50M | $-5.30M | $-29.40M | $-500.00K | $-279.70M | $-14.40M | $-200.00K | $-3.20M | $-2.30M | $-3.40M | $-15.00M | $-1.90M | $-20.30M | $-6.60M |
| Net Cash Used Provided by Financing Activities | $229.70M | $335.90M | $450.40M | $-21.50M | $397.50M | $-11.00M | $165.20M | $-20.10M | $73.50M | $-12.70M | $-293.70M | $-28.10M | $182.30M | $-13.80M | $-15.60M | $-316.40M | $875.10M | $-439.10M | $365.50M | $-32.00M |
| Effect of Forex Changes on Cash | $-900.00K | $-400.00K | $1.00M | $-300.00K | $9.50M | $-4.80M | $3.90M | $900.00K | $8.60M | $-9.90M | $-6.80M | $-800.00K | $-400.00K | $-1.70M | $-1.10M | $-1.00M | $6.60M | $4.40M | $-1.50M | $-6.20M |
| Net Change in Cash | $319.70M | $40.80M | $-146.10M | $-466.10M | $449.30M | $-151.50M | $-42.10M | $-88.30M | $-11.80M | $-99.70M | $-381.70M | $-326.80M | $48.00M | $161.30M | $-90.00M | $-514.00M | $431.00M | $-504.80M | $116.50M | $-516.80M |
| Cash at End of Period | $566.50M | $246.80M | $206.00M | $379.80M | $823.60M | $396.50M | $548.00M | $590.10M | $678.40M | $690.20M | $789.90M | $1.17B | $1.50B | $1.45B | $1.29B | $1.38B | $1.89B | $1.46B | $1.97B | $1.85B |
| Cash at Beginning of Period | $246.80M | $206.00M | $352.10M | $845.90M | $374.30M | $548.00M | $590.10M | $678.40M | $690.20M | $789.90M | $1.17B | $1.50B | $1.45B | $1.29B | $1.38B | $1.89B | $1.46B | $1.97B | $1.85B | $2.37B |
| Operating Cash Flow | $136.60M | $-276.40M | $-565.50M | $-415.60M | $113.70M | $-110.50M | $-182.80M | $-46.20M | $-27.20M | $-35.70M | $-61.50M | $-270.20M | $-76.50M | $211.00M | $-27.50M | $-170.20M | $-132.10M | $-53.10M | $-228.40M | $-331.30M |
| Capital Expenditure | $-45.70M | $-46.50M | $-31.60M | $-28.70M | $-71.50M | $-25.20M | $-28.40M | $-22.90M | $-38.90M | $-37.50M | $-17.50M | $-27.70M | $-60.60M | $-36.70M | $-25.70M | $-27.60M | $-48.50M | $-19.20M | $-20.20M | $-31.00M |
| Free Cash Flow | $90.90M | $-322.90M | $-597.10M | $-444.30M | $42.20M | $-135.70M | $-211.20M | $-69.10M | $-66.10M | $-73.20M | $-79.00M | $-297.90M | $-137.10M | $174.30M | $-53.20M | $-197.80M | $-180.60M | $-72.30M | $-248.60M | $-362.30M |
Spirit AeroSystems Holdings Dividends
Explore Spirit AeroSystems Holdings's dividend history, including dividend yield, payout ratio, and historical payments.
Dividend Yield
-
Dividend Payout Ratio
-
Dividend Paid & Capex Coverage Ratio
-7.35x
Spirit AeroSystems Holdings Dividend History
| Dividend | Adjusted Dividend | Date | Record Date | Payment Date | Declaration Date |
|---|---|---|---|---|---|
| $0.01 | $0.01 | September 09, 2022 | September 12, 2022 | October 03, 2022 | July 13, 2022 |
| $0.01 | $0.01 | June 15, 2022 | June 16, 2022 | July 07, 2022 | April 26, 2022 |
| $0.01 | $0.01 | March 17, 2022 | March 18, 2022 | April 08, 2022 | January 26, 2022 |
| $0.01 | $0.01 | December 10, 2021 | December 13, 2021 | January 03, 2022 | October 26, 2021 |
| $0.01 | $0.01 | September 10, 2021 | September 13, 2021 | October 04, 2021 | July 27, 2021 |
| $0.01 | $0.01 | June 11, 2021 | June 14, 2021 | July 06, 2021 | April 28, 2021 |
| $0.01 | $0.01 | March 18, 2021 | March 19, 2021 | April 09, 2021 | January 27, 2021 |
| $0.01 | $0.01 | December 11, 2020 | December 14, 2020 | January 04, 2021 | October 21, 2020 |
| $0.01 | $0.01 | September 11, 2020 | September 14, 2020 | October 05, 2020 | July 15, 2020 |
| $0.01 | $0.01 | June 12, 2020 | June 15, 2020 | July 06, 2020 | April 22, 2020 |
| $0.01 | $0.01 | March 19, 2020 | March 20, 2020 | April 09, 2020 | February 06, 2020 |
| $0.12 | $0.12 | December 13, 2019 | December 16, 2019 | January 06, 2020 | October 23, 2019 |
| $0.12 | $0.12 | September 13, 2019 | September 16, 2019 | October 07, 2019 | July 22, 2019 |
| $0.12 | $0.12 | June 14, 2019 | June 17, 2019 | July 08, 2019 | April 24, 2019 |
| $0.12 | $0.12 | March 15, 2019 | March 18, 2019 | April 08, 2019 | January 23, 2019 |
| $0.12 | $0.12 | December 14, 2018 | December 17, 2018 | January 07, 2019 | October 24, 2018 |
| $0.12 | $0.12 | September 14, 2018 | September 17, 2018 | October 09, 2018 | July 23, 2018 |
| $0.12 | $0.12 | June 15, 2018 | June 18, 2018 | July 09, 2018 | April 25, 2018 |
| $0.1 | $0.1 | March 16, 2018 | March 19, 2018 | April 09, 2018 | January 24, 2018 |
| $0.1 | $0.1 | December 15, 2017 | December 18, 2017 | January 08, 2018 | October 25, 2017 |
Spirit AeroSystems Holdings News
Read the latest news about Spirit AeroSystems Holdings, including recent articles, headlines, and updates.
Fast-paced Momentum Stock Spirit Aerosystems (SPR) Is Still Trading at a Bargain
If you are looking for stocks that have gained strong momentum recently but are still trading at reasonable prices, Spirit Aerosystems (SPR) could be a great choice. It is one of the several stocks that passed through our 'Fast-Paced Momentum at a Bargain' screen.

These Are the Airlines Americans Love (and Hate) the Most
Consumer spending is the backbone of the U.S. economy, and every year, a meaningful portion of a typical household budget goes towards non-essential items and experiences — such as jewelry, dining out, and entertainment. But a February 2025 survey conducted by the management consulting firm McKinsey found that Americans are more willing to splurge on travel than nearly every other sector. 24/7 Wall St. Key Points: Customer facing industries are often highly competitive, and air travel is no exception — particularly in an era of widespread economic uncertainty. Recent survey data measuring customer satisfaction suggests that some airlines are better positioned to maintain a solid customer base in the coming months than others. Also: Discover the next Nvidia While these findings should have come as welcome news to the air travel industry, many of the biggest airlines in the U.S. are not especially optimistic. In times of economic uncertainty or hardship, non-essential consumer spending tends to contract. And according to the University of Michigan Index of Consumer Sentiment, consumer confidence has fallen for three consecutive months — from 71.1 points in January, to 64.7 points in February, to 57.9 points in March. Waning optimism is due in large part to economic uncertainty under President Donald Trump and widespread concerns over the impact his administration’s policies may have on inflation, the job market, and business conditions. (Here is a look at the Americans who are not happy with Trump’s handling of the economy.) Shifts in public perception of the economy have broad implications for multiple industries, including air travel. Citing economic uncertainty, several major American airlines, including American, Delta, and United, cut earnings estimates in early March. Air travel is a highly competitive industry in the best of times, but under current economic conditions, airlines may have to go above and beyond to continue to bring in business. According to the latest data from the American Customer Satisfaction Index, some airlines appear better positioned to navigate current economic conditions than others. Using data from the ACSI, 24/7 Wall St. identified the best and worst airlines in America. We ranked all nine major airline companies with available data on their average customer satisfaction score in 2023 and 2024. Supplementary data on on-time arrivals is from the U.S. Bureau of Transportation Statistics. The airline industry as a whole had an overall customer satisfaction index score of 76.5 in 2023 in 2024. Among the nine airlines on this list, average scores range from 65.5 to 81.5. The two lowest ranked airlines on this list are so-called budget airlines. Generally, these companies can offer lower ticket prices by cutting operating costs. However, this often results in fewer in-flight amenities and additional fees for services that would be complimentary on other airlines. Notably, however, there are other budget airlines on this list with customer satisfaction scores that are in line with, or higher than, the industry average. Notably, the highest ranking airlines on this list are not necessarily those with the best track record of on-time arrivals. While getting customers to their destinations on time is the core of any airline’s business, customer perception is also based on a wide variety of additional factors. Indeed, each airline’s customer satisfaction index score comprises multiple benchmarks, such as the check-in process, interactions with the staff and flight crew, the range of offered flight schedules, as well as several measures of in-flight comfort — including availability of overhead storage, seating, and complimentary entertainment and refreshments. (Here is a look at the airlines with the best perks for business travelers.) Why It Matters In the current climate of growing economic pessimism and uncertainty, Americans are expected to cut back on discretionary spending. In this context, airlines will likely be forced to compete for business with a shrinking customer pool — and the companies that regularly meet or exceed traveler expectations may be better positioned to meet revenue targets than those that do not. 9. Spirit 2-year average annual customer satisfaction index score: 65.5 out of 100 Customer satisfaction index score by year: 67 in 2024, 64 in 2023 Carrier flights that arrived on time in 2023 and 2024: 72.0% Brand’s parent company: Spirit AeroSystems Holdings Corporate headquarters: Wichita, KS Corporate revenue in most recent available fiscal year: $6.3 billion Corporate operating profit in most recent available fiscal year: -$1.8 billion Stock ticker: NYSE: SPR 8. Frontier 2-year average annual customer satisfaction index score: 68.0 out of 100 Customer satisfaction index score by year: 69 in 2024, 67 in 2023 Carrier flights that arrived on time in 2023 and 2024: 68.4% Brand’s parent company: Frontier Group Holdings Corporate headquarters: Denver, CO Corporate revenue in most recent available fiscal year: $3.8 billion Corporate operating profit in most recent available fiscal year: $58.0 million Stock ticker: Nasdaq: ULCC 7. United 2-year average annual customer satisfaction index score: 76.0 out of 100 Customer satisfaction index score by year: 75 in 2024, 77 in 2023 Carrier flights that arrived on time in 2023 and 2024: 78.3% Brand’s parent company: United Airlines Holdings Corporate headquarters: Chicago, IL Corporate revenue in most recent available fiscal year: $57.1 billion Corporate operating profit in most recent available fiscal year: $5.2 billion Stock ticker: Nasdaq: UAL 4. JetBlue 2-year average annual customer satisfaction index score: 76.5 out of 100 (tied) Customer satisfaction index score by year: 77 in 2024, 76 in 2023 Carrier flights that arrived on time in 2023 and 2024: 69.9% Brand’s parent company: JetBlue Airways Corporation Corporate headquarters: Long Island City, NY Corporate revenue in most recent available fiscal year: $9.3 billion Corporate operating profit in most recent available fiscal year: -$93.0 million Stock ticker: Nasdaq: JBLU 4. Delta 2-year average annual customer satisfaction index score: 76.5 out of 100 (tied) Customer satisfaction index score by year: 77 in 2024, 76 in 2023 Carrier flights that arrived on time in 2023 and 2024: 82.2% Brand’s parent company: Delta Air Lines Corporate headquarters: Atlanta, GA Corporate revenue in most recent available fiscal year: $61.6 billion Corporate operating profit in most recent available fiscal year: $6.0 billion Stock ticker: NYSE: DAL 4. Allegiant 2-year average annual customer satisfaction index score: 76.5 out of 100 (tied) Customer satisfaction index score by year: 78 in 2024, 75 in 2023 Carrier flights that arrived on time in 2023 and 2024: 75.1% Brand’s parent company: Allegiant Travel Company Corporate headquarters: Las Vegas, NV Corporate revenue in most recent available fiscal year: $2.5 billion Corporate operating profit in most recent available fiscal year: $128.2 million Stock ticker: Nasdaq: ALGT 3. Southwest 2-year average annual customer satisfaction index score: 78.0 out of 100 Customer satisfaction index score by year: 78 in 2024, 78 in 2023 Carrier flights that arrived on time in 2023 and 2024: 77.9% Brand’s parent company: Southwest Airlines Corporate headquarters: Dallas, TX Corporate revenue in most recent available fiscal year: $27.5 billion Corporate operating profit in most recent available fiscal year: $321.0 million Stock ticker: NYSE: LUV 2. American 2-year average annual customer satisfaction index score: 78.5 out of 100 Customer satisfaction index score by year: 79 in 2024, 78 in 2023 Carrier flights that arrived on time in 2023 and 2024: 74.2% Brand’s parent company: American Airlines Group Inc. Corporate headquarters: Fort Worth, TX Corporate revenue in most recent available fiscal year: $54.2 billion Corporate operating profit in most recent available fiscal year: $3.2 billion Stock ticker: Nasdaq: AAL 1. Alaska 2-year average annual customer satisfaction index score: 81.5 out of 100 Customer satisfaction index score by year: 82 in 2024, 81 in 2023 Carrier flights that arrived on time in 2023 and 2024: 77.8% Brand’s parent company: Alaska Air Group, Inc. Corporate headquarters: Seattle, WA Corporate revenue in most recent available fiscal year: $11.7 billion Corporate operating profit in most recent available fiscal year: $915.0 million Stock ticker: NYSE: ALK The post These Are the Airlines Americans Love (and Hate) the Most appeared first on 24/7 Wall St..

Spirit AeroSystems reports $577 million quarterly operating loss
Spirit AeroSystems on Friday reported a $577 million operating loss for the fourth quarter of 2024 compared with $215 million in operating income during the same three months a year earlier, which was helped by a funding agreement with key customer Boeing.
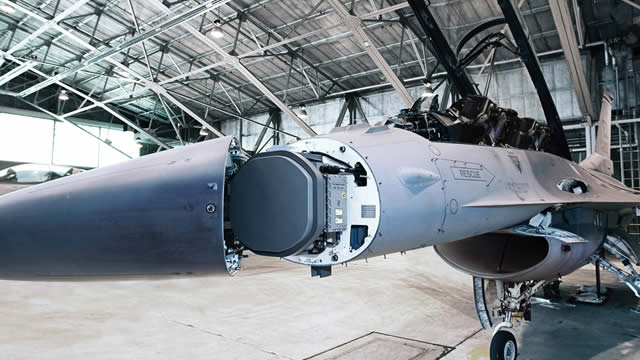
Spirit AeroSystems Reports Fourth Quarter 2024 Results
WICHITA, Kan. , Feb. 28, 2025 /PRNewswire/ -- Fourth Quarter 2024 Revenues of $1.7 billion EPS of $(5.38); Adjusted EPS* of $(4.22) Cash provided by operations of $137 million; Free cash flow* of $91 million Spirit AeroSystems Holdings, Inc. (NYSE: SPR) ("Spirit," "Spirit AeroSystems" or the "Company") reported fourth quarter and full-year 2024 financial results.

Boeing executive says supplier Spirit Aero has a substantial inventory of 737 fuselages
Boeing's key supplier Spirit AeroSystems has a substantial inventory of 737 fuselages of significantly improved quality that are ready to ship, an executive with the planemaker told a Seattle aerospace conference on Tuesday.

Spirit AeroSystems Shareholders Approve Acquisition by Boeing
WICHITA, Kan., Jan. 31, 2025 /PRNewswire/ -- Spirit AeroSystems Holdings, Inc. (NYSE: SPR) today announced that, at the special meeting of its shareholders held earlier today, its shareholders voted to approve the proposed acquisition of Spirit AeroSystems by The Boeing Company.

Spirit Announces Sale of Fiber Materials Inc. (FMI) to Tex Tech Industries
WICHITA, Kan. , Jan. 13, 2025 /PRNewswire/ -- Today, Spirit AeroSystems Holdings, Inc. (NYSE: SPR) ("Spirit," "Spirit AeroSystems" or the "Company") announced the sale of Fiber Materials Inc ("FMI") business based in Biddeford, Maine, and Woonsocket, Rhode Island, to Tex Tech Industries, Inc. ("Tex-Tech") for $165 million in cash.

Airbus CEO says Spirit Aero talks going well but industrial challenges lie ahead
The head of European planemaker Airbus said talks to finalise the takeover of part of troubled U.S. aerostructures supplier Spirit Aerosystems were going smoothly but that bringing it into Airbus would "not be a walk in the park".

Spirit Announces Purchase Agreement with Tex Tech Industries for Intended Sale of Fiber Materials, Inc. (FMI)
WICHITA, Kan. , Nov. 18, 2024 /PRNewswire/ -- Today, Spirit AeroSystems Holdings, Inc. (NYSE: SPR) ("Spirit," "Spirit AeroSystems" or the "Company") announces a purchase agreement to sell Fiber Materials, Inc ("FMI") business based in Biddeford, Maine, and Woonsocket, Rhode Island, to Tex-Tech Industries, Inc. ("Tex-Tech") for $165,000,000 in cash, subject to customary adjustment.

Spirit AeroSystems Announces Second Amended and Restated Memorandum of Agreement with Airbus
WICHITA, Kan., Nov. 12, 2024 /PRNewswire/ -- Spirit AeroSystems (NYSE: SPR) today announces a Second Amended and Restated Memorandum of Agreement with Airbus, in which Airbus has agreed to provide Spirit a non-interest-bearing line of credit in an amount of $107 million.

Spirit AeroSystems Announces Advance Payments Agreement with Boeing
WICHITA, Kan. , Nov. 12, 2024 /PRNewswire/ -- Spirit AeroSystems (NYSE: SPR) today announces an Advance Payments Agreement with Boeing, in which Boeing has committed to pay Spirit, as advance payments, up to a total of $350,000,000.00 to produce Boeing products at the rates required by Boeing.

Boeing supplier Spirit AeroSystems says there's ‘substantial doubt' about its ability to keep operating
Aircraft-parts supplier Spirit AeroSystems Holdings Inc. on Tuesday said that there was “substantial doubt” about its ability to keep running as a “going concern,” as losses, debt, and difficulties at jet maker Boeing Co. pile up.
Spirit AeroSystems weighs hundreds more furloughs or layoffs if Boeing strike goes beyond Nov. 25
Spirit AeroSystems is weighing furloughs or layoffs of hundreds more employees if the Boeing machinists' strike stretches beyond Nov. 25, a company spokesman told CNBC Thursday. More than 32,000 Boeing machinists walked off the job on Sept.
Spirit Aerosystems (SPR) Reports Q3 Earnings: What Key Metrics Have to Say
While the top- and bottom-line numbers for Spirit Aerosystems (SPR) give a sense of how the business performed in the quarter ended September 2024, it could be worth looking at how some of its key metrics compare to Wall Street estimates and year-ago values.

Spirit AeroSystems Reports Third Quarter 2024 Results
WICHITA, Kan. , Oct. 23, 2024 /PRNewswire/ -- Third Quarter 2024 Revenues of $1.5 billion EPS of $(4.07); Adjusted EPS* of $(3.03) Cash used in operations of $276 million; Free cash flow* usage of $323 million Spirit AeroSystems Holdings, Inc. (NYSE: SPR) ("Spirit," "Spirit AeroSystems" or the "Company") reported third quarter 2024 financial results.

Spirit AeroSystems Announces Furloughs
WICHITA, Kan. , Oct. 18, 2024 /PRNewswire/ -- Spirit AeroSystems (NYSE: SPR) today announces employee furloughs in response to the ongoing strike by Boeing employees represented by the International Association of Machinists and Aerospace Workers that began on September 13.

Similar Companies
Related Metrics
Explore detailed financial metrics and analysis for SPR.
