Stericycle Key Executives
This section highlights Stericycle's key executives, including their titles and compensation details.
Find Contacts at Stericycle
(Showing 0 of )
Stericycle Earnings
This section highlights Stericycle's earnings, including key dates, EPS, earnings reports, and earnings call transcripts.
Next Earnings Date
Last Earnings Results
Earnings Call Transcripts
| Transcript | Quarter | Year | Date | Estimated EPS | Actual EPS |
|---|---|---|---|---|---|
| Read Transcript | Q1 | 2024 | 2024-04-25 | $0.54 | $0.57 |
| Read Transcript | Q4 | 2023 | 2024-02-28 | $0.47 | $0.54 |
| Read Transcript | Q3 | 2023 | 2023-11-02 | $0.43 | $0.43 |
| Read Transcript | Q2 | 2023 | 2023-07-27 | $0.49 | $0.43 |
| Read Transcript | Q1 | 2023 | 2023-04-27 | $0.43 | $0.49 |

Stericycle, Inc., together with its subsidiaries, provides regulated and compliance solutions in the United States, Europe, and internationally. The company offers regulated waste and compliance services, including sharps disposable and management solutions; pharmaceutical waste services; hazardous waste disposal; maritime waste services, such as seaport and airport waste; and compliance programs under the Steri-Safe, Clinical Services, First Practice Management, SeguriMed, and EnviroAssure brand names. It also provides secure information destruction services, including document and hard drive destruction services under the Shred-it brand; and communication solutions, such as appointment reminders, secure messaging, event registration, and other communications specifically for hospitals and integrated delivery networks. The company serves healthcare businesses, including hospitals, physician and dental practices, outpatient clinics, long-term care facilities, etc.; retailers and manufacturers; financial and professional service providers; governmental entities; and other businesses. Stericycle, Inc. was incorporated in 1989 and is headquartered in Bannockburn, Illinois.
$61.98
Stock Price
$5.75B
Market Cap
13.50K
Employees
Bannockburn, IL
Location
Financial Statements
Access annual & quarterly financial statements for Stericycle, including income statements, balance sheets, and cash flow statements..
Annual Income Statement
| Breakdown | December 31, 2023 | December 31, 2022 | December 31, 2021 | December 31, 2020 | December 31, 2019 |
|---|---|---|---|---|---|
| Revenue | $2.66B | $2.70B | $2.65B | $2.68B | $3.31B |
| Cost of Revenue | $1.66B | $1.68B | $1.63B | $1.62B | $2.13B |
| Gross Profit | $1.00B | $1.03B | $1.02B | $1.05B | $1.17B |
| Gross Profit Ratio | 37.70% | 37.92% | 38.40% | 39.36% | 35.50% |
| Research and Development Expenses | $- | $- | $- | $- | $- |
| General and Administrative Expenses | $- | $- | $- | $- | $- |
| Selling and Marketing Expenses | $- | $- | $- | $- | $- |
| Selling General and Administrative Expenses | $707.40M | $887.50M | $946.60M | $897.60M | $1.06B |
| Other Expenses | $219.00M | $700.00K | $300.00K | $-6.00M | $-9.50M |
| Operating Expenses | $926.40M | $887.50M | $946.60M | $897.60M | $1.06B |
| Cost and Expenses | $2.58B | $2.57B | $2.58B | $2.52B | $3.19B |
| Interest Income | $- | $75.50M | $71.90M | $81.90M | $118.30M |
| Interest Expense | $73.90M | $75.50M | $71.90M | $81.90M | $118.30M |
| Depreciation and Amortization | $216.50M | $232.50M | $223.90M | $233.50M | $272.80M |
| EBITDA | $293.70M | $413.00M | $394.40M | $427.90M | $24.70M |
| EBITDA Ratio | 11.04% | 15.00% | 11.14% | 14.32% | 11.57% |
| Operating Income | $77.30M | $153.70M | $72.30M | $149.50M | $109.90M |
| Operating Income Ratio | 2.91% | 5.68% | 2.73% | 5.59% | 3.32% |
| Total Other Income Expenses Net | $-74.00M | $-74.80M | $-71.60M | $-87.90M | $-150.90M |
| Income Before Tax | $3.30M | $78.90M | $700.00K | $-56.00M | $-362.80M |
| Income Before Tax Ratio | 0.12% | 2.92% | 0.03% | -2.09% | -10.96% |
| Income Tax Expense | $24.60M | $22.40M | $27.50M | $-100.00K | $-16.80M |
| Net Income | $-21.40M | $56.00M | $-26.80M | $-55.90M | $-346.00M |
| Net Income Ratio | -0.80% | 2.07% | -1.01% | -2.09% | -10.46% |
| EPS | $-0.23 | $0.61 | $-0.29 | $-0.61 | $-3.80 |
| EPS Diluted | $-0.23 | $0.61 | $-0.29 | $-0.61 | $-3.80 |
| Weighted Average Shares Outstanding | 92.40M | 92.10M | 91.80M | 91.50M | 91.00M |
| Weighted Average Shares Outstanding Diluted | 92.40M | 92.40M | 91.80M | 91.50M | 91.00M |
| SEC Filing | Source | Source | Source | Source | Source |
| Breakdown | September 30, 2024 | June 30, 2024 | March 31, 2024 | December 31, 2023 | September 30, 2023 | June 30, 2023 | March 31, 2023 | December 31, 2022 | September 30, 2022 | June 30, 2022 | March 31, 2022 | December 31, 2021 | September 30, 2021 | June 30, 2021 | March 31, 2021 | December 31, 2020 | September 30, 2020 | June 30, 2020 | March 31, 2020 | December 31, 2019 |
|---|---|---|---|---|---|---|---|---|---|---|---|---|---|---|---|---|---|---|---|---|
| Revenue | $648.40M | $661.60M | $664.90M | $652.00M | $653.50M | $669.50M | $684.30M | $670.40M | $690.30M | $679.80M | $664.20M | $657.30M | $648.90M | $672.70M | $668.00M | $655.90M | $636.40M | $598.20M | $785.00M | $799.90M |
| Cost of Revenue | $404.30M | $431.30M | $437.80M | $423.00M | $407.80M | $418.40M | $423.30M | $416.00M | $424.10M | $419.30M | $419.70M | $410.30M | $409.20M | $403.60M | $406.60M | $386.40M | $369.10M | $368.50M | $498.40M | $520.40M |
| Gross Profit | $244.10M | $230.30M | $227.10M | $229.00M | $245.70M | $251.10M | $261.00M | $254.40M | $266.20M | $260.50M | $244.50M | $247.00M | $239.70M | $269.10M | $261.40M | $269.50M | $267.30M | $229.70M | $286.60M | $279.50M |
| Gross Profit Ratio | 37.60% | 34.80% | 34.20% | 35.10% | 37.60% | 37.50% | 38.10% | 37.90% | 38.60% | 38.30% | 36.80% | 37.60% | 36.90% | 40.00% | 39.10% | 41.09% | 42.00% | 38.40% | 36.51% | 34.94% |
| Research and Development Expenses | $- | $- | $- | $- | $- | $- | $- | $- | $- | $- | $- | $- | $- | $- | $- | $- | $- | $- | $- | $- |
| General and Administrative Expenses | $- | $- | $- | $- | $- | $- | $- | $- | $- | $- | $- | $- | $- | $- | $- | $218.90M | $- | $201.00M | $258.70M | $250.00M |
| Selling and Marketing Expenses | $- | $- | $- | $- | $- | $- | $- | $- | $- | $- | $- | $- | $- | $- | $- | $- | $- | $- | $- | $-4.30M |
| Selling General and Administrative Expenses | $224.60M | $184.50M | $170.00M | $176.90M | $217.30M | $220.90M | $216.00M | $210.90M | $215.60M | $222.40M | $238.60M | $251.40M | $279.40M | $213.50M | $202.30M | $218.90M | $219.00M | $201.00M | $258.70M | $245.70M |
| Other Expenses | $10.50M | $-100.00K | $- | $200.00K | $100.00K | $-600.00K | $200.00K | $-100.00K | $2.30M | $-700.00K | $-800.00K | $-200.00K | $500.00K | $700.00K | $-700.00K | $-1.20M | $-900.00K | $-1.00M | $-2.90M | $-2.30M |
| Operating Expenses | $235.10M | $184.50M | $170.00M | $176.90M | $217.30M | $220.90M | $216.00M | $210.90M | $215.60M | $222.40M | $238.60M | $251.40M | $279.40M | $213.50M | $202.30M | $218.90M | $219.00M | $201.00M | $258.70M | $245.70M |
| Cost and Expenses | $639.40M | $615.80M | $607.80M | $599.90M | $625.10M | $639.30M | $639.30M | $626.90M | $639.70M | $641.70M | $658.30M | $661.70M | $688.60M | $617.10M | $608.90M | $605.30M | $588.10M | $569.50M | $757.10M | $766.10M |
| Interest Income | $- | $- | $- | $- | $17.40M | $19.10M | $20.40M | $20.90M | $19.80M | $- | $- | $- | $- | $- | $- | $- | $- | $- | $- | $- |
| Interest Expense | $20.40M | $20.50M | $18.40M | $17.00M | $17.40M | $19.10M | $20.40M | $20.90M | $19.80M | $18.50M | $16.30M | $16.80M | $18.80M | $17.90M | $18.40M | $19.90M | $17.70M | $19.30M | $25.00M | $27.20M |
| Depreciation and Amortization | $- | $53.10M | $53.50M | $53.60M | $54.00M | $54.10M | $54.80M | $56.30M | $58.70M | $57.80M | $59.70M | $56.90M | $56.70M | $55.00M | $55.30M | $55.70M | $57.70M | $60.20M | $59.90M | $65.70M |
| EBITDA | $9.00M | $102.70M | $110.60M | $91.10M | $96.40M | $29.50M | $110.90M | $98.50M | $111.60M | $95.20M | $64.80M | $92.30M | $6.60M | $111.30M | $113.70M | $130.60M | $1.00M | $113.00M | $26.60M | $-114.50M |
| EBITDA Ratio | 1.39% | 16.00% | 16.63% | 14.00% | 15.00% | 4.00% | 16.00% | 6.47% | 16.17% | 14.00% | 9.76% | -0.70% | 2.70% | 16.55% | 17.02% | 7.53% | 16.51% | 14.69% | 10.82% | 3.94% |
| Operating Income | $9.00M | $45.80M | $57.10M | $52.10M | $24.20M | $-24.00M | $40.00M | $-12.90M | $50.60M | $38.10M | $5.90M | $8.20M | $-50.60M | $55.60M | $59.10M | $93.20M | $-55.80M | $24.90M | $-30.40M | $-198.50M |
| Operating Income Ratio | 1.39% | 6.92% | 8.59% | 7.99% | 3.70% | -3.58% | 5.85% | -1.92% | 7.33% | 5.60% | 0.89% | 1.25% | -7.80% | 8.27% | 8.85% | 14.21% | -8.77% | 4.16% | -3.87% | -24.82% |
| Total Other Income Expenses Net | $-20.40M | $-20.60M | $-18.40M | $-16.80M | $-17.30M | $-19.70M | $-20.20M | $-21.00M | $-17.50M | $-19.20M | $-17.10M | $-17.00M | $-18.30M | $-17.20M | $-19.10M | $-21.10M | $-18.60M | $-20.30M | $-27.90M | $-29.50M |
| Income Before Tax | $-11.40M | $9.90M | $20.50M | $20.30M | $6.90M | $-43.70M | $19.80M | $38.10M | $33.10M | $18.90M | $-11.20M | $-8.80M | $-68.90M | $38.40M | $40.00M | $72.10M | $-74.40M | $4.60M | $-58.30M | $-228.00M |
| Income Before Tax Ratio | -1.76% | 1.50% | 3.08% | 3.11% | 1.06% | -6.53% | 2.89% | 5.68% | 4.80% | 2.78% | -1.69% | -1.34% | -10.62% | 5.71% | 5.99% | 10.99% | -11.69% | 0.77% | -7.43% | -28.50% |
| Income Tax Expense | $2.30M | $3.90M | $7.40M | $5.50M | $4.80M | $5.80M | $8.50M | $6.00M | $5.10M | $8.40M | $2.90M | $7.60M | $-3.00M | $9.10M | $13.80M | $23.10M | $6.50M | $8.70M | $-38.40M | $-8.80M |
| Net Income | $-13.80M | $6.00M | $13.10M | $14.90M | $2.00M | $-49.50M | $11.20M | $31.80M | $28.00M | $10.50M | $-14.10M | $-17.20M | $-66.00M | $29.30M | $26.10M | $48.50M | $-81.20M | $-4.50M | $-20.10M | $-219.30M |
| Net Income Ratio | -2.13% | 0.91% | 1.97% | 2.29% | 0.31% | -7.39% | 1.64% | 4.74% | 4.06% | 1.54% | -2.12% | -2.62% | -10.17% | 4.36% | 3.91% | 7.39% | -12.76% | -0.75% | -2.56% | -27.42% |
| EPS | $-0.15 | $0.06 | $0.14 | $0.16 | $0.02 | $-0.54 | $0.12 | $0.34 | $0.30 | $0.11 | $-0.15 | $-0.19 | $-0.72 | $0.32 | $0.29 | $0.53 | $-0.89 | $-0.05 | $-0.22 | $-2.41 |
| EPS Diluted | $-0.15 | $0.06 | $0.14 | $0.16 | $0.02 | $-0.54 | $0.12 | $0.34 | $0.30 | $0.11 | $-0.15 | $-0.19 | $-0.72 | $0.32 | $0.28 | $0.53 | $-0.89 | $-0.05 | $-0.22 | $-2.40 |
| Weighted Average Shares Outstanding | 92.70M | 92.70M | 92.60M | 92.50M | 92.50M | 92.50M | 92.30M | 92.20M | 92.20M | 92.10M | 92.00M | 90.63M | 91.67M | 91.80M | 91.60M | 91.50M | 91.24M | 90.00M | 91.30M | 91.00M |
| Weighted Average Shares Outstanding Diluted | 92.70M | 93.00M | 93.00M | 92.80M | 92.90M | 92.50M | 92.70M | 92.50M | 92.40M | 92.20M | 92.00M | 91.90M | 91.90M | 92.10M | 92.00M | 91.80M | 91.50M | 91.40M | 91.30M | 91.20M |
| SEC Filing | Source | Source | Source | Source | Source | Source | Source | Source | Source | Source | Source | Source | Source | Source | Source | Source | Source | Source | Source | Source |
Annual Balance Sheet
| Breakdown | December 31, 2023 | December 31, 2022 | December 31, 2021 | December 31, 2020 | December 31, 2019 |
|---|---|---|---|---|---|
| Cash and Cash Equivalents | $35.30M | $56.00M | $55.60M | $53.30M | $34.70M |
| Short Term Investments | $- | $- | $- | $- | $- |
| Cash and Short Term Investments | $35.30M | $56.00M | $55.60M | $53.30M | $34.70M |
| Net Receivables | $553.90M | $414.50M | $420.40M | $380.70M | $544.30M |
| Inventory | $- | $33.20M | $45.60M | $63.00M | $60.70M |
| Other Current Assets | $82.30M | $88.20M | $99.50M | $118.50M | $127.60M |
| Total Current Assets | $671.50M | $558.70M | $575.50M | $552.50M | $706.60M |
| Property Plant Equipment Net | $1.17B | $1.11B | $1.06B | $1.07B | $1.23B |
| Goodwill | $2.76B | $2.78B | $2.82B | $2.82B | $2.98B |
| Intangible Assets | $686.50M | $811.10M | $964.50M | $1.09B | $1.42B |
| Goodwill and Intangible Assets | $3.44B | $3.60B | $3.78B | $3.91B | $4.40B |
| Long Term Investments | $- | $- | $-411.00M | $-380.40M | $-295.10M |
| Tax Assets | $- | $427.00M | $411.00M | $380.40M | $295.10M |
| Other Non-Current Assets | $66.40M | $-362.20M | $61.60M | $56.40M | $92.30M |
| Total Non-Current Assets | $4.68B | $4.78B | $4.90B | $5.03B | $5.73B |
| Other Assets | $- | $- | $- | $- | $- |
| Total Assets | $5.35B | $5.33B | $5.47B | $5.58B | $6.44B |
| Account Payables | $212.10M | $213.50M | $218.90M | $181.20M | $220.10M |
| Short Term Debt | $122.70M | $116.40M | $107.00M | $263.40M | $199.80M |
| Tax Payables | $37.10M | $30.20M | $37.70M | $51.20M | $50.70M |
| Deferred Revenue | $72.60M | $427.00M | $359.60M | $289.40M | $296.60M |
| Other Current Liabilities | $273.50M | $261.80M | $368.10M | $201.30M | $286.30M |
| Total Current Liabilities | $718.00M | $621.90M | $731.70M | $697.10M | $756.90M |
| Long Term Debt | $1.66B | $1.81B | $1.87B | $1.96B | $2.92B |
| Deferred Revenue Non-Current | $1 | $- | $19.10M | $22.70M | $70.70M |
| Deferred Tax Liabilities Non-Current | $420.50M | $427.00M | $411.00M | $380.40M | $295.10M |
| Other Non-Current Liabilities | $34.50M | $47.70M | $58.00M | $106.70M | $134.90M |
| Total Non-Current Liabilities | $2.11B | $2.29B | $2.34B | $2.45B | $3.35B |
| Other Liabilities | $- | $- | $- | $- | $- |
| Total Liabilities | $2.83B | $2.91B | $3.07B | $3.15B | $4.10B |
| Preferred Stock | $- | $- | $- | $- | $- |
| Common Stock | $900.00K | $900.00K | $900.00K | $900.00K | $900.00K |
| Retained Earnings | $1.39B | $1.41B | $1.35B | $1.38B | $1.44B |
| Accumulated Other Comprehensive Income Loss | $-184.50M | $-276.90M | $-218.80M | $-187.40M | $-318.10M |
| Other Total Stockholders Equity | $1.32B | $1.29B | $1.26B | $1.23B | $1.21B |
| Total Stockholders Equity | $2.52B | $2.42B | $2.40B | $2.43B | $2.33B |
| Total Equity | $2.52B | $2.42B | $2.40B | $2.43B | $2.33B |
| Total Liabilities and Stockholders Equity | $5.35B | $5.33B | $5.47B | $5.58B | $6.44B |
| Minority Interest | $400.00K | $4.30M | $4.10M | $4.30M | $3.80M |
| Total Liabilities and Total Equity | $5.35B | $5.33B | $5.47B | $5.58B | $6.44B |
| Total Investments | $-420.50M | $- | $-411.00M | $-380.40M | $-295.10M |
| Total Debt | $1.78B | $1.93B | $1.98B | $2.17B | $3.12B |
| Net Debt | $1.75B | $1.87B | $1.92B | $2.11B | $3.08B |
Balance Sheet Charts
| Breakdown | September 30, 2024 | June 30, 2024 | March 31, 2024 | December 31, 2023 | September 30, 2023 | June 30, 2023 | March 31, 2023 | December 31, 2022 | September 30, 2022 | June 30, 2022 | March 31, 2022 | December 31, 2021 | September 30, 2021 | June 30, 2021 | March 31, 2021 | December 31, 2020 | September 30, 2020 | June 30, 2020 | March 31, 2020 | December 31, 2019 |
|---|---|---|---|---|---|---|---|---|---|---|---|---|---|---|---|---|---|---|---|---|
| Cash and Cash Equivalents | $34.30M | $34.90M | $31.00M | $35.30M | $29.70M | $30.70M | $60.00M | $56.00M | $44.00M | $45.90M | $59.60M | $55.60M | $37.50M | $61.70M | $50.00M | $53.30M | $59.40M | $42.00M | $36.00M | $34.70M |
| Short Term Investments | $- | $- | $- | $- | $- | $- | $- | $- | $- | $- | $- | $- | $- | $- | $- | $- | $- | $- | $- | $- |
| Cash and Short Term Investments | $34.30M | $34.90M | $31.00M | $35.30M | $29.70M | $30.70M | $60.00M | $56.00M | $44.00M | $45.90M | $59.60M | $55.60M | $37.50M | $61.70M | $50.00M | $53.30M | $59.40M | $42.00M | $36.00M | $34.70M |
| Net Receivables | $605.00M | $657.10M | $616.40M | $553.90M | $465.60M | $410.30M | $419.50M | $414.50M | $463.40M | $466.20M | $457.20M | $420.40M | $425.70M | $402.70M | $388.30M | $380.70M | $384.90M | $376.10M | $418.00M | $544.30M |
| Inventory | $- | $- | $1 | $- | $39.90M | $33.50M | $34.70M | $33.20M | $39.40M | $35.40M | $42.90M | $45.60M | $58.50M | $32.20M | $48.30M | $63.00M | $68.70M | $120.00M | $702.60M | $60.70M |
| Other Current Assets | $198.40M | $79.10M | $81.40M | $82.30M | $91.90M | $86.20M | $84.20M | $88.20M | $90.30M | $84.80M | $96.70M | $99.50M | $107.00M | $84.00M | $98.90M | $118.50M | $121.40M | $174.50M | $749.20M | $127.60M |
| Total Current Assets | $837.70M | $754.50M | $712.40M | $655.40M | $587.20M | $527.20M | $563.70M | $558.70M | $597.70M | $596.90M | $613.50M | $575.50M | $570.20M | $548.40M | $537.20M | $552.50M | $565.70M | $592.60M | $1.20B | $706.60M |
| Property Plant Equipment Net | $1.26B | $1.25B | $1.22B | $1.17B | $1.15B | $1.12B | $1.13B | $1.11B | $1.09B | $1.08B | $1.06B | $1.06B | $1.06B | $1.07B | $1.08B | $1.07B | $1.07B | $1.08B | $1.11B | $1.23B |
| Goodwill | $2.73B | $2.76B | $2.76B | $2.76B | $2.74B | $2.75B | $2.79B | $2.78B | $2.75B | $2.78B | $2.81B | $2.82B | $2.80B | $2.81B | $2.81B | $2.82B | $2.80B | $2.79B | $2.78B | $2.98B |
| Intangible Assets | $584.10M | $633.10M | $661.30M | $686.50M | $708.00M | $743.80M | $784.80M | $811.10M | $839.60M | $887.40M | $932.90M | $964.50M | $986.10M | $1.03B | $1.05B | $1.09B | $1.12B | $1.16B | $1.19B | $1.42B |
| Goodwill and Intangible Assets | $3.32B | $3.39B | $3.42B | $3.44B | $3.45B | $3.50B | $3.57B | $3.60B | $3.59B | $3.67B | $3.74B | $3.78B | $3.79B | $3.84B | $3.87B | $3.91B | $3.92B | $3.95B | $3.97B | $4.40B |
| Long Term Investments | $- | $-412.70M | $-417.00M | $-420.50M | $-426.10M | $-429.00M | $- | $- | $- | $-412.90M | $-410.40M | $- | $-389.00M | $-369.90M | $-375.90M | $- | $-311.20M | $-318.00M | $-334.70M | $- |
| Tax Assets | $- | $412.70M | $417.00M | $420.50M | $426.10M | $429.00M | $431.80M | $- | $417.20M | $412.90M | $410.40M | $- | $389.00M | $369.90M | $375.90M | $- | $311.20M | $318.00M | $334.70M | $- |
| Other Non-Current Assets | $67.90M | $84.30M | $84.20M | $82.50M | $66.90M | $66.60M | $-363.80M | $64.80M | $-353.30M | $62.50M | $62.30M | $61.60M | $54.60M | $53.60M | $53.00M | $56.40M | $68.70M | $64.70M | $66.50M | $92.30M |
| Total Non-Current Assets | $4.65B | $4.72B | $4.72B | $4.70B | $4.66B | $4.69B | $4.77B | $4.78B | $4.74B | $4.81B | $4.86B | $4.90B | $4.90B | $4.97B | $4.99B | $5.03B | $5.07B | $5.09B | $5.15B | $5.73B |
| Other Assets | $- | $- | $- | $- | $- | $- | $- | $- | $- | $- | $- | $- | $- | $- | $- | $- | $- | $- | $- | $- |
| Total Assets | $5.48B | $5.48B | $5.44B | $5.35B | $5.25B | $5.21B | $5.33B | $5.33B | $5.34B | $5.41B | $5.48B | $5.47B | $5.47B | $5.52B | $5.53B | $5.58B | $5.63B | $5.69B | $6.35B | $6.44B |
| Account Payables | $186.00M | $200.20M | $198.30M | $212.10M | $202.50M | $207.00M | $195.30M | $213.50M | $200.40M | $207.10M | $210.90M | $218.90M | $211.20M | $176.90M | $195.10M | $181.20M | $156.10M | $149.60M | $203.60M | $220.10M |
| Short Term Debt | $130.20M | $128.50M | $235.50M | $126.00M | $220.00M | $214.80M | $114.00M | $116.40M | $107.20M | $102.90M | $102.90M | $107.00M | $108.70M | $184.20M | $180.30M | $177.20M | $206.40M | $281.20M | $186.20M | $199.80M |
| Tax Payables | $- | $- | $- | $37.10M | $9.40M | $9.30M | $11.40M | $30.20M | $- | $- | $- | $37.70M | $- | $- | $- | $51.20M | $- | $- | $- | $50.70M |
| Deferred Revenue | $80.40M | $79.70M | $70.10M | $72.60M | $65.10M | $9.30M | $- | $427.00M | $417.20M | $256.20M | $- | $411.00M | $319.40M | $269.70M | $245.20M | $380.00M | $271.40M | $263.30M | $242.40M | $295.10M |
| Other Current Liabilities | $301.90M | $272.70M | $151.00M | $270.20M | $153.40M | $188.00M | $259.80M | $261.80M | $279.20M | $308.60M | $355.70M | $368.10M | $367.30M | $315.60M | $298.60M | $287.50M | $324.40M | $229.50M | $428.70M | $286.30M |
| Total Current Liabilities | $698.50M | $681.10M | $654.90M | $718.00M | $650.40M | $619.10M | $580.50M | $621.90M | $586.80M | $618.60M | $669.50M | $731.70M | $687.20M | $676.70M | $674.00M | $697.10M | $686.90M | $660.30M | $818.50M | $756.90M |
| Long Term Debt | $1.80B | $1.82B | $1.81B | $1.64B | $1.64B | $1.63B | $1.84B | $1.81B | $1.98B | $1.99B | $1.98B | $1.87B | $1.93B | $1.92B | $1.98B | $1.99B | $2.22B | $2.28B | $2.84B | $2.92B |
| Deferred Revenue Non-Current | $- | $424.70M | $407.80M | $391.90M | $9.40M | $9.30M | $- | $- | $- | $17.30M | $- | $19.10M | $18.60M | $19.70M | $18.10M | $22.70M | $45.70M | $45.00M | $45.90M | $70.70M |
| Deferred Tax Liabilities Non-Current | $- | $412.70M | $417.00M | $420.50M | $426.10M | $429.00M | $431.80M | $427.00M | $417.20M | $412.90M | $410.40M | $411.00M | $389.00M | $369.90M | $375.90M | $380.40M | $311.20M | $318.00M | $334.70M | $295.10M |
| Other Non-Current Liabilities | $431.60M | $33.50M | $34.30M | $47.50M | $52.70M | $52.70M | $29.50M | $47.70M | $27.20M | $34.50M | $35.00M | $58.00M | $40.70M | $55.90M | $52.60M | $81.90M | $78.50M | $128.50M | $81.40M | $134.90M |
| Total Non-Current Liabilities | $2.23B | $2.26B | $2.26B | $2.11B | $2.12B | $2.11B | $2.31B | $2.29B | $2.43B | $2.44B | $2.43B | $2.34B | $2.36B | $2.35B | $2.41B | $2.45B | $2.61B | $2.73B | $3.25B | $3.35B |
| Other Liabilities | $- | $- | $- | $1 | $- | $- | $- | $- | $- | $- | $- | $- | $- | $- | $- | $- | $- | $- | $- | $- |
| Total Liabilities | $2.93B | $2.94B | $2.91B | $2.83B | $2.77B | $2.73B | $2.89B | $2.91B | $3.01B | $3.05B | $3.10B | $3.07B | $3.05B | $3.02B | $3.08B | $3.15B | $3.29B | $3.39B | $4.07B | $4.10B |
| Preferred Stock | $- | $- | $- | $- | $- | $- | $- | $- | $- | $1 | $- | $- | $- | $- | $- | $400.00K | $- | $- | $200.00K | $100.00K |
| Common Stock | $900.00K | $900.00K | $900.00K | $900.00K | $900.00K | $900.00K | $900.00K | $900.00K | $900.00K | $900.00K | $900.00K | $900.00K | $900.00K | $900.00K | $900.00K | $900.00K | $900.00K | $900.00K | $900.00K | $900.00K |
| Retained Earnings | $1.39B | $1.41B | $1.40B | $1.39B | $1.37B | $1.37B | $1.42B | $1.41B | $1.38B | $1.35B | $1.34B | $1.35B | $1.37B | $1.44B | $1.41B | $1.38B | $1.33B | $1.42B | $1.42B | $1.44B |
| Accumulated Other Comprehensive Income Loss | $-170.90M | $-197.60M | $-196.00M | $-184.50M | $-211.80M | $-191.00M | $-266.70M | $-276.90M | $-338.30M | $-273.20M | $-227.40M | $-218.80M | $-208.00M | $-193.70M | $-200.30M | $-187.40M | $-229.60M | $-347.00M | $-357.20M | $-318.10M |
| Other Total Stockholders Equity | $1.33B | $1.32B | $1.32B | $1.32B | $1.31B | $1.30B | $1.29B | $1.29B | $1.28B | $1.27B | $1.26B | $1.26B | $1.25B | $1.24B | $1.24B | $1.23B | $1.23B | $1.22B | $1.21B | $1.21B |
| Total Stockholders Equity | $2.55B | $2.53B | $2.52B | $2.52B | $2.48B | $2.48B | $2.45B | $2.42B | $2.32B | $2.35B | $2.38B | $2.40B | $2.42B | $2.49B | $2.45B | $2.43B | $2.33B | $2.29B | $2.28B | $2.33B |
| Total Equity | $2.55B | $2.53B | $2.52B | $2.52B | $2.48B | $2.48B | $2.45B | $2.42B | $2.33B | $2.35B | $2.38B | $2.40B | $2.42B | $2.49B | $2.45B | $2.43B | $2.34B | $2.30B | $2.28B | $2.33B |
| Total Liabilities and Stockholders Equity | $5.48B | $5.48B | $5.44B | $5.35B | $5.25B | $5.21B | $5.33B | $5.33B | $5.34B | $5.41B | $5.48B | $5.47B | $5.47B | $5.52B | $5.53B | $5.58B | $5.63B | $5.69B | $6.35B | $6.44B |
| Minority Interest | $400.00K | $400.00K | $400.00K | $400.00K | $700.00K | $600.00K | $600.00K | $4.30M | $3.30M | $3.80M | $3.90M | $4.10M | $3.70M | $3.70M | $3.60M | $4.30M | $4.90M | $4.50M | $4.00M | $3.80M |
| Total Liabilities and Total Equity | $5.48B | $5.48B | $5.44B | $5.35B | $5.25B | $5.21B | $5.33B | $5.33B | $5.34B | $5.41B | $5.48B | $5.47B | $5.47B | $5.52B | $5.53B | $5.58B | $5.63B | $5.69B | $6.35B | $6.44B |
| Total Investments | $- | $-412.70M | $-417.00M | $-420.50M | $-426.10M | $-429.00M | $- | $- | $- | $-412.90M | $-410.40M | $- | $-389.00M | $-369.90M | $-375.90M | $- | $-311.20M | $-318.00M | $-334.70M | $- |
| Total Debt | $1.93B | $1.95B | $1.93B | $1.78B | $1.78B | $1.76B | $1.94B | $1.93B | $2.07B | $2.07B | $2.06B | $1.98B | $2.02B | $2.08B | $2.14B | $2.17B | $2.40B | $2.51B | $3.02B | $3.12B |
| Net Debt | $1.89B | $1.91B | $1.90B | $1.75B | $1.75B | $1.73B | $1.88B | $1.87B | $2.03B | $2.03B | $2.00B | $1.92B | $1.98B | $2.02B | $2.09B | $2.11B | $2.34B | $2.47B | $2.99B | $3.08B |
Annual Cash Flow
| Breakdown | December 31, 2023 | December 31, 2022 | December 31, 2021 | December 31, 2020 | December 31, 2019 |
|---|---|---|---|---|---|
| Net Income | $-21.40M | $56.50M | $-26.80M | $-55.90M | $-346.00M |
| Depreciation and Amortization | $216.50M | $232.50M | $223.90M | $233.50M | $272.80M |
| Deferred Income Tax | $-2.50M | $20.60M | $29.70M | $32.60M | $-33.90M |
| Stock Based Compensation | $33.40M | $25.10M | $27.10M | $25.50M | $17.10M |
| Change in Working Capital | $-56.60M | $-132.10M | $39.10M | $147.50M | $-50.40M |
| Accounts Receivables | $-146.80M | $-12.90M | $-57.20M | $27.40M | $24.50M |
| Inventory | $- | $- | $102.20M | $77.10M | $-51.80M |
| Accounts Payables | $4.90M | $-2.60M | $29.70M | $-5.50M | $-4.60M |
| Other Working Capital | $85.30M | $-116.60M | $-35.60M | $48.50M | $-18.50M |
| Other Non Cash Items | $73.90M | $-2.40M | $10.10M | $147.00M | $388.40M |
| Net Cash Provided by Operating Activities | $243.30M | $200.20M | $303.10M | $530.20M | $248.00M |
| Investments in Property Plant and Equipment | $-131.30M | $-132.20M | $-116.90M | $-119.50M | $-194.20M |
| Acquisitions Net | $84.60M | $46.70M | $24.50M | $498.90M | $86.40M |
| Purchases of Investments | $- | $- | $- | $- | $- |
| Sales Maturities of Investments | $- | $- | $- | $- | $- |
| Other Investing Activities | $2.90M | $900.00K | $2.30M | $2.00M | $3.80M |
| Net Cash Used for Investing Activities | $-43.80M | $-84.60M | $-90.10M | $381.40M | $-104.00M |
| Debt Repayment | $-213.70M | $-105.10M | $-201.60M | $-881.70M | $-140.40M |
| Common Stock Issued | $- | $- | $- | $-400.00K | $19.90M |
| Common Stock Repurchased | $-5.20M | $-5.60M | $-3.40M | $-400.00K | $- |
| Dividends Paid | $- | $- | $- | $- | $- |
| Other Financing Activities | $-1.50M | $-300.00K | $-2.90M | $-10.40M | $-21.10M |
| Net Cash Used Provided by Financing Activities | $-220.40M | $-110.70M | $-207.90M | $-892.50M | $-141.60M |
| Effect of Forex Changes on Cash | $200.00K | $-4.20M | $-2.80M | $-500.00K | $-2.00M |
| Net Change in Cash | $-20.70M | $400.00K | $2.30M | $18.60M | $400.00K |
| Cash at End of Period | $35.30M | $56.00M | $55.60M | $53.30M | $34.70M |
| Cash at Beginning of Period | $56.00M | $55.60M | $53.30M | $34.70M | $34.30M |
| Operating Cash Flow | $243.30M | $200.20M | $303.10M | $530.20M | $248.00M |
| Capital Expenditure | $-131.30M | $-132.20M | $-116.90M | $-119.50M | $-194.20M |
| Free Cash Flow | $112.00M | $68.00M | $186.20M | $410.70M | $53.80M |
Cash Flow Charts
| Breakdown | September 30, 2024 | June 30, 2024 | March 31, 2024 | December 31, 2023 | September 30, 2023 | June 30, 2023 | March 31, 2023 | December 31, 2022 | September 30, 2022 | June 30, 2022 | March 31, 2022 | December 31, 2021 | September 30, 2021 | June 30, 2021 | March 31, 2021 | December 31, 2020 | September 30, 2020 | June 30, 2020 | March 31, 2020 | December 31, 2019 |
|---|---|---|---|---|---|---|---|---|---|---|---|---|---|---|---|---|---|---|---|---|
| Net Income | $-13.70M | $6.00M | $13.10M | $14.90M | $2.10M | $-49.50M | $11.30M | $32.10M | $28.00M | $10.50M | $-14.10M | $-16.40M | $-65.90M | $29.30M | $26.20M | $49.00M | $-80.90M | $-4.10M | $-19.90M | $-219.20M |
| Depreciation and Amortization | $53.10M | $53.10M | $53.50M | $53.60M | $54.00M | $54.10M | $54.80M | $56.30M | $58.70M | $57.80M | $59.70M | $56.90M | $56.70M | $55.00M | $55.30M | $55.70M | $57.70M | $60.20M | $59.90M | $65.70M |
| Deferred Income Tax | $-6.50M | $-4.20M | $-2.70M | $-5.10M | $-2.30M | $200.00K | $4.70M | $8.60M | $6.80M | $4.50M | $700.00K | $18.20M | $20.30M | $-6.70M | $-2.10M | $36.30M | $-1.00M | $-2.30M | $-400.00K | $-52.60M |
| Stock Based Compensation | $7.70M | $4.90M | $2.70M | $5.20M | $10.40M | $10.90M | $6.90M | $5.00M | $7.50M | $7.80M | $4.80M | $8.30M | $6.60M | $7.10M | $5.10M | $5.20M | $7.40M | $7.80M | $5.10M | $3.40M |
| Change in Working Capital | $139.20M | $-15.80M | $-123.40M | $-19.90M | $-34.70M | $31.30M | $-33.30M | $63.60M | $-43.70M | $-61.20M | $-90.80M | $38.60M | $22.10M | $2.20M | $-23.80M | $53.60M | $71.30M | $47.50M | $-24.90M | $-3.70M |
| Accounts Receivables | $29.60M | $-41.00M | $-64.40M | $-83.70M | $-61.80M | $3.10M | $-4.40M | $47.40M | $-6.90M | $-16.10M | $-37.30M | $-4.90M | $-29.50M | $-12.40M | $-10.40M | $-5.50M | $-9.60M | $43.70M | $-1.20M | $18.20M |
| Inventory | $- | $- | $- | $1.10M | $-26.70M | $25.60M | $- | $- | $- | $- | $- | $52.30M | $30.00M | $39.70M | $-19.80M | $40.80M | $55.20M | $21.50M | $-40.40M | $7.00M |
| Accounts Payables | $-3.40M | $3.10M | $-12.50M | $8.10M | $-1.70M | $4.80M | $-6.30M | $6.80M | $3.10M | $-10.40M | $-2.10M | $2.90M | $34.00M | $-18.40M | $11.20M | $7.50M | $8.40M | $-30.70M | $9.30M | $-9.00M |
| Other Working Capital | $113.00M | $22.10M | $-46.50M | $55.70M | $55.50M | $-2.20M | $-22.60M | $9.40M | $-39.90M | $8.90M | $-51.40M | $-11.70M | $-12.40M | $-6.70M | $-4.80M | $10.80M | $17.30M | $13.00M | $7.40M | $-19.90M |
| Other Non Cash Items | $-112.90M | $149.00M | $188.90M | $1.30M | $8.90M | $58.40M | $5.10M | $-8.50M | $4.20M | $1.00M | $900.00K | $-4.70M | $12.60M | $300.00K | $1.90M | $-34.80M | $103.40M | $16.10M | $62.30M | $253.20M |
| Net Cash Provided by Operating Activities | $66.90M | $44.00M | $-54.50M | $50.00M | $38.40M | $105.40M | $49.50M | $157.10M | $61.50M | $20.40M | $-38.80M | $100.90M | $52.40M | $87.20M | $62.60M | $165.00M | $157.90M | $125.20M | $82.10M | $46.80M |
| Investments in Property Plant and Equipment | $-28.90M | $-36.30M | $-43.10M | $-29.10M | $-38.50M | $-27.30M | $-36.40M | $-26.20M | $-36.00M | $-32.50M | $-37.50M | $-31.10M | $-26.10M | $-35.00M | $-24.70M | $-24.80M | $-20.10M | $-35.00M | $-39.60M | $-33.00M |
| Acquisitions Net | $- | $300.00K | $-14.00M | $-84.60M | $-4.30M | $88.00M | $900.00K | $45.10M | $-200.00K | $1.60M | $- | $13.90M | $11.30M | $-700.00K | $-600.00K | $77.70M | $-6.50M | $427.70M | $- | $68.80M |
| Purchases of Investments | $- | $- | $- | $- | $- | $- | $- | $- | $- | $- | $- | $- | $- | $- | $- | $- | $- | $- | $- | $- |
| Sales Maturities of Investments | $- | $- | $- | $- | $- | $- | $- | $- | $- | $- | $- | $- | $- | $- | $- | $- | $- | $- | $- | $- |
| Other Investing Activities | $600.00K | $500.00K | $300.00K | $800.00K | $900.00K | $200.00K | $1.00M | $45.10M | $300.00K | $100.00K | $700.00K | $100.00K | $200.00K | $1.10M | $200.00K | $300.00K | $2.50M | $-300.00K | $-500.00K | $1.50M |
| Net Cash Used for Investing Activities | $-28.30M | $-35.50M | $-56.80M | $-28.30M | $-41.90M | $60.90M | $-34.50M | $18.90M | $-35.90M | $-30.80M | $-36.80M | $-17.10M | $-14.60M | $-33.90M | $-24.50M | $53.20M | $-24.10M | $392.40M | $-40.10M | $37.30M |
| Debt Repayment | $-40.50M | $-6.40M | $116.60M | $-15.20M | $2.70M | $-193.60M | $-5.20M | $-167.30M | $-22.30M | $-500.00K | $85.30M | $-64.10M | $-58.50M | $-42.00M | $-38.70M | $-214.30M | $-117.50M | $-511.50M | $-38.20M | $-103.00M |
| Common Stock Issued | $- | $- | $-6.40M | $- | $- | $- | $-4.90M | $- | $- | $- | $-5.20M | $- | $- | $- | $-5.10M | $- | $- | $- | $-1.20M | $3.70M |
| Common Stock Repurchased | $6.40M | $- | $-6.40M | $5.20M | $- | $-300.00K | $-4.90M | $-600.00K | $200.00K | $- | $-5.20M | $-300.00K | $500.00K | $1.50M | $-5.10M | $500.00K | $200.00K | $100.00K | $-1.20M | $- |
| Dividends Paid | $- | $- | $- | $- | $- | $- | $- | $- | $- | $- | $- | $- | $- | $- | $- | $- | $- | $- | $- | $- |
| Other Financing Activities | $- | $- | $-900.00K | $- | $- | $-2.40M | $-1.50M | $200.00K | $-200.00K | $100.00K | $-700.00K | $-300.00K | $-2.60M | $-2.00M | $3.70M | $-10.40M | $- | $- | $-200.00K | $17.70M |
| Net Cash Used Provided by Financing Activities | $-40.50M | $-6.40M | $109.30M | $-15.20M | $2.70M | $-196.30M | $-11.60M | $-167.60M | $-22.10M | $-400.00K | $79.40M | $-64.70M | $-60.60M | $-42.50M | $-40.10M | $-224.20M | $-117.30M | $-511.40M | $-39.60M | $-81.60M |
| Effect of Forex Changes on Cash | $1.30M | $1.80M | $-2.30M | $-900.00K | $-200.00K | $700.00K | $600.00K | $3.70M | $-5.20M | $-2.90M | $200.00K | $-1.00M | $-1.40M | $900.00K | $-1.30M | $-100.00K | $900.00K | $-200.00K | $-1.10M | $1.40M |
| Net Change in Cash | $-600.00K | $3.90M | $-4.30M | $5.60M | $-1.00M | $-29.30M | $4.00M | $12.00M | $-1.90M | $-13.70M | $4.00M | $18.10M | $-24.20M | $11.70M | $-3.30M | $-6.10M | $17.40M | $6.00M | $1.30M | $3.90M |
| Cash at End of Period | $34.30M | $34.90M | $31.00M | $35.30M | $29.70M | $30.70M | $60.00M | $56.00M | $44.00M | $45.90M | $59.60M | $55.60M | $37.50M | $61.70M | $50.00M | $53.30M | $59.40M | $42.00M | $36.00M | $34.70M |
| Cash at Beginning of Period | $34.90M | $31.00M | $35.30M | $29.70M | $30.70M | $60.00M | $56.00M | $44.00M | $45.90M | $59.60M | $55.60M | $37.50M | $61.70M | $50.00M | $53.30M | $59.40M | $42.00M | $36.00M | $34.70M | $30.80M |
| Operating Cash Flow | $66.90M | $44.00M | $-54.50M | $50.00M | $38.40M | $105.40M | $49.50M | $157.10M | $61.50M | $20.40M | $-38.80M | $100.90M | $52.40M | $87.20M | $62.60M | $165.00M | $157.90M | $125.20M | $82.10M | $46.80M |
| Capital Expenditure | $-28.90M | $-36.30M | $-43.10M | $-29.10M | $-38.50M | $-27.30M | $-36.40M | $-26.20M | $-36.00M | $-32.50M | $-37.50M | $-31.10M | $-26.10M | $-35.00M | $-24.70M | $-24.80M | $-20.10M | $-35.00M | $-39.60M | $-33.00M |
| Free Cash Flow | $38.00M | $7.70M | $-97.60M | $20.90M | $-100.00K | $78.10M | $13.10M | $130.90M | $25.50M | $-12.10M | $-76.30M | $69.80M | $26.30M | $52.20M | $37.90M | $140.20M | $137.80M | $90.20M | $42.50M | $13.80M |
Stericycle Dividends
Explore Stericycle's dividend history, including dividend yield, payout ratio, and historical payments.
Stericycle News
Read the latest news about Stericycle, including recent articles, headlines, and updates.
Waste Management: Good Growth Prospects And Attractively Valued
Waste Management, Inc. has strong growth prospects driven by pricing power, Stericycle acquisition, and investments in recycling and renewable natural gas projects. Margins are expected to improve due to favorable price/cost dynamics, cost optimization, automation, and cost synergies from the Stericycle acquisition. The stock is trading at a discount compared to historical averages and peers, making it an attractive Buy given its growth potential.
WM Completes Acquisition of Stericycle
HOUSTON--(BUSINESS WIRE)---- $WM--WM (NYSE: WM) today announced it completed its acquisition of Stericycle, Inc. (NASDAQ: SRCL). The previously announced purchase price of $62.00 per share in cash represents a total enterprise value of approximately $7.2 billion. Beginning on November 4, 2024, Stericycle stock will no longer be traded on the NASDAQ. “I am pleased to welcome the talented Stericycle team to WM,” said Jim Fish, president and chief executive officer, WM. “The completion of this acquisition.

WM Announces Further Extension of Private Exchange Offer and Consent Solicitation for any and all of Stericycle, Inc.'s $500 million Outstanding 3.875% Senior Notes Due 2029
HOUSTON--(BUSINESS WIRE)--Waste Management, Inc., a Delaware corporation (NYSE: WM) (“WM”), announced today that it has further extended the expiration date of its previously announced offer to exchange (the “Exchange Offer”) any and all of the $500 million aggregate principal amount outstanding of the 3.875% Senior Notes due 2029 (the “Stericycle Notes”) issued by Stericycle, Inc., a Delaware corporation (“Stericycle”), held by eligible holders, for a series of new notes to be issued by WM (th.

Stericycle Opens State-of-the-Art Regulated Medical Waste Incineration Facility in Nevada
The new 110,000-square foot facility will help meet growing demand for proper pharmaceutical and medical waste disposal BANNOCKBURN, Ill. , Oct. 25, 2024 /PRNewswire/ -- Today, Stericycle, Inc. (Nasdaq: SRCL), a leading provider of regulated medical waste management and secure information destruction solutions, unveiled its latest state-of-the-art Hospital, Medical and Infectious Waste Incinerator (HMIWI) facility located at the Tahoe Reno Industrial Center in McCarran, Nevada.

WM Announces Extension of Private Exchange Offer and Consent Solicitation for any and all of Stericycle, Inc.'s $500 million Outstanding 3.875% Senior Notes Due 2029
HOUSTON--(BUSINESS WIRE)--Waste Management, Inc., a Delaware corporation (NYSE: WM) (“WM”), announced today that it has extended the expiration date of its previously announced offer to exchange (the “Exchange Offer”) any and all of the $500 million aggregate principal amount outstanding of the 3.875% Senior Notes due 2029 (the “Stericycle Notes”) issued by Stericycle, Inc., a Delaware corporation (“Stericycle”), held by eligible holders, for a series of new notes to be issued by WM (the “WM No.

Stericycle Recognized by TIME and Statista as One of America's Best Midsize Companies
BANNOCKBURN, Ill. , Sept. 25, 2024 /PRNewswire/ -- Stericycle, Inc. (Nasdaq: SRCL), a leading provider of regulated medical waste management and secure information destruction solutions, announced today that it has been recognized by TIME and Statista as one of America's Best Midsize Companies of 2024.

WM Announces Private Exchange Offer and Consent Solicitation for any and all of Stericycle, Inc.'s $500 million Outstanding 3.875% Senior Notes Due 2029
HOUSTON--(BUSINESS WIRE)---- $WM--Waste Management, Inc., a Delaware corporation (NYSE: WM) (“WM”), announced today that it has commenced a private offer to exchange (the “Exchange Offer”) any and all of the $500 million aggregate principal amount outstanding of the 3.875% Senior Notes due 2029 (the “SRCL Notes”) issued by Stericycle, Inc., a Delaware corporation (“SRCL”), held by eligible holders, for a series of new notes to be issued by WM (the “WM Notes”). Eligible holders of SRCL Notes tendered by.

Stericycle and Arbor Day Foundation Celebrate Third Year of Partnership
Tree Planting Boosts Environmental Restoration and Preservation Efforts Across North America BANNOCKBURN, Ill. , Aug. 26, 2024 /PRNewswire/ -- Stericycle, Inc. (Nasdaq: SRCL), a leading provider of regulated medical waste management and secure information destruction solutions, is partnering with the Arbor Day Foundation for a third consecutive year to plant approximately 45,000 additional trees across the United States and Canada.

Stericycle Recognized by Newsweek as One of America's Greatest Workplaces and Greatest Workplaces for Mental Wellbeing in 2024
BANNOCKBURN, Ill. , Aug. 22, 2024 /PRNewswire/ -- Stericycle, Inc. (Nasdaq: SRCL), a leading provider of regulated medical waste management and secure information destruction solutions, announced today that it has been recognized by Newsweek and Plant-A Insights Group as one of America's Greatest Workplaces and one of America's Greatest Workplaces for Mental Wellbeing in the large-size company category for 2024.

3 Stocks to Buy From the Booming Waste Removal Services Industry
The rising importance of ESG goals, technological advancements and innovations in the WTE technology is likely to assist the Zacks Waste Removal Services industry to prosper. RSG, CLH and SRCL are likely to be the frontrunners in the industry.
SHAREHOLDER UPDATE: Halper Sadeh LLC Continues to Investigate HMST, SRCL
NEW YORK, NY / ACCESSWIRE / June 4, 2024 / Halper Sadeh LLC, an investor rights law firm, is investigating the following companies for potential violations of the federal securities laws and/or breaches of fiduciary duties to shareholders relating to: HomeStreet, Inc. (NASDAQ:HMST)'s sale to FirstSun Capital Bancorp. Under the terms of the agreement, HomeStreet shareholders will receive 0.3867 shares (revised from 0.4345 shares under the original merger agreement) of FirstSun common stock for each share of HomeStreet common stock.

STOCKHOLDER INVESTIGATION: The M&A Class Action Firm Announces An Investigation of Stericycle, Inc. - SRCL
NEW YORK , June 4, 2024 /PRNewswire/ -- Monteverde & Associates PC (the "M&A Class Action Firm"), has recovered money for shareholders and is recognized as a Top 50 Firm in the 2018-2022 ISS Securities Class Action Services Report. We are headquartered at the Empire State Building in New York City and are investigating Stericycle, Inc. (Nasdaq: SRCL), relating to its proposed merger with Waste Management, Inc. Under the terms of the agreement, Waste Management, Inc. will acquire all the outstanding shares of Stericycle common stock for $62.00 cash per share.

ALERT: Rowley Law PLLC is Investigating Proposed Acquisition of Stericycle
NEW YORK , June 3, 2024 /PRNewswire/ -- Rowley Law PLLC is investigating potential securities law violations by Stericycle (NASDAQ: SRCL) and its board of directors concerning the proposed acquisition of the company by Waste Management, Inc. (NYSE: WM). Stockholders will receive $62.00 for each share of Stericycle stock that they hold.

Shareholder Alert: Ademi LLP investigates whether Stericycle, Inc. has obtained a Fair Price for its Public Shareholders
MILWAUKEE , June 3, 2024 /PRNewswire/ -- Ademi LLP is investigating Stericycle (Nasdaq: SRCL) for possible breaches of fiduciary duty and other violations of law in its transaction with Waste Management. Click here to learn how to join the https://www.ademilaw.com/case/stericycle-inc or call Guri Ademi toll-free at 866-264-3995.

SRCL Investigation Alert: Halper Sadeh LLC Is Investigating Whether the Sale of Stericycle, Inc. Is Fair to Shareholders
NEW YORK--(BUSINESS WIRE)--Halper Sadeh LLC, an investor rights law firm, is investigating whether the sale of Stericycle, Inc. (NASDAQ: SRCL) to Waste Management, Inc. for $62.00 per share in cash is fair to Stericycle shareholders. Halper Sadeh encourages Stericycle shareholders to click here to learn more about their legal rights and options or contact Daniel Sadeh or Zachary Halper at (212) 763-0060 or sadeh@halpersadeh.com or zhalper@halpersadeh.com. The investigation concerns whether Ster.

Breaking News: Is Stericycle's $62 Per Share Sale Price a Fair Deal? Johnson Fistel, LLP Investigates Deal Terms
SAN DIEGO, June 03, 2024 (GLOBE NEWSWIRE) -- Johnson Fistel, LLP , a leading shareholder rights law firm, announced today that it has initiated an investigation into the board members of Stericycle (NASDAQ: SRCL) concerning potential breaches of fiduciary duties related to the proposed sale of the Company to Waste Management, Inc. (NYSE: WM).

SRCL Alert: Monsey Firm of Wohl & Fruchter Investigating Fairness of the Sale of Stericycle to Waste Management
MONSEY, N.Y., June 03, 2024 (GLOBE NEWSWIRE) -- The law firm of Wohl & Fruchter LLP is investigating the fairness of the price of $62.00 per share in cash for which Stericycle, Inc. (Nasdaq: SRCL) (“Stericycle”) has agreed to be sold to Waste Management, Inc. (“WMI”).

Waste Management to acquire Stericycle in $7.2 billion deal
Waste Management will acquire Stericycle in a $7.2 billion deal, the companies said Monday. WM will acquire all outstanding shares of Stericycle for $62 per share in cash, representing the deal's total value when including Stericycle's net debt of around $1.4 billion.
WM to Acquire Stericycle, a Leader in Medical Waste Services, for $7.2 Billion
HOUSTON & BANNOCKBURN, Ill.--(BUSINESS WIRE)---- $WM--Waste Management, Inc. (NYSE: WM) and Stericycle (NASDAQ: SRCL) announced today that they have entered into a definitive agreement under which WM will acquire all outstanding shares of Stericycle for $62.00 per share in cash, representing a total enterprise value of approximately $7.2 billion when including approximately $1.4 billion of Stericycle's net debt. The per share price represents a premium of 24% to Stericycle's 60-day volume weighted aver.

Waste Management nears $7B Stericycle acquisition: Time to buy Stericycle shares?
Stericycle Inc. (NASDAQ:SRCL) is in the spotlight as Waste Management Inc. (NYSE: WM) moves closer to acquiring the medical waste disposal company for $7 billion, including debt. This potential deal, reported by The Wall Street Journal on June 2nd, could be announced soon.
Stericycle: Watch Potential Revenue Recovery And Margin Improvement
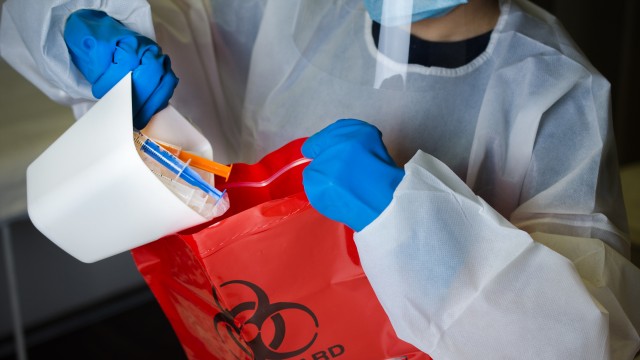
SRCL's Q1 2024 operating margins beat expectations, and the company's EBITDA margin is expected to improve significantly for full-year 2024. I anticipate that Stericycle's Secure Information Destruction segment can realize a turnaround due to a more favorable base for YoY comparison in 2H and the introduction of a subscription service. My Buy rating for SRCL stays intact following an assessment of its outlook and valuations.
Similar Companies
Related Metrics
Explore detailed financial metrics and analysis for SRCL.
