Surge Copper Key Executives
This section highlights Surge Copper's key executives, including their titles and compensation details.
Find Contacts at Surge Copper
(Showing 0 of )
Surge Copper Earnings
This section highlights Surge Copper's earnings, including key dates, EPS, earnings reports, and earnings call transcripts.
Next Earnings Date
Last Earnings Results
Earnings Call Transcripts
| Transcript | Quarter | Year | Date | Estimated EPS | Actual EPS |
|---|
Financial Statements
Access annual & quarterly financial statements for Surge Copper, including income statements, balance sheets, and cash flow statements..
Annual Income Statement
| Breakdown | March 31, 2024 | March 31, 2023 | March 31, 2022 | March 31, 2021 | March 31, 2020 |
|---|---|---|---|---|---|
| Revenue | $- | $- | $- | $- | $- |
| Cost of Revenue | $36.06K | $39.33K | $48.79K | $51.52K | $51.48K |
| Gross Profit | $-36.06K | $-39.33K | $-48.79K | $-51.52K | $-51.48K |
| Gross Profit Ratio | - | - | - | - | - |
| Research and Development Expenses | $- | $- | $- | $- | $- |
| General and Administrative Expenses | $2.42M | $2.99M | $3.31M | $4.86M | $117.18K |
| Selling and Marketing Expenses | $130.74K | $152.31K | $225.72K | $61.55K | $4.74K |
| Selling General and Administrative Expenses | $2.58M | $3.14M | $3.54M | $4.92M | $121.92K |
| Other Expenses | $- | $1.50M | $1.45M | $569.50K | $18.28K |
| Operating Expenses | $2.58M | $3.32M | $3.72M | $5.03M | $196.99K |
| Cost and Expenses | $2.58M | $3.35M | $3.77M | $5.08M | $248.47K |
| Interest Income | $41.78K | $13 | $8 | $3 | $1.49K |
| Interest Expense | $10.42K | $12.99K | $7.71K | $2.68K | $238 |
| Depreciation and Amortization | $8.94K | $39.33K | $48.79K | $51.52K | $51.48K |
| EBITDA | $-2.60M | $-3.20M | $-3.54M | $-4.96M | $-177.21K |
| EBITDA Ratio | - | - | - | - | - |
| Operating Income | $-2.58M | $-1.85M | $-2.32M | $-4.51M | $-228.70K |
| Operating Income Ratio | - | - | - | - | - |
| Total Other Income Expenses Net | $531.93K | $1.30M | $1.17M | $405.42K | $-65.91K |
| Income Before Tax | $-2.04M | $-1.87M | $-2.33M | $-4.51M | $-228.94K |
| Income Before Tax Ratio | - | - | - | - | - |
| Income Tax Expense | $309.00K | $246.00K | $2.56M | $1.29M | $-59.00K |
| Net Income | $-1.73M | $-2.11M | $-4.89M | $-5.80M | $-169.94K |
| Net Income Ratio | - | - | - | - | - |
| EPS | $-0.01 | $-0.01 | $-0.03 | $-0.06 | $0.00 |
| EPS Diluted | $-0.01 | $-0.01 | $-0.03 | $-0.06 | $0.00 |
| Weighted Average Shares Outstanding | 173.46M | 173.43M | 158.93M | 91.04M | 59.27M |
| Weighted Average Shares Outstanding Diluted | 202.10M | 173.43M | 158.93M | 91.04M | 59.27M |
| SEC Filing | Source | Source | Source | Source | Source |
| Breakdown | December 31, 2024 | September 30, 2024 | June 30, 2024 | March 31, 2024 | December 31, 2023 | September 30, 2023 | June 30, 2023 | March 31, 2023 | December 31, 2022 | September 30, 2022 | June 30, 2022 | March 31, 2022 | December 31, 2021 | September 30, 2021 | June 30, 2021 | March 31, 2021 | December 31, 2020 | September 30, 2020 | June 30, 2020 | March 31, 2020 |
|---|---|---|---|---|---|---|---|---|---|---|---|---|---|---|---|---|---|---|---|---|
| Revenue | $- | $- | $- | $- | $- | $- | $- | $- | $- | $- | $- | $- | $- | $- | $- | $- | $- | $- | $- | $- |
| Cost of Revenue | $8.23K | $8.23K | $8.23K | $9.01K | $9.02K | $9.02K | $9.02K | $8.42K | $10.30K | $10.31K | $10.30K | $7.53K | $13.94K | $14.19K | $13.13K | $13.82K | $12.57K | $12.57K | $12.57K | $12.87K |
| Gross Profit | $-8.23K | $-8.23K | $-8.23K | $-9.01K | $-9.02K | $-9.02K | $-9.02K | $-8.42K | $-10.30K | $-10.31K | $-10.30K | $-7.53K | $-13.94K | $-14.19K | $-13.13K | $-13.82K | $-12.57K | $-12.57K | $-12.57K | $-12.87K |
| Gross Profit Ratio | - | - | - | - | - | - | - | - | - | - | - | - | - | - | - | - | - | - | - | - |
| Research and Development Expenses | $- | $- | $- | $- | $- | $- | $- | $- | $- | $- | $- | $- | $- | $- | $- | $- | $- | $- | $- | $- |
| General and Administrative Expenses | $371.71K | $569.56K | $505.99K | $1.23M | $430.65K | $336.55K | $495.89K | $2.11M | $293.40K | $140.51K | $310.60K | $305.59K | $931.92K | $500.44K | $1.57M | $4.62M | $168.90K | $36.85K | $41.85K | $28.61K |
| Selling and Marketing Expenses | $23.65K | $35.40K | $98.09K | $57.03K | $40.14K | $29.74K | $46.39K | $42.38K | $32.54K | $21.59K | $40.94K | $17.68K | $84.34K | $40.79K | $82.92K | $48.24K | $13.31K | $- | $- | $83 |
| Selling General and Administrative Expenses | $395.36K | $604.95K | $604.08K | $884.44K | $648.08K | $366.29K | $542.28K | $2.15M | $325.94K | $162.10K | $351.54K | $323.27K | $1.02M | $541.23K | $1.66M | $4.62M | $182.21K | $36.85K | $41.85K | $28.69K |
| Other Expenses | $499.88K | $-613.19K | $- | $-160.62K | $73.19K | $469.61K | $241.65K | $95.26K | $214.17K | $935.62K | $271.08K | $370.89K | $218.52K | $660.90K | $199.43K | $563.50K | $3.00K | $3.00K | $- | $1.20K |
| Operating Expenses | $895.24K | $-8.23K | $626.22K | $884.44K | $648.08K | $558.79K | $571.40K | $2.23M | $356.24K | $348.27K | $379.08K | $370.08K | $1.07M | $576.36K | $1.71M | $4.69M | $237.56K | $51.85K | $53.03K | $52.36K |
| Cost and Expenses | $903.47K | $842.43K | $626.22K | $893.46K | $657.09K | $567.81K | $580.41K | $2.24M | $366.54K | $358.58K | $389.38K | $377.62K | $1.08M | $590.55K | $1.72M | $4.70M | $250.13K | $64.42K | $65.60K | $65.23K |
| Interest Income | $24.23K | $50.84K | $14.03K | $3.42K | $2.50K | $14.17K | $21.70K | $47 | $4.82K | $24.18K | $- | $- | $- | $- | $- | $- | $- | $- | $- | $- |
| Interest Expense | $1.84K | $1.84K | $1.84K | $1.86K | $2.85K | $2.85K | $2.85K | $3.25K | $9.74K | $- | $- | $858 | $6.85K | $- | $- | $827 | $827 | $1.02K | $- | $- |
| Depreciation and Amortization | $8.23K | $8.23K | $8.23K | $9.01K | $9.02K | $9.02K | $9.02K | $8.42K | $10.30K | $10.31K | $10.30K | $7.53K | $13.94K | $14.19K | $13.13K | $13.82K | $12.57K | $12.57K | $12.57K | $12.87K |
| EBITDA | $-864.41K | $280.84K | $-516.15K | $-884.45K | $-648.07K | $-75.02K | $-308.05K | $-2.18M | $-137.25K | $-329.09K | $-107.99K | $805 | $-852.41K | $-576.36K | $-1.71M | $-4.12M | $-234.56K | $-51.85K | $-53.03K | $-49.67K |
| EBITDA Ratio | - | - | - | - | - | - | - | - | - | - | - | - | - | - | - | - | - | - | - | - |
| Operating Income | $-903.47K | $- | $-626.22K | $-893.46K | $-657.09K | $-84.03K | $-317.07K | $-2.19M | $-147.55K | $601.22K | $-118.30K | $-6.73K | $-866.35K | $-590.55K | $-1.72M | $-4.14M | $-247.13K | $-64.42K | $-65.60K | $-62.54K |
| Operating Income Ratio | - | - | - | - | - | - | - | - | - | - | - | - | - | - | - | - | - | - | - | - |
| Total Other Income Expenses Net | $28.98K | $270.76K | $100.00K | $-159.06K | $72.84K | $480.92K | $230.07K | $-3.25K | $209.25K | $959.80K | $271.08K | $370.03K | $211.67K | $660.90K | $199.43K | $562.68K | $-827 | $3.00K | $- | $-16.10K |
| Income Before Tax | $-874.49K | $270.76K | $-526.23K | $-1.05M | $-584.26K | $-86.89K | $-319.92K | $-2.19M | $-157.29K | $601.22K | $-118.30K | $-7.58K | $-873.20K | $70.35K | $-1.52M | $-4.14M | $-247.96K | $-61.42K | $-65.60K | $-58.98K |
| Income Before Tax Ratio | - | - | - | - | - | - | - | - | - | - | - | - | - | - | - | - | - | - | - | - |
| Income Tax Expense | $- | $- | $- | $-309.00K | $4 | $472.46K | $244.50K | $246.00K | $223.91K | $935.62K | $271.08K | $2.56M | $225.36K | $- | $- | $1.29M | $3.83K | $- | $-1.24K | $-59.00K |
| Net Income | $-874.49K | $270.76K | $-526.23K | $-743.52K | $-584.26K | $-86.89K | $-319.92K | $-2.44M | $-157.29K | $601.22K | $-118.30K | $-2.57M | $-873.20K | $70.35K | $-1.52M | $-5.43M | $-247.96K | $-61.42K | $-65.60K | $16 |
| Net Income Ratio | - | - | - | - | - | - | - | - | - | - | - | - | - | - | - | - | - | - | - | - |
| EPS | $0.00 | $0.00 | $0.00 | $0.00 | $0.00 | $0.00 | $0.00 | $-0.01 | $0.00 | $0.00 | $0.00 | $-0.02 | $-0.01 | $0.00 | $-0.01 | $-0.04 | $0.00 | $0.00 | $0.00 | $0.00 |
| EPS Diluted | $0.00 | $0.00 | $0.00 | $0.00 | $0.00 | $0.00 | $0.00 | $-0.01 | $0.00 | $0.00 | $0.00 | $-0.02 | $-0.01 | $0.00 | $-0.01 | $-0.04 | $0.00 | $0.00 | $0.00 | $0.00 |
| Weighted Average Shares Outstanding | 246.34M | - | 246.34M | 224.45M | 197.38M | 195.90M | 195.14M | 194.55M | 169.76M | 169.50M | 168.43M | 166.72M | 165.87M | 163.07M | 140.43M | 130.74M | 106.79M | 64.20M | 60.80M | 59.27M |
| Weighted Average Shares Outstanding Diluted | 246.34M | - | 246.34M | 224.45M | 197.38M | 195.90M | 195.14M | 194.55M | 169.76M | 169.50M | 168.43M | 166.72M | 165.87M | 163.07M | 140.43M | 130.74M | 106.79M | 64.20M | 60.80M | 59.27M |
| SEC Filing | Source | Source | Source | Source | Source | Source | Source | Source | Source | Source | Source | Source | Source | Source | Source | Source | Source | Source | Source | Source |
Annual Balance Sheet
| Breakdown | March 31, 2024 | March 31, 2023 | March 31, 2022 | March 31, 2021 | March 31, 2020 |
|---|---|---|---|---|---|
| Cash and Cash Equivalents | $84.66K | $2.82M | $7.82M | $3.27M | $35.05K |
| Short Term Investments | $- | $- | $- | $- | $- |
| Cash and Short Term Investments | $84.66K | $2.82M | $7.82M | $3.27M | $35.05K |
| Net Receivables | $- | $- | $- | $- | $1.73K |
| Inventory | $- | $- | $- | $- | $- |
| Other Current Assets | $106.19K | $107.75K | $85.12K | $135.18K | $18.58K |
| Total Current Assets | $190.85K | $2.97M | $8.25M | $3.55M | $55.35K |
| Property Plant Equipment Net | $51.15M | $47.38M | $39.03M | $30.36M | $22.02M |
| Goodwill | $- | $- | $- | $- | $- |
| Intangible Assets | $- | $- | $- | $- | $- |
| Goodwill and Intangible Assets | $- | $- | $- | $- | $- |
| Long Term Investments | $- | $- | $- | $- | $- |
| Tax Assets | $- | $- | $- | $- | $- |
| Other Non-Current Assets | $- | $- | $- | $- | $- |
| Total Non-Current Assets | $51.15M | $47.38M | $39.03M | $30.36M | $22.02M |
| Other Assets | $- | $- | $- | $- | $- |
| Total Assets | $51.34M | $50.35M | $47.28M | $33.91M | $22.07M |
| Account Payables | $208.80K | $71.70K | $140.18K | $114.80K | $13.84K |
| Short Term Debt | $28.73K | $24.67K | $21.08K | $25.22K | $48.58K |
| Tax Payables | $- | $- | $- | $- | $- |
| Deferred Revenue | $- | $241.92K | $29.55K | $14.60K | $- |
| Other Current Liabilities | $613.02K | $1.15M | $1.41M | $291.12K | $19.76K |
| Total Current Liabilities | $850.55K | $1.25M | $1.57M | $431.14K | $82.17K |
| Long Term Debt | $51.63K | $80.37K | $105.03K | $- | $25.22K |
| Deferred Revenue Non-Current | $- | $-4.32K | $-4.07K | $- | $-223 |
| Deferred Tax Liabilities Non-Current | $4.01M | $4.32M | $4.07M | $1.51M | $223.00K |
| Other Non-Current Liabilities | $- | $- | $- | $- | $- |
| Total Non-Current Liabilities | $4.06M | $4.40M | $4.18M | $1.51M | $248.22K |
| Other Liabilities | $- | $- | $- | $0 | $- |
| Total Liabilities | $4.91M | $5.65M | $5.75M | $1.95M | $330.39K |
| Preferred Stock | $- | $- | $- | $- | $- |
| Common Stock | $66.47M | $63.85M | $60.13M | $48.15M | $35.65M |
| Retained Earnings | $-33.10M | $-31.36M | $-29.25M | $-24.36M | $-18.56M |
| Accumulated Other Comprehensive Income Loss | $- | $- | $- | $- | $-0 |
| Other Total Stockholders Equity | $13.06M | $12.21M | $10.65M | $8.17M | $4.65M |
| Total Stockholders Equity | $46.43M | $44.70M | $41.53M | $31.96M | $21.74M |
| Total Equity | $46.43M | $44.70M | $41.53M | $31.96M | $21.74M |
| Total Liabilities and Stockholders Equity | $51.34M | $50.35M | $47.28M | $33.91M | $22.07M |
| Minority Interest | $- | $- | $- | $- | $- |
| Total Liabilities and Total Equity | $51.34M | $50.35M | $47.28M | $33.91M | $22.07M |
| Total Investments | $- | $- | $- | $- | $- |
| Total Debt | $80.37K | $105.03K | $126.11K | $25.22K | $73.80K |
| Net Debt | $-4.29K | $-2.72M | $-7.70M | $-3.25M | $38.75K |
Balance Sheet Charts
| Breakdown | December 31, 2024 | September 30, 2024 | June 30, 2024 | March 31, 2024 | December 31, 2023 | September 30, 2023 | June 30, 2023 | March 31, 2023 | December 31, 2022 | September 30, 2022 | June 30, 2022 | March 31, 2022 | December 31, 2021 | September 30, 2021 | June 30, 2021 | March 31, 2021 | December 31, 2020 | September 30, 2020 | June 30, 2020 | March 31, 2020 |
|---|---|---|---|---|---|---|---|---|---|---|---|---|---|---|---|---|---|---|---|---|
| Cash and Cash Equivalents | $2.57M | $3.68M | $6.62M | $84.66K | $280.77K | $781.79K | $2.40M | $2.82M | $76.79K | $2.15M | $7.22M | $7.82M | $8.59M | $10.99M | $14.94M | $3.27M | $6.18M | $128.04K | $218.63K | $35.05K |
| Short Term Investments | $- | $- | $- | $- | $- | $- | $- | $- | $- | $- | $- | $- | $- | $- | $- | $- | $- | $- | $- | $- |
| Cash and Short Term Investments | $2.57M | $3.68M | $6.62M | $84.66K | $280.77K | $781.79K | $2.40M | $2.82M | $76.79K | $2.15M | $7.22M | $7.82M | $8.59M | $10.99M | $14.94M | $3.27M | $6.18M | $128.04K | $218.63K | $35.05K |
| Net Receivables | $209.11K | $173.67K | $62.82K | $- | $- | $- | $- | $- | $- | $- | $- | $- | $285.46K | $220.45K | $- | $- | $- | $- | $5.97K | $1.73K |
| Inventory | $- | $- | $- | $- | $- | $- | $- | $- | $- | $- | $- | $- | $- | $- | $- | $- | $-96.97K | $-14.90K | $-5.97K | $-1.73K |
| Other Current Assets | $71.78K | $122.58K | $202.94K | $88.05K | $100.34K | $81.77K | $110.53K | $107.75K | $115.89K | $174.02K | $249.11K | $85.12K | $83.75K | $100.50K | $316.02K | $135.18K | $368.03K | $14.83K | $91.70K | $18.58K |
| Total Current Assets | $2.85M | $3.97M | $6.89M | $190.85K | $479.85K | $942.87K | $2.54M | $2.97M | $282.35K | $2.59M | $7.54M | $8.25M | $8.96M | $11.31M | $15.46M | $3.55M | $6.65M | $157.76K | $316.30K | $55.35K |
| Property Plant Equipment Net | $54.52M | $54.01M | $51.16M | $92.52K | $101.53K | $49.13M | $47.97M | $47.38M | $46.76M | $44.98M | $40.44M | $39.03M | $38.61M | $36.87M | $32.12M | $30.36M | $27.96M | $22.31M | $22.12M | $22.02M |
| Goodwill | $- | $- | $- | $- | $- | $- | $- | $- | $- | $- | $- | $- | $- | $- | $- | $- | $- | $- | $- | $- |
| Intangible Assets | $- | $- | $- | $- | $- | $- | $- | $- | $- | $- | $- | $- | $- | $- | $- | $- | $- | $- | $- | $- |
| Goodwill and Intangible Assets | $- | $- | $- | $- | $- | $- | $- | $- | $- | $- | $- | $- | $- | $- | $- | $- | $- | $- | $- | $- |
| Long Term Investments | $- | $- | $- | $- | $- | $- | $- | $- | $- | $- | $- | $- | $- | $- | $- | $- | $- | $- | $- | $- |
| Tax Assets | $- | $- | $- | $- | $- | $- | $- | $- | $- | $- | $- | $- | $- | $- | $- | $- | $- | $- | $- | $- |
| Other Non-Current Assets | $- | $- | $- | $51.06M | $49.40M | $- | $- | $- | $- | $8 | $- | $- | $- | $- | $- | $- | $- | $- | $- | $- |
| Total Non-Current Assets | $54.52M | $54.01M | $51.16M | $51.15M | $49.51M | $49.13M | $47.97M | $47.38M | $46.76M | $44.98M | $40.44M | $39.03M | $38.61M | $36.87M | $32.12M | $30.36M | $27.96M | $22.31M | $22.12M | $22.02M |
| Other Assets | $- | $- | $1 | $- | $- | $- | $0 | $- | $- | $- | $- | $- | $- | $- | $- | $- | $- | $- | $- | $- |
| Total Assets | $57.38M | $57.98M | $58.05M | $51.34M | $49.99M | $50.07M | $50.51M | $50.35M | $47.05M | $47.57M | $47.98M | $47.28M | $47.57M | $48.19M | $47.58M | $33.91M | $34.61M | $22.47M | $22.43M | $22.07M |
| Account Payables | $233.65K | $350.37K | $201.33K | $208.80K | $146.62K | $106.14K | $273.76K | $71.70K | $155.30K | $599.29K | $792.21K | $140.18K | $174.01K | $832.74K | $425.02K | $114.80K | $366.33K | $18.59K | $102.51K | $13.84K |
| Short Term Debt | $28.73K | $28.73K | $28.73K | $28.73K | $24.67K | $24.67K | $24.67K | $24.67K | $10.54K | $15.81K | $15.81K | $21.08K | $32.55K | $- | $12.61K | $25.22K | $24.29K | $24.29K | $36.43K | $48.58K |
| Tax Payables | $- | $- | $- | $- | $- | $- | $- | $- | $- | $- | $- | $- | $- | $- | $- | $- | $- | $- | $- | $- |
| Deferred Revenue | $- | $- | $- | $-208.80K | $-146.62K | $23.33K | $262.94K | $241.92K | $- | $27.00K | $22.50K | $29.55K | $13.50K | $- | $46.75K | $14.60K | $- | $- | $46.16K | $- |
| Other Current Liabilities | $120.48K | $250.10K | $1.29M | $613.02K | $175.38K | $236.96K | $939.58K | $1.15M | $17.50K | $233.37K | $1.15M | $1.41M | $1.12M | $1.33M | $2.02M | $291.12K | $10.50K | $11.10K | $101.36K | $19.76K |
| Total Current Liabilities | $382.87K | $629.21K | $1.52M | $850.55K | $346.66K | $367.76K | $1.24M | $1.25M | $183.34K | $848.48K | $1.96M | $1.57M | $1.33M | $2.16M | $2.46M | $431.14K | $401.12K | $53.98K | $240.31K | $82.17K |
| Long Term Debt | $30.08K | $37.27K | $44.45K | $51.63K | $62.99K | $68.78K | $74.58K | $80.37K | $99.76K | $99.76K | $105.03K | $105.03K | $173.78K | $- | $- | $- | $13.07K | $25.22K | $25.22K | $25.22K |
| Deferred Revenue Non-Current | $- | $- | $- | $-51.63K | $-62.99K | $-4.32K | $-4.32K | $-4.32K | $-4.07K | $-4.07K | $-4.07K | $-4.07M | $-1.51M | $- | $- | $- | $-223.00K | $-223.00K | $-223.00K | $-223.00K |
| Deferred Tax Liabilities Non-Current | $4.01M | $4.01M | $- | $4.01M | $4.32M | $4.32M | $4.32M | $4.32M | $4.07M | $4.07M | $4.07M | $4.07M | $1.51M | $1.51M | $1.51M | $1.51M | $223.00K | $223.00K | $223.00K | $223.00K |
| Other Non-Current Liabilities | $- | $- | $4.01M | $- | $- | $- | $- | $- | $- | $- | $- | $- | $- | $- | $- | $- | $- | $- | $- | $- |
| Total Non-Current Liabilities | $4.04M | $4.05M | $4.06M | $4.06M | $4.38M | $4.39M | $4.39M | $4.40M | $4.17M | $4.17M | $4.18M | $4.18M | $1.69M | $1.51M | $1.51M | $1.51M | $236.07K | $248.22K | $248.22K | $248.22K |
| Other Liabilities | $- | $- | $- | $- | $- | $- | $- | $- | $- | $- | $- | $- | $- | $- | $- | $- | $- | $- | $- | $- |
| Total Liabilities | $4.42M | $4.68M | $5.58M | $4.91M | $4.73M | $4.76M | $5.63M | $5.65M | $4.36M | $5.02M | $6.14M | $5.75M | $3.02M | $3.67M | $3.97M | $1.95M | $637.19K | $302.19K | $488.53K | $330.39K |
| Preferred Stock | $- | $- | $- | $- | $- | $- | $- | $- | $- | $- | $- | $- | $- | $- | $- | $- | $- | $- | $- | $0 |
| Common Stock | $73.11M | $72.93M | $72.70M | $66.47M | $64.42M | $64.22M | $64.02M | $63.85M | $60.66M | $60.46M | $60.46M | $60.13M | $60.74M | $60.33M | $59.54M | $48.15M | $48.26M | $36.20M | $35.92M | $35.65M |
| Retained Earnings | $-34.23M | $-33.35M | $-33.62M | $-33.10M | $-32.35M | $-31.77M | $-31.68M | $-31.36M | $-28.92M | $-28.77M | $-29.37M | $-29.25M | $-26.68M | $-25.81M | $-25.88M | $-24.36M | $-18.93M | $-18.68M | $-18.62M | $-18.56M |
| Accumulated Other Comprehensive Income Loss | $- | $- | $- | $- | $-0 | $-0 | $-0 | $- | $- | $- | $-0 | $- | $-0 | $-0 | $- | $- | $0 | $- | $- | $-0 |
| Other Total Stockholders Equity | $14.07M | $13.73M | $13.39M | $13.06M | $13.18M | $12.86M | $12.54M | $12.21M | $10.96M | $10.85M | $10.75M | $10.65M | $10.50M | $9.99M | $9.95M | $8.17M | $4.65M | $4.65M | $4.65M | $4.65M |
| Total Stockholders Equity | $52.95M | $53.31M | $52.47M | $46.43M | $45.26M | $45.31M | $44.87M | $44.70M | $42.69M | $42.55M | $41.84M | $41.53M | $44.56M | $44.51M | $43.61M | $31.96M | $33.97M | $22.17M | $21.94M | $21.74M |
| Total Equity | $52.95M | $53.31M | $52.47M | $46.43M | $45.26M | $45.31M | $44.87M | $44.70M | $42.69M | $42.55M | $41.84M | $41.53M | $44.56M | $44.51M | $43.61M | $31.96M | $33.97M | $22.17M | $21.94M | $21.74M |
| Total Liabilities and Stockholders Equity | $57.38M | $57.98M | $58.05M | $51.34M | $49.99M | $50.07M | $50.51M | $50.35M | $47.05M | $47.57M | $47.98M | $47.28M | $47.57M | $48.19M | $47.58M | $33.91M | $34.61M | $22.47M | $22.43M | $22.07M |
| Minority Interest | $- | $- | $- | $- | $- | $- | $- | $- | $- | $- | $- | $- | $- | $- | $- | $- | $- | $- | $- | $- |
| Total Liabilities and Total Equity | $57.38M | $57.98M | $58.05M | $51.34M | $49.99M | $50.07M | $50.51M | $50.35M | $47.05M | $47.57M | $47.98M | $47.28M | $47.57M | $48.19M | $47.58M | $33.91M | $34.61M | $22.47M | $22.43M | $22.07M |
| Total Investments | $- | $- | $- | $- | $- | $- | $- | $- | $- | $- | $- | $- | $- | $- | $- | $- | $- | $- | $- | $- |
| Total Debt | $58.82K | $66.00K | $73.18K | $80.37K | $87.66K | $93.45K | $99.24K | $105.03K | $110.30K | $115.57K | $120.84K | $126.11K | $206.34K | $- | $12.61K | $25.22K | $37.36K | $49.51K | $61.65K | $73.80K |
| Net Debt | $-2.51M | $-3.61M | $-6.55M | $-4.29K | $-193.11K | $-688.34K | $-2.30M | $-2.72M | $33.51K | $-2.04M | $-7.10M | $-7.70M | $-8.39M | $-10.99M | $-14.93M | $-3.25M | $-6.15M | $-78.53K | $-156.98K | $38.75K |
Annual Cash Flow
| Breakdown | March 31, 2024 | March 31, 2023 | March 31, 2022 | March 31, 2021 | March 31, 2020 |
|---|---|---|---|---|---|
| Net Income | $-1.73M | $-2.11M | $-4.89M | $-5.80M | $-169.94K |
| Depreciation and Amortization | $36.06K | $39.33K | $48.79K | $51.52K | $51.48K |
| Deferred Income Tax | $-309.00K | $246.00K | $2.56M | $1.29M | $-59.00K |
| Stock Based Compensation | $1.30M | $1.88M | $2.29M | $3.68M | $- |
| Change in Working Capital | $41.21K | $481.18K | $-150.57K | $-137.26K | $134.08K |
| Accounts Receivables | $21.51K | $305.25K | $-207.44K | $-116.48K | $160.87K |
| Inventory | $- | $- | $- | $- | $- |
| Accounts Payables | $- | $- | $- | $- | $- |
| Other Working Capital | $19.70K | $175.93K | $56.87K | $-20.79K | $-26.79K |
| Other Non Cash Items | $-180.45K | $-1.41M | $-1.42M | $-555.88K | $-57.90K |
| Net Cash Provided by Operating Activities | $-849.75K | $-871.36K | $-1.56M | $-1.47M | $-43.38K |
| Investments in Property Plant and Equipment | $-9.49K | $-3.35K | $-38.14K | $-34.63K | $-7.59K |
| Acquisitions Net | $- | $- | $- | $- | $- |
| Purchases of Investments | $- | $-130.00K | $- | $- | $- |
| Sales Maturities of Investments | $- | $- | $- | $- | $- |
| Other Investing Activities | $-2.02M | $-8.11M | $-7.80M | $-4.36M | $-7.59K |
| Net Cash Used for Investing Activities | $-2.03M | $-8.25M | $-7.84M | $-4.39M | $-7.59K |
| Debt Repayment | $-24.67K | $-21.08K | $-34.72K | $-48.58K | $-45.28K |
| Common Stock Issued | $168.92K | $4.21M | $15.05M | $9.27M | $124.55K |
| Common Stock Repurchased | $- | $- | $- | $- | $- |
| Dividends Paid | $- | $- | $- | $- | $- |
| Other Financing Activities | $- | $-69.05K | $-1.07M | $-112.64K | $-1.35K |
| Net Cash Used Provided by Financing Activities | $144.25K | $4.12M | $13.95M | $9.11M | $77.92K |
| Effect of Forex Changes on Cash | $- | $- | $- | $- | $- |
| Net Change in Cash | $-2.74M | $-5.00M | $4.55M | $3.24M | $26.95K |
| Cash at End of Period | $84.66K | $2.82M | $7.82M | $3.27M | $35.05K |
| Cash at Beginning of Period | $2.82M | $7.82M | $3.27M | $35.05K | $8.09K |
| Operating Cash Flow | $-849.75K | $-871.36K | $-1.56M | $-1.47M | $-43.38K |
| Capital Expenditure | $-9.49K | $-3.35K | $-38.14K | $-34.63K | $-7.59K |
| Free Cash Flow | $-859.24K | $-874.71K | $-1.60M | $-1.51M | $-50.96K |
Cash Flow Charts
| Breakdown | December 31, 2024 | September 30, 2024 | June 30, 2024 | March 31, 2024 | December 31, 2023 | September 30, 2023 | June 30, 2023 | March 31, 2023 | December 31, 2022 | September 30, 2022 | June 30, 2022 | March 31, 2022 | December 31, 2021 | September 30, 2021 | June 30, 2021 | March 31, 2021 | December 31, 2020 | September 30, 2020 | June 30, 2020 | March 31, 2020 |
|---|---|---|---|---|---|---|---|---|---|---|---|---|---|---|---|---|---|---|---|---|
| Net Income | $-874.49K | $270.76K | $-526.23K | $-743.52K | $-584.26K | $-86.89K | $-319.92K | $-2.44M | $-157.29K | $601.22K | $-118.30K | $-2.57M | $-873.20K | $70.35K | $-1.52M | $-5.43M | $-247.96K | $-61.42K | $-65.60K | $16 |
| Depreciation and Amortization | $8.23K | $8.23K | $8.23K | $9.01K | $9.02K | $9.02K | $9.02K | $8.42K | $10.30K | $10.31K | $10.30K | $7.53K | $13.94K | $14.19K | $13.13K | $13.82K | $12.57K | $12.57K | $12.57K | $12.87K |
| Deferred Income Tax | $- | $- | $- | $-309.00K | $-362.42K | $- | $- | $246.00K | $- | $- | $- | $2.56M | $- | $- | $- | $1.29M | $- | $- | $- | $- |
| Stock Based Compensation | $338.62K | $337.66K | $333.90K | $324.15K | $324.96K | $324.15K | $323.75K | $1.58M | $102.23K | $101.12K | $100.01K | $220.42K | $515.52K | $209.74K | $1.34M | $3.68K | $- | $- | $- | $- |
| Change in Working Capital | $-55.70K | $129.35K | $-241.00K | $444.11K | $7.49K | $-228.29K | $223.29K | $269.47K | $-225.86K | $-320.33K | $757.90K | $-293.22K | $-496.15K | $555.03K | $83.77K | $627 | $-100.28K | $-118.39K | $25.57K | $124.66K |
| Accounts Receivables | $-35.45K | $-110.84K | $-44.69K | $80.61K | $-19.43K | $-48.46K | $8.79K | $50.03K | $174.76K | $-201.73K | $282.19K | $-59.44K | $-65.00K | $-17.84K | $-65.16K | $-21.23K | $- | $- | $- | $155 |
| Inventory | $- | $- | $- | $- | $- | $- | $- | $- | $- | $- | $- | $- | $- | $- | $- | $- | $- | $- | $- | $- |
| Accounts Payables | $- | $- | $- | $- | $- | $- | $- | $- | $- | $- | $- | $- | $- | $- | $- | $- | $- | $- | $- | $- |
| Other Working Capital | $-20.25K | $240.20K | $-196.31K | $363.50K | $26.92K | $-179.83K | $214.50K | $219.44K | $-400.63K | $-118.60K | $475.71K | $-52.66K | $-637.48K | $598.09K | $148.92K | $-14.57K | $-365 | $65 | $-73 | $37 |
| Other Non Cash Items | $- | $-1.06M | $-108.37K | $428.66K | $295.83K | $-463.01K | $-234.91K | $-29.99K | $-206.37K | $-920.44K | $-249.39K | $-364.29K | $-210.92K | $-655.03K | $-188.97K | $4.42M | $265 | $-183 | $99 | $-59.00K |
| Net Cash Provided by Operating Activities | $-583.34K | $-311.58K | $-533.45K | $-108.17K | $-309.39K | $-445.01K | $1.23K | $-366.78K | $-477.00K | $-528.11K | $500.53K | $-437.15K | $-1.05M | $194.28K | $-269.02K | $-998.08K | $-335.67K | $-167.24K | $-27.46K | $78.54K |
| Investments in Property Plant and Equipment | $-521.68K | $-2.86M | $-274.10K | $-80.66K | $-185.84K | $-1.17M | $-594.19K | $7.56M | $-1.60M | $-4.54M | $-1.30M | $7.54M | $-1.39M | $-4.77M | $-1.42M | $-2.41M | $-1.66M | $-207.37K | $-112.57K | $- |
| Acquisitions Net | $- | $- | $- | $- | $- | $- | $- | $- | $- | $- | $- | $- | $- | $- | $- | $- | $- | $- | $- | $- |
| Purchases of Investments | $- | $- | $- | $- | $- | $- | $- | $-130.00K | $- | $130.00K | $-130.00K | $- | $- | $- | $- | $- | $- | $- | $- | $- |
| Sales Maturities of Investments | $- | $- | $- | $- | $- | $- | $- | $- | $- | $- | $- | $- | $- | $- | $- | $- | $- | $- | $- | $- |
| Other Investing Activities | $- | $- | $255.86K | $- | $- | $- | $-594.19K | $-8.11M | $- | $-130.00K | $-130.00K | $-7.80M | $-214 | $- | $-1.42M | $-2.41M | $- | $- | $- | $- |
| Net Cash Used for Investing Activities | $-521.68K | $-2.86M | $-18.25K | $-80.66K | $-185.84K | $-1.17M | $-594.19K | $-679.52K | $-1.60M | $-4.54M | $-1.43M | $-257.04K | $-1.39M | $-4.77M | $-1.42M | $-2.41M | $-1.66M | $-207.37K | $-112.57K | $- |
| Debt Repayment | $- | $- | $- | $- | $- | $- | $- | $- | $- | $- | $- | $- | $- | $- | $- | $- | $- | $- | $- | $- |
| Common Stock Issued | $- | $237.35K | $7.09M | $- | $- | $- | $168.92K | $3.88M | $- | $- | $326.43K | $102.46K | $46.38K | $619.56K | $13.36M | $548.02K | $8.16M | $291.60K | $268.41K | $- |
| Common Stock Repurchased | $- | $- | $- | $- | $- | $- | $- | $- | $- | $- | $- | $- | $- | $- | $- | $- | $- | $- | $- | $- |
| Dividends Paid | $- | $- | $- | $- | $- | $- | $- | $- | $- | $- | $- | $- | $- | $- | $- | $- | $- | $- | $- | $- |
| Other Financing Activities | $- | $-12.17K | $- | $-24.67K | $- | $- | $- | $-90.12K | $- | $-5.27K | $- | $-179.70K | $- | $- | $- | $-48.58K | $-102.96K | $-7.58K | $55.20K | $-45.28K |
| Net Cash Used Provided by Financing Activities | $- | $225.18K | $7.09M | $-7.29K | $-5.79K | $-5.79K | $168.92K | $3.79M | $-5.27K | $-5.27K | $326.43K | $-77.24K | $46.38K | $619.56K | $13.36M | $499.45K | $8.05M | $284.02K | $323.61K | $-45.28K |
| Effect of Forex Changes on Cash | $- | $- | $- | $- | $- | $5.79K | $- | $- | $5.27K | $5.27K | $- | $- | $- | $- | $- | $- | $- | $- | $- | $- |
| Net Change in Cash | $-1.11M | $-2.95M | $6.54M | $-196.11K | $-501.02K | $-1.62M | $-424.05K | $2.75M | $-2.08M | $-5.07M | $-598.51K | $-771.43K | $-2.40M | $-3.95M | $11.67M | $-2.91M | $6.06M | $-90.59K | $183.58K | $33.26K |
| Cash at End of Period | $2.57M | $3.68M | $6.62M | $84.66K | $280.77K | $781.79K | $2.40M | $2.82M | $76.79K | $2.15M | $7.22M | $7.82M | $8.59M | $10.99M | $14.94M | $3.27M | $6.18M | $128.04K | $218.63K | $35.05K |
| Cash at Beginning of Period | $3.68M | $6.62M | $84.66K | $280.77K | $781.79K | $2.40M | $2.82M | $76.79K | $2.15M | $7.22M | $7.82M | $8.59M | $10.99M | $14.94M | $3.27M | $6.18M | $128.04K | $218.63K | $35.05K | $1.78K |
| Operating Cash Flow | $-583.34K | $-311.58K | $-533.45K | $-108.17K | $-309.39K | $-445.01K | $1.23K | $-366.78K | $-477.00K | $-528.11K | $500.53K | $-437.15K | $-1.05M | $194.28K | $-269.02K | $-998.08K | $-335.67K | $-167.24K | $-27.46K | $78.54K |
| Capital Expenditure | $-521.68K | $-2.86M | $-274.10K | $-80.66K | $-185.84K | $-1.17M | $-594.19K | $7.56M | $-1.60M | $-4.54M | $-1.30M | $7.54M | $-1.39M | $-4.77M | $-1.42M | $-2.41M | $-1.66M | $-207.37K | $-112.57K | $- |
| Free Cash Flow | $-1.11M | $-3.17M | $-800.37K | $-188.82K | $-495.23K | $-1.62M | $-592.96K | $7.20M | $-2.08M | $-5.07M | $-794.94K | $7.10M | $-2.44M | $-4.57M | $-1.69M | $-3.41M | $-2.00M | $-374.61K | $-140.03K | $78.54K |

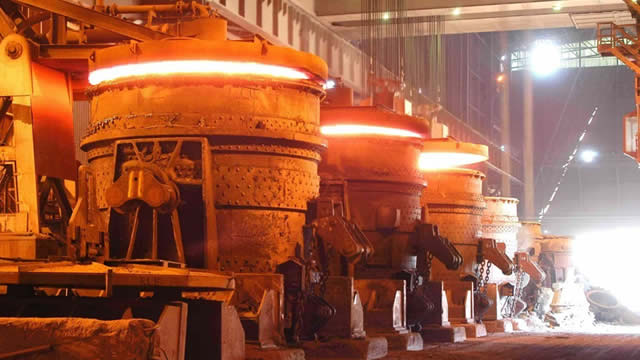
Surge Copper Corp. engages in the acquisition, exploration, and development of mineral properties in Canada. It explores for copper, gold, silver, and molybdenum deposits. The company holds a 100% interest in the Ootsa property that comprises 138 mineral claims covering 87,574.7 hectares located in central British Columbia; and the Berg Property located in British Columbia. It also owns 2% net smelter return royalty on the Auro and Auro South properties located in British Columbia. The company was formerly known as Gold Reach Resources Ltd. and changed its name to Surge Copper Corp. in February 2018. Surge Copper Corp. was incorporated in 1965 and is based in Vancouver, Canada.
$0.08
Stock Price
$22.61M
Market Cap
-
Employees
Vancouver, BC
Location
Revenue (FY 2024)
$-
0.0% YoY
Net Income (FY 2024)
$-1.73M
17.9% YoY
EPS (FY 2024)
$-0.01
29.5% YoY
Free Cash Flow (FY 2024)
$-859.24K
1.8% YoY
Profitability
Gross Margin
0.0%
Net Margin
0.0%
ROE
-3.7%
ROA
-3.4%
Valuation
P/E Ratio
-9.00
P/S Ratio
0.00
EV/EBITDA
-6.00
Market Cap
$22.61M
Revenue & Net Income
Profit Margins
Cash Flow Summary
Operating Cash Flow
$-849.75K
2.5% YoY
Free Cash Flow
$-859.24K
1.8% YoY
Balance Sheet Summary
Total Assets
$51.34M
2.0% YoY
Total Debt
$80.37K
23.5% YoY
Shareholder Equity
$46.43M
3.8% YoY
Dividend Overview
No Dividend Data
Surge Copper Corp. doesn't currently pay dividends.
Surge Copper Dividends
Explore Surge Copper's dividend history, including dividend yield, payout ratio, and historical payments.
Surge Copper News
Read the latest news about Surge Copper, including recent articles, headlines, and updates.
Surge Copper Evaluates Energy-Saving HPGR Technology for Berg Project
Vancouver, British Columbia, April 15, 2025 (GLOBE NEWSWIRE) -- Surge Copper Corp. (TSXV: SURG ) (OTCQB: SRGXF ) (Frankfurt: G6D2 ) (“Surge” or the “Company”) is pleased to highlight results from an industrial energy efficiency study investigating the potential benefits of incorporating high-pressure grinding rolls (“HPGR”) into the comminution circuit at its Berg Project in central British Columbia. The study, conducted by Ausenco Engineering Canada ULC with input and support provided by BC Hydro, evaluates the energy efficiency impacts of an HPGR-based circuit compared to a traditional semi-autogenous grinding (“SAG”) and ball milling configuration.

Surge Copper Announces Grant of Equity Incentive Awards and Completion of MacLean East Property Agreement
Vancouver, British Columbia, Feb. 28, 2025 (GLOBE NEWSWIRE) -- Surge Copper Corp. (TSXV: SURG ) (OTCQB: SRGXF ) (Frankfurt: G6D2 ) (“Surge” or the “Company”) announces the grant of equity-based incentive awards under its Share Compensation Plan. The Company has awarded 4,583,334 restricted share units (RSUs) to employees and executives, and 3,431,372 deferred share units (DSUs) to non-executive directors, both based on the 5-day volume weighted average price on the TSX Venture Exchange.

Surge Copper Secures Option to Acquire Key Tenements Adjacent to Berg Project
Acquisition secures all privately owned mineral tenements required for the development of the Berg Project Vancouver, British Columbia, Dec. 13, 2024 (GLOBE NEWSWIRE) -- Surge Copper Corp. (TSXV: SURG ) (OTCQB: SRGXF ) (Frankfurt: G6D2 ) (“Surge” or the “Company”) is pleased to announce that it has entered into a definitive option agreement (the “Option Agreement”) with Raye Resources Inc. and other private counterparties (collectively, the “Vendors”) to acquire a 100% interest in certain mineral claims (the “MacLean East Property”) contiguous with the Berg property. Figure 1. Berg-Huckleberry-Oosta district map.

Surge Copper Intersects 412 metres grading 0.40% CuEq including ?54 metres grading 0.53% CuEq at the Berg Deposit
Vancouver, British Columbia, Oct. 24, 2024 (GLOBE NEWSWIRE) -- Surge Copper Corp. (TSXV: SURG ) (OTCQB: SRGXF ) (Frankfurt: G6D2 ) (“Surge” or the “Company”) is pleased to announce assay results from drill holes BRG24-253 and 254, two of the ten holes completed during the 2024 field program at its 100%-owned Berg project located in central British Columbia. Both holes were collared from the same location and were targeted to infill the western portion of the deposit to support resource definition. An interactive 3D model including these results can be viewed here:

Surge Copper Completes 2024 Field Program and Provides Corporate Update
Vancouver, British Columbia, Sept. 26, 2024 (GLOBE NEWSWIRE) -- Surge Copper Corp. (TSXV: SURG ) (OTCQB: SRGXF ) (Frankfurt: G6D2 ) (“Surge” or the “Company”) is pleased to announce the successful completion of its 2024 field program at its 100%-owned Berg and Ootsa copper-molybdenum-precious metals projects located in central British Columbia. Field crews have now been demobilized, and with the conclusion of physical operations, the Company is ramping down associated expenditures as it transitions into the data analysis and reporting phase.

Surge Copper Commences 2024 Field Program and Closes Top-Up Subscription by ARM
Vancouver, British Columbia, July 19, 2024 (GLOBE NEWSWIRE) -- Surge Copper Corp. (TSXV: SURG ) (OTCQB: SRGXF ) (Frankfurt: G6D2 ) (“Surge” or the “Company”) is pleased to announce the commencement of field operations for its 2024 work program at its 100%-owned Berg copper-molybdenum-precious metals project located in central British Columbia. Additionally, the Company announces that African Rainbow Minerals Limited (“ARM”) has exercised in full its rights in respect of the Company's recently completed private placement (see April 2, 2024 press release and June 21, 2024 press release ), and has subscribed for a total of 1,582,353 common shares of the Company at a price of $0.15 per common share for gross proceeds of approximately $237,353 (the “Top-Up Offering”).

Surge Copper Announces Renewal of Communications and Engagement Agreement with the Office of the Wet'suwet'en and Thin House of the Gilseyhu Clan
Vancouver, British Columbia, July 09, 2024 (GLOBE NEWSWIRE) -- Surge Copper Corp. (TSXV: SURG ) (OTCQB: SRGXF ) (Frankfurt: G6D2 ) (“Surge” or the “Company”) is pleased to announce that it has signed a renewed Communications and Engagement Agreement (“CEA”) with the Office of the Wet'suwet'en (“OW”) and Thin House of the Gilseyhu Clan of the Wet'suwet'en Nation. The agreement updates the longstanding collaboration that Surge and OW have maintained in good standing prior to the renewal.

Surge Copper Announces Closing of Private Placement for $2.2M
Vancouver, British Columbia, June 21, 2024 (GLOBE NEWSWIRE) -- Surge Copper Corp. (TSXV: SURG ) (OTCQB: SRGXF ) (Frankfurt: G6D2 ) (“Surge” or the “Company”) announces that it has closed its non-brokered private placement previously announced on June 6 and June 7, 2024, consisting of 8,966,668 special flow-through common shares (the “CFT Shares”) at a price of $0.245 per CFT Share, for gross proceeds of approximately $2.2 million (the “Offering”).

Surge Copper Announces Upsize of Private Placement to $2.2M
Vancouver, British Columbia, June 07, 2024 (GLOBE NEWSWIRE) -- Surge Copper Corp. (TSXV: SURG ) (OTCQB: SRGXF ) (Frankfurt: G6D2 ) (“Surge” or the “Company”) announces an upsize to its previously announced non-brokered private placement of charity flow-through common shares, announced June 6, 2024, from approximately $1.6 million to approximately $2.2 million (the “Offering”).

Surge Copper Announces $1.6M FT Offering To Accelerate Exploration at Berg Project
Vancouver, British Columbia, June 06, 2024 (GLOBE NEWSWIRE) -- Surge Copper Corp. (TSXV: SURG ) (OTCQB: SRGXF ) (Frankfurt: G6D2 ) (“Surge” or the “Company”) announces a non-brokered private placement of up to 6,666,667 charity flow-through common shares (the “CFT Shares”) at a price of $0.245 per CFT Share for gross proceeds of up to $1.6 million (the “Offering”).

African Rainbow Minerals Limited Acquires Shares of Surge Copper Corp.
TORONTO, June 03, 2024 (GLOBE NEWSWIRE) -- African Rainbow Minerals Limited (JSE: ARI) (A2X: ARI) (“ARM”) announces that it has purchased 41,373,414 common shares (“Surge Shares”) in the capital of Surge Copper Corp. (“Surge”) pursuant to a non-brokered private placement at a price of C$0.095 per share for total consideration of approximately C$3,930,474.33 (the “Private Placement”).

Surge Copper Announces Closing of $3.9M Strategic Placement and Commences Berg PFS Metallurgical Test Program
Vancouver, British Columbia, May 31, 2024 (GLOBE NEWSWIRE) -- Surge Copper Corp. (TSXV: SURG ) (OTCQB: SRGXF ) (Frankfurt: G6D2 ) (“Surge” or the “Company”) is pleased to announce that it has closed its previously announced strategic placement (the “Strategic Placement”) (see April 2, 2024 press release) for gross proceeds of approximately $3.9 million. In addition, the Company announces that it has completed sample selection and shipped the sample material to commence a pre-feasibility study (“PFS”) metallurgy program for the Berg Project.

Surge Copper Announces Closing of Private Placement for $1.0 million
Vancouver, British Columbia, April 24, 2024 (GLOBE NEWSWIRE) -- Surge Copper Corp. (TSXV: SURG ) (OTCQB: SRGXF ) (Frankfurt: G6D2 ) (“Surge” or the “Company”) announces that it has closed its previously announced non-brokered private placement (the “Side-Car Private Placement”) (see April 10, 2024 press release), consisting of 10,000,000 common shares of Surge (the “Side-Car Common Shares”) at a price of $0.10 per Side-Car Common Share for aggregate gross proceeds of $1.0 million. Closing of the previously announced strategic placement (the “Strategic Placement”) (see April 2, 2024 press release) is anticipated within the next several weeks.

Surge Copper Outlines Pre-Feasibility Technical Work Programs at Berg and Announces Additional Private Placement for up to $1.0 million
Vancouver, British Columbia, April 10, 2024 (GLOBE NEWSWIRE) -- Surge Copper Corp. (TSXV: SURG ) (OTCQB: SRGXF ) (Frankfurt: G6D2 ) (“Surge” or the “Company”) is pleased to provide an update on planned technical work programs in support of a pre-feasibility study for the 100%-owned Berg copper-molybdenum-precious metals project located in central British Columbia. The Company is in the advanced planning stages for several programs as outlined below which are expected to commence in the coming weeks and extend through the summer field season, with further announcements to be provided upon commencement. The development of these programs is based on the recommendations contained in the preliminary economic assessment for the Berg Project, titled “Berg Project - NI 43-101 Technical Report and Preliminary Economic Assessment” dated effective as of June 12, 2023 (see June 13, 2023 press release ) (the “PEA”) which outlined a total budget of approximately C$7.85 million to complete a pre-feasibility study, including approximately 8,500 metres of drilling, of which approximately 2,000 metres was completed in 2023.

Surge Copper Announces C$3.8 Million Strategic Investment by African Rainbow Minerals Limited
Vancouver, British Columbia, April 02, 2024 (GLOBE NEWSWIRE) -- Surge Copper Corp. (TSXV: SURG ) (OTCQB: SRGXF ) (Frankfurt: G6D2 ) (“Surge” or the “Company”) is pleased to announce that it has entered into a subscription agreement for a private placement financing (the “Strategic Placement”) with a new cornerstone strategic investor, African Rainbow Minerals Limited (JSE: ARI) (“ARM”).

Surge Copper Announces 2023 Surface Exploration Results Identifies New Porphyry Exploration Target Adjacent to Berg
Vancouver, British Columbia, Feb. 07, 2024 (GLOBE NEWSWIRE) -- Surge Copper Corp. (TSXV: SURG ) (OTCQB: SRGXF ) (Frankfurt: G6D2 ) (“Surge” or the “Company”) is pleased to announce exploration results from 2023 surface work on the Berg Property in west-central British Columbia.

Surge Copper Intersects 418 metres grading 0.38% CuEq including 40 metres grading 0.47% CuEq at the Berg Deposit
Vancouver, British Columbia, Jan. 31, 2024 (GLOBE NEWSWIRE) -- Surge Copper Corp. (TSXV: SURG ) (OTCQX: SRGXF ) (Frankfurt: G6D2 ) (“Surge” or the “Company”) is pleased to announce assay results from drill hole BRG23-245, the third and final hole of the Company's 2023 drilling program testing the deeper portions of the large Berg copper-molybdenum deposit in west-central British Columbia. An interactive 3D model including all results from the 2023 drilling can be viewed here: https://vrify.com/decks/15092

Surge Copper Intersects 548 metres grading 0.36% CuEq including 30 metres grading 0.61% CuEq at the Berg Deposit
Vancouver, British Columbia, Jan. 22, 2024 (GLOBE NEWSWIRE) -- Surge Copper Corp. (TSXV: SURG ) (OTCQB: SRGXF ) (Frankfurt: G6D2 ) (“Surge” or the “Company”) is pleased to announce assay results from drill hole BRG23-244, the second hole of the Company's 2023 drilling program testing the deeper portions of the large Berg copper-molybdenum deposit in West-central British Columbia.

Surge Copper Completes Acquisition of 100% Interest in Berg
Vancouver, British Columbia, Jan. 19, 2024 (GLOBE NEWSWIRE) -- Surge Copper Corp. (TSXV: SURG ) (OTCQB: SRGXF ) (Frankfurt: G6D2 ) (“Surge” or the “Company”) is pleased to announce that it has completed the previously announced acquisition (see December 27, 2023 press release) of a 100% interest in the Berg Property from Thompson Creek Metals Company Inc. (“TCM”), a wholly-owned subsidiary of Centerra Gold Inc., for total consideration of 21,221,165 common shares (“Common Shares”) of Surge (the “Transaction”). Pursuant to the Transaction, the December 2020 Option Agreement between Surge and TCM has been terminated. The Common Shares issued pursuant to the Transaction will be subject to a statutory 4-month and a day hold period.

Surge Copper Acquires 100% Interest in Berg
Vancouver, British Columbia, Dec. 27, 2023 (GLOBE NEWSWIRE) -- Surge Copper Corp. (TSXV: SURG ) (OTCQB: SRGXF ) (Frankfurt: G6D2 ) (“Surge” or the “Company”) is pleased to announce that it has entered into a definitive purchase agreement (the “Purchase Agreement”) with Thompson Creek Metals Company Inc. (“TCM”), a wholly-owned subsidiary of Centerra Gold Inc., to acquire a 100% interest in the Berg Property for total consideration of 21,221,165 common shares of Surge, resulting in TCM owning approximately 15% of Surge's outstanding common shares (the “Transaction”). The Purchase Agreement replaces an earlier December 2020 Option Agreement between Surge and TCM which allowed Surge to earn a 70% interest in the Berg Property by spending C$8 million over five years and issuing to TCM C$5 million in common shares of the Company.

Surge Copper Intersects 756 metres grading 0.36% CuEq including 90 metres grading 0.46% CuEq at the Berg Deposit
Vancouver, British Columbia, Oct. 03, 2023 (GLOBE NEWSWIRE) -- Surge Copper Corp. (TSXV: SURG ) (OTCQX: SRGXF ) (Frankfurt: G6D2 ) (“Surge” or the “Company”) is pleased to announce assay results from drill hole BRG23-243, the first hole of the Company's 2023 drilling program testing the deeper portions of the large Berg copper-molybdenum deposit in west-central British Columbia.

Surge Copper Files NI 43-101 Technical Report for the Berg PEA
Vancouver, British Columbia, July 28, 2023 (GLOBE NEWSWIRE) -- Surge Copper Corp. (TSXV: SURG ) (OTCQX: SRGXF ) (Frankfurt: G6D2 ) (“Surge” or the “Company”) is pleased to announce that it has filed a technical report titled “Berg Project NI 43-101 Technical Report and Preliminary Economic Assessment”, prepared in accordance with National Instrument 43-101 – Standards of Disclosure for Mineral Projects. The technical report is in support of the Company's June 13, 2023 news release announcing the results of the preliminary economic assessment for the Berg Project located in central British Columbia. The technical report is available under the Company's profile on SEDAR+ at www.sedarplus.ca and on the Company's website at www.surgecopper.com.

Surge Copper Commences 2023 Exploration Program
Vancouver, British Columbia, July 12, 2023 (GLOBE NEWSWIRE) -- Surge Copper Corp. (TSXV: SURG ) (OTCQX: SRGXF ) (Frankfurt: G6D2 ) (“Surge” or the “Company”) is pleased to announce that it has commenced its 2023 field exploration program which is anticipated to run during the summer months of 2023 and include both diamond drilling at the Berg deposit and surface exploration at multiple target areas throughout the Berg-Ootsa district.

Similar Companies
Related Metrics
Explore detailed financial metrics and analysis for SRGXF.