
Taiwan Semiconductor Manufacturing (TSM) Stock
Company Profile
Price: $198.91
Market Cap: $863.55B
Exchange: NYSE
CEO: Dr. C. C. Wei
Sector: Technology
Industry: Semiconductors
Employees: 65.15K
Headquarters: Hsinchu City, None
Website: Taiwan Semiconductor Manufacturing
Business Summary
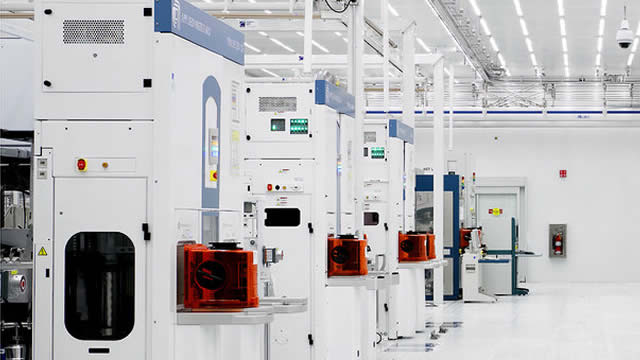
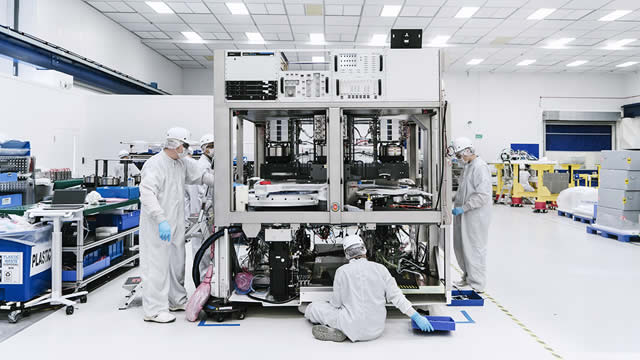
Taiwan Semiconductor Manufacturing Company Limited manufactures, packages, tests, and sells integrated circuits and other semiconductor devices in Taiwan, China, Europe, the Middle East, Africa, Japan, the United States, and internationally. It provides complementary metal oxide silicon wafer fabrication processes to manufacture logic, mixed-signal, radio frequency, and embedded memory semiconductors. The company also offers customer support, account management, and engineering services, as well as manufactures masks. Its products are used in mobile devices, high performance computing, automotive electronics, and internet of things markets. The company was incorporated in 1987 and is headquartered in Hsinchu City, Taiwan.
Taiwan Semiconductor Manufacturing Chart
Taiwan Semiconductor Manufacturing News

Taiwan Semiconductor: Redefining The Foundry Industry And Why It's A Strong Buy
TSMC's stock has surged 105.15% since my strong buy recommendation in November 2023, driven by a rebound in smartphones and PCs and a positive semiconductor cycle. The company's Foundry 2.0 expansion includes packaging, testing, and mask-making, broadening its market opportunities and potentially mitigating antitrust concerns. TSMC's robust AI demand and advanced process technologies are expected to drive near-30% annual revenue growth over the next four years.
-
seekingalpha.com
2024-10-22


TSMC says it has alerted US of potential China AI chip curbs violation, FT reports
Taiwan Semiconductor Manufacturing Company said it has informed the U.S. of a potential attempt to have it manufacture AI chips for China's Huawei in circumvention of export controls, the Financial Times reported on Tuesday.
-
reuters.com
2024-10-22


Taiwan Semiconductor: Buy And Hold This Stock Forever
Taiwan Semiconductor Manufacturing Company Limited's stock has risen considerably over the past 12 months. The company's strong moat, operational excellence, and robust growth have fueled investor optimism. TSMC is one of my stocks to own forever.
-
seekingalpha.com
2024-10-21

Taiwan Semiconductor Manufacturing Earnings
This section highlight's Taiwan Semiconductor Manufacturing's earnings, including earnings call transcripts, earnings surprises, and key dates.
Taiwan Semiconductor Manufacturing Earnings Call Transcripts
| Transcript | Quarter | Year | Date | Estimated EPS | Actual EPS |
|---|---|---|---|---|---|
| Read Transcript | Q3 | 2024 | 2024-10-17 | $1.74 | $1.94 |
| Read Transcript | Q2 | 2024 | 2024-07-18 | $1.43 | $1.48 |
| Read Transcript | Q1 | 2024 | 2024-04-18 | $1.32 | $1.39 |
| Read Transcript | Q4 | 2023 | 2024-01-18 | $1.37 | $1.45 |
| Read Transcript | Q3 | 2023 | 2023-10-19 | $1.17 | $1.29 |
| Read Transcript | Q2 | 2023 | 2023-07-20 | $1.08 | $1.14 |
| Read Transcript | Q1 | 2023 | 2023-04-20 | $1.20 | $1.31 |
| Read Transcript | Q4 | 2022 | 2023-01-12 | $1.76 | $1.91 |
| Read Transcript | Q3 | 2022 | 2022-10-13 | $1.69 | $1.79 |
| Read Transcript | Q2 | 2022 | 2022-07-14 | $1.51 | $1.55 |
| Read Transcript | Q1 | 2022 | 2022-04-14 | $1.33 | $1.39 |
Taiwan Semiconductor Manufacturing Earnings Dates
When is the next earnings date for TSM?
Date: 2025-01-16Status: Unconfirmed
Time of Day: Before Market
Estimated EPS: $1.88
When was the last earnings date for TSM?
Date: 2024-10-17Fiscal Date Ending: 2024-09-30
EPS: $1.94
Estimated EPS: $1.74
Revenue: $-
Estimated Revenue: $23.09B
Upcoming TSM Earnings
| Date | Estimated EPS | Time of Day | Status |
|---|---|---|---|
| 2025-01-16 | $1.88 | Before Market | Unconfirmed |
| 2025-04-16 | N/A | Before Market | Unconfirmed |
| 2025-07-16 | N/A | Before Market | Unconfirmed |
| 2025-10-15 | N/A | Before Market | Unconfirmed |
Financial Statements
This section provides financial statements for Taiwan Semiconductor Manufacturingincluding income statements, balance sheets, and cash flow statements, both annually and quarterly.
Annual Income Statement
| Breakdown | 2019-12-31 | 2020-12-31 | 2021-12-31 | 2022-12-31 | 2023-12-31 |
|---|---|---|---|---|---|
| Revenue | $1.07T | $1.34T | $1.59T | $2.26T | $2.16T |
| Cost of Revenue | $577.29B | $628.11B | $767.88B | $915.54B | $986.62B |
| Gross Profit | $492.70B | $711.13B | $819.54B | $1.35T | $1.18T |
| Gross Profit Ratio | 46.05% | 53.10% | 51.63% | 59.56% | 54.36% |
| Research and Development Expenses | $91.42B | $109.49B | $124.73B | $163.26B | $182.37B |
| General and Administrative Expenses | $21.74B | $28.46B | $36.93B | $53.52B | $60.87B |
| Selling and Marketing Expenses | $6.35B | $7.11B | $7.56B | $9.92B | $10.59B |
| Selling General and Administrative Expenses | $28.09B | $35.57B | $44.49B | $63.45B | $71.46B |
| Other Expenses | $-152.36M | $-710.13M | $-21.00K | $368.40M | $1.41B |
| Operating Expenses | $119.35B | $144.35B | $169.22B | $227.08B | $253.83B |
| Cost and Expenses | $696.64B | $772.45B | $937.10B | $1.14T | $1.24T |
| Interest Income | $16.19B | $9.02B | $5.71B | $22.42B | $48.29B |
| Interest Expense | $3.25B | $2.08B | $5.41B | $11.75B | $18.33B |
| Depreciation and Amortization | $286.88B | $331.72B | $422.39B | $437.25B | $532.19B |
| EBITDA | $679.93B | $912.21B | $1.09T | $1.59T | $1.45T |
| EBITDA Ratio | 63.55% | 68.11% | 68.72% | 70.22% | 67.24% |
| Operating Income | $372.70B | $566.78B | $649.98B | $1.12T | $921.28B |
| Operating Income Ratio | 34.83% | 42.32% | 40.95% | 49.53% | 42.62% |
| Total Other Income Expenses Net | $17.14B | $17.99B | $13.15B | $22.91B | $53.24B |
| Income Before Tax | $389.85B | $584.78B | $663.13B | $1.14T | $974.52B |
| Income Before Tax Ratio | 36.43% | 43.66% | 41.77% | 50.54% | 45.08% |
| Income Tax Expense | $44.50B | $66.62B | $66.05B | $127.29B | $141.40B |
| Net Income | $353.95B | $510.74B | $592.36B | $992.92B | $851.74B |
| Net Income Ratio | 33.08% | 38.14% | 37.32% | 43.86% | 39.40% |
| EPS | $66.60 | $98.50 | $114.20 | $191.45 | $164.25 |
| EPS Diluted | $66.60 | $98.50 | $114.20 | $191.45 | $164.25 |
| Weighted Average Shares Outstanding | 5.19B | 5.19B | 5.19B | 5.19B | 5.19B |
| Weighted Average Shares Outstanding Diluted | 5.19B | 5.19B | 5.19B | 5.19B | 5.19B |
| SEC Filing | Source | Source | Source | Source | Source |
Quarterly Income Statement
| Breakdown | 2019-09-30 | 2019-12-31 | 2020-03-31 | 2020-06-30 | 2020-09-30 | 2020-12-31 | 2021-03-31 | 2021-06-30 | 2021-09-30 | 2021-12-31 | 2022-03-31 | 2022-06-30 | 2022-09-30 | 2022-12-31 | 2023-03-31 | 2023-06-30 | 2023-09-30 | 2023-12-31 | 2024-03-31 | 2024-06-30 |
|---|---|---|---|---|---|---|---|---|---|---|---|---|---|---|---|---|---|---|---|---|
| Revenue | $293.03B | $317.24B | $310.59B | $310.63B | $356.44B | $361.58B | $362.47B | $372.15B | $414.57B | $438.26B | $491.08B | $534.14B | $613.14B | $625.53B | $508.63B | $480.84B | $546.73B | $625.53B | $592.64B | $673.51B |
| Cost of Revenue | $153.61B | $158.03B | $149.81B | $146.01B | $165.95B | $166.34B | $172.64B | $185.95B | $201.82B | $207.51B | $217.87B | $218.67B | $242.64B | $236.35B | $230.05B | $228.85B | $258.49B | $293.76B | $278.14B | $315.38B |
| Gross Profit | $139.41B | $159.20B | $160.78B | $164.62B | $190.49B | $195.24B | $189.84B | $186.20B | $212.75B | $230.75B | $273.20B | $315.47B | $370.50B | $389.18B | $278.58B | $251.99B | $288.24B | $331.77B | $314.50B | $358.12B |
| Gross Profit Ratio | 47.58% | 50.18% | 51.76% | 53.00% | 53.44% | 54.00% | 52.37% | 50.03% | 51.32% | 52.65% | 55.63% | 59.06% | 60.43% | 62.22% | 54.77% | 52.41% | 52.72% | 53.04% | 53.07% | 53.17% |
| Research and Development Expenses | $23.97B | $25.64B | $24.97B | $24.89B | $29.68B | $29.94B | $30.76B | $30.87B | $30.87B | $32.24B | $36.05B | $39.65B | $42.98B | $44.59B | $39.16B | $41.67B | $51.14B | $50.41B | $46.11B | $48.06B |
| General and Administrative Expenses | $5.81B | $7.50B | $5.90B | $6.89B | $9.27B | $6.39B | $6.52B | $7.83B | $8.93B | $13.65B | $10.50B | $11.57B | $14.50B | $16.96B | $13.48B | $14.16B | $15.00B | $18.24B | $16.14B | $19.29B |
| Selling and Marketing Expenses | $1.60B | $1.81B | $1.45B | $1.73B | $1.94B | $1.99B | $1.83B | $1.88B | $1.85B | $1.99B | $2.06B | $2.16B | $2.71B | $2.99B | $2.68B | $2.37B | $2.57B | $2.98B | $3.11B | $2.95B |
| Selling General and Administrative Expenses | $7.41B | $9.31B | $7.35B | $8.63B | $11.21B | $8.38B | $8.36B | $9.71B | $10.78B | $15.64B | $12.56B | $13.73B | $17.21B | $19.95B | $8.23B | $8.32B | $9.17B | $21.21B | $19.25B | $22.24B |
| Other Expenses | $34.85M | $997.00M | $-132.06M | $444.70M | $259.77M | $403.86M | $447.33M | $483.06M | $144.38M | $1.11B | $565.54M | $-30.27M | $-11.96M | $4.67M | $359.31M | $391.47M | $3.95M | $657.67M | $237.28M | $-70.30B |
| Operating Expenses | $31.53B | $34.96B | $32.25B | $33.53B | $40.45B | $38.12B | $39.30B | $40.53B | $41.74B | $47.98B | $49.41B | $53.34B | $60.17B | $64.54B | $47.39B | $49.99B | $60.31B | $71.62B | $65.36B | $70.30B |
| Cost and Expenses | $185.14B | $192.99B | $182.07B | $179.53B | $206.39B | $204.46B | $211.94B | $226.48B | $243.56B | $85.94B | $267.29B | $272.02B | $302.82B | $64.54B | $277.44B | $278.84B | $318.80B | $365.38B | $343.50B | $385.68B |
| Interest Income | $3.92B | $-12.84B | $2.99B | $2.48B | $1.90B | $1.65B | $1.46B | $1.43B | $1.36B | $1.46B | $1.67B | $3.55B | $6.62B | $10.59B | $13.62B | $13.67B | $15.60B | $14.49B | $19.36B | $- |
| Interest Expense | $843.43M | $-2.61B | $530.56M | $409.14M | $373.16M | $768.58M | $772.10M | $1.13B | $1.33B | $2.17B | $2.14B | $2.90B | $3.37B | $3.33B | $4.33B | $4.49B | $4.72B | $4.79B | $2.70B | $- |
| Depreciation and Amortization | $66.76B | $67.53B | $68.55B | $70.88B | $94.73B | $97.56B | $100.90B | $103.81B | $107.03B | $110.66B | $111.10B | $113.22B | $105.35B | $107.58B | $110.32B | $123.94B | $147.28B | $150.65B | $159.02B | $165.17B |
| EBITDA | $179.51B | $191.78B | $200.66B | $205.57B | $247.77B | $258.09B | $254.61B | $252.56B | $281.04B | $168.43B | $338.86B | $381.43B | $424.38B | $-64.54B | $341.51B | $325.94B | $375.21B | $410.80B | $408.17B | $453.00B |
| EBITDA Ratio | 61.26% | 60.45% | 64.61% | 66.18% | 69.51% | 71.38% | 70.24% | 67.86% | 67.79% | 38.43% | 69.00% | 71.41% | 69.21% | -10.32% | 67.14% | 67.79% | 68.63% | 65.67% | 68.87% | 67.26% |
| Operating Income | $107.89B | $124.24B | $128.52B | $131.09B | $150.05B | $157.12B | $150.54B | $145.67B | $171.00B | $182.77B | $223.79B | $262.12B | $310.32B | $324.64B | $231.19B | $202.00B | $227.93B | $260.15B | $249.15B | $287.83B |
| Operating Income Ratio | 36.82% | 39.16% | 41.38% | 42.20% | 42.10% | 43.45% | 41.53% | 39.14% | 41.25% | 41.70% | 45.57% | 49.07% | 50.61% | 51.90% | 45.45% | 42.01% | 41.69% | 41.59% | 42.04% | 42.74% |
| Total Other Income Expenses Net | $1.38B | $1.86B | $1.17B | $3.23B | $3.55B | $3.10B | $3.84B | $3.43B | $2.83B | $2.76B | $3.51B | $3.87B | $6.37B | $-28.74B | $12.05B | $11.54B | $12.84B | $16.82B | $16.52B | $17.33B |
| Income Before Tax | $112.34B | $128.78B | $132.15B | $136.40B | $155.12B | $161.11B | $155.06B | $149.39B | $173.85B | $184.82B | $226.83B | $266.00B | $316.69B | $295.90B | $243.24B | $213.54B | $240.77B | $276.97B | $265.67B | $305.16B |
| Income Before Tax Ratio | 38.34% | 40.59% | 42.55% | 43.91% | 43.52% | 44.56% | 42.78% | 40.14% | 41.94% | 42.17% | 46.19% | 49.80% | 51.65% | 47.30% | 47.82% | 44.41% | 44.04% | 44.28% | 44.83% | 45.31% |
| Income Tax Expense | $11.23B | $12.70B | $15.08B | $15.51B | $17.75B | $18.28B | $15.33B | $14.91B | $17.37B | $18.45B | $23.96B | $28.82B | $35.72B | $62.28B | $37.33B | $32.96B | $31.15B | $39.97B | $41.32B | $58.65B |
| Net Income | $101.07B | $116.03B | $116.99B | $120.82B | $137.31B | $135.63B | $139.69B | $134.36B | $156.26B | $162.05B | $202.73B | $237.03B | $280.87B | $272.30B | $206.99B | $181.80B | $211.00B | $251.95B | $225.48B | $247.84B |
| Net Income Ratio | 34.49% | 36.58% | 37.67% | 38.90% | 38.52% | 37.51% | 38.54% | 36.10% | 37.69% | 36.98% | 41.28% | 44.38% | 45.81% | 43.53% | 40.69% | 37.81% | 38.59% | 40.28% | 38.05% | 36.80% |
| EPS | $19.50 | $22.37 | $22.55 | $23.30 | $26.50 | $27.53 | $26.95 | $25.90 | $30.15 | $32.05 | $39.10 | $45.70 | $54.15 | $57.05 | $39.90 | $35.05 | $40.70 | $46.05 | $43.50 | $47.79 |
| EPS Diluted | $19.50 | $22.35 | $22.55 | $23.30 | $26.50 | $27.53 | $26.95 | $25.90 | $30.15 | $32.05 | $39.10 | $45.70 | $54.15 | $57.05 | $39.90 | $35.05 | $40.70 | $46.03 | $43.50 | $47.79 |
| Weighted Average Shares Outstanding | 5.19B | 5.19B | 5.19B | 5.19B | 5.19B | 5.19B | 5.19B | 5.19B | 5.19B | 5.19B | 5.19B | 5.19B | 5.19B | 5.19B | 5.19B | 5.19B | 5.19B | 5.18B | 5.19B | 5.19B |
| Weighted Average Shares Outstanding Diluted | 5.19B | 5.19B | 5.19B | 5.19B | 5.19B | 5.19B | 5.19B | 5.19B | 5.19B | 5.19B | 5.19B | 5.19B | 5.19B | 5.19B | 5.19B | 5.19B | 5.19B | 5.19B | 5.19B | 5.19B |
| SEC Filing | Source | Source | Source | Source | Source | Source | Source | Source | Source | Source | Source | Source | Source | Source | Source | Source | Source | Source | Source | Source |
Annual Balance Sheet
| Breakdown | 2019-12-31 | 2020-12-31 | 2021-12-31 | 2022-12-31 | 2023-12-31 |
|---|---|---|---|---|---|
| Cash and Cash Equivalents | $455.40B | $660.17B | $1.06T | $1.34T | $1.47T |
| Short Term Investments | $139.06B | $141.98B | $140.08B | $243.69B | $222.34B |
| Cash and Short Term Investments | $594.46B | $802.15B | $1.21T | $1.59T | $1.69T |
| Net Receivables | $139.82B | $146.09B | $198.36B | $231.41B | $202.01B |
| Inventory | $82.98B | $137.35B | $193.10B | $221.15B | $251.00B |
| Other Current Assets | $5.32B | $6.59B | $10.52B | $12.89B | $53.26B |
| Total Current Assets | $822.61B | $1.09T | $1.61T | $2.05T | $2.19T |
| Property Plant Equipment Net | $1.37T | $1.58T | $2.01T | $2.74T | $3.10T |
| Goodwill | $5.69B | $5.44B | $5.38B | $5.79B | $5.80B |
| Intangible Assets | $14.96B | $20.33B | $21.44B | $20.21B | $16.97B |
| Goodwill and Intangible Assets | $20.65B | $25.77B | $26.82B | $26.00B | $22.77B |
| Long Term Investments | $30.17B | $27.73B | $29.38B | $68.93B | $129.44B |
| Tax Assets | $17.93B | $25.96B | $49.15B | $69.19B | $64.18B |
| Other Non-Current Assets | $3.83B | $5.75B | $5.22B | $12.02B | $17.05B |
| Total Non-Current Assets | $1.44T | $1.67T | $2.12T | $2.91T | $3.34T |
| Other Assets | $- | $- | $- | $- | $-0.00B |
| Total Assets | $2.26T | $2.76T | $3.73T | $4.96T | $5.53T |
| Account Payables | $179.58B | $196.79B | $193.03B | $268.38B | $57.29B |
| Short Term Debt | $118.52B | $88.56B | $114.92B | $19.31B | $12.10B |
| Tax Payables | $32.47B | $53.91B | $59.65B | $120.80B | $98.91B |
| Deferred Revenue | $259.85B | $329.10B | $426.30B | $71.88B | $54.40B |
| Other Current Liabilities | $32.78B | $2.70B | $5.26B | $584.65B | $789.78B |
| Total Current Liabilities | $590.74B | $617.15B | $739.50B | $944.23B | $913.58B |
| Long Term Debt | $40.14B | $276.63B | $634.14B | $868.86B | $918.28B |
| Deferred Revenue Non-Current | $176.90M | $265.60M | $11.04B | $- | $28.68B |
| Deferred Tax Liabilities Non-Current | $344.39M | $1.73B | $1.87B | $1.03B | $53.86M |
| Other Non-Current Liabilities | $11.31B | $14.31B | $168.21B | $190.17B | $188.51B |
| Total Non-Current Liabilities | $51.97B | $292.94B | $815.27B | $1.06T | $1.14T |
| Other Liabilities | $- | $- | $- | $- | $- |
| Total Liabilities | $642.71B | $910.09B | $1.55T | $2.00T | $2.05T |
| Preferred Stock | $- | $- | $- | $- | $- |
| Common Stock | $259.30B | $259.30B | $259.30B | $259.30B | $259.32B |
| Retained Earnings | $1.33T | $1.59T | $1.91T | $2.64T | $2.88T |
| Accumulated Other Comprehensive Income Loss | $321.82B | $307.62B | $370.45B | $311.53B | $292.87B |
| Other Total Stockholders Equity | $-293.05B | $-305.95B | $-368.30B | $-262.71B | $24.12B |
| Total Stockholders Equity | $1.62T | $1.85T | $2.17T | $2.95T | $3.46T |
| Total Equity | $1.62T | $1.85T | $2.17T | $2.96T | $3.48T |
| Total Liabilities and Stockholders Equity | $2.26T | $2.76T | $3.73T | $4.96T | $5.53T |
| Minority Interest | $685.30M | $964.74M | $2.45B | $14.84B | $24.35B |
| Total Liabilities and Total Equity | $2.26T | $2.76T | $3.73T | $4.96T | $5.53T |
| Total Investments | $169.24B | $169.71B | $169.47B | $312.61B | $351.78B |
| Total Debt | $158.66B | $365.19B | $749.07B | $888.17B | $959.07B |
| Net Debt | $-296.74B | $-294.98B | $-315.92B | $-454.64B | $-506.36B |
Quarterly Balance Sheet
| Breakdown | 2019-09-30 | 2019-12-31 | 2020-03-31 | 2020-06-30 | 2020-09-30 | 2020-12-31 | 2021-03-31 | 2021-06-30 | 2021-09-30 | 2021-12-31 | 2022-03-31 | 2022-06-30 | 2022-09-30 | 2022-12-31 | 2023-03-31 | 2023-06-30 | 2023-09-30 | 2023-12-31 | 2024-03-31 | 2024-06-30 |
|---|---|---|---|---|---|---|---|---|---|---|---|---|---|---|---|---|---|---|---|---|
| Cash and Cash Equivalents | $452.43B | $455.40B | $430.78B | $467.61B | $604.20B | $660.17B | $664.73B | $747.98B | $853.81B | $1.06T | $1.15T | $1.25T | $1.30T | $1.34T | $1.39T | $1.28T | $1.31T | $1.47T | $1.70T | $1.80T |
| Short Term Investments | $150.17B | $139.06B | $141.47B | $147.84B | $147.87B | $141.98B | $147.06B | $135.30B | $135.98B | $139.92B | $145.66B | $197.05B | $222.92B | $243.69B | $229.10B | $213.23B | $266.27B | $222.34B | $224.59B | $249.39B |
| Cash and Short Term Investments | $602.60B | $594.46B | $572.25B | $615.45B | $752.07B | $802.15B | $811.79B | $883.28B | $989.79B | $1.20T | $1.30T | $1.45T | $1.52T | $1.59T | $1.61T | $1.49T | $1.58T | $1.69T | $1.92T | $2.05T |
| Net Receivables | $145.48B | $139.82B | $146.48B | $152.18B | $162.62B | $146.09B | $167.53B | $179.97B | $187.24B | $198.36B | $213.49B | $224.59B | $261.61B | $231.41B | $148.12B | $191.03B | $222.91B | $202.01B | $202.06B | $210.21B |
| Inventory | $96.69B | $82.98B | $78.28B | $85.79B | $109.51B | $137.35B | $154.57B | $170.44B | $182.23B | $193.10B | $200.12B | $217.44B | $218.34B | $221.15B | $216.07B | $234.33B | $262.09B | $251.00B | $267.12B | $272.49B |
| Other Current Assets | $4.63B | $5.32B | $5.46B | $6.61B | $5.48B | $6.59B | $5.83B | $7.41B | $11.34B | $10.52B | $10.33B | $13.34B | $10.55B | $12.89B | $16.34B | $44.65B | $19.22B | $53.26B | $60.80B | $60.32B |
| Total Current Assets | $849.43B | $822.61B | $802.47B | $860.03B | $1.03T | $1.09T | $1.14T | $1.24T | $1.37T | $1.61T | $1.72T | $1.91T | $2.01T | $2.05T | $2.00T | $1.96T | $2.08T | $2.19T | $2.45T | $2.59T |
| Property Plant Equipment Net | $1.22T | $1.37T | $1.46T | $1.51T | $1.53T | $1.58T | $1.69T | $1.76T | $1.86T | $2.01T | $2.14T | $2.28T | $2.45T | $2.74T | $2.88T | $3.09T | $3.17T | $3.10T | $3.09T | $3.15T |
| Goodwill | $5.83B | $5.69B | $5.73B | $5.62B | $5.55B | $5.44B | $5.49B | $5.41B | $5.40B | $5.38B | $5.50B | $5.66B | $5.93B | $5.79B | $5.75B | $5.85B | $6.00B | $5.80B | $5.97B | $6.03B |
| Intangible Assets | $12.26B | $14.96B | $21.50B | $21.78B | $20.79B | $20.33B | $19.52B | $21.13B | $20.24B | $21.44B | $20.12B | $21.55B | $20.77B | $20.21B | $18.54B | $18.00B | $17.41B | $16.97B | $16.27B | $16.40B |
| Goodwill and Intangible Assets | $18.09B | $20.65B | $27.23B | $27.40B | $26.34B | $25.77B | $25.01B | $26.54B | $25.64B | $26.82B | $25.62B | $27.21B | $26.71B | $26.00B | $24.30B | $23.85B | $23.41B | $22.77B | $22.24B | $22.43B |
| Long Term Investments | $30.13B | $30.09B | $31.03B | $22.92B | $26.51B | $27.73B | $29.13B | $28.94B | $27.73B | $29.18B | $45.74B | $64.44B | $75.80B | $68.93B | $69.91B | $94.61B | $116.35B | $129.44B | $138.47B | $140.22B |
| Tax Assets | $17.18B | $17.93B | $19.31B | $20.49B | $22.51B | $25.96B | $31.25B | $36.18B | $41.93B | $49.15B | $53.90B | $57.85B | $63.06B | $69.19B | $68.78B | $68.38B | $71.03B | $64.18B | $63.73B | $65.16B |
| Other Non-Current Assets | $3.94B | $3.83B | $3.32B | $3.23B | $5.28B | $5.75B | $3.11B | $4.63B | $4.52B | $5.22B | $7.93B | $7.96B | $9.67B | $12.02B | $11.72B | $-92.23B | $17.37B | $17.05B | $18.70B | $17.52B |
| Total Non-Current Assets | $1.28T | $1.44T | $1.54T | $1.59T | $1.61T | $1.67T | $1.78T | $1.85T | $1.96T | $2.12T | $2.27T | $2.44T | $2.63T | $2.91T | $3.05T | $3.19T | $3.40T | $3.34T | $3.34T | $3.39T |
| Other Assets | $- | $- | $- | $- | $- | $- | $- | $- | $- | $177.30M | $- | $- | $- | $- | $- | $- | $- | $-0.00B | $- | $- |
| Total Assets | $2.13T | $2.26T | $2.34T | $2.45T | $2.64T | $2.76T | $2.92T | $3.09T | $3.33T | $3.73T | $3.99T | $4.35T | $4.64T | $4.96T | $5.05T | $5.15T | $5.48T | $5.53T | $5.79T | $5.98T |
| Account Payables | $128.76B | $179.58B | $139.75B | $135.84B | $139.55B | $196.79B | $145.69B | $146.87B | $170.10B | $193.03B | $171.57B | $218.51B | $219.93B | $268.38B | $203.68B | $189.73B | $283.00B | $57.29B | $57.61B | $63.88B |
| Short Term Debt | $85.57B | $150.32B | $155.10B | $188.84B | $155.38B | $88.56B | $137.12B | $139.38B | $118.84B | $119.49B | $144.55B | $115.58B | $23.43B | $19.31B | $8.04B | $8.13B | $7.42B | $12.10B | $15.43B | $23.08B |
| Tax Payables | $33.21B | $40.09B | $47.57B | $33.02B | $33.71B | $53.91B | $74.02B | $51.83B | $33.61B | $78.50B | $87.69B | $62.06B | $76.01B | $120.80B | $157.22B | $70.06B | $102.95B | $98.91B | $139.22B | $110.30B |
| Deferred Revenue | $- | $- | $- | $- | $- | $- | $- | $28.71B | $34.18B | $40.49B | $51.27B | $36.66B | $-23.43B | $71.88B | $-8.04B | $44.39B | $652.60B | $54.40B | $75.43B | $43.73B |
| Other Current Liabilities | $280.45B | $268.46B | $294.62B | $290.12B | $293.32B | $331.80B | $378.83B | $344.60B | $332.49B | $405.35B | $455.48B | $474.48B | $587.50B | $584.65B | $669.41B | $568.58B | $27.01B | $789.78B | $877.70B | $918.22B |
| Total Current Liabilities | $494.78B | $598.36B | $589.47B | $614.80B | $588.24B | $617.15B | $661.65B | $659.56B | $655.62B | $758.35B | $822.87B | $845.24B | $807.43B | $944.23B | $873.09B | $810.83B | $970.03B | $913.58B | $1.03T | $1.05T |
| Long Term Debt | $40.13B | $40.14B | $65.97B | $101.60B | $247.21B | $276.63B | $300.54B | $434.67B | $484.26B | $634.14B | $653.80B | $779.72B | $875.62B | $868.86B | $884.77B | $901.71B | $966.91B | $918.28B | $965.56B | $974.34B |
| Deferred Revenue Non-Current | $210.20M | $176.90M | $176.66M | $171.62M | $167.73M | $265.60M | $349.50M | $392.40M | $641.55M | $- | $- | $- | $- | $- | $- | $-373.56M | $8.62B | $28.68B | $28.47B | $28.22B |
| Deferred Tax Liabilities Non-Current | $115.86M | $344.40M | $356.61M | $354.31M | $1.02B | $1.73B | $1.90B | $2.14B | $2.31B | $1.87B | $1.90B | $940.67M | $1.47B | $1.03B | $726.00M | $373.56M | $212.55M | $53.86M | $42.86M | $57.24M |
| Other Non-Current Liabilities | $11.50B | $11.31B | $10.30B | $10.52B | $10.67B | $14.31B | $13.70B | $13.89B | $111.16B | $179.25B | $192.64B | $209.58B | $206.46B | $190.17B | $194.36B | $231.46B | $165.97B | $188.51B | $101.92B | $110.68B |
| Total Non-Current Liabilities | $51.96B | $51.97B | $76.80B | $112.66B | $259.06B | $292.94B | $316.49B | $451.10B | $598.37B | $815.27B | $848.34B | $990.24B | $1.08T | $1.06T | $1.08T | $1.13T | $1.14T | $1.14T | $1.10T | $1.11T |
| Other Liabilities | $- | $- | $- | $- | $- | $- | $- | $- | $- | $-18.85B | $- | $- | $- | $- | $- | $- | $- | $- | $- | $- |
| Total Liabilities | $546.74B | $650.34B | $666.27B | $727.45B | $847.31B | $910.09B | $978.13B | $1.11T | $1.25T | $1.55T | $1.67T | $1.84T | $1.89T | $2.00T | $1.95T | $1.94T | $2.11T | $2.05T | $2.12T | $2.16T |
| Preferred Stock | $10.68B | $- | $24.87B | $36.76B | $42.26B | $54.68B | $48.39B | $- | $- | $- | $- | $- | $- | $- | $- | $- | $- | $- | $- | $- |
| Common Stock | $259.30B | $259.30B | $259.30B | $259.30B | $259.30B | $259.30B | $259.30B | $259.30B | $259.30B | $259.30B | $259.32B | $259.30B | $259.30B | $259.30B | $259.32B | $259.32B | $259.32B | $259.32B | $259.34B | $259.34B |
| Retained Earnings | $1.28T | $1.33T | $1.39T | $1.44T | $1.51T | $1.59T | $1.66T | $1.71T | $1.81T | $1.89T | $2.04T | $1.84T | $2.07T | $2.64T | $2.77T | $2.54T | $2.68T | $2.88T | $2.99T | $3.44T |
| Accumulated Other Comprehensive Income Loss | $-10.68B | $321.82B | $-24.87B | $-36.76B | $-42.26B | $-54.68B | $-48.39B | $309.84B | $327.74B | $370.45B | $344.00B | $358.21B | $346.21B | $311.53B | $325.28B | $334.74B | $328.38B | $292.87B | $361.67B | $25.54B |
| Other Total Stockholders Equity | $45.65B | $-293.05B | $31.47B | $19.58B | $14.08B | $1.67B | $16.36B | $-303.68B | $-322.29B | $-349.27B | $-327.15B | $33.92B | $65.90B | $-262.71B | $-279.66B | $52.12B | $78.50B | $24.12B | $23.61B | $67.85B |
| Total Stockholders Equity | $1.59T | $1.61T | $1.68T | $1.72T | $1.79T | $1.85T | $1.94T | $1.98T | $2.08T | $2.17T | $2.31T | $2.50T | $2.74T | $2.95T | $3.08T | $3.19T | $3.35T | $3.46T | $3.64T | $3.79T |
| Total Equity | $1.59T | $1.61T | $1.68T | $1.72T | $1.79T | $1.85T | $1.94T | $1.98T | $2.08T | $2.17T | $2.32T | $2.51T | $2.75T | $2.96T | $3.09T | $3.21T | $3.37T | $3.48T | $3.67T | $3.82T |
| Total Liabilities and Stockholders Equity | $2.13T | $2.26T | $2.34T | $2.45T | $2.64T | $2.76T | $2.92T | $3.09T | $3.33T | $3.73T | $3.99T | $4.35T | $4.64T | $4.96T | $5.05T | $5.15T | $5.48T | $5.53T | $5.79T | $5.98T |
| Minority Interest | $640.93M | $681.70M | $762.53M | $835.40M | $905.35M | $964.74M | $2.06B | $2.16B | $2.30B | $2.42B | $7.04B | $14.11B | $14.34B | $14.84B | $14.66B | $16.72B | $24.47B | $24.35B | $29.98B | $28.75B |
| Total Liabilities and Total Equity | $2.13T | $2.26T | $2.34T | $2.45T | $2.64T | $2.76T | $2.92T | $3.09T | $3.33T | $3.73T | $3.99T | $4.35T | $4.64T | $4.96T | $5.05T | $5.15T | $5.48T | $5.53T | $5.79T | $5.98T |
| Total Investments | $180.30B | $169.16B | $172.51B | $170.76B | $174.39B | $169.60B | $176.19B | $164.24B | $163.71B | $169.11B | $191.40B | $261.49B | $298.72B | $312.61B | $299.01B | $307.84B | $116.35B | $351.78B | $363.06B | $389.61B |
| Total Debt | $125.71B | $190.46B | $221.07B | $290.44B | $402.59B | $365.19B | $437.66B | $574.05B | $603.10B | $753.63B | $798.35B | $895.30B | $875.62B | $888.17B | $884.77B | $909.84B | $974.33B | $959.07B | $1.01T | $997.42B |
| Net Debt | $-326.73B | $-264.94B | $-209.71B | $-177.17B | $-201.61B | $-294.98B | $-227.07B | $-173.93B | $-250.71B | $-311.36B | $-353.23B | $-357.89B | $-420.39B | $-454.64B | $-500.46B | $-366.89B | $-337.48B | $-506.36B | $-688.73B | $-801.70B |
Annual Cash Flow Statement
| Breakdown | 2019-12-31 | 2020-12-31 | 2021-12-31 | 2022-12-31 | 2023-12-31 |
|---|---|---|---|---|---|
| Net Income | $389.85B | $584.78B | $663.13B | $1.14T | $838.50B |
| Depreciation and Amortization | $286.88B | $331.72B | $422.39B | $437.25B | $526.88B |
| Deferred Income Tax | $- | $- | $- | $- | $- |
| Stock Based Compensation | $2.80M | $6.60M | $7.80M | $302.40M | $483.00M |
| Change in Working Capital | $10.82B | $-28.34B | $132.47B | $122.51B | $-1.41B |
| Accounts Receivables | $-18.12B | $-8.08B | $177.06B | $-32.17B | $28.44B |
| Inventory | $20.25B | $-54.37B | $-55.75B | $-28.05B | $-29.85B |
| Accounts Payables | $5.86B | $404.61M | $8.30B | $7.59B | $770.71M |
| Other Working Capital | $2.83B | $33.71B | $2.86B | $175.13B | $-770.71M |
| Other Non Cash Items | $-72.42B | $-65.51B | $-105.83B | $-93.66B | $-122.55B |
| Net Cash Provided by Operating Activities | $615.14B | $822.67B | $1.11T | $1.61T | $1.24T |
| Investments in Property Plant and Equipment | $-469.75B | $-521.47B | $-849.44B | $-1.09T | $-949.82B |
| Acquisitions Net | $9.87B | $4.33B | $-160.70M | $17.25B | $11.75B |
| Purchases of Investments | $-258.00B | $-267.25B | $-259.69B | $-237.82B | $-226.28B |
| Sales Maturities of Investments | $246.78B | $267.30B | $264.36B | $108.98B | $170.50B |
| Other Investing Activities | $12.30B | $11.32B | $8.56B | $10.29B | $87.72B |
| Net Cash Used for Investing Activities | $-458.80B | $-505.78B | $-836.37B | $-1.19T | $-906.12B |
| Debt Repayment | $-37.83B | $-73.49B | $-4.59B | $-118.95B | $-22.71B |
| Common Stock Issued | $4.01M | $7.27M | $- | $- | $- |
| Common Stock Repurchased | $-4.01M | $-7.27M | $- | $-871.57M | $- |
| Dividends Paid | $-259.30B | $-259.30B | $-265.79B | $-285.23B | $-291.72B |
| Other Financing Activities | $27.50B | $244.18B | $406.98B | $204.82B | $109.54B |
| Net Cash Used Provided by Financing Activities | $-269.64B | $-88.62B | $136.61B | $-200.24B | $-204.89B |
| Effect of Forex Changes on Cash | $-9.11B | $-23.50B | $-7.58B | $58.40B | $-8.34B |
| Net Change in Cash | $-122.42B | $204.77B | $404.82B | $277.82B | $122.61B |
| Cash at End of Period | $455.40B | $660.17B | $1.06T | $1.34T | $1.47T |
| Cash at Beginning of Period | $577.81B | $455.40B | $660.17B | $1.06T | $1.34T |
| Operating Cash Flow | $615.14B | $822.67B | $1.11T | $1.61T | $1.24T |
| Capital Expenditure | $-469.75B | $-521.47B | $-849.44B | $-1.09T | $-949.82B |
| Free Cash Flow | $145.39B | $301.19B | $262.72B | $520.97B | $292.15B |
Quarterly Cash Flow Statement
| Breakdown | 2019-09-30 | 2019-12-31 | 2020-03-31 | 2020-06-30 | 2020-09-30 | 2020-12-31 | 2021-03-31 | 2021-06-30 | 2021-09-30 | 2021-12-31 | 2022-03-31 | 2022-06-30 | 2022-09-30 | 2022-12-31 | 2023-03-31 | 2023-06-30 | 2023-09-30 | 2023-12-31 | 2024-03-31 | 2024-06-30 |
|---|---|---|---|---|---|---|---|---|---|---|---|---|---|---|---|---|---|---|---|---|
| Net Income | $112.34B | $128.78B | $132.15B | $136.40B | $155.12B | $161.11B | $155.06B | $149.38B | $173.85B | $184.82B | $226.83B | $266.00B | $316.69B | $334.55B | $206.99B | $181.80B | $211.00B | $238.71B | $225.48B | $247.85B |
| Depreciation and Amortization | $66.76B | $67.53B | $68.55B | $70.88B | $94.73B | $97.56B | $100.90B | $103.81B | $107.03B | $110.66B | $111.10B | $113.22B | $105.35B | $107.58B | $109.08B | $122.63B | $145.90B | $149.26B | $159.02B | $165.17B |
| Deferred Income Tax | $- | $- | $- | $- | $- | $- | $- | $- | $- | $- | $- | $- | $- | $- | $- | $- | $- | $- | $- | $- |
| Stock Based Compensation | $- | $1.39M | $1.41M | $1.59M | $1.87M | $1.73M | $1.70M | $1.75M | $2.61M | $1.79M | $27.45M | $114.35M | $80.29M | $80.31M | $100.77M | $127.58M | $127.35M | $127.30M | $181.83M | $348.56M |
| Change in Working Capital | $-36.28B | $21.58B | $6.40B | $1.57B | $-40.49B | $4.18B | $-20.92B | $-7.36B | $68.70B | $84.53B | $33.30B | $22.30B | $11.41B | $55.49B | $87.12B | $-60.71B | $-60.06B | $32.25B | $24.11B | $4.64B |
| Accounts Receivables | $-30.71B | $21.53B | $-8.60B | $-2.72B | $-12.99B | $16.22B | $-21.66B | $-10.82B | $-8.89B | $-11.12B | $-15.12B | $-8.68B | $-39.45B | $30.21B | $82.04B | $-42.45B | $-32.30B | $21.15B | $-48.82M | $-7.62B |
| Inventory | $11.55B | $-6.55B | $4.70B | $-7.51B | $-23.72B | $-27.84B | $-17.21B | $-15.87B | $-11.80B | $-10.87B | $-7.02B | $-17.32B | $-897.78M | $-2.81B | $5.08B | $-18.26B | $-27.76B | $11.09B | $-16.13B | $-5.37B |
| Accounts Payables | $3.27B | $-1.60B | $-296.60M | $-182.30M | $808.43M | $75.07M | $-2.33B | $3.07B | $2.01B | $4.83B | $1.37B | $9.37B | $2.12B | $-5.27B | $-8.58B | $1.49B | $4.36B | $3.52B | $316.95M | $6.34B |
| Other Working Capital | $-20.39B | $8.20B | $10.59B | $11.98B | $-4.58B | $15.73B | $-1.37B | $5.43B | $78.49B | $109.32B | $38.95B | $38.93B | $49.64B | $33.37B | $8.58B | $-1.49B | $-4.36B | $-3.52B | $39.97B | $17.63B |
| Other Non Cash Items | $-1.06B | $-14.94B | $-4.07B | $-38.52B | $-19.20B | $-3.72B | $-7.23B | $-58.38B | $-30.88B | $-1.81B | $907.32M | $-62.79B | $-20.83B | $-10.83B | $-18.06B | $-76.62B | $-2.33B | $-25.58B | $375.81B | $-40.34B |
| Net Cash Provided by Operating Activities | $141.75B | $202.96B | $203.03B | $170.33B | $190.17B | $259.13B | $227.82B | $187.44B | $318.71B | $378.20B | $372.17B | $338.85B | $412.70B | $486.88B | $385.24B | $167.25B | $294.65B | $394.83B | $450.53B | $377.67B |
| Investments in Property Plant and Equipment | $-98.12B | $-170.01B | $-193.41B | $-134.34B | $-101.72B | $-89.51B | $-249.81B | $-170.51B | $-188.64B | $-235.56B | $-262.72B | $-220.95B | $-267.64B | $-336.80B | $-302.50B | $-250.53B | $-226.62B | $-170.16B | $-183.36B | $-205.67B |
| Acquisitions Net | $- | $- | $846.08M | $7.64B | $216.68M | $838.15M | $580.69M | $3.54B | $-19.28M | $998.93M | $5.21B | $11.90B | $416.39M | $-281.30M | $1.84B | $11.78B | $18.57B | $-20.44B | $7.06B | $-26.11M |
| Purchases of Investments | $-102.15B | $-57.07B | $-56.75B | $-67.97B | $-65.52B | $-77.00B | $-77.66B | $-73.92B | $-43.86B | $-64.25B | $-55.99B | $-65.20B | $-51.59B | $-65.04B | $-34.89B | $-73.80B | $-62.10B | $-55.48B | $-45.80B | $-63.26B |
| Sales Maturities of Investments | $88.14B | $56.49B | $57.19B | $68.70B | $65.92B | $75.49B | $81.34B | $74.04B | $52.93B | $55.87B | $29.79B | $6.59B | $27.06B | $45.55B | $51.05B | $44.58B | $22.53B | $52.34B | $50.23B | $44.66B |
| Other Investing Activities | $3.84B | $-1.02B | $3.13B | $-3.78B | $5.02B | $-773.14M | $1.30B | $-2.90B | $2.54B | $-1.41B | $842.78M | $-8.27B | $7.36B | $19.77B | $12.26B | $8.65B | $5.39B | $61.42B | $1.10B | $8.07B |
| Net Cash Used for Investing Activities | $-108.29B | $-171.60B | $-188.99B | $-129.75B | $-96.08B | $-90.96B | $-244.25B | $-169.75B | $-177.02B | $-245.34B | $-288.07B | $-275.93B | $-284.39B | $-336.80B | $-272.23B | $-259.33B | $-242.24B | $-132.32B | $-170.77B | $-197.61B |
| Debt Repayment | $-26.50B | $-47.91B | $-23.28B | $-729.69M | $-17.44B | $-32.03B | $-3.13B | $-452.75M | $-31.47B | $-155.20B | $-523.18M | $-599.25M | $-645.33M | $-117.19B | $-13.04B | $-1.15B | $-7.29B | $-1.23B | $-2.15B | $-10.26B |
| Common Stock Issued | $- | $- | $- | $- | $- | $- | $- | $- | $- | $- | $- | $- | $- | $- | $- | $- | $- | $- | $- | $- |
| Common Stock Repurchased | $- | $- | $- | $- | $- | $- | $- | $- | $- | $- | $-871.57M | $- | $- | $-34.00K | $- | $- | $- | $- | $- | $-3.09B |
| Dividends Paid | $-207.44B | $-51.86B | $-64.83B | $-64.83B | $-64.83B | $-64.83B | $-64.83B | $-64.83B | $-64.83B | $-71.31B | $-71.31B | $-71.31B | $-71.31B | $-71.31B | $-71.31B | $-71.31B | $-71.31B | $-77.80B | $-77.80B | $-90.76B |
| Other Financing Activities | $4.83B | $82.59B | $47.35B | $71.47B | $129.70B | $-4.35B | $82.58B | $140.31B | $29.50B | $153.59B | $53.62B | $90.99B | $-58.45B | $122.99B | $19.86B | $45.87B | $40.15B | $3.66B | $-17.02M | $-6.65B |
| Net Cash Used Provided by Financing Activities | $-229.11B | $-17.18B | $-40.76B | $5.91B | $47.43B | $-101.20B | $14.62B | $75.03B | $-35.32B | $82.28B | $-19.09B | $19.08B | $-130.41B | $-65.50B | $-64.49B | $-26.59B | $-38.45B | $-75.37B | $-76.44B | $-90.24B |
| Effect of Forex Changes on Cash | $-1.62B | $-11.20B | $2.10B | $-9.66B | $-4.94B | $-10.99B | $6.37B | $-9.46B | $-532.00M | $-3.96B | $21.59B | $19.60B | $44.92B | $-27.72B | $-6.11B | $10.16B | $21.13B | $-33.52B | $27.95B | $11.12B |
| Net Change in Cash | $-197.27B | $2.97B | $-24.62B | $36.84B | $136.58B | $55.98B | $4.56B | $83.25B | $105.83B | $211.18B | $86.60B | $101.60B | $42.82B | $46.80B | $42.42B | $-108.51B | $35.08B | $153.62B | $232.77B | $100.93B |
| Cash at End of Period | $452.43B | $455.40B | $430.78B | $467.61B | $604.20B | $660.17B | $664.73B | $747.98B | $853.81B | $1.06T | $1.15T | $1.25T | $1.30T | $1.34T | $1.39T | $1.28T | $1.31T | $1.47T | $1.70T | $1.80T |
| Cash at Beginning of Period | $649.70B | $452.43B | $455.40B | $430.78B | $467.61B | $604.20B | $660.17B | $664.73B | $747.98B | $853.81B | $1.06T | $1.15T | $1.25T | $1.30T | $1.34T | $1.39T | $1.28T | $1.31T | $1.47T | $1.70T |
| Operating Cash Flow | $141.75B | $202.96B | $203.03B | $170.33B | $190.17B | $259.13B | $227.82B | $187.44B | $318.71B | $378.20B | $372.17B | $338.85B | $412.70B | $486.88B | $385.24B | $167.25B | $294.65B | $394.83B | $450.53B | $377.67B |
| Capital Expenditure | $-98.12B | $-170.01B | $-193.41B | $-134.34B | $-101.72B | $-89.51B | $-249.81B | $-170.51B | $-188.64B | $-235.56B | $-262.72B | $-220.95B | $-267.64B | $-336.80B | $-302.50B | $-250.53B | $-226.62B | $-170.16B | $-183.36B | $-205.67B |
| Free Cash Flow | $43.63B | $32.95B | $9.62B | $36.00B | $88.45B | $169.62B | $-21.99B | $16.93B | $130.07B | $142.64B | $109.45B | $117.90B | $145.06B | $150.08B | $82.75B | $-83.29B | $68.02B | $224.67B | $267.17B | $171.99B |
Taiwan Semiconductor Manufacturing Dividends
Understand Taiwan Semiconductor Manufacturing's dividend history, dividend yield, payout ratio, and more.
Dividend Yield
1.76%
Dividend Payout Ratio
34.25%
Dividend Paid & Capex Coverage Ratio
1.00x
Taiwan Semiconductor Manufacturing Dividend History
| Dividend | Adjusted Dividend | Date | Record Date | Payment Date | Declaration Date |
|---|---|---|---|---|---|
| $0.48708 | $0.48708 | December 12, 2024 | December 12, 2024 | January 09, 2025 | August 13, 2024 |
| $0.626 | $0.626 | September 12, 2024 | September 12, 2024 | October 09, 2024 | May 10, 2024 |
| $0.54429 | $0.54429 | June 13, 2024 | June 13, 2024 | July 11, 2024 | February 06, 2024 |
| $0.55355 | $0.55355 | March 18, 2024 | March 19, 2024 | April 11, 2024 | November 15, 2023 |
| $0.479 | $0.479 | December 14, 2023 | December 15, 2023 | January 11, 2024 | August 08, 2023 |
| $0.471 | $0.471 | September 14, 2023 | September 15, 2023 | October 12, 2023 | May 09, 2023 |
| $0.448 | $0.448 | June 15, 2023 | June 16, 2023 | July 13, 2023 | February 14, 2023 |
| $0.449 | $0.449 | March 16, 2023 | March 17, 2023 | April 13, 2023 | November 08, 2022 |
| $0.458 | $0.45128 | December 15, 2022 | December 16, 2022 | January 12, 2023 | August 09, 2022 |
| $0.4625 | $0.448 | September 15, 2022 | September 16, 2022 | October 13, 2022 | May 10, 2022 |
| $0.369 | $0.467 | June 16, 2022 | June 17, 2022 | July 14, 2022 | February 15, 2022 |
| $0.387 | $0.49 | March 16, 2022 | March 17, 2022 | April 14, 2022 | November 09, 2021 |
| $0.392 | $0.49598 | December 16, 2021 | December 17, 2021 | January 13, 2022 | August 11, 2021 |
| $0.392 | $0.49668 | September 16, 2021 | September 17, 2021 | October 14, 2021 | June 10, 2021 |
| $0.3527 | $0.45126 | June 17, 2021 | June 18, 2021 | July 15, 2021 | February 09, 2021 |
| $0.43985 | $0.448 | March 17, 2021 | March 18, 2021 | April 15, 2021 | November 10, 2020 |
| $0.442 | $0.442 | December 17, 2020 | December 18, 2020 | January 14, 2021 | August 12, 2020 |
| $0.33 | $0.427 | September 17, 2020 | September 18, 2020 | October 15, 2020 | May 14, 2020 |
| $0.328 | $0.4171 | June 18, 2020 | June 19, 2020 | July 16, 2020 | February 12, 2020 |
| $0.417 | $0.417 | March 19, 2020 | March 20, 2020 | April 16, 2020 | November 14, 2019 |
Valuation
Analyze the market cap, enterprise value, and valuation metrics for Taiwan Semiconductor Manufacturing.
Market Cap & Enterprise Value
Market Cap: $863.55B
Enterprise Value: $16.04T
Valuation Ratios
P/E Ratio: 19.43
P/B Ratio: 4.78
P/CF Ratio: 13.32
Valuation Multiples
E/V to Sales: 7.42
E/V to EBITDA: 11.04
Market Cap & Enterprise Value
Market capitalization and enterprise value provide an understanding of a company's market value and total value, respectively.
- Market Cap: The total market value of a company's outstanding shares of stock. It represents the company's equity value and is calculated by multiplying the current share price by the total number of outstanding shares.
- Enterprise Value (EV): A measure of a company's total value, often seen as a more comprehensive alternative to equity market capitalization. It includes market cap plus debt, minority interest, and preferred shares, minus total cash and cash equivalents.
Valuation Ratios
Valuation ratios are used to evaluate the value of a company compared to its earnings, book value, and cash flow.
- P/E Ratio: Price to Earnings Ratio, indicating how much investors are willing to pay for a dollar of earnings.
- P/B Ratio: Price to Book Ratio, comparing the company's market value to its book value. A lower ratio may indicate undervaluation.
- P/CF Ratio: Price to Cash Flow Ratio, evaluating the market value relative to the operating cash flow. A lower ratio can signal a more attractive investment.
Valuation Multiples
Valuation multiples help assess a company's value relative to its revenue and earnings.
- EV to Sales: Enterprise Value to Sales, comparing the enterprise value to sales revenue. A lower ratio can indicate a more attractive investment.
- EV to EBITDA: Enterprise Value to EBITDA, comparing the enterprise value to earnings before interest, taxes, depreciation, and amortization. A lower ratio suggests a company may be undervalued.
Taiwan Semiconductor Manufacturing Growth
View income_statement_chart2_annual_data financial growth metrics for Taiwan Semiconductor Manufacturing, including income statement, balance sheet, and cash flow growth.
Income Growth
Revenue Growth: 13.64%
Operating Income Growth: 15.53%
Cash Flow Growth
Net Income Growth: 9.92%
Free Cash Flow Growth: -35.62%
Balance Sheet Growth
Total Assets Growth: 3.36%
Total Liabilities Growth: 1.89%
Income Growth
This section highlights key metrics related to income growth, showing how the company’s revenue and operating income have changed over time:
- Revenue Growth: The increase in a company's sales over time. It is a measure of how quickly the company is growing its revenue. This chart shows the historical trend of revenue growth.
- Operating Income Growth: The growth rate of a company's operating income, which is the income earned from its normal business operations. This chart helps to assess the company's operational efficiency and profitability growth over time.
Cash Flow Growth
This section highlights key metrics on the company's cash flow growth, reflecting changes in net income and free cash flow over time.
- Net Income Growth: The increase in a company's net profit over time. It reflects the company's ability to increase its profitability. This chart provides insight into how the company's bottom line has grown.
- Free Cash Flow Growth: The growth in a company's free cash flow, which is the cash generated by the company after accounting for capital expenditures. This chart is important for understanding the company's financial flexibility and ability to fund operations and growth.
Balance Sheet Growth
This section highlight key metrics related to balance sheet growth, which indicate how the company’s total assets and liabilities have changed over time:
- Total Assets Growth: The rate at which a company's total assets are increasing over time. This chart indicates how the company's asset base is expanding, which can be a sign of growth and investment in future operations.
- Total Liabilities Growth: The rate at which a company's total liabilities are increasing over time. This chart helps to assess the company's financial leverage and risk over time.
Peers: Semiconductors
This section provides companies within the same sector, on the same exchange, and of similar market capitalization, allowing comparisons of key financial indicators among peers.
| Company | Market Cap | Price | EPS | P/E Ratio | P/B Ratio |
|---|---|---|---|---|---|

NVIDIA Corporation
NVDA
|
$3.50T | $142.73 | $1.21 | $51.83 | $35.89 |

Intel Corporation
INTC
|
$95.89B | $22.43 | $0.40 | $124.66 | $1.99 |

Marvell Technology, Inc.
MRVL
|
$70.68B | $81.60 | $-1.08 | $-62.31 | $3.92 |

Micron Technology, Inc.
MU
|
$118.13B | $106.54 | $0.70 | $135.74 | $2.34 |

Advanced Micro Devices, Inc.
AMD
|
$249.28B | $154.02 | $0.53 | $278.59 | $4.26 |

Broadcom Inc.
AVGO
|
$835.61B | $178.91 | $3.39 | $24.79 | $14.55 |
More metrics for Taiwan Semiconductor Manufacturing
Access more key metrics, financials, ratios, and more with the links below.