Tyson Foods Key Executives
This section highlights Tyson Foods's key executives, including their titles and compensation details.
Find Contacts at Tyson Foods
(Showing 0 of )
Tyson Foods Earnings
This section highlights Tyson Foods's earnings, including key dates, EPS, earnings reports, and earnings call transcripts.
Next Earnings Date
Last Earnings Results
Earnings Call Transcripts
| Transcript | Quarter | Year | Date | Estimated EPS | Actual EPS |
|---|---|---|---|---|---|
| Read Transcript | Q1 | 2025 | 2025-02-03 | $0.79 | $1.14 |
| Read Transcript | Q4 | 2024 | 2024-11-12 | $0.64 | $0.92 |
| Read Transcript | Q3 | 2024 | 2024-08-05 | $0.67 | $0.87 |
| Read Transcript | Q2 | 2024 | 2024-05-06 | $0.39 | $0.62 |
| Read Transcript | Q1 | 2024 | 2024-02-05 | $0.42 | $0.69 |
| Read Transcript | Q4 | 2023 | 2023-11-13 | $0.33 | $0.37 |
| Read Transcript | Q3 | 2023 | 2023-08-07 | $0.34 | $0.15 |
| Read Transcript | Q2 | 2023 | 2023-05-08 | $0.81 | $-0.04 |
| Read Transcript | Q1 | 2023 | 2023-02-06 | $1.34 | $0.85 |

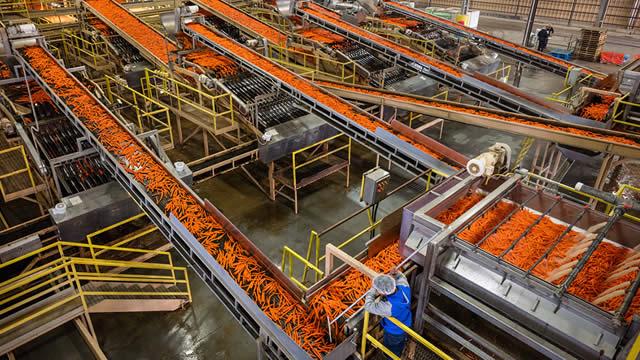
Tyson Foods, Inc., together with its subsidiaries, operates as a food company worldwide. It operates through four segments: Beef, Pork, Chicken, and Prepared Foods. The company processes live fed cattle and live market hogs; fabricates dressed beef and pork carcasses into primal and sub-primal meat cuts, as well as case ready beef and pork, and fully cooked meats; raises and processes chickens into fresh, frozen, and value-added chicken products; and supplies poultry breeding stock; sells specialty products, such as hides and meats. It also manufactures and markets frozen and refrigerated food products, including ready-to-eat sandwiches, flame-grilled hamburgers, Philly steaks, pepperoni, bacon, breakfast sausage, turkey, lunchmeat, hot dogs, flour and corn tortilla products, appetizers, snacks, prepared meals, ethnic foods, side dishes, meat dishes, breadsticks, and processed meats under the Jimmy Dean, Hillshire Farm, Ball Park, Wright, State Fair, Aidells, and Gallo Salame brands. The company also offers its products under Tyson and ibp brands. It sells its products through its sales staff to grocery retailers, grocery wholesalers, meat distributors, warehouse club stores, military commissaries, industrial food processing companies, chain restaurants or their distributors, live markets, international export companies, and domestic distributors who serve restaurants and food service operations, such as plant and school cafeterias, convenience stores, hospitals, and other vendors, as well as through independent brokers and trading companies. The company was founded in 1935 and is headquartered in Springdale, Arkansas.
$60.43
Stock Price
$21.10B
Market Cap
139.00K
Employees
Springdale, AR
Location
Financial Statements
Access annual & quarterly financial statements for Tyson Foods, including income statements, balance sheets, and cash flow statements..
Annual Income Statement
| Breakdown | September 30, 2024 | September 30, 2023 | October 01, 2022 | October 02, 2021 | October 03, 2020 |
|---|---|---|---|---|---|
| Revenue | $53.31B | $52.88B | $53.28B | $47.05B | $43.19B |
| Cost of Revenue | $49.68B | $50.25B | $46.61B | $40.52B | $37.80B |
| Gross Profit | $3.63B | $2.63B | $6.67B | $6.53B | $5.38B |
| Gross Profit Ratio | 6.80% | 5.00% | 12.51% | 13.90% | 12.47% |
| Research and Development Expenses | $- | $114.00M | $108.00M | $114.00M | $98.00M |
| General and Administrative Expenses | $- | $- | $1.98B | $1.88B | $1.99B |
| Selling and Marketing Expenses | $- | $- | $283.00M | $246.00M | $283.00M |
| Selling General and Administrative Expenses | $2.22B | $2.25B | $2.26B | $2.13B | $2.27B |
| Other Expenses | $- | $784.00M | $87.00M | $65.00M | $131.00M |
| Operating Expenses | $2.22B | $3.06B | $2.26B | $2.13B | $2.27B |
| Cost and Expenses | $51.90B | $53.28B | $48.87B | $42.65B | $40.07B |
| Interest Income | $89.00M | $30.00M | $17.00M | $8.00M | $10.00M |
| Interest Expense | $481.00M | $355.00M | $365.00M | $428.00M | $485.00M |
| Depreciation and Amortization | $1.40B | $1.33B | $1.19B | $1.20B | $1.18B |
| EBITDA | $2.97B | $1.00B | $5.70B | $5.66B | $4.32B |
| EBITDA Ratio | 5.58% | 1.90% | 10.73% | 12.08% | 10.30% |
| Operating Income | $1.41B | $-395.00M | $4.41B | $4.40B | $3.11B |
| Operating Income Ratio | 2.64% | -0.75% | 8.28% | 9.34% | 7.21% |
| Total Other Income Expenses Net | $-317.00M | $-283.00M | $-261.00M | $-355.00M | $-344.00M |
| Income Before Tax | $1.09B | $-678.00M | $4.15B | $4.04B | $2.77B |
| Income Before Tax Ratio | 2.05% | -1.28% | 7.79% | 8.59% | 6.41% |
| Income Tax Expense | $270.00M | $-29.00M | $900.00M | $981.00M | $620.00M |
| Net Income | $800.00M | $-648.00M | $3.24B | $3.05B | $2.06B |
| Net Income Ratio | 1.50% | -1.23% | 6.08% | 6.48% | 4.77% |
| EPS | $2.31 | $-1.87 | $9.17 | $8.56 | $5.79 |
| EPS Diluted | $2.25 | $-1.87 | $9.10 | $8.51 | $5.76 |
| Weighted Average Shares Outstanding | 346.32M | 346.52M | 353.00M | 356.00M | 356.00M |
| Weighted Average Shares Outstanding Diluted | 355.56M | 347.00M | 356.00M | 358.00M | 358.00M |
| SEC Filing | Source | Source | Source | Source | Source |
| Breakdown | December 28, 2024 | September 30, 2024 | June 29, 2024 | March 30, 2024 | December 30, 2023 | September 30, 2023 | July 01, 2023 | April 01, 2023 | December 31, 2022 | October 01, 2022 | July 02, 2022 | April 02, 2022 | January 01, 2022 | October 02, 2021 | July 03, 2021 | April 03, 2021 | January 02, 2021 | October 03, 2020 | June 27, 2020 | March 28, 2020 |
|---|---|---|---|---|---|---|---|---|---|---|---|---|---|---|---|---|---|---|---|---|
| Revenue | $13.62B | $13.56B | $13.35B | $13.07B | $13.32B | $13.35B | $13.14B | $13.13B | $13.26B | $13.74B | $13.49B | $13.12B | $12.93B | $12.81B | $12.48B | $11.30B | $10.46B | $11.46B | $10.02B | $10.89B |
| Cost of Revenue | $12.53B | $12.51B | $12.47B | $12.21B | $12.49B | $12.89B | $12.46B | $12.61B | $12.29B | $12.43B | $11.91B | $11.38B | $10.92B | $10.34B | $10.86B | $10.05B | $9.28B | $9.85B | $8.71B | $9.87B |
| Gross Profit | $1.09B | $1.06B | $884.00M | $866.00M | $831.00M | $459.00M | $677.00M | $527.00M | $968.00M | $1.31B | $1.59B | $1.74B | $2.02B | $2.48B | $1.62B | $1.25B | $1.18B | $1.61B | $1.31B | $1.02B |
| Gross Profit Ratio | 8.04% | 7.80% | 6.60% | 6.60% | 6.20% | 3.40% | 5.20% | 4.00% | 7.30% | 9.50% | 11.80% | 13.20% | 15.60% | 19.30% | 13.00% | 11.10% | 11.30% | 14.05% | 13.10% | 9.38% |
| Research and Development Expenses | $- | $- | $- | $- | $- | $114.00M | $- | $- | $- | $108.00M | $- | $- | $- | $114.00M | $- | $- | $- | $98.00M | $- | $- |
| General and Administrative Expenses | $- | $- | $- | $- | $- | $- | $- | $- | $- | $258.00M | $- | $- | $- | $321.00M | $- | $- | $- | $315.00M | $- | $- |
| Selling and Marketing Expenses | $- | $- | $- | $- | $- | $- | $- | $- | $- | $283.00M | $- | $- | $- | $246.00M | $- | $- | $- | $283.00M | $- | $- |
| Selling General and Administrative Expenses | $515.00M | $535.00M | $537.00M | $554.00M | $565.00M | $589.00M | $579.00M | $576.00M | $501.00M | $541.00M | $578.00M | $579.00M | $560.00M | $567.00M | $558.00M | $533.00M | $472.00M | $598.00M | $538.00M | $520.00M |
| Other Expenses | $- | $- | $- | $-12.00M | $25.00M | $-8.00M | $7.00M | $1.00M | $42.00M | $-24.00M | $34.00M | $25.00M | $52.00M | $27.00M | $7.00M | $12.00M | $19.00M | $-2.00M | $11.00M | $106.00M |
| Operating Expenses | $515.00M | $535.00M | $537.00M | $554.00M | $565.00M | $589.00M | $579.00M | $576.00M | $501.00M | $541.00M | $578.00M | $579.00M | $560.00M | $567.00M | $558.00M | $533.00M | $472.00M | $598.00M | $538.00M | $520.00M |
| Cost and Expenses | $13.04B | $13.04B | $13.01B | $12.76B | $13.05B | $13.48B | $13.04B | $13.18B | $12.79B | $12.97B | $12.49B | $11.96B | $11.48B | $10.90B | $11.42B | $10.58B | $9.76B | $10.45B | $9.25B | $10.39B |
| Interest Income | $25.00M | $29.00M | $36.00M | $14.00M | $10.00M | $8.00M | $6.00M | $7.00M | $9.00M | $7.00M | $4.00M | $3.00M | $3.00M | $2.00M | $2.00M | $2.00M | $2.00M | $1.00M | $3.00M | $3.00M |
| Interest Expense | $120.00M | $130.00M | $135.00M | $111.00M | $105.00M | $93.00M | $89.00M | $89.00M | $84.00M | $83.00M | $85.00M | $97.00M | $100.00M | $103.00M | $105.00M | $110.00M | $110.00M | $124.00M | $122.00M | $119.00M |
| Depreciation and Amortization | $348.00M | $318.00M | $360.00M | $349.00M | $373.00M | $393.00M | $321.00M | $314.00M | $301.00M | $306.00M | $295.00M | $292.00M | $298.00M | $300.00M | $300.00M | $300.00M | $298.00M | $316.00M | $295.00M | $293.00M |
| EBITDA | $946.00M | $923.00M | $748.00M | $755.00M | $639.00M | $-70.00M | $-16.00M | $273.00M | $818.00M | $1.18B | $1.29B | $1.48B | $1.73B | $2.29B | $1.44B | $1.03B | $1.02B | $1.33B | $1.08B | $903.00M |
| EBITDA Ratio | 6.94% | 6.80% | 5.60% | 5.07% | 4.80% | 1.99% | 3.30% | 2.10% | 6.19% | 7.71% | 9.66% | 9.03% | 14.00% | 15.13% | 11.00% | 9.20% | 9.79% | 8.82% | 10.82% | 8.29% |
| Operating Income | $580.00M | $525.00M | $341.00M | $312.00M | $266.00M | $-463.00M | $-350.00M | $-41.00M | $467.00M | $766.00M | $1.01B | $889.00M | $1.46B | $1.91B | $1.06B | $720.00M | $705.00M | $1.01B | $775.00M | $501.00M |
| Operating Income Ratio | 4.26% | 3.87% | 2.55% | 2.39% | 2.00% | -3.47% | -2.66% | -0.31% | 3.52% | 5.58% | 7.47% | 6.78% | 11.25% | 14.90% | 8.51% | 6.37% | 6.74% | 8.83% | 7.73% | 4.60% |
| Total Other Income Expenses Net | $-102.00M | $-50.00M | $-88.00M | $-109.00M | $-70.00M | $-93.00M | $-76.00M | $-81.00M | $-33.00M | $-100.00M | $-47.00M | $-69.00M | $-45.00M | $-74.00M | $-96.00M | $-96.00M | $-89.00M | $-125.00M | $-108.00M | $-24.00M |
| Income Before Tax | $478.00M | $475.00M | $253.00M | $203.00M | $161.00M | $-556.00M | $-426.00M | $-130.00M | $434.00M | $666.00M | $986.00M | $1.09B | $1.41B | $1.83B | $966.00M | $624.00M | $616.00M | $887.00M | $667.00M | $491.00M |
| Income Before Tax Ratio | 3.51% | 3.50% | 1.89% | 1.55% | 1.21% | -4.17% | -3.24% | -0.99% | 3.27% | 4.85% | 7.31% | 8.29% | 10.90% | 14.32% | 7.74% | 5.52% | 5.89% | 7.74% | 6.66% | 4.51% |
| Income Tax Expense | $112.00M | $111.00M | $57.00M | $55.00M | $47.00M | $-113.00M | $9.00M | $-39.00M | $114.00M | $129.00M | $233.00M | $254.00M | $284.00M | $477.00M | $213.00M | $147.00M | $144.00M | $192.00M | $140.00M | $124.00M |
| Net Income | $359.00M | $357.00M | $191.00M | $145.00M | $107.00M | $-450.00M | $-417.00M | $-91.00M | $316.00M | $538.00M | $750.00M | $829.00M | $1.12B | $1.35B | $749.00M | $476.00M | $467.00M | $692.00M | $526.00M | $376.00M |
| Net Income Ratio | 2.64% | 2.63% | 1.43% | 1.11% | 0.80% | -3.37% | -3.17% | -0.69% | 2.38% | 3.92% | 5.56% | 6.32% | 8.67% | 10.58% | 6.00% | 4.21% | 4.46% | 6.04% | 5.25% | 3.45% |
| EPS | $1.01 | $1.03 | $0.54 | $0.42 | $0.31 | $-1.29 | $-1.20 | $-0.26 | $0.91 | $1.50 | $2.13 | $2.30 | $3.16 | $3.81 | $2.11 | $1.34 | $1.31 | $1.95 | $1.48 | $1.06 |
| EPS Diluted | $1.01 | $1.00 | $0.55 | $0.41 | $0.31 | $-1.29 | $-1.20 | $-0.26 | $0.90 | $1.49 | $2.11 | $2.28 | $3.07 | $3.71 | $2.05 | $1.30 | $1.28 | $1.90 | $1.44 | $1.03 |
| Weighted Average Shares Outstanding | 355.00M | 346.60M | 356.00M | 354.00M | 347.00M | 348.24M | 347.00M | 347.00M | 349.00M | 358.00M | 352.00M | 361.00M | 362.00M | 363.00M | 363.00M | 363.00M | 363.00M | 362.00M | 362.00M | 363.00M |
| Weighted Average Shares Outstanding Diluted | 357.00M | 357.00M | 347.00M | 355.00M | 347.00M | 348.24M | 347.00M | 347.00M | 351.00M | 361.00M | 355.00M | 364.00M | 365.00M | 366.00M | 366.00M | 365.00M | 365.00M | 364.00M | 364.00M | 365.00M |
| SEC Filing | Source | Source | Source | Source | Source | Source | Source | Source | Source | Source | Source | Source | Source | Source | Source | Source | Source | Source | Source | Source |
Annual Balance Sheet
| Breakdown | September 30, 2024 | September 30, 2023 | October 01, 2022 | October 02, 2021 | October 03, 2020 |
|---|---|---|---|---|---|
| Cash and Cash Equivalents | $1.72B | $573.00M | $1.03B | $2.51B | $1.42B |
| Short Term Investments | $- | $15.00M | $-35.00M | $-72.00M | $- |
| Cash and Short Term Investments | $1.72B | $588.00M | $1.03B | $2.51B | $1.42B |
| Net Receivables | $2.41B | $2.48B | $2.58B | $2.40B | $1.95B |
| Inventory | $5.20B | $5.33B | $5.51B | $4.38B | $4.14B |
| Other Current Assets | $433.00M | $330.00M | $507.00M | $533.00M | $367.00M |
| Total Current Assets | $9.75B | $8.72B | $9.63B | $9.82B | $7.88B |
| Property Plant Equipment Net | $9.44B | $10.18B | $8.69B | $7.84B | $7.60B |
| Goodwill | $9.82B | $9.88B | $10.51B | $10.55B | $10.90B |
| Intangible Assets | $5.88B | $6.10B | $6.25B | $6.52B | $6.77B |
| Goodwill and Intangible Assets | $15.69B | $15.98B | $16.77B | $17.07B | $17.67B |
| Long Term Investments | $- | $89.00M | $100.00M | $125.00M | $-2.32B |
| Tax Assets | $- | $- | $264.00M | $-125.00M | $2.32B |
| Other Non-Current Assets | $2.21B | $1.29B | $1.38B | $1.58B | $1.59B |
| Total Non-Current Assets | $27.35B | $27.53B | $27.19B | $26.49B | $26.86B |
| Other Assets | $- | $- | $- | $- | $- |
| Total Assets | $37.10B | $36.25B | $36.82B | $36.31B | $34.74B |
| Account Payables | $2.40B | $2.59B | $2.48B | $2.23B | $1.88B |
| Short Term Debt | $74.00M | $2.05B | $604.00M | $1.22B | $709.00M |
| Tax Payables | $210.00M | $156.00M | $277.00M | $729.00M | $152.00M |
| Deferred Revenue | $- | $- | $2.46B | $- | $- |
| Other Current Liabilities | $2.10B | $1.70B | $1.95B | $2.15B | $1.50B |
| Total Current Liabilities | $4.79B | $6.50B | $5.31B | $6.33B | $4.23B |
| Long Term Debt | $9.71B | $7.99B | $8.22B | $8.66B | $11.17B |
| Deferred Revenue Non-Current | $- | $-6.00M | $- | $- | $- |
| Deferred Tax Liabilities Non-Current | $2.29B | $2.31B | $2.46B | $2.19B | $2.39B |
| Other Non-Current Liabilities | $1.80B | $1.20B | $1.02B | $1.28B | $3.67B |
| Total Non-Current Liabilities | $13.80B | $11.50B | $11.70B | $12.13B | $14.91B |
| Other Liabilities | $- | $- | $- | $- | $- |
| Total Liabilities | $18.59B | $18.00B | $17.01B | $18.45B | $19.14B |
| Preferred Stock | $- | $- | $- | $- | $- |
| Common Stock | $45.00M | $45.00M | $45.00M | $45.00M | $45.00M |
| Retained Earnings | $18.87B | $18.76B | $20.08B | $17.50B | $15.31B |
| Accumulated Other Comprehensive Income Loss | $-184.00M | $-260.00M | $-297.00M | $-172.00M | $-179.00M |
| Other Total Stockholders Equity | $-344.00M | $-412.00M | $-130.00M | $348.00M | $288.00M |
| Total Stockholders Equity | $18.39B | $18.13B | $19.70B | $17.72B | $15.46B |
| Total Equity | $18.51B | $18.25B | $19.81B | $17.85B | $15.60B |
| Total Liabilities and Stockholders Equity | $37.10B | $36.25B | $36.82B | $36.31B | $34.74B |
| Minority Interest | $124.00M | $122.00M | $109.00M | $131.00M | $132.00M |
| Total Liabilities and Total Equity | $37.10B | $36.25B | $36.82B | $36.31B | $34.74B |
| Total Investments | $- | $-2.31B | $-35.00M | $-72.00M | $-2.32B |
| Total Debt | $9.79B | $9.51B | $8.32B | $9.35B | $11.34B |
| Net Debt | $8.07B | $8.93B | $7.29B | $6.84B | $9.92B |
Balance Sheet Charts
| Breakdown | December 28, 2024 | September 30, 2024 | June 29, 2024 | March 30, 2024 | December 30, 2023 | September 30, 2023 | July 01, 2023 | April 01, 2023 | December 31, 2022 | October 01, 2022 | July 02, 2022 | April 02, 2022 | January 01, 2022 | October 02, 2021 | July 03, 2021 | April 03, 2021 | January 02, 2021 | October 03, 2020 | June 27, 2020 | March 28, 2020 |
|---|---|---|---|---|---|---|---|---|---|---|---|---|---|---|---|---|---|---|---|---|
| Cash and Cash Equivalents | $2.29B | $1.72B | $2.57B | $2.18B | $1.48B | $573.00M | $699.00M | $543.00M | $654.00M | $1.03B | $1.06B | $1.15B | $2.96B | $2.51B | $1.61B | $877.00M | $2.41B | $1.42B | $1.36B | $437.00M |
| Short Term Investments | $- | $- | $13.00M | $16.00M | $15.00M | $15.00M | $7.00M | $7.00M | $2.00M | $1.00M | $- | $- | $- | $-72.00M | $- | $- | $- | $- | $2.00M | $2.00M |
| Cash and Short Term Investments | $2.29B | $1.72B | $2.58B | $2.18B | $1.50B | $573.00M | $699.00M | $543.00M | $654.00M | $1.03B | $1.06B | $1.15B | $2.96B | $2.51B | $1.61B | $877.00M | $2.41B | $1.42B | $1.36B | $437.00M |
| Net Receivables | $2.32B | $2.41B | $2.39B | $2.36B | $2.26B | $2.48B | $2.45B | $2.43B | $2.29B | $2.58B | $2.52B | $2.41B | $2.09B | $2.40B | $2.32B | $2.11B | $1.90B | $1.95B | $2.06B | $2.25B |
| Inventory | $5.11B | $5.20B | $5.03B | $5.06B | $5.09B | $5.33B | $5.39B | $5.50B | $5.60B | $5.51B | $5.33B | $4.99B | $4.45B | $4.38B | $4.26B | $4.13B | $3.92B | $4.14B | $3.92B | $4.03B |
| Other Current Assets | $353.00M | $433.00M | $568.00M | $370.00M | $367.00M | $345.00M | $342.00M | $412.00M | $408.00M | $508.00M | $397.00M | $448.00M | $635.00M | $533.00M | $1.01B | $896.00M | $323.00M | $367.00M | $355.00M | $389.00M |
| Total Current Assets | $10.08B | $9.75B | $10.57B | $9.97B | $9.22B | $8.72B | $8.88B | $8.89B | $8.95B | $9.63B | $9.30B | $9.00B | $10.14B | $9.82B | $9.21B | $8.01B | $8.54B | $7.88B | $7.70B | $7.10B |
| Property Plant Equipment Net | $9.35B | $9.44B | $9.37B | $9.59B | $9.67B | $9.63B | $9.61B | $9.35B | $9.12B | $8.69B | $8.39B | $8.19B | $8.01B | $7.84B | $7.72B | $7.66B | $7.66B | $7.60B | $7.51B | $7.46B |
| Goodwill | $9.80B | $9.82B | $9.80B | $9.88B | $9.88B | $9.88B | $10.21B | $10.55B | $10.55B | $10.51B | $10.53B | $10.55B | $10.55B | $10.55B | $10.55B | $10.55B | $10.91B | $10.90B | $10.89B | $10.85B |
| Intangible Assets | $5.80B | $5.88B | $5.93B | $5.99B | $15.93B | $6.10B | $6.16B | $6.16B | $6.21B | $6.25B | $6.33B | $6.40B | $6.46B | $6.52B | $6.59B | $6.65B | $6.72B | $6.77B | $6.84B | $6.90B |
| Goodwill and Intangible Assets | $15.60B | $15.69B | $15.73B | $15.86B | $25.82B | $15.98B | $16.37B | $16.71B | $16.76B | $16.77B | $16.86B | $16.95B | $17.01B | $17.07B | $17.14B | $17.20B | $17.63B | $17.67B | $17.73B | $17.75B |
| Long Term Investments | $- | $- | $96.00M | $-2.29B | $93.00M | $-2.31B | $-2.44B | $97.00M | $100.00M | $100.00M | $103.00M | $-2.30B | $-2.27B | $112.00M | $-2.31B | $-2.34B | $-2.33B | $108.00M | $-2.37B | $-2.38B |
| Tax Assets | $- | $- | $- | $2.29B | $-9.88B | $2.31B | $2.44B | $2.44B | $2.47B | $-100.00M | $2.34B | $2.30B | $2.27B | $-125.00M | $2.31B | $2.34B | $2.33B | $2.32B | $2.37B | $2.38B |
| Other Non-Current Assets | $2.27B | $2.21B | $1.97B | $2.04B | $1.83B | $1.92B | $1.90B | $-689.00M | $-731.00M | $1.74B | $-749.00M | $1.76B | $1.67B | $1.59B | $1.59B | $1.59B | $1.62B | $-836.00M | $1.61B | $1.58B |
| Total Non-Current Assets | $27.23B | $27.35B | $27.16B | $27.50B | $27.53B | $27.53B | $27.88B | $27.90B | $27.73B | $27.19B | $26.94B | $26.90B | $26.69B | $26.49B | $26.45B | $26.46B | $26.91B | $26.86B | $26.86B | $26.79B |
| Other Assets | $- | $- | $- | $- | $- | $- | $- | $- | $- | $- | $- | $- | $- | $- | $- | $- | $- | $- | $- | $- |
| Total Assets | $37.31B | $37.10B | $37.73B | $37.47B | $36.75B | $36.25B | $36.76B | $36.80B | $36.68B | $36.82B | $36.24B | $35.90B | $36.82B | $36.31B | $35.66B | $34.47B | $35.46B | $34.74B | $34.56B | $33.89B |
| Account Payables | $2.50B | $2.40B | $2.29B | $2.24B | $2.62B | $2.59B | $2.42B | $2.39B | $2.53B | $2.48B | $2.31B | $2.27B | $2.12B | $2.23B | $1.95B | $1.90B | $2.00B | $1.88B | $1.74B | $1.74B |
| Short Term Debt | $95.00M | $74.00M | $1.32B | $1.31B | $1.31B | $2.05B | $457.00M | $1.06B | $490.00M | $604.00M | $67.00M | $79.00M | $1.09B | $1.22B | $1.57B | $580.00M | $566.00M | $709.00M | $918.00M | $1.30B |
| Tax Payables | $300.00M | $210.00M | $149.00M | $217.00M | $200.00M | $156.00M | $175.00M | $146.00M | $302.00M | $277.00M | $375.00M | $466.00M | $914.00M | $729.00M | $320.00M | $244.00M | $407.00M | $- | $- | $- |
| Deferred Revenue | $- | $- | $- | $1.23B | $200.00M | $1.12B | $- | $- | $2.47B | $2.46B | $375.00M | $- | $1.97B | $- | $1.82B | $1.33B | $1.40B | $- | $677.00M | $551.00M |
| Other Current Liabilities | $1.89B | $2.10B | $2.05B | $1.86B | $2.04B | $1.70B | $1.90B | $1.75B | $1.79B | $1.95B | $1.93B | $1.84B | $1.92B | $2.15B | $2.35B | $1.89B | $1.88B | $1.65B | $1.61B | $1.36B |
| Total Current Liabilities | $4.78B | $4.79B | $5.81B | $5.63B | $6.17B | $6.50B | $4.95B | $5.35B | $5.11B | $5.31B | $4.68B | $4.66B | $6.03B | $6.33B | $6.18B | $4.61B | $4.85B | $4.23B | $4.27B | $4.41B |
| Long Term Debt | $9.71B | $9.71B | $9.70B | $9.64B | $8.37B | $7.99B | $8.86B | $7.87B | $7.86B | $8.22B | $8.26B | $8.27B | $8.27B | $8.66B | $8.79B | $9.78B | $10.79B | $11.16B | $11.65B | $11.36B |
| Deferred Revenue Non-Current | $- | $- | $- | $- | $- | $- | $- | $- | $- | $- | $- | $- | $- | $- | $- | $- | $- | $- | $- | $- |
| Deferred Tax Liabilities Non-Current | $2.28B | $2.29B | $2.32B | $2.29B | $2.30B | $2.31B | $2.44B | $2.44B | $2.47B | $2.46B | $2.34B | $2.30B | $2.27B | $2.19B | $2.31B | $2.34B | $2.33B | $2.39B | $2.37B | $2.38B |
| Other Non-Current Liabilities | $1.91B | $1.80B | $1.70B | $1.67B | $1.61B | $1.20B | $1.60B | $1.59B | $1.45B | $1.02B | $1.47B | $1.52B | $1.70B | $1.28B | $1.69B | $1.67B | $1.71B | $3.68B | $1.26B | $1.15B |
| Total Non-Current Liabilities | $13.90B | $13.80B | $13.72B | $13.61B | $12.29B | $11.50B | $12.90B | $11.89B | $11.78B | $11.70B | $12.07B | $12.09B | $12.25B | $12.13B | $12.79B | $13.79B | $14.83B | $14.91B | $15.28B | $14.89B |
| Other Liabilities | $- | $- | $- | $- | $- | $- | $- | $- | $- | $- | $- | $- | $- | $- | $- | $- | $- | $- | $- | $- |
| Total Liabilities | $18.68B | $18.59B | $19.53B | $19.24B | $18.46B | $18.00B | $17.85B | $17.24B | $16.89B | $17.01B | $16.76B | $16.74B | $18.28B | $18.45B | $18.97B | $18.40B | $19.68B | $19.14B | $19.55B | $19.30B |
| Preferred Stock | $- | $- | $- | $- | $- | $- | $- | $- | $- | $- | $- | $- | $- | $- | $- | $- | $- | $- | $- | $- |
| Common Stock | $- | $45.00M | $45.00M | $45.00M | $45.00M | $45.00M | $45.00M | $45.00M | $45.00M | $45.00M | $45.00M | $45.00M | $45.00M | $45.00M | $45.00M | $45.00M | $45.00M | $45.00M | $45.00M | $45.00M |
| Retained Earnings | $19.05B | $18.87B | $18.69B | $18.67B | $18.69B | $18.76B | $19.38B | $19.96B | $20.23B | $20.08B | $19.71B | $19.12B | $18.45B | $17.50B | $16.30B | $15.72B | $15.40B | $15.31B | $14.77B | $14.39B |
| Accumulated Other Comprehensive Income Loss | $-281.00M | $-184.00M | $-295.00M | $-252.00M | $-338.00M | $-260.00M | $-229.00M | $-194.00M | $-215.00M | $-297.00M | $-255.00M | $-144.00M | $-172.00M | $-172.00M | $-125.00M | $-150.00M | $-102.00M | $-179.00M | $-217.00M | $-230.00M |
| Other Total Stockholders Equity | $-270.00M | $-344.00M | $-361.00M | $-371.00M | $-383.00M | $-412.00M | $-415.00M | $-414.00M | $-420.00M | $-130.00M | $-143.00M | $-6.00M | $77.00M | $348.00M | $336.00M | $320.00M | $296.00M | $288.00M | $261.00M | $242.00M |
| Total Stockholders Equity | $18.50B | $18.39B | $18.08B | $18.09B | $18.15B | $18.13B | $18.78B | $19.40B | $19.64B | $19.70B | $19.36B | $19.01B | $18.40B | $17.72B | $16.56B | $15.93B | $15.64B | $15.46B | $14.86B | $14.45B |
| Total Equity | $18.63B | $18.51B | $18.20B | $18.22B | $18.29B | $18.25B | $18.91B | $19.56B | $19.79B | $19.81B | $19.49B | $19.16B | $18.54B | $17.85B | $16.69B | $16.07B | $15.78B | $15.60B | $15.00B | $14.59B |
| Total Liabilities and Stockholders Equity | $37.31B | $37.10B | $37.73B | $37.47B | $36.75B | $36.25B | $36.76B | $36.80B | $36.68B | $36.82B | $36.24B | $35.90B | $36.82B | $36.31B | $35.66B | $34.47B | $35.46B | $34.74B | $34.56B | $33.89B |
| Minority Interest | $124.00M | $124.00M | $126.00M | $134.00M | $138.00M | $122.00M | $131.00M | $159.00M | $152.00M | $109.00M | $134.00M | $142.00M | $139.00M | $131.00M | $132.00M | $139.00M | $143.00M | $132.00M | $146.00M | $145.00M |
| Total Liabilities and Total Equity | $37.31B | $37.10B | $37.73B | $37.47B | $36.75B | $36.25B | $36.76B | $36.80B | $36.68B | $36.82B | $36.24B | $35.90B | $36.82B | $36.31B | $35.66B | $34.47B | $35.46B | $34.74B | $34.56B | $33.89B |
| Total Investments | $- | $- | $109.00M | $108.00M | $108.00M | $-2.31B | $-2.44B | $104.00M | $102.00M | $101.00M | $103.00M | $-2.30B | $-2.27B | $112.00M | $-2.31B | $-2.34B | $-2.33B | $108.00M | $-2.37B | $-2.38B |
| Total Debt | $9.81B | $9.79B | $11.02B | $10.96B | $9.68B | $9.51B | $9.32B | $8.93B | $8.35B | $8.32B | $8.33B | $8.35B | $9.36B | $9.35B | $10.35B | $10.36B | $11.36B | $11.34B | $12.03B | $12.12B |
| Net Debt | $7.51B | $8.07B | $8.45B | $8.78B | $8.19B | $8.93B | $8.62B | $8.39B | $7.70B | $7.29B | $7.27B | $7.20B | $6.41B | $6.84B | $8.74B | $9.49B | $8.95B | $9.92B | $10.66B | $11.68B |
Annual Cash Flow
| Breakdown | September 30, 2024 | September 30, 2023 | October 01, 2022 | October 02, 2021 | October 03, 2020 |
|---|---|---|---|---|---|
| Net Income | $822.00M | $-649.00M | $3.25B | $3.06B | $2.15B |
| Depreciation and Amortization | $1.40B | $1.34B | $1.20B | $1.21B | $1.19B |
| Deferred Income Tax | $-45.00M | $-183.00M | $264.00M | $-125.00M | $45.00M |
| Stock Based Compensation | $101.00M | $61.00M | $93.00M | $91.00M | $89.00M |
| Change in Working Capital | $224.00M | $187.00M | $-2.10B | $381.00M | $474.00M |
| Accounts Receivables | $59.00M | $136.00M | $-176.00M | $-508.00M | $191.00M |
| Inventory | $153.00M | $175.00M | $-1.20B | $-567.00M | $-20.00M |
| Accounts Payables | $-205.00M | $47.00M | $302.00M | $351.00M | $-64.00M |
| Other Working Capital | $217.00M | $-171.00M | $-1.03B | $1.10B | $367.00M |
| Other Non Cash Items | $88.00M | $997.00M | $-17.00M | $-781.00M | $-76.00M |
| Net Cash Provided by Operating Activities | $2.59B | $1.75B | $2.69B | $3.84B | $3.87B |
| Investments in Property Plant and Equipment | $-1.13B | $-1.94B | $-1.89B | $-1.21B | $-1.20B |
| Acquisitions Net | $145.00M | $-377.00M | $-177.00M | $1.14B | $-154.00M |
| Purchases of Investments | $-38.00M | $-34.00M | $-35.00M | $-72.00M | $-105.00M |
| Sales Maturities of Investments | $35.00M | $32.00M | $34.00M | $70.00M | $87.00M |
| Other Investing Activities | $102.00M | $19.00M | $130.00M | $125.00M | $-52.00M |
| Net Cash Used for Investing Activities | $-888.00M | $-2.30B | $-1.94B | $58.00M | $-1.42B |
| Debt Repayment | $183.00M | $1.12B | $-1.09B | $-2.05B | $327.00M |
| Common Stock Issued | $- | $- | $- | $- | $- |
| Common Stock Repurchased | $-49.00M | $-354.00M | $-702.00M | $-67.00M | $-207.00M |
| Dividends Paid | $-684.00M | $-670.00M | $-653.00M | $-636.00M | $-601.00M |
| Other Financing Activities | $-31.00M | $-5.00M | $120.00M | $19.00M | $-987.00M |
| Net Cash Used Provided by Financing Activities | $-581.00M | $88.00M | $-2.32B | $-2.73B | $-1.47B |
| Effect of Forex Changes on Cash | $23.00M | $1.00M | $-35.00M | $4.00M | $-1.00M |
| Net Change in Cash | $1.14B | $-458.00M | $-1.61B | $1.04B | $936.00M |
| Cash at End of Period | $1.72B | $573.00M | $1.03B | $2.51B | $1.42B |
| Cash at Beginning of Period | $573.00M | $1.03B | $2.64B | $1.47B | $484.00M |
| Operating Cash Flow | $2.59B | $1.75B | $2.69B | $3.84B | $3.87B |
| Capital Expenditure | $-1.13B | $-1.94B | $-1.89B | $-1.21B | $-1.20B |
| Free Cash Flow | $1.46B | $-187.00M | $800.00M | $2.63B | $2.67B |
Cash Flow Charts
| Breakdown | December 28, 2024 | September 30, 2024 | June 29, 2024 | March 30, 2024 | December 30, 2023 | September 30, 2023 | July 01, 2023 | April 01, 2023 | December 31, 2022 | October 01, 2022 | July 02, 2022 | April 02, 2022 | January 01, 2022 | October 02, 2021 | July 03, 2021 | April 03, 2021 | January 02, 2021 | October 03, 2020 | June 27, 2020 | March 28, 2020 |
|---|---|---|---|---|---|---|---|---|---|---|---|---|---|---|---|---|---|---|---|---|
| Net Income | $366.00M | $364.00M | $191.00M | $148.00M | $107.00M | $-443.00M | $-435.00M | $-91.00M | $320.00M | $537.00M | $750.00M | $833.00M | $1.13B | $1.36B | $753.00M | $477.00M | $472.00M | $695.00M | $527.00M | $367.00M |
| Depreciation and Amortization | $348.00M | $318.00M | $360.00M | $349.00M | $-373.00M | $396.00M | $323.00M | $317.00M | $303.00M | $310.00M | $295.00M | $295.00M | $300.00M | $308.00M | $302.00M | $306.00M | $298.00M | $316.00M | $295.00M | $293.00M |
| Deferred Income Tax | $-2.00M | $-51.00M | $27.00M | $-7.00M | $-14.00M | $-129.00M | $-25.00M | $-37.00M | $8.00M | $115.00M | $51.00M | $21.00M | $77.00M | $-122.00M | $-30.00M | $10.00M | $17.00M | $18.00M | $-19.00M | $43.00M |
| Stock Based Compensation | $- | $- | $- | $- | $- | $61.00M | $- | $- | $- | $93.00M | $- | $- | $- | $91.00M | $- | $- | $- | $89.00M | $- | $- |
| Change in Working Capital | $241.00M | $-41.00M | $193.00M | $-626.00M | $698.00M | $89.00M | $340.00M | $-305.00M | $63.00M | $-179.00M | $-470.00M | $-1.37B | $-82.00M | $402.00M | $256.00M | $-857.00M | $580.00M | $117.00M | $617.00M | $-275.00M |
| Accounts Receivables | $- | $- | $- | $- | $- | $136.00M | $- | $- | $- | $-176.00M | $- | $- | $- | $-508.00M | $- | $- | $- | $191.00M | $- | $- |
| Inventory | $- | $- | $- | $- | $- | $175.00M | $- | $- | $- | $-1.20B | $- | $- | $- | $-567.00M | $- | $- | $- | $-20.00M | $- | $- |
| Accounts Payables | $- | $- | $- | $- | $- | $-311.00M | $- | $- | $- | $302.00M | $- | $- | $- | $-64.00M | $- | $- | $- | $-64.00M | $- | $- |
| Other Working Capital | $241.00M | $-41.00M | $193.00M | $-626.00M | $698.00M | $-222.00M | $340.00M | $-305.00M | $63.00M | $890.00M | $-470.00M | $-1.37B | $-82.00M | $1.13B | $256.00M | $-857.00M | $580.00M | $10.00M | $619.00M | $-289.00M |
| Other Non Cash Items | $78.00M | $27.00M | $25.00M | $13.00M | $129.00M | $349.00M | $457.00M | $123.00M | $68.00M | $-79.00M | $630.00M | $16.00M | $11.00M | $-129.00M | $26.00M | $28.00M | $18.00M | $-69.00M | $28.00M | $-62.00M |
| Net Cash Provided by Operating Activities | $1.03B | $617.00M | $796.00M | $-123.00M | $1.30B | $323.00M | $660.00M | $7.00M | $762.00M | $797.00M | $666.00M | $-208.00M | $1.43B | $1.18B | $1.31B | $-36.00M | $1.39B | $1.17B | $1.45B | $366.00M |
| Investments in Property Plant and Equipment | $-271.00M | $-248.00M | $-263.00M | $-267.00M | $-354.00M | $-375.00M | $-467.00M | $-508.00M | $-589.00M | $-564.00M | $-476.00M | $-439.00M | $-408.00M | $-350.00M | $-302.00M | $-268.00M | $-289.00M | $-292.00M | $-283.00M | $-312.00M |
| Acquisitions Net | $- | $173.00M | $-2.00M | $- | $-26.00M | $-65.00M | $-236.00M | $-1.00M | $-75.00M | $-80.00M | $-1.00M | $- | $- | $1.19B | $-44.00M | $- | $- | $154.00M | $1.00M | $-184.00M |
| Purchases of Investments | $-15.00M | $-15.00M | $-10.00M | $-6.00M | $-33.00M | $-13.00M | $-6.00M | $-8.00M | $-7.00M | $-6.00M | $-12.00M | $-11.00M | $-7.00M | $-15.00M | $-16.00M | $-27.00M | $-14.00M | $-46.00M | $-11.00M | $-13.00M |
| Sales Maturities of Investments | $16.00M | $14.00M | $9.00M | $6.00M | $6.00M | $12.00M | $6.00M | $7.00M | $7.00M | $6.00M | $10.00M | $11.00M | $7.00M | $15.00M | $14.00M | $26.00M | $15.00M | $46.00M | $10.00M | $12.00M |
| Other Investing Activities | $37.00M | $42.00M | $33.00M | $24.00M | $29.00M | $14.00M | $7.00M | $3.00M | $-5.00M | $34.00M | $38.00M | $13.00M | $-51.00M | $3.00M | $73.00M | $20.00M | $29.00M | $-142.00M | $17.00M | $1.00M |
| Net Cash Used for Investing Activities | $-233.00M | $-34.00M | $-233.00M | $-243.00M | $-378.00M | $-427.00M | $-696.00M | $-507.00M | $-669.00M | $-610.00M | $-440.00M | $-426.00M | $-459.00M | $841.00M | $-275.00M | $-249.00M | $-259.00M | $-280.00M | $-266.00M | $-496.00M |
| Debt Repayment | $-20.00M | $-1.27B | $25.00M | $1.28B | $148.00M | $175.00M | $384.00M | $562.00M | $-4.00M | $-19.00M | $-28.00M | $-1.02B | $-17.00M | $-1.01B | $-22.00M | $-1.01B | $- | $-707.00M | $-102.00M | $380.00M |
| Common Stock Issued | $- | $- | $- | $- | $- | $- | $- | $- | $- | $- | $- | $- | $- | $- | $- | $- | $- | $- | $- | $- |
| Common Stock Repurchased | $-15.00M | $-5.00M | $-13.00M | $-18.00M | $-13.00M | $-11.00M | $-11.00M | $-19.00M | $-313.00M | $-9.00M | $-182.00M | $-163.00M | $-348.00M | $-17.00M | $-16.00M | $-17.00M | $-17.00M | $-7.00M | $-4.00M | $-64.00M |
| Dividends Paid | $-175.00M | $-171.00M | $-171.00M | $-171.00M | $-171.00M | $-167.00M | $-167.00M | $-167.00M | $-169.00M | $-162.00M | $-163.00M | $-164.00M | $-164.00M | $-159.00M | $-159.00M | $-159.00M | $-159.00M | $-150.00M | $-150.00M | $-151.00M |
| Other Financing Activities | $15.00M | $-18.00M | $-9.00M | $-14.00M | $10.00M | $-10.00M | $-4.00M | $5.00M | $4.00M | $-5.00M | $12.00M | $68.00M | $45.00M | $-1.00M | $- | $17.00M | $3.00M | $-10.00M | $1.00M | $3.00M |
| Net Cash Used Provided by Financing Activities | $-195.00M | $-1.46B | $-168.00M | $1.08B | $-26.00M | $-13.00M | $202.00M | $381.00M | $-482.00M | $-195.00M | $-361.00M | $-1.28B | $-484.00M | $-1.19B | $-197.00M | $-1.17B | $-173.00M | $-874.00M | $-255.00M | $168.00M |
| Effect of Forex Changes on Cash | $-28.00M | $29.00M | $-8.00M | $-13.00M | $15.00M | $-9.00M | $-10.00M | $8.00M | $12.00M | $-17.00M | $-24.00M | $4.00M | $2.00M | $-7.00M | $1.00M | $-6.00M | $16.00M | $7.00M | $1.00M | $-16.00M |
| Net Change in Cash | $575.00M | $-852.00M | $387.00M | $698.00M | $911.00M | $-126.00M | $156.00M | $-111.00M | $-377.00M | $-25.00M | $-159.00M | $-1.80B | $319.00M | $699.00M | $836.00M | $-1.43B | $940.00M | $55.00M | $846.00M | $22.00M |
| Cash at End of Period | $2.29B | $1.72B | $2.57B | $2.18B | $1.48B | $573.00M | $699.00M | $543.00M | $654.00M | $1.03B | $1.06B | $1.15B | $2.96B | $2.51B | $1.81B | $972.00M | $2.41B | $1.42B | $1.36B | $519.00M |
| Cash at Beginning of Period | $1.72B | $2.57B | $2.18B | $1.48B | $573.00M | $699.00M | $543.00M | $654.00M | $1.03B | $1.06B | $1.22B | $2.96B | $2.64B | $1.81B | $972.00M | $2.41B | $1.47B | $1.36B | $519.00M | $497.00M |
| Operating Cash Flow | $1.03B | $617.00M | $796.00M | $-123.00M | $1.30B | $323.00M | $660.00M | $7.00M | $762.00M | $797.00M | $666.00M | $-208.00M | $1.43B | $1.18B | $1.31B | $-36.00M | $1.39B | $1.17B | $1.45B | $366.00M |
| Capital Expenditure | $-271.00M | $-248.00M | $-263.00M | $-267.00M | $-354.00M | $-375.00M | $-467.00M | $-508.00M | $-589.00M | $-564.00M | $-476.00M | $-439.00M | $-408.00M | $-350.00M | $-302.00M | $-268.00M | $-289.00M | $-292.00M | $-283.00M | $-312.00M |
| Free Cash Flow | $760.00M | $369.00M | $533.00M | $-390.00M | $946.00M | $-52.00M | $193.00M | $-501.00M | $173.00M | $233.00M | $190.00M | $-647.00M | $1.02B | $834.00M | $1.00B | $-304.00M | $1.10B | $874.00M | $1.17B | $54.00M |
Tyson Foods Dividends
Explore Tyson Foods's dividend history, including dividend yield, payout ratio, and historical payments.
Dividend Yield
3.32%
Dividend Payout Ratio
85.50%
Dividend Paid & Capex Coverage Ratio
1.43x
Tyson Foods Dividend History
| Dividend | Adjusted Dividend | Date | Record Date | Payment Date | Declaration Date |
|---|---|---|---|---|---|
| $0.5 | $0.5 | May 30, 2025 | June 13, 2025 | February 06, 2025 | |
| $0.5 | $0.5 | February 28, 2025 | February 28, 2025 | March 14, 2025 | November 08, 2024 |
| $0.5 | $0.5 | November 29, 2024 | November 29, 2024 | December 13, 2024 | August 08, 2024 |
| $0.49 | $0.49 | August 30, 2024 | August 30, 2024 | September 13, 2024 | May 09, 2024 |
| $0.49 | $0.49 | May 31, 2024 | May 31, 2024 | June 14, 2024 | February 08, 2024 |
| $0.49 | $0.49 | February 29, 2024 | March 01, 2024 | March 15, 2024 | November 10, 2023 |
| $0.49 | $0.49 | November 30, 2023 | December 01, 2023 | December 15, 2023 | August 10, 2023 |
| $0.48 | $0.48 | August 31, 2023 | September 01, 2023 | September 15, 2023 | May 11, 2023 |
| $0.48 | $0.48 | May 31, 2023 | June 01, 2023 | June 15, 2023 | February 09, 2023 |
| $0.48 | $0.48 | February 28, 2023 | March 01, 2023 | March 15, 2023 | November 14, 2022 |
| $0.46 | $0.48 | November 30, 2022 | December 01, 2022 | December 15, 2022 | August 11, 2022 |
| $0.46 | $0.46 | August 31, 2022 | September 01, 2022 | September 15, 2022 | May 23, 2022 |
| $0.46 | $0.46 | May 31, 2022 | June 01, 2022 | June 15, 2022 | February 09, 2022 |
| $0.46 | $0.46 | February 28, 2022 | March 01, 2022 | March 15, 2022 | November 12, 2021 |
| $0.46 | $0.46 | November 30, 2021 | December 01, 2021 | December 15, 2021 | November 12, 2021 |
| $0.445 | $0.445 | August 31, 2021 | September 01, 2021 | September 15, 2021 | May 11, 2021 |
| $0.445 | $0.445 | May 28, 2021 | June 01, 2021 | June 15, 2021 | February 11, 2021 |
| $0.445 | $0.445 | February 26, 2021 | March 01, 2021 | March 15, 2021 | November 13, 2020 |
| $0.445 | $0.445 | November 30, 2020 | December 01, 2020 | December 15, 2020 | August 06, 2020 |
| $0.42 | $0.42 | August 31, 2020 | September 01, 2020 | September 15, 2020 | May 08, 2020 |
Tyson Foods News
Read the latest news about Tyson Foods, including recent articles, headlines, and updates.


Should Value Investors Buy Tyson Foods (TSN) Stock?
Here at Zacks, our focus is on the proven Zacks Rank system, which emphasizes earnings estimates and estimate revisions to find great stocks. Nevertheless, we are always paying attention to the latest value, growth, and momentum trends to underscore strong picks.


2 More Cyclical Stocks to Buy on the Dip
Last week, I (Tom Yeung) introduced you to two cyclical stocks to buy immediately. These promising firms couldn't have been more different, at least from a business perspective: Digital Realty Trust Inc. ( DLR ) is a $50 billion data center company leasing millions of square feet to AI cloud computing customers.


Are Investors Undervaluing Tyson Foods (TSN) Right Now?
Here at Zacks, our focus is on the proven Zacks Rank system, which emphasizes earnings estimates and estimate revisions to find great stocks. Nevertheless, we are always paying attention to the latest value, growth, and momentum trends to underscore strong picks.


Tyson Foods Announces Quarterly Dividend
SPRINGDALE, Ark., Feb. 06, 2025 (GLOBE NEWSWIRE) -- The Board of Directors of Tyson Foods (NYSE: TSN), at a meeting on Feb. 6, 2025, declared a quarterly dividend of $0.50 per share on Class A common stock and $0.45 per share on Class B common stock, payable on June 13, 2025, to shareholders of record at the close of business on May 30, 2025.


2 High-Yield Consumer Staples Stocks Ready to Deliver Big Returns
Tyson Foods NYSE: TSN and Clorox Company NYSE: CLX are two high-yielding consumer staples stocks on track for robust total returns this year and over the coming few. Trading near long-term lows and the low ends of trading ranges, these stocks are near historically low valuations and pay similarly high yields above 3% in early 2025.

Similar Companies
BrasilAgro - Companhia Brasileira de Propriedades Agrícolas
LND
Price: $3.86
Market Cap: $384.51M
Related Metrics
Explore detailed financial metrics and analysis for TSN.