Vroom Key Executives
This section highlights Vroom's key executives, including their titles and compensation details.
Find Contacts at Vroom
(Showing 0 of )
Vroom Earnings
This section highlights Vroom's earnings, including key dates, EPS, earnings reports, and earnings call transcripts.
Next Earnings Date
Last Earnings Results
Earnings Call Transcripts
| Transcript | Quarter | Year | Date | Estimated EPS | Actual EPS |
|---|---|---|---|---|---|
| Read Transcript | Q3 | 2023 | 2023-11-08 | N/A | N/A |
| Read Transcript | Q2 | 2023 | 2023-08-09 | N/A | N/A |
| Read Transcript | Q1 | 2023 | 2023-05-10 | N/A | N/A |

Vroom, Inc. operates as an e-commerce used automotive retailer in the United States. It operates end-to-end ecommerce platform for buying, selling, transporting, reconditioning, pricing, financing, registering, and delivering vehicles. The company was formerly known as Auto America, Inc. and changed its name to Vroom, Inc. in July 2015. The company was incorporated in 2012 and is headquartered in New York, New York.
$5.01
Stock Price
$9.13M
Market Cap
800
Employees
New York, NY
Location
Financial Statements
Access annual & quarterly financial statements for Vroom, including income statements, balance sheets, and cash flow statements..
Annual Income Statement
| Breakdown | December 31, 2024 | December 31, 2023 | December 31, 2022 | December 31, 2021 | December 31, 2020 |
|---|---|---|---|---|---|
| Revenue | $11.61M | $893.20M | $1.95B | $3.18B | $1.36B |
| Cost of Revenue | $- | $731.26M | $1.70B | $2.98B | $1.29B |
| Gross Profit | $11.61M | $161.95M | $244.79M | $202.10M | $71.55M |
| Gross Profit Ratio | 100.00% | 18.13% | 12.56% | 6.35% | 5.27% |
| Research and Development Expenses | $- | $- | $- | $- | $- |
| General and Administrative Expenses | $109.33M | $283.75M | $486.72M | $422.34M | $245.55M |
| Selling and Marketing Expenses | $- | $48.44M | $79.67M | $125.48M | $62.39M |
| Selling General and Administrative Expenses | $109.33M | $340.66M | $566.39M | $547.82M | $245.55M |
| Other Expenses | $44.17M | $91.52M | $38.29M | $12.89M | $4.60M |
| Operating Expenses | $153.50M | $432.17M | $604.68M | $560.71M | $250.14M |
| Cost and Expenses | $153.50M | $1.16B | $2.31B | $3.54B | $1.54B |
| Interest Income | $201.83M | $21.16M | $19.36M | $10.34M | $5.90M |
| Interest Expense | $65.19M | $45.45M | $40.69M | $21.95M | $9.66M |
| Depreciation and Amortization | $29.09M | $29.11M | $41.01M | $13.21M | $4.65M |
| EBITDA | $-43.11M | $-274.20M | $-392.61M | $-334.99M | $-188.41M |
| EBITDA Ratio | -371.34% | -30.70% | -20.15% | -10.52% | -13.88% |
| Operating Income | $-141.89M | $-270.23M | $-359.89M | $-358.62M | $-178.60M |
| Operating Income Ratio | -1222.11% | -30.25% | -18.47% | -11.26% | -13.15% |
| Total Other Income Expenses Net | $4.50M | $-94.70M | $100.17M | $-11.54M | $-24.12M |
| Income Before Tax | $-137.38M | $-364.93M | $-471.59M | $-370.16M | $-202.72M |
| Income Before Tax Ratio | -1183.32% | -40.86% | -24.20% | -11.62% | -14.93% |
| Income Tax Expense | $856.00K | $123.00K | $-19.68M | $754.00K | $84.00K |
| Net Income | $-165.12M | $-365.54M | $-451.91M | $-370.91M | $-202.80M |
| Net Income Ratio | -1422.26% | -40.92% | -23.19% | -11.65% | -14.94% |
| EPS | $-91.07 | $-209.70 | $-262.15 | $-217.50 | $-221.20 |
| EPS Diluted | $-91.07 | $-209.70 | $-262.15 | $-217.50 | $-221.20 |
| Weighted Average Shares Outstanding | 1.81M | 1.74M | 1.72M | 1.71M | 916.82K |
| Weighted Average Shares Outstanding Diluted | 1.81M | 1.74M | 1.72M | 1.71M | 916.82K |
| SEC Filing | Source | Source | Source | Source | Source |
| Breakdown | December 31, 2024 | September 30, 2024 | June 30, 2024 | March 31, 2024 | December 31, 2023 | September 30, 2023 | June 30, 2023 | March 31, 2023 | December 31, 2022 | September 30, 2022 | June 30, 2022 | March 31, 2022 | December 31, 2021 | September 30, 2021 | June 30, 2021 | March 31, 2021 | December 31, 2020 | September 30, 2020 | June 30, 2020 | March 31, 2020 |
|---|---|---|---|---|---|---|---|---|---|---|---|---|---|---|---|---|---|---|---|---|
| Revenue | $2.83M | $2.89M | $9.02M | $-1.86M | $235.92M | $235.63M | $225.18M | $196.47M | $209.35M | $340.80M | $475.44M | $923.77M | $934.49M | $896.76M | $761.89M | $591.12M | $405.83M | $323.00M | $253.09M | $375.77M |
| Cost of Revenue | $- | $102.68M | $27.18M | $7.63M | $218.20M | $187.54M | $179.18M | $157.66M | $179.89M | $273.47M | $409.08M | $842.13M | $889.78M | $838.67M | $698.76M | $554.94M | $385.72M | $297.56M | $245.49M | $357.38M |
| Gross Profit | $2.83M | $-99.79M | $-18.16M | $-9.49M | $17.72M | $48.09M | $46.00M | $38.80M | $29.46M | $67.33M | $66.36M | $81.64M | $44.71M | $58.09M | $63.13M | $36.18M | $20.11M | $25.45M | $7.61M | $18.39M |
| Gross Profit Ratio | 100.00% | -3453.04% | -201.32% | 510.00% | 7.51% | 20.41% | 20.43% | 19.75% | 14.07% | 19.76% | 13.96% | 8.84% | 4.78% | 6.48% | 8.29% | 6.12% | 4.95% | 7.88% | 3.01% | 4.89% |
| Research and Development Expenses | $- | $- | $- | $- | $- | $- | $- | $- | $- | $- | $- | $- | $- | $- | $- | $- | $- | $- | $- | $- |
| General and Administrative Expenses | $102.91M | $1.59M | $28.66M | $27.45M | $66.80M | $66.16M | $71.98M | $85.07M | $80.91M | $119.70M | $131.85M | $154.26M | $129.13M | $113.50M | $100.40M | $79.56M | $78.13M | $45.79M | $36.34M | $40.47M |
| Selling and Marketing Expenses | $- | $- | $4.04M | $28.73M | $10.78M | $13.43M | $14.97M | $11.47M | $9.85M | $14.95M | $21.14M | $33.73M | $37.21M | $35.21M | $23.50M | $29.56M | $17.56M | $15.34M | $11.57M | $17.91M |
| Selling General and Administrative Expenses | $102.91M | $1.59M | $32.70M | $32.08M | $77.13M | $79.59M | $86.95M | $96.54M | $90.76M | $134.64M | $152.99M | $187.99M | $166.34M | $148.72M | $123.90M | $109.11M | $78.13M | $61.13M | $47.91M | $58.38M |
| Other Expenses | $22.21M | $1.30M | $14.10M | $-1.86M | $-43.27M | $-33.54M | $-20.24M | $10.53M | $10.56M | $9.83M | $-9.16M | $7.86M | $7.00K | $10.00K | $33.00K | $15.00K | $3.00K | $26.00K | $53.00K | $823.00K |
| Operating Expenses | $125.12M | $2.89M | $23.68M | $33.94M | $77.13M | $90.60M | $97.26M | $107.07M | $101.32M | $144.48M | $163.03M | $195.85M | $169.96M | $152.09M | $126.96M | $111.71M | $79.49M | $62.32M | $48.99M | $59.35M |
| Cost and Expenses | $125.12M | $8.69M | $57.74M | $41.56M | $295.33M | $278.14M | $276.44M | $264.73M | $281.21M | $417.94M | $572.11M | $1.04B | $1.06B | $990.76M | $825.72M | $666.65M | $465.21M | $359.88M | $294.48M | $416.73M |
| Interest Income | $48.68M | $50.21M | $51.86M | $51.08M | $4.79M | $5.51M | $4.92M | $5.94M | $6.37M | $5.10M | $3.94M | $3.95M | $3.05M | $2.93M | $2.06M | $2.30M | $1.94M | $1.29M | $715.00K | $1.96M |
| Interest Expense | $15.98M | $27.39M | $14.98M | $15.73M | $14.53M | $12.06M | $8.94M | $9.92M | $12.08M | $9.70M | $9.53M | $9.38M | $7.23M | $7.03M | $3.88M | $3.81M | $3.27M | $2.26M | $1.30M | $2.83M |
| Depreciation and Amortization | $7.12M | $7.11M | $7.23M | $7.63M | $11.46M | $11.85M | $10.84M | $10.64M | $13.00M | $9.99M | $10.12M | $7.89M | $3.72M | $3.47M | $3.12M | $2.91M | $1.36M | $1.20M | $1.08M | $970.00K |
| EBITDA | $-13.15M | $-13.57M | $-10.49M | $-20.88M | $-115.64M | $-58.69M | $4.82M | $-63.03M | $231.65M | $-30.53M | $-95.19M | $-316.42M | $-118.47M | $-87.60M | $-58.61M | $-70.31M | $-56.04M | $-34.36M | $-60.79M | $-37.21M |
| EBITDA Ratio | -465.03% | -469.45% | -116.31% | 1122.74% | -49.02% | -24.91% | 2.14% | -32.08% | 110.65% | -8.96% | -20.02% | -34.25% | -12.68% | -9.77% | -7.69% | -11.90% | -13.81% | -10.64% | -24.02% | -9.90% |
| Operating Income | $-122.29M | $-29.05M | $- | $-41.56M | $-59.41M | $-42.50M | $-52.61M | $-68.26M | $-71.86M | $-77.14M | $-100.08M | $-114.21M | $-125.25M | $-94.00M | $-63.83M | $-75.53M | $-59.38M | $-36.87M | $-41.39M | $-40.96M |
| Operating Income Ratio | -4324.19% | -1005.26% | 0.00% | 2234.46% | -25.18% | -18.04% | -23.36% | -34.75% | -34.33% | -22.64% | -21.05% | -12.36% | -13.40% | -10.48% | -8.38% | -12.78% | -14.63% | -11.42% | -16.35% | -10.90% |
| Total Other Income Expenses Net | $86.04M | $-8.57M | $-167.00K | $-2.68M | $-34.77M | $-40.09M | $-13.32M | $-6.51M | $104.78M | $27.93M | $-14.75M | $-17.79M | $-4.17M | $-4.09M | $-1.78M | $-1.50M | $-1.33M | $-944.00K | $-21.79M | $-47.00K |
| Income Before Tax | $-36.25M | $-37.62M | $-19.27M | $-44.24M | $-141.62M | $-82.60M | $-65.93M | $-74.77M | $27.17M | $-50.23M | $-114.83M | $-333.70M | $-129.42M | $-98.09M | $-65.61M | $-77.03M | $-60.72M | $-37.82M | $-63.18M | $-41.01M |
| Income Before Tax Ratio | -1281.86% | -1301.73% | -213.67% | 2378.49% | -60.03% | -35.05% | -29.28% | -38.06% | 12.98% | -14.74% | -24.15% | -36.12% | -13.85% | -10.94% | -8.61% | -13.03% | -14.96% | -11.71% | -24.96% | -10.91% |
| Income Tax Expense | $463.00K | $124.00K | $-167.00K | $436.00K | $-303.00K | $260.00K | $385.00K | $273.00K | $2.40M | $899.00K | $256.00K | $-23.24M | $375.00K | $29.00K | $194.00K | $156.00K | $-54.00K | $33.00K | $52.00K | $53.00K |
| Net Income | $-36.57M | $-39.74M | $-21.19M | $-67.62M | $-141.32M | $-82.86M | $-66.32M | $-75.04M | $24.77M | $-51.13M | $-115.09M | $-310.46M | $-129.79M | $-98.12M | $-65.81M | $-77.19M | $-60.66M | $-37.85M | $-63.23M | $-41.06M |
| Net Income Ratio | -1293.28% | -1375.19% | -234.93% | 3635.32% | -59.90% | -35.16% | -29.45% | -38.20% | 11.83% | -15.00% | -24.21% | -33.61% | -13.89% | -10.94% | -8.64% | -13.06% | -14.95% | -11.72% | -24.98% | -10.93% |
| EPS | $-20.07 | $-21.99 | $-11.77 | $-37.68 | $-80.51 | $-47.45 | $-38.40 | $-43.34 | $14.34 | $-29.61 | $-0.83 | $-180.95 | $-75.82 | $-57.60 | $-38.57 | $-45.57 | $-36.71 | $-25.00 | $-160.07 | $-387.74 |
| EPS Diluted | $-20.07 | $-21.99 | $-11.77 | $-37.68 | $-80.51 | $-47.45 | $-38.13 | $-43.34 | $13.52 | $-29.61 | $-0.83 | $-180.95 | $-75.82 | $-57.40 | $-38.57 | $-45.57 | $-36.71 | $-25.00 | $-160.07 | $-387.74 |
| Weighted Average Shares Outstanding | 1.82M | 1.81M | 1.80M | 1.79M | 1.76M | 1.75M | 1.73M | 1.73M | 1.83M | 1.73M | 138.08M | 1.72M | 1.71M | 1.70M | 1.71M | 1.69M | 1.65M | 1.51M | 394.99K | 105.89K |
| Weighted Average Shares Outstanding Diluted | 1.82M | 1.81M | 1.80M | 1.79M | 1.76M | 1.75M | 1.74M | 1.73M | 1.83M | 1.73M | 138.08M | 1.72M | 1.71M | 1.71M | 1.71M | 1.69M | 1.65M | 1.51M | 394.99K | 105.89K |
| SEC Filing | Source | Source | Source | Source | Source | Source | Source | Source | Source | Source | Source | Source | Source | Source | Source | Source | Source | Source | Source | Source |
Annual Balance Sheet
| Breakdown | December 31, 2024 | December 31, 2023 | December 31, 2022 | December 31, 2021 | December 31, 2020 |
|---|---|---|---|---|---|
| Cash and Cash Equivalents | $29.34M | $135.59M | $398.92M | $1.13B | $1.06B |
| Short Term Investments | $- | $4.49M | $12.94M | $- | $- |
| Cash and Short Term Investments | $29.34M | $140.07M | $398.92M | $1.13B | $1.06B |
| Net Receivables | $517.91M | $525.19M | $348.53M | $105.43M | $60.58M |
| Inventory | $- | $163.25M | $320.65M | $726.38M | $423.65M |
| Other Current Assets | $368.16M | $124.13M | $131.42M | $138.15M | $57.44M |
| Total Current Assets | $914.48M | $952.64M | $1.22B | $2.10B | $1.60B |
| Property Plant Equipment Net | $10.94M | $31.20M | $73.77M | $52.40M | $32.23M |
| Goodwill | $- | $- | $- | $158.82M | $78.17M |
| Intangible Assets | $104.87M | $131.89M | $158.91M | $28.21M | $34.00K |
| Goodwill and Intangible Assets | $104.87M | $131.89M | $158.91M | $187.02M | $78.17M |
| Long Term Investments | $- | $- | $140.24M | $- | $- |
| Tax Assets | $- | $- | $- | $- | $- |
| Other Non-Current Assets | $35.47M | $359.70M | $26.00M | $25.03M | $15.78M |
| Total Non-Current Assets | $151.28M | $522.78M | $398.92M | $264.46M | $126.18M |
| Other Assets | $943.00K | $- | $- | $- | $- |
| Total Assets | $1.07B | $1.48B | $1.62B | $2.37B | $1.72B |
| Account Payables | $- | $2.14M | $34.70M | $52.65M | $32.92M |
| Short Term Debt | $359.91M | $753.59M | $563.48M | $519.69M | $335.28M |
| Tax Payables | $- | $4.40M | $10.02M | $39.16M | $15.44M |
| Deferred Revenue | $- | $14.03M | $10.65M | $75.80M | $24.82M |
| Other Current Liabilities | $17.05M | $82.65M | $84.46M | $139.95M | $74.24M |
| Total Current Liabilities | $376.96M | $856.81M | $703.32M | $827.26M | $482.71M |
| Long Term Debt | $392.43M | $479.36M | $422.28M | $620.21M | $12.09M |
| Deferred Revenue Non-Current | $- | $- | $- | $- | $- |
| Deferred Tax Liabilities Non-Current | $- | $- | $- | $- | $- |
| Other Non-Current Liabilities | $328.25M | $209.13M | $18.18M | $4.09M | $2.15M |
| Total Non-Current Liabilities | $720.68M | $688.49M | $440.47M | $624.30M | $14.24M |
| Other Liabilities | $- | $-192.02M | $- | $- | $- |
| Total Liabilities | $1.10B | $1.35B | $1.14B | $1.45B | $496.95M |
| Preferred Stock | $- | $- | $- | $- | $1.72B |
| Common Stock | $2.00K | $2.00K | $135.00K | $135.00K | $132.00K |
| Retained Earnings | $-2.13B | $-1.96B | $-1.60B | $-1.15B | $-777.87M |
| Accumulated Other Comprehensive Income Loss | $- | $- | $- | $- | $-1.72B |
| Other Total Stockholders Equity | $2.09B | $2.08B | $2.08B | $2.06B | $3.73B |
| Total Stockholders Equity | $-30.95M | $122.15M | $475.24M | $915.19M | $1.23B |
| Total Equity | $-30.95M | $122.15M | $475.24M | $915.19M | $1.23B |
| Total Liabilities and Stockholders Equity | $1.07B | $1.48B | $1.62B | $2.37B | $1.72B |
| Minority Interest | $- | $- | $- | $- | $- |
| Total Liabilities and Total Equity | $1.07B | $1.48B | $1.62B | $2.37B | $1.72B |
| Total Investments | $- | $4.49M | $153.17M | $- | $- |
| Total Debt | $752.34M | $1.23B | $985.76M | $1.14B | $347.38M |
| Net Debt | $723.00M | $1.10B | $586.84M | $7.58M | $-708.84M |
Balance Sheet Charts
| Breakdown | December 31, 2024 | September 30, 2024 | June 30, 2024 | March 31, 2024 | December 31, 2023 | September 30, 2023 | June 30, 2023 | March 31, 2023 | December 31, 2022 | September 30, 2022 | June 30, 2022 | March 31, 2022 | December 31, 2021 | September 30, 2021 | June 30, 2021 | March 31, 2021 | December 31, 2020 | September 30, 2020 | June 30, 2020 | March 31, 2020 |
|---|---|---|---|---|---|---|---|---|---|---|---|---|---|---|---|---|---|---|---|---|
| Cash and Cash Equivalents | $29.34M | $51.09M | $63.39M | $140.51M | $208.82M | $208.56M | $237.93M | $316.71M | $398.92M | $509.66M | $532.64M | $600.72M | $1.13B | $1.33B | $1.46B | $940.29M | $1.06B | $1.16B | $651.03M | $169.84M |
| Short Term Investments | $- | $- | $- | $- | $4.49M | $5.29M | $6.55M | $7.98M | $12.94M | $210.73M | $295.30M | $117.66M | $- | $- | $- | $- | $- | $- | $- | $- |
| Cash and Short Term Investments | $29.34M | $51.09M | $63.39M | $140.51M | $208.82M | $213.85M | $244.48M | $324.69M | $398.92M | $509.66M | $532.64M | $600.72M | $1.13B | $1.33B | $1.46B | $940.29M | $1.06B | $1.16B | $651.03M | $169.84M |
| Net Receivables | $517.91M | $864.63M | $895.55M | $889.61M | $525.19M | $421.76M | $312.70M | $209.94M | $348.53M | $248.11M | $369.89M | $236.47M | $105.43M | $89.90M | $100.49M | $93.22M | $60.58M | $33.80M | $15.29M | $35.03M |
| Inventory | $- | $- | $- | $-78.06M | $163.25M | $240.68M | $208.87M | $212.98M | $320.65M | $437.83M | $535.77M | $741.37M | $726.38M | $601.75M | $519.97M | $337.70M | $423.65M | $299.41M | $141.06M | $179.62M |
| Other Current Assets | $368.16M | $50.08M | $67.74M | $- | $124.13M | $137.41M | $123.53M | $131.35M | $131.42M | $152.88M | $215.17M | $265.27M | $138.15M | $131.96M | $87.10M | $51.27M | $57.44M | $44.22M | $39.66M | $44.77M |
| Total Current Assets | $914.48M | $965.80M | $1.01B | $1.03B | $952.64M | $1.01B | $889.57M | $878.97M | $1.22B | $1.37B | $1.67B | $1.86B | $2.10B | $2.15B | $2.17B | $1.42B | $1.60B | $1.54B | $847.05M | $429.26M |
| Property Plant Equipment Net | $10.94M | $9.86M | $11.14M | $9.16M | $31.20M | $80.06M | $77.53M | $73.17M | $73.77M | $74.91M | $61.12M | $59.98M | $52.40M | $47.55M | $39.08M | $35.51M | $32.23M | $24.39M | $25.22M | $25.64M |
| Goodwill | $- | $- | $- | $- | $- | $- | $- | $- | $- | $- | $- | $- | $158.82M | $158.82M | $159.31M | $159.31M | $78.17M | $78.17M | $78.17M | $78.17M |
| Intangible Assets | $104.87M | $111.62M | $118.38M | $125.14M | $131.89M | $138.64M | $145.40M | $152.16M | $158.91M | $165.67M | $172.43M | $179.18M | $28.21M | $29.76M | $31.32M | $32.91M | $34.00K | $160.00K | $297.00K | $434.00K |
| Goodwill and Intangible Assets | $104.87M | $111.62M | $118.38M | $125.14M | $131.89M | $138.64M | $145.40M | $152.16M | $158.91M | $165.67M | $172.43M | $179.18M | $187.02M | $188.58M | $190.62M | $192.22M | $78.17M | $78.33M | $78.47M | $78.61M |
| Long Term Investments | $- | $- | $- | $- | $336.17M | $387.80M | $454.58M | $523.18M | $140.24M | $166.38M | $213.32M | $210.52M | $- | $- | $- | $- | $- | $- | $- | $- |
| Tax Assets | $- | $- | $- | $- | $- | $-387.80M | $-454.58M | $-523.18M | $- | $- | $- | $- | $- | $- | $- | $- | $- | $- | $- | $- |
| Other Non-Current Assets | $35.47M | $36.45M | $24.51M | $57.85M | $23.53M | $414.32M | $479.37M | $547.35M | $26.00M | $29.54M | $28.53M | $29.62M | $25.03M | $23.25M | $19.81M | $16.51M | $15.78M | $13.43M | $12.47M | $13.58M |
| Total Non-Current Assets | $151.28M | $157.93M | $154.03M | $192.15M | $522.78M | $633.02M | $702.30M | $772.67M | $398.92M | $436.50M | $475.40M | $479.31M | $264.46M | $259.38M | $249.51M | $244.24M | $126.18M | $116.15M | $116.16M | $117.83M |
| Other Assets | $943.00K | $- | $19.54M | $- | $- | $- | $- | $- | $- | $- | $- | $- | $- | $- | $- | $- | $- | $- | $- | $- |
| Total Assets | $1.07B | $1.12B | $1.18B | $1.22B | $1.48B | $1.65B | $1.59B | $1.65B | $1.62B | $1.81B | $2.14B | $2.34B | $2.37B | $2.41B | $2.42B | $1.67B | $1.72B | $1.65B | $963.21M | $547.08M |
| Account Payables | $- | $- | $- | $- | $26.76M | $27.28M | $29.34M | $28.86M | $34.70M | $36.80M | $43.63M | $52.17M | $52.65M | $59.52M | $69.81M | $42.84M | $32.92M | $29.63M | $20.13M | $16.03M |
| Short Term Debt | $359.91M | $321.81M | $270.78M | $516.28M | $753.59M | $713.70M | $551.08M | $542.44M | $563.48M | $543.64M | $755.45M | $716.29M | $519.69M | $448.35M | $370.23M | $259.40M | $335.28M | $253.59M | $114.42M | $170.03M |
| Tax Payables | $- | $- | $- | $- | $4.40M | $4.85M | $5.01M | $10.24M | $10.02M | $10.27M | $19.57M | $35.57M | $39.16M | $32.12M | $28.41M | $22.79M | $15.44M | $13.18M | $11.30M | $10.20M |
| Deferred Revenue | $- | $- | $- | $- | $14.03M | $12.49M | $16.72M | $13.04M | $10.65M | $16.31M | $17.80M | $73.35M | $75.80M | $64.09M | $41.65M | $48.24M | $24.82M | $17.30M | $15.49M | $12.82M |
| Other Current Liabilities | $17.05M | $17.30M | $- | $37.58M | $58.03M | $64.87M | $65.20M | $63.51M | $84.46M | $112.70M | $109.66M | $139.94M | $139.95M | $139.48M | $148.91M | $81.88M | $74.24M | $50.84M | $42.71M | $37.88M |
| Total Current Liabilities | $376.96M | $339.12M | $270.78M | $516.28M | $856.81M | $823.18M | $667.36M | $658.08M | $703.32M | $719.72M | $946.11M | $1.02B | $827.26M | $743.55M | $659.00M | $455.14M | $482.71M | $364.53M | $204.06M | $246.97M |
| Long Term Debt | $392.43M | $740.77M | $806.32M | $557.95M | $479.36M | $548.29M | $568.86M | $572.93M | $422.28M | $628.41M | $682.68M | $696.36M | $620.21M | $621.14M | $621.31M | $13.46M | $12.09M | $10.67M | $11.75M | $13.06M |
| Deferred Revenue Non-Current | $- | $- | $- | $- | $- | $- | $- | $- | $- | $- | $- | $- | $- | $- | $- | $- | $- | $- | $- | $- |
| Deferred Tax Liabilities Non-Current | $- | $- | $- | $- | $- | $- | $- | $- | $- | $- | $- | $- | $- | $- | $- | $- | $- | $- | $- | $- |
| Other Non-Current Liabilities | $328.25M | $44.96M | $60.46M | $48.97M | $17.11M | $16.97M | $17.41M | $18.38M | $18.18M | $15.70M | $18.46M | $16.68M | $4.09M | $4.20M | $3.58M | $2.50M | $2.15M | $1.89M | $1.97M | $2.14M |
| Total Non-Current Liabilities | $720.68M | $785.73M | $866.78M | $644.50M | $496.46M | $565.26M | $586.27M | $591.32M | $440.47M | $644.11M | $701.14M | $713.04M | $624.30M | $625.34M | $624.89M | $15.96M | $14.24M | $12.56M | $13.71M | $15.19M |
| Other Liabilities | $- | $-5.79M | $- | $1 | $1 | $- | $- | $- | $- | $- | $- | $- | $- | $- | $- | $- | $- | $- | $- | $- |
| Total Liabilities | $1.10B | $1.12B | $1.14B | $1.16B | $1.35B | $1.39B | $1.25B | $1.25B | $1.14B | $1.36B | $1.65B | $1.73B | $1.45B | $1.37B | $1.28B | $471.11M | $496.95M | $377.09M | $217.77M | $262.16M |
| Preferred Stock | $- | $- | $- | $- | $- | $1 | $- | $1 | $- | $- | $0 | $- | $- | $- | $- | $- | $- | $1.65B | $963.21M | $901.05M |
| Common Stock | $2.00K | $2.00K | $2.00K | $2.00K | $2.00K | $135.00K | $135.00K | $135.00K | $135.00K | $135.00K | $135.00K | $135.00K | $135.00K | $135.00K | $134.00K | $134.00K | $132.00K | $130.00K | $119.00K | $94.00K |
| Retained Earnings | $-2.13B | $-2.09B | $-2.05B | $-2.03B | $-1.97B | $-1.82B | $-1.74B | $-1.68B | $-1.60B | $-1.63B | $-1.57B | $-1.46B | $-1.15B | $-1.02B | $-920.87M | $-855.06M | $-777.87M | $-717.21M | $-679.36M | $-616.13M |
| Accumulated Other Comprehensive Income Loss | $- | $- | $-0 | $- | $- | $0 | $- | $0 | $- | $- | $-0 | $0 | $- | $- | $0 | $- | $0 | $-12.16M | $-11.30M | $-10.35M |
| Other Total Stockholders Equity | $2.09B | $2.09B | $2.09B | $2.09B | $2.09B | $2.08B | $2.08B | $2.08B | $2.08B | $2.07B | $2.07B | $2.07B | $2.06B | $2.06B | $2.06B | $2.05B | $2.00B | $1.99B | $1.42B | $- |
| Total Stockholders Equity | $-30.95M | $4.68M | $43.14M | $61.49M | $122.15M | $258.27M | $338.24M | $402.24M | $475.24M | $445.13M | $495.05M | $608.36M | $915.19M | $1.04B | $1.14B | $1.20B | $1.23B | $1.28B | $745.43M | $284.92M |
| Total Equity | $-30.95M | $4.68M | $43.14M | $61.49M | $122.15M | $258.27M | $338.24M | $402.24M | $475.24M | $445.13M | $495.05M | $608.36M | $915.19M | $1.04B | $1.14B | $1.20B | $1.23B | $1.28B | $745.43M | $284.92M |
| Total Liabilities and Stockholders Equity | $1.07B | $1.12B | $1.18B | $1.22B | $1.48B | $1.65B | $1.59B | $1.65B | $1.62B | $1.81B | $2.14B | $2.34B | $2.37B | $2.41B | $2.42B | $1.67B | $1.72B | $1.65B | $963.21M | $547.08M |
| Minority Interest | $- | $- | $- | $- | $- | $- | $- | $- | $- | $- | $- | $- | $- | $- | $- | $- | $- | $- | $- | $- |
| Total Liabilities and Total Equity | $1.07B | $1.12B | $1.18B | $1.22B | $1.48B | $1.65B | $1.59B | $1.65B | $1.62B | $1.81B | $2.14B | $2.34B | $2.37B | $2.41B | $2.42B | $1.67B | $1.72B | $1.65B | $963.21M | $547.08M |
| Total Investments | $- | $- | $- | $- | $336.17M | $5.29M | $6.55M | $7.98M | $153.17M | $377.11M | $13.43M | $328.18M | $- | $- | $- | $- | $- | $- | $- | $- |
| Total Debt | $752.34M | $1.06B | $1.08B | $1.07B | $1.23B | $1.26B | $1.12B | $1.12B | $985.76M | $1.17B | $1.44B | $1.41B | $1.14B | $1.07B | $991.53M | $272.86M | $347.38M | $264.26M | $126.17M | $183.08M |
| Net Debt | $723.00M | $1.01B | $1.01B | $933.72M | $1.02B | $1.05B | $882.02M | $798.66M | $586.84M | $662.39M | $905.49M | $811.93M | $7.58M | $-257.06M | $-472.04M | $-667.43M | $-708.84M | $-897.10M | $-524.86M | $13.24M |
Annual Cash Flow
| Breakdown | December 31, 2024 | December 31, 2023 | December 31, 2022 | December 31, 2021 | December 31, 2020 |
|---|---|---|---|---|---|
| Net Income | $-138.24M | $-365.54M | $-451.91M | $-370.91M | $-202.80M |
| Depreciation and Amortization | $29.09M | $45.28M | $24.11M | $13.21M | $4.65M |
| Deferred Income Tax | $- | $- | $-23.86M | $9.47M | $27.10M |
| Stock Based Compensation | $5.88M | $10.05M | $11.96M | $13.41M | $13.25M |
| Change in Working Capital | $7.28M | $-326.20M | $302.28M | $-246.36M | $-200.73M |
| Accounts Receivables | $417.00K | $754.00K | $78.06M | $-53.21M | $-32.07M |
| Inventory | $- | $159.76M | $403.92M | $-312.21M | $-224.49M |
| Accounts Payables | $- | $-7.94M | $-24.28M | $19.32M | $14.07M |
| Other Working Capital | $6.86M | $-478.78M | $-155.43M | $99.73M | $41.76M |
| Other Non Cash Items | $-1.05M | $102.73M | $28.35M | $12.49M | $3.27M |
| Net Cash Provided by Operating Activities | $-97.04M | $-533.68M | $-109.06M | $-568.69M | $-355.25M |
| Investments in Property Plant and Equipment | $-3.49M | $-14.80M | $-24.23M | $-28.41M | $-11.33M |
| Acquisitions Net | $- | $- | $-267.49M | $-75.88M | $- |
| Purchases of Investments | $- | $- | $- | $- | $- |
| Sales Maturities of Investments | $- | $- | $- | $- | $- |
| Other Investing Activities | $136.06M | $187.96M | $127.51M | $-104.29M | $- |
| Net Cash Used for Investing Activities | $132.57M | $173.15M | $-164.21M | $-104.29M | $-11.33M |
| Debt Repayment | $-14.45M | $98.99M | $-465.28M | $808.57M | $155.77M |
| Common Stock Issued | $- | $2.40M | $- | $5.77M | $1.07B |
| Common Stock Repurchased | $- | $- | $- | $- | $- |
| Dividends Paid | $- | $- | $- | $- | $- |
| Other Financing Activities | $-151.54M | $-4.05M | $-4.21M | $-10.86M | $1.10B |
| Net Cash Used Provided by Financing Activities | $-165.99M | $97.34M | $-469.49M | $797.71M | $1.24B |
| Effect of Forex Changes on Cash | $- | $- | $- | $- | $- |
| Net Change in Cash | $-130.45M | $-263.19M | $-742.76M | $124.74M | $870.45M |
| Cash at End of Period | $78.37M | $208.82M | $472.01M | $1.21B | $1.09B |
| Cash at Beginning of Period | $208.82M | $472.01M | $1.21B | $1.09B | $219.59M |
| Operating Cash Flow | $-97.04M | $-533.68M | $-109.06M | $-568.69M | $-355.25M |
| Capital Expenditure | $-3.49M | $-14.80M | $-24.23M | $-28.41M | $-11.33M |
| Free Cash Flow | $-100.52M | $-536.31M | $-133.30M | $-597.10M | $-366.58M |
Cash Flow Charts
| Breakdown | December 31, 2024 | September 30, 2024 | June 30, 2024 | March 31, 2024 | December 31, 2023 | September 30, 2023 | June 30, 2023 | March 31, 2023 | December 31, 2022 | September 30, 2022 | June 30, 2022 | March 31, 2022 | December 31, 2021 | September 30, 2021 | June 30, 2021 | March 31, 2021 | December 31, 2020 | September 30, 2020 | June 30, 2020 | March 31, 2020 |
|---|---|---|---|---|---|---|---|---|---|---|---|---|---|---|---|---|---|---|---|---|
| Net Income | $-36.71M | $-37.75M | $-19.10M | $-44.68M | $-141.32M | $-82.86M | $-66.32M | $-75.04M | $24.77M | $-51.13M | $-115.09M | $-310.46M | $-129.79M | $-98.12M | $-65.81M | $-77.19M | $-60.66M | $-37.85M | $-63.23M | $-41.06M |
| Depreciation and Amortization | $7.12M | $7.11M | $7.23M | $7.63M | $11.46M | $11.25M | $10.54M | $5.32M | $-3.89M | $9.99M | $10.12M | $7.89M | $3.72M | $3.47M | $3.12M | $2.91M | $1.40M | $1.20M | $1.09M | $970.00K |
| Deferred Income Tax | $- | $-286.00K | $- | $- | $383.38M | $-866.00K | $-10.22M | $- | $- | $899.00K | $256.00K | $-23.86M | $3.85M | $2.53M | $5.64M | $-2.55M | $3.67M | $4.53M | $14.92M | $3.98M |
| Stock Based Compensation | $936.00K | $1.01M | $2.45M | $1.32M | $2.80M | $2.70M | $2.10M | $1.68M | $5.34M | $900.00K | $1.78M | $3.63M | $3.65M | $1.54M | $5.39M | $2.82M | $4.32M | $4.23M | $4.10M | $600.00K |
| Change in Working Capital | $8.27M | $149.57M | $-63.26M | $-86.31M | $-66.88M | $-33.32M | $10.87M | $108.30M | $83.83M | $110.58M | $145.88M | $-38.02M | $-130.49M | $-86.17M | $-131.18M | $101.47M | $-122.44M | $-155.91M | $67.31M | $10.31M |
| Accounts Receivables | $-43.00K | $489.00K | $- | $342.00K | $345.69M | $77.00K | $-439.00K | $4.31M | $14.81M | $29.06M | $38.52M | $-4.33M | $-20.27M | $8.46M | $-8.25M | $-33.14M | $-27.77M | $-19.16M | $19.39M | $-4.53M |
| Inventory | $- | $- | $- | $- | $63.92M | $-27.75M | $8.61M | $114.98M | $110.33M | $100.97M | $208.07M | $-15.45M | $-128.48M | $-84.32M | $-187.91M | $88.50M | $-127.91M | $-162.83M | $44.55M | $21.70M |
| Accounts Payables | $- | $- | $- | $- | $-518.00K | $-2.06M | $484.00K | $-5.84M | $-2.10M | $-6.83M | $-8.53M | $-6.82M | $-6.82M | $-10.36M | $26.94M | $9.57M | $3.59M | $9.56M | $3.86M | $-2.94M |
| Other Working Capital | $8.31M | $149.08M | $-63.26M | $-86.65M | $-475.97M | $-3.58M | $2.22M | $-5.15M | $-39.21M | $-12.62M | $-55.55M | $-11.41M | $25.08M | $54.00K | $38.05M | $36.54M | $29.65M | $16.52M | $-482.00K | $-3.93M |
| Other Non Cash Items | $-1.76M | $-230.63M | $6.38M | $161.39M | $-297.49M | $-90.60M | $-94.29M | $-125.64M | $-196.01M | $42.86M | $-166.06M | $345.73M | $5.83M | $3.14M | $1.42M | $2.09M | $1.33M | $934.00K | $952.00K | $55.00K |
| Net Cash Provided by Operating Activities | $-22.14M | $-110.98M | $-66.30M | $23.12M | $-108.05M | $-193.51M | $-147.10M | $-85.02M | $-85.96M | $114.42M | $-122.44M | $-15.08M | $-243.23M | $-173.61M | $-181.41M | $29.55M | $-172.38M | $-182.88M | $25.15M | $-25.14M |
| Investments in Property Plant and Equipment | $-1.38M | $-1.19M | $-282.00K | $-644.00K | $-3.25M | $-3.03M | $-3.33M | $-5.19M | $-4.27M | $-3.92M | $-8.95M | $-7.10M | $-9.63M | $-9.84M | $-5.70M | $-3.24M | $-6.27M | $-1.93M | $-1.43M | $-1.70M |
| Acquisitions Net | $- | $- | $- | $- | $-11.41M | $- | $- | $11.41M | $- | $- | $706.00K | $-268.19M | $- | $270.00K | $- | $-76.14M | $- | $- | $- | $- |
| Purchases of Investments | $- | $- | $- | $- | $- | $- | $- | $- | $- | $- | $- | $- | $- | $- | $- | $- | $- | $- | $- | $- |
| Sales Maturities of Investments | $- | $- | $- | $- | $- | $- | $- | $- | $- | $- | $- | $- | $- | $- | $- | $- | $- | $- | $- | $- |
| Other Investing Activities | $25.98M | $32.30M | $36.06M | $41.72M | $50.37M | $45.78M | $51.20M | $40.60M | $21.32M | $49.23M | $-6.37M | $63.33M | $- | $- | $- | $- | $- | $- | $- | $- |
| Net Cash Used for Investing Activities | $24.61M | $31.11M | $35.78M | $41.07M | $35.71M | $42.75M | $47.88M | $46.82M | $17.06M | $45.30M | $-14.61M | $-211.96M | $-9.63M | $-9.57M | $-5.70M | $-79.38M | $-6.27M | $-1.93M | $-1.43M | $-1.70M |
| Debt Repayment | $-22.25M | $-12.80M | $1.90M | $18.71M | $-7.73M | $- | $30.59M | $-44.94M | $-87.68M | $-241.51M | $26.37M | $-189.33M | $71.33M | $77.86M | $- | $-76.19M | $80.26M | $139.18M | $-55.38M | $-8.33M |
| Common Stock Issued | $- | $- | $- | $- | $2.40M | $- | $- | $- | $- | $- | $- | $- | $5.77M | $704.00K | $1.56M | $2.82M | $1.00K | $569.47M | $- | $- |
| Common Stock Repurchased | $- | $- | $- | $- | $- | $- | $- | $- | $- | $- | $- | $- | $- | $- | $- | $- | $- | $-2.04M | $-878.00K | $-1.82M |
| Dividends Paid | $- | $- | $- | $- | $- | $- | $- | $- | $- | $- | $- | $- | $- | $- | $- | $- | $-399.16M | $-377.32M | $- | $- |
| Other Financing Activities | $-8.00K | $-30.00K | $-286.00K | $-151.22M | $-191.00K | $135.61M | $-15.84M | $-156.00K | $24.63M | $-633.00K | $-469.00K | $-875.00K | $186.00K | $750.00K | $720.96M | $2.82M | $-897.00K | $-5.38M | $-937.00K | $19.75M |
| Net Cash Used Provided by Financing Activities | $-22.26M | $-12.83M | $1.61M | $-132.51M | $-7.92M | $135.61M | $14.75M | $-45.10M | $-63.05M | $-242.14M | $25.90M | $-190.20M | $71.51M | $78.61M | $720.96M | $-73.37M | $79.37M | $701.24M | $446.82M | $9.60M |
| Effect of Forex Changes on Cash | $- | $- | $- | $- | $83.30M | $- | $-83.30M | $- | $- | $- | $- | $- | $- | $- | $- | $- | $- | $- | $- | $- |
| Net Change in Cash | $-19.79M | $-13.44M | $-28.91M | $-68.31M | $-80.26M | $-15.15M | $-84.48M | $-83.30M | $-131.96M | $-82.42M | $-111.15M | $-417.25M | $-181.34M | $-104.57M | $533.85M | $-123.20M | $-99.28M | $516.43M | $470.55M | $-17.24M |
| Cash at End of Period | $78.37M | $98.16M | $111.60M | $140.51M | $208.82M | $289.08M | $304.23M | $388.71M | $472.01M | $603.97M | $686.38M | $797.53M | $1.21B | $1.40B | $1.50B | $966.84M | $1.09B | $1.19B | $672.89M | $202.34M |
| Cash at Beginning of Period | $98.16M | $111.60M | $140.51M | $208.82M | $289.08M | $304.23M | $388.71M | $472.01M | $603.97M | $686.38M | $797.53M | $1.21B | $1.40B | $1.50B | $966.84M | $1.09B | $1.19B | $672.89M | $202.34M | $219.59M |
| Operating Cash Flow | $-22.14M | $-110.98M | $-66.30M | $23.12M | $-108.05M | $-193.51M | $-147.10M | $-85.02M | $-85.96M | $114.42M | $-122.44M | $-15.08M | $-243.23M | $-173.61M | $-181.41M | $29.55M | $-172.38M | $-182.88M | $25.15M | $-25.14M |
| Capital Expenditure | $-1.38M | $-1.19M | $-282.00K | $-644.00K | $-3.25M | $-3.03M | $-3.33M | $-5.19M | $-4.27M | $-3.92M | $-8.95M | $-7.10M | $-9.63M | $-9.84M | $-5.70M | $-3.24M | $-6.27M | $-1.93M | $-1.43M | $-1.70M |
| Free Cash Flow | $-23.52M | $-112.16M | $-66.58M | $22.48M | $-111.31M | $-196.54M | $-150.43M | $-90.21M | $-90.23M | $110.50M | $-131.39M | $-22.17M | $-252.86M | $-183.45M | $-187.11M | $26.32M | $-178.65M | $-184.81M | $23.72M | $-26.84M |
Vroom Dividends
Explore Vroom's dividend history, including dividend yield, payout ratio, and historical payments.
Vroom News
Read the latest news about Vroom, including recent articles, headlines, and updates.
Vroom Announces Fourth Quarter and Full Year 2024 Results
NEW YORK--(BUSINESS WIRE)--Vroom, Inc. (Nasdaq:VRM) today announced financial results for the fourth quarter and fiscal year ended December 31, 2024. HIGHLIGHTS OF FOURTH QUARTER AND FULL YEAR 2024 $57.5 million consolidated total cash and excess liquidity as of December 31, 2024 $29.3 million cash and cash equivalents as of December 31, 2024 $28.2 million of liquidity available to UACC under the warehouse credit facilities $(36.7) million and $(138.2) million net loss from continuing operation.

Vroom Provides Update on Relisting of Common Stock and Q4 2024 Liquidity
NEW YORK--(BUSINESS WIRE)--Vroom, Inc. (the “Company”), a leading automotive finance company and a data and AI-powered analytics and digital services platform supporting the automotive industry, today provided an update regarding the relisting of the Company's common stock on the Nasdaq Stock Market LLC and certain preliminary unaudited financial results for the fourth quarter 2024, following the Company's recapitalization of its previously issued unsecured convertible senior notes. Vroom has r.

Vroom Completes Recapitalization
NEW YORK--(BUSINESS WIRE)--Vroom, Inc., a leading automotive finance company and a data, AI-powered analytics and digital services platform supporting the automotive industry, today announced that as of January 14, 2025, it has successfully completed its recapitalization of unsecured convertible senior notes and emerged from the prepackaged Chapter 11 case it voluntarily filed in the U.S. Bankruptcy Court for the Southern District of Texas. Vroom emerges without any long-term debt at Vroom, Inc.

Vroom Files for Bankruptcy, Says Subsidiaries Not Expected to Follow
Automotive finance company and digital services platform Vroom filed for Chapter 11 bankruptcy Wednesday (Nov. 13), saying in a filing with the Securities and Exchange Commission (SEC) that it plans to operate its business as a “debtor-in-possession” under the jurisdiction of the bankruptcy court.

Vroom Announces Third Quarter 2024 Results
NEW YORK--(BUSINESS WIRE)--Vroom, Inc. (Nasdaq:VRM) today announced financial results for the third quarter ended September 30, 2024. HIGHLIGHTS OF THIRD QUARTER 2024 $51.1 million cash and cash equivalents as of September 30, 2024 $32.9 million of liquidity available to UACC under the warehouse credit facilities $(37.7) million net loss from continuing operations $(25.5) million Adjusted EBITDA1 Entered into an agreement to restructure $290 million of unsecured convertible notes, into equity t.

Vroom Announces Equity-for-Debt Recapitalization
NEW YORK--(BUSINESS WIRE)--Vroom, Inc. (Nasdaq: VRM), a leading automotive finance company and an AI-powered analytics and digital services platform for automotive retail, today announced that it has made the strategic decision to enter into a Restructuring Support Agreement (RSA) with holders of an overwhelming majority of its outstanding funded debt and its largest stockholder. The parties to the RSA have agreed to pursue a comprehensive transaction that will restructure Vroom, Inc.'s outstan.

Vroom Shifts Focus to Core Assets and Future Growth
In a move to redefine its future, used car digital marketplace Vroom on Tuesday (Sept. 23) said it completed the wind-down of its eCommerce and used vehicle dealership operations and released a long-term strategic plan leveraging its assets like United Auto Credit Corporation (UACC), a leading automotive finance company; and CarStory, a leader in AI-powered analytics and digital services for automotive retail.

Vroom Released Long-term Strategic Plan
NEW YORK--(BUSINESS WIRE)--Vroom, Inc. (Nasdaq: VRM) today released an investor presentation (the “Investor Presentation”) which includes the Company's long-term strategic plan and key initiatives. A copy of the Investor Presentation is available at ir.vroom.com. On January 22, 2024, the Company announced a Value Maximization Plan, pursuant to which the Company discontinued its ecommerce operations and wound down its used vehicle dealership. Since the announcement in January, the Company has be.


Vroom Announces Second Quarter 2024 Results
NEW YORK--(BUSINESS WIRE)--Vroom, Inc. (Nasdaq:VRM) today announced financial results for the second quarter ended June 30, 2024. HIGHLIGHTS OF SECOND QUARTER 2024 $63.4 million cash and cash equivalents as of June 30, 2024 $34.0 million of liquidity available to UACC under the warehouse credit facilities $(19.1) million net loss from continuing operations $(7.5) million Adjusted EBITDA Successfully Completed UACC Securitization Transaction in April 2024 Tom Shortt, the Company's Chief Executiv.


Vroom to Release Second Quarter 2024 Earnings on August 8, 2024
NEW YORK--(BUSINESS WIRE)--Vroom, Inc. (Nasdaq: VRM) today announced that it will release its financial results for the second quarter ending June 30, 2024, after the market closes on Thursday, August 8, 2024. About Vroom (Nasdaq: VRM) Vroom owns and operates United Auto Credit Corporation (UACC), a leading automotive lender serving the independent and franchise dealer market nationwide, and CarStory, a leader in AI-powered analytics and digital services for automotive retail. During fiscal 202.

Vroom! 3 EV Stocks With the Potential to Outrun the Competition.
Electric vehicles are in the news again but this time for a positive reason. In news that broke earlier in the week, German automotive giant Volkswagen (OTCMKTS: VWAGY ) will invest up to $5 billion into Rivian Automotive (NASDAQ: RIVN ).

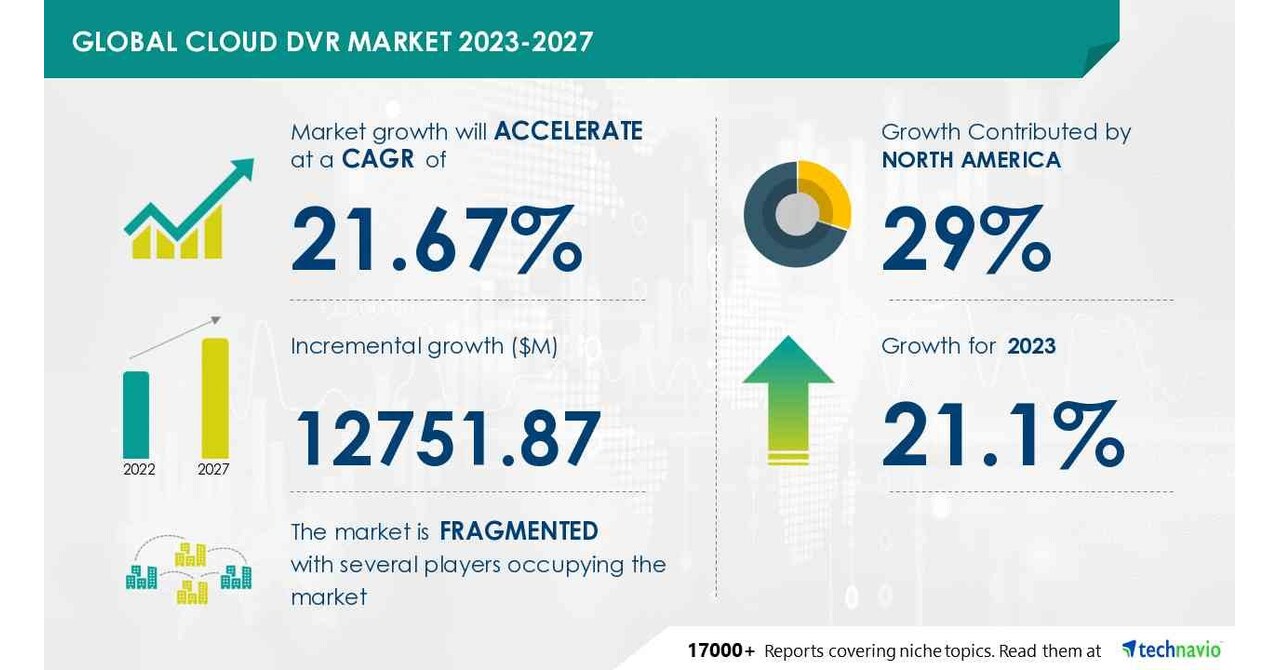
Cloud Dvr Market size is set to grow by USD 25.53 Billion from 2024-2028, emergence of technologically advanced devices to boost the market growth, Technavio
NEW YORK, May 20, 2024 /PRNewswire/ -- The global cloud dvr market size is estimated to grow by USD 25526.4 million from 2024-2028, according to Technavio. The market is estimated to grow at a CAGR of 30.29% during the forecast period. For more insights on the forecast market size and historic data (2018 - 2022) - Download Free sample report in a minutes Key Market Trends Fueling Growth The cloud DVR market has experienced significant growth due to advances in technology, with vendors investing heavily in the development of new devices. Since the introduction of Roku in 2008, video streaming has evolved from modern STBs to plug-and-play devices like Roku streaming stick and Google Chromecast. Key features include cloud DVR, hard drives, digital signals, central cloud storage, customer preferences for TV shows and live events, hybrid cloud DVRs, IPTV, and satellite DVRs. Adoption of OTT services, pay-TV providers, and on-demand services has accelerated, offering business opportunities and addressing regulatory frameworks, copyright instructions, and TV viewer demands for personalized ads, time-shifted content, and as-a-service options. Technologies like Velocix, Broadpeak, and SaaS platforms enable advanced features such as multi-device activation, addressable advertising, SSAI, ad insertion, ad replacement, and personalised ads. Market Challenges • The Cloud DVR market is experiencing challenges due to the increasing popularity of free Internet TV services like YouTube and Hulu. Paid TV providers are facing revenue losses as consumers opt for these cost-effective alternatives. Key technologies like POD content, OTT services, and Internet are transforming the video landscape. Regulatory frameworks and copyright instructions are crucial in this context. TV viewers can now access on-demand services on multiple devices, enabling personalised ads through Addressable advertising and SSAI. Businesses, both commercial and residential, are adopting these technologies at varying paces, influenced by economic, political, and social scenarios. Monetisation techniques, including ad insertion, ad replacement, and personalised ads, are essential for video service providers. The lifecycle of these services is influenced by factors like multi-device activation, time-shifted content, and as-a-service options. Cloud VRM and SaaS platforms, managed by dedicated teams, are facilitating these advancements. Inorganic growth through acquisitions and partnerships is a common strategy in this industry. Research report provides comprehensive data on impact of trend, driver and challenges - Buy Report Segment Overview This cloud dvr market report extensively covers market segmentation by 1.1 Hybrid - The Cloud DVR market is experiencing significant growth, driven by the adoption of Managed services teams and innovative Monetisation techniques by businesses in both commercial and residential sectors. Hybrid cloud DVRs, which support Digital signals from both IPTV and Satellite DVRs, are gaining traction. These systems enable customers to access POD content, OTT services, and live TV shows via the Internet. The versatility of Cloud DVRs allows for the storage of both broadcast and broadband content from TV. Key players in the market include Velocix and Broadpeak. Inorganic Growth through acquisitions and partnerships is a common strategy. The market's expansion is influenced by various economic, political, and social scenarios. Pricing analysis is crucial in understanding consumer buying behavior. Regulatory frameworks and Copyright instructions play a significant role in shaping the market. TV viewers increasingly prefer On-demand services, leading Television networks to invest in Cloud DVR technology. Ad-skipping and time-shifting features are key consumer benefits. Hybrid cloud DVRs offer a central cloud storage solution, making them an attractive alternative to physical boxes. Pay-TV providers and Video service providers are major operators in the market. The adoption pace of Cloud DVR technology is accelerating, with the technology poised to revolutionize the way we consume TV shows and live events. For more information on market segmentation with geographical analysis including forecast (2024-2028) and historic data (2018 - 2022) - Download a Sample Report Research Analysis The Cloud DVR market is experiencing significant growth as more customers opt for on-demand services and multi-device activation. Central cloud storage enables the recording and playback of TV shows and live events, offering flexibility and convenience. Operators and technology providers are adopting this innovative solution to meet the economic, political, and social scenarios of the residential and commercial sectors. Hard drives and digital signals are essential components of Cloud DVR systems, ensuring efficient storage and transmission of content. Addressable advertising and SSAI (Server-Side Ad Insertion) technologies enhance the commercial value of this product or service in the application industries. The lifecycle of Cloud DVR is expected to continue its upward trend as the adoption pace accelerates. Market Research Overview The Cloud DVR market is experiencing significant growth due to the increasing demand for video on-demand services. This technology allows users to record and store digital video content over the internet, providing flexibility and convenience. The integration of AI and machine learning in Cloud DVR systems enhances the user experience by enabling advanced features such as content recommendation and personalized viewing. The market is driven by key players offering customizable solutions, including adaptive bitrate streaming and parental controls. The future of Cloud DVR lies in its ability to provide seamless integration with various devices and platforms, ensuring a consistent user experience across multiple screens. Additionally, the ongoing development of 5G technology is expected to further boost the market's growth by enabling faster and more reliable streaming. Overall, the Cloud DVR market is poised for continued expansion, offering numerous opportunities for businesses and consumers alike. Table of Contents: 1 Executive Summary2 Market Landscape3 Market Sizing4 Historic Market Size5 Five Forces Analysis6 Market Segmentation 7 Customer Landscape8 Geographic Landscape9 Drivers, Challenges, and Trends10 Company Landscape11 Company Analysis12 Appendix About Technavio Technavio is a leading global technology research and advisory company. Their research and analysis focuses on emerging market trends and provides actionable insights to help businesses identify market opportunities and develop effective strategies to optimize their market positions. With over 500 specialized analysts, Technavio's report library consists of more than 17,000 reports and counting, covering 800 technologies, spanning across 50 countries. Their client base consists of enterprises of all sizes, including more than 100 Fortune 500 companies. This growing client base relies on Technavio's comprehensive coverage, extensive research, and actionable market insights to identify opportunities in existing and potential markets and assess their competitive positions within changing market scenarios. Contacts Technavio ResearchJesse MaidaMedia & Marketing ExecutiveUS: +1 844 364 1100UK: +44 203 893 3200Email: [email protected]Website: www.technavio.com/
Vroom Announces First Quarter 2024 Results
NEW YORK--(BUSINESS WIRE)--Vroom, Inc. (Nasdaq:VRM) today announced financial results for the first quarter ended March 31, 2024. HIGHLIGHTS OF FIRST QUARTER 2024 $91.0 million cash and cash equivalents as of March 31, 2024 $(44.7) million net loss from continuing operations $(32.2) million Adjusted EBITDA Substantially completed the ecommerce wind-down Adopted new reporting segments to align with continuing operations at United Auto Credit (UACC) and CarStory Tom Shortt, the Company's Chief Ex.

Vroom to Release First Quarter 2024 Earnings on May 9, 2024
NEW YORK--(BUSINESS WIRE)--Vroom, Inc. (Nasdaq: VRM) today announced that it will release its financial results for the first quarter ending March 31, 2024, after the market closes on Thursday, May 9, 2024. About Vroom (Nasdaq: VRM) Vroom owns and operates United Auto Credit Corporation (UACC), a leading automotive lender serving the independent and franchise dealer market nationwide, and CarStory, a leader in AI-powered analytics and digital services for automotive retail. During fiscal 2023,.

Vroom Delivery and Finix Team on Convenience Store Payments
Convenience store commerce platform Vroom Delivery has launched a partnership with payment processor Finix. The collaboration, announced Monday (April 8), is centered around the creation of a new tool called Pay360, which the companies say is the first online payment solution designed for the convenience store sector, allowing for the secure online sale of age-restricted products.

Vroom Completes Wind-Down of eCommerce, Used Vehicle Dealership Businesses
Vroom completed the previously announced wind-down of its eCommerce and used vehicle dealership businesses. The company ended transactions through vroom.com, completed previously contracted transactions, sold “substantially all” of its used vehicle inventory and paid off a vehicle floorplan financing facility, Vroom said in a Thursday (April 4) filing with the Securities and Exchange Commission.


Vroom Announces Fourth Quarter and Full Year 2023 Results
NEW YORK--(BUSINESS WIRE)--Vroom, Inc. (Nasdaq:VRM) today announced financial results for the fourth quarter and fiscal year ended December 31, 2023. HIGHLIGHTS OF FOURTH QUARTER AND FULL YEAR 2023 $135.6 million cash and cash equivalents as of December 31, 2023 4,780 and 17,401 Ecommerce units sold for the fourth quarter and full year, respectively, representing third consecutive quarter of Ecommerce unit growth $4,742 and $3,403 Ecommerce gross profit per unit (GPPU) for the fourth quarter an.


Vroom to Release Fourth Quarter and Fiscal Year 2023 Earnings on March 13, 2024
NEW YORK--(BUSINESS WIRE)--Vroom, Inc. (Nasdaq: VRM) today announced that it will release its financial results for the fourth quarter and fiscal year ended December 31, 2023 after the market closes on Wednesday, March 13, 2024. About Vroom (Nasdaq: VRM) Vroom owns and operates United Auto Credit Corporation (UACC), a leading automotive lender serving the independent and franchise dealer market nationwide, and CarStory, a leader in AI-powered analytics and digital services for automotive retail.


Vroom hits the brakes on its online used car business to go full throttle on auto financing and AI
Vroom is shutting down its online used car marketplace and shifting all of its resources and capital into two business units focused on auto financing and AI-powered analytics. About 800 employees, or 90% of its workforce, will lose their jobs as a result, according to a regulatory filing.

VRM Stock Alert: Once-Hot Vroom Is Winding Down Operations
Vroom (NASDAQ: VRM ) stock is plunging over 40% in early trading after the used-car retailer announced that it had suspended its e-commerce business. Moreover, the firm disclosed that it would be “winding down” its dealerships and laying off 90% of its employees.

Why Is Vroom (VRM) Stock Down 44% Today?
Vroom (NASDAQ: VRM ) stock is falling on Tuesday after the used-car selling and buying e-commerce company announced plans to wind down its business. A press release from Vroom reveals that it will discontinue its e-commerce operations while winding down its used vehicle dealership business.

Vroom Stock Plunges After Winding Down E-Commerce Business—Key Chart Levels to Monitor
Shares of vehicle e-commerce platform Vroom (VRM) plunged over 50% ahead of the opening bell Tuesday after the company said it plans to discontinue its e-commerce operations and wind down its used vehicle dealership business to shore-up its liquidity and maximize stakeholder value.

Similar Companies
Related Metrics
Explore detailed financial metrics and analysis for VRM.