Western Copper and Gold Key Executives
This section highlights Western Copper and Gold's key executives, including their titles and compensation details.
Find Contacts at Western Copper and Gold
(Showing 0 of )
Western Copper and Gold Earnings
This section highlights Western Copper and Gold's earnings, including key dates, EPS, earnings reports, and earnings call transcripts.
Next Earnings Date
Last Earnings Results
Earnings Call Transcripts
| Transcript | Quarter | Year | Date | Estimated EPS | Actual EPS |
|---|

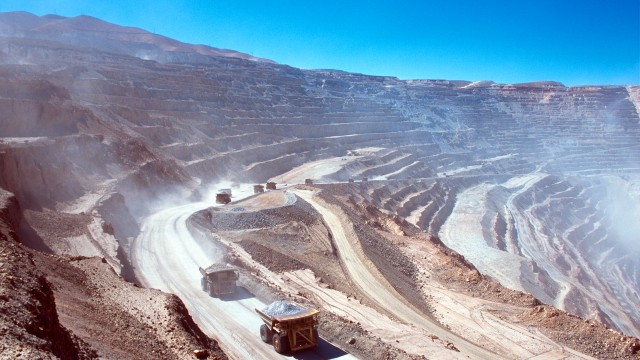
Western Copper and Gold Corporation, an exploration stage company, engages in the exploration and development of mineral properties in Canada. The company explores for gold, copper, silver, and molybdenum deposits. Its principal property is the Casino mineral property that comprise 1,136 full and partial quartz claims, and 55 placer claims located in Yukon, Canada. The company was formerly known as Western Copper Corporation and changed its name to Western Copper and Gold Corporation in October 2011. Western Copper and Gold Corporation was incorporated in 2006 and is headquartered in Vancouver, Canada.
$1.17
Stock Price
$234.00M
Market Cap
-
Employees
Vancouver, BC
Location
Financial Statements
Access annual & quarterly financial statements for Western Copper and Gold, including income statements, balance sheets, and cash flow statements..
Annual Income Statement
| Breakdown | December 31, 2023 | December 31, 2022 | December 31, 2021 | December 31, 2020 | December 31, 2019 |
|---|---|---|---|---|---|
| Revenue | $- | $- | $- | $- | $- |
| Cost of Revenue | $206.90K | $167.89K | $103.26K | $- | $- |
| Gross Profit | $-206.90K | $-167.89K | $-103.26K | $- | $- |
| Gross Profit Ratio | 0.00% | 0.00% | 0.00% | 0.00% | 0.00% |
| Research and Development Expenses | $- | $- | $- | $- | $- |
| General and Administrative Expenses | $1.97M | $5.16M | $5.07M | $2.75M | $2.50M |
| Selling and Marketing Expenses | $1.89M | $- | $- | $- | $- |
| Selling General and Administrative Expenses | $3.86M | $5.16M | $5.07M | $2.75M | $2.50M |
| Other Expenses | $- | $305.68K | $897.28K | $128.37K | $767.43K |
| Operating Expenses | $3.86M | $5.46M | $5.07M | $2.75M | $2.50M |
| Cost and Expenses | $3.86M | $5.63M | $5.17M | $2.75M | $2.50M |
| Interest Income | $1.18M | $584.51K | $207.96K | $14.12K | $57.87K |
| Interest Expense | $- | $67.66K | $- | $- | $- |
| Depreciation and Amortization | $206.90K | $167.89K | $103.26K | $2.23M | $1.85M |
| EBITDA | $-3.86M | $-4.76M | $-4.02M | $- | $- |
| EBITDA Ratio | 0.00% | 0.00% | 0.00% | 0.00% | 0.00% |
| Operating Income | $-3.86M | $-4.93M | $-5.53M | $-3.31M | $-2.40M |
| Operating Income Ratio | 0.00% | 0.00% | 0.00% | 0.00% | 0.00% |
| Total Other Income Expenses Net | $519.27K | $-636.48K | $1.46M | $200.51K | $634.39K |
| Income Before Tax | $-3.34M | $-4.99M | $-3.71M | $-2.03M | $-1.77M |
| Income Before Tax Ratio | 0.00% | 0.00% | 0.00% | 0.00% | 0.00% |
| Income Tax Expense | $- | $67.66K | $-564.25K | $-583.34K | $37.59K |
| Net Income | $-3.34M | $-5.06M | $-3.14M | $-1.45M | $-1.80M |
| Net Income Ratio | 0.00% | 0.00% | 0.00% | 0.00% | 0.00% |
| EPS | $-0.02 | $-0.03 | $-0.02 | $-0.01 | $-0.02 |
| EPS Diluted | $-0.02 | $-0.03 | $-0.02 | $-0.01 | $-0.02 |
| Weighted Average Shares Outstanding | 159.76M | 151.53M | 144.27M | 114.93M | 104.20M |
| Weighted Average Shares Outstanding Diluted | 159.76M | 151.53M | 144.27M | 114.93M | 104.20M |
| SEC Filing | Source | Source | Source | Source | Source |
| Breakdown | December 31, 2024 | September 30, 2024 | June 30, 2024 | March 31, 2024 | December 31, 2023 | September 30, 2023 | June 30, 2023 | March 31, 2023 | December 31, 2022 | September 30, 2022 | June 30, 2022 | March 31, 2022 | December 31, 2021 | September 30, 2021 | June 30, 2021 | March 31, 2021 | December 31, 2020 | September 30, 2020 | June 30, 2020 | March 31, 2020 |
|---|---|---|---|---|---|---|---|---|---|---|---|---|---|---|---|---|---|---|---|---|
| Revenue | $- | $- | $- | $- | $- | $- | $- | $- | $- | $- | $- | $- | $- | $- | $- | $- | $- | $- | $- | $- |
| Cost of Revenue | $15.37K | $38.82K | $51.13K | $51.73K | $51.73K | $51.73K | $51.73K | $51.73K | $51.73K | $38.72K | $38.72K | $38.72K | $38.72K | $38.72K | $25.82K | $- | $- | $- | $- | $- |
| Gross Profit | $-15.37K | $-38.82K | $-51.13K | $-51.73K | $-51.73K | $-51.73K | $-51.73K | $-51.73K | $-51.73K | $-38.72K | $-38.72K | $-38.72K | $-38.72K | $-38.72K | $-25.82K | $- | $- | $- | $- | $- |
| Gross Profit Ratio | 0.00% | 0.00% | 0.00% | 0.00% | 0.00% | 0.00% | 0.00% | 0.00% | 0.00% | 0.00% | 0.00% | 0.00% | 0.00% | 0.00% | 0.00% | 0.00% | 0.00% | 0.00% | 0.00% | 0.00% |
| Research and Development Expenses | $- | $- | $- | $- | $- | $- | $- | $- | $- | $- | $- | $- | $- | $- | $- | $- | $- | $- | $- | $- |
| General and Administrative Expenses | $2.21M | $1.88M | $3.10M | $1.95M | $1.22M | $1.37M | $1.01M | $1.27M | $1.12M | $1.09M | $1.29M | $1.65M | $1.38M | $1.39M | $1.19M | $1.10M | $803.71K | $632.56K | $551.40K | $757.39K |
| Selling and Marketing Expenses | $- | $- | $100.94K | $951.22K | $- | $- | $- | $- | $- | $- | $- | $- | $- | $- | $- | $- | $- | $- | $- | $- |
| Selling General and Administrative Expenses | $2.21M | $1.88M | $3.20M | $2.17M | $1.22M | $1.37M | $1.01M | $1.27M | $1.12M | $1.09M | $1.29M | $1.65M | $1.38M | $1.39M | $1.19M | $1.10M | $803.71K | $632.56K | $551.40K | $757.39K |
| Other Expenses | $-2.23M | $-1.92M | $- | $- | $- | $- | $- | $- | $305.68K | $252.19K | $399.32K | $108.01K | $197.38K | $698.49K | $- | $1.41K | $2.84K | $30.48K | $51.99K | $43.06K |
| Operating Expenses | $-15.37K | $-38.82K | $3.20M | $2.17M | $1.22M | $1.38M | $1.05M | $1.27M | $1.43M | $1.09M | $1.29M | $1.65M | $1.38M | $1.39M | $1.19M | $1.10M | $803.71K | $632.56K | $551.40K | $757.39K |
| Cost and Expenses | $2.23M | $1.93M | $3.25M | $2.23M | $1.27M | $1.44M | $1.11M | $1.32M | $1.48M | $1.13M | $1.33M | $1.69M | $1.42M | $1.43M | $1.22M | $1.10M | $803.71K | $632.56K | $551.40K | $757.39K |
| Interest Income | $791.36K | $906.39K | $637.88K | $340.88K | $315.36K | $416.97K | $274.82K | $169.80K | $181.49K | $219.23K | $117.69K | $66.11K | $54.87K | $68.59K | $46.16K | $38.34K | $7.81K | $440 | $845 | $5.02K |
| Interest Expense | $- | $- | $- | $- | $- | $- | $- | $- | $1.12K | $219.23K | $117.69K | $66.11K | $54.87K | $68.59K | $46.16K | $38.34K | $7.81K | $440 | $845 | $5.02K |
| Depreciation and Amortization | $15.97K | $38.82K | $51.13K | $51.73K | $51.73K | $51.73K | $51.73K | $51.73K | $51.73K | $38.72K | $38.72K | $38.72K | $37.72K | $38.72K | $25.82K | $744.38K | $688.95K | $549.77K | $473.89K | $521.25K |
| EBITDA | $-2.22M | $-1.89M | $-3.20M | $-2.17M | $-1.04M | $-1.21M | $-1.05M | $-1.06M | $-1.34M | $-1.09M | $-1.24M | $-1.58M | $-1.20M | $-1.39M | $-1.15M | $-1.06M | $-407.89K | $- | $- | $-705.60K |
| EBITDA Ratio | 0.00% | 0.00% | 0.00% | 0.00% | 0.00% | 0.00% | 0.00% | 0.00% | 0.00% | 0.00% | 0.00% | 0.00% | 0.00% | 0.00% | 0.00% | 0.00% | 0.00% | 0.00% | 0.00% | 0.00% |
| Operating Income | $- | $- | $-2.86M | $-2.23M | $-1.70M | $-1.63M | $-1.06M | $-1.36M | $-1.39M | $-1.08M | $-864.91K | $-1.59M | $-470.97K | $-1.43M | $-1.22M | $-1.10M | $-803.71K | $-632.56K | $-551.40K | $-757.39K |
| Operating Income Ratio | 0.00% | 0.00% | 0.00% | 0.00% | 0.00% | 0.00% | 0.00% | 0.00% | 0.00% | 0.00% | 0.00% | 0.00% | 0.00% | 0.00% | 0.00% | 0.00% | 0.00% | 0.00% | 0.00% | 0.00% |
| Total Other Income Expenses Net | $-1.59M | $-680.74K | $-176.84K | $619.27K | $739.68K | $613.04K | $191.91K | $210.85K | $-1.12K | $424.60K | $-288.50K | $-26.03K | $896.60K | $520.38K | $44.50K | $51 | $395.82K | $193.59K | $126.01K | $-3.71K |
| Income Before Tax | $-1.59M | $-680.74K | $-3.04M | $-1.61M | $-532.49K | $-823.03K | $-872.18K | $-1.11M | $-1.39M | $-706.63K | $-1.28M | $-1.62M | $-525.83K | $-909.86K | $-1.18M | $-1.10M | $-407.89K | $-438.98K | $-425.39K | $-761.09K |
| Income Before Tax Ratio | 0.00% | 0.00% | 0.00% | 0.00% | 0.00% | 0.00% | 0.00% | 0.00% | 0.00% | 0.00% | 0.00% | 0.00% | 0.00% | 0.00% | 0.00% | 0.00% | 0.00% | 0.00% | 0.00% | 0.00% |
| Income Tax Expense | $- | $- | $- | $-4 | $-739.68K | $-613.04K | $-233.37K | $-251.91K | $1.12K | $-597.01K | $300.61K | $-40.08K | $54.87K | $178.12K | $-46.16K | $-38.34K | $-7.81K | $-440 | $-845 | $-5.02K |
| Net Income | $-1.59M | $-680.74K | $-3.04M | $-1.61M | $-532.49K | $-823.03K | $-872.18K | $-858.70K | $-1.39M | $-109.61K | $-1.58M | $-1.58M | $-525.83K | $-909.86K | $-1.18M | $-1.10M | $-407.89K | $-438.98K | $-425.39K | $-761.09K |
| Net Income Ratio | 0.00% | 0.00% | 0.00% | 0.00% | 0.00% | 0.00% | 0.00% | 0.00% | 0.00% | 0.00% | 0.00% | 0.00% | 0.00% | 0.00% | 0.00% | 0.00% | 0.00% | 0.00% | 0.00% | 0.00% |
| EPS | $-0.01 | $0.00 | $-0.02 | $-0.01 | $0.00 | $-0.01 | $-0.01 | $-0.01 | $-0.01 | $0.00 | $-0.01 | $-0.01 | $0.00 | $-0.01 | $-0.01 | $-0.01 | $0.00 | $0.00 | $0.00 | $-0.01 |
| EPS Diluted | $-0.01 | $0.00 | $-0.02 | $-0.01 | $0.00 | $-0.01 | $-0.01 | $-0.01 | $-0.01 | $0.00 | $-0.01 | $-0.01 | $0.00 | $-0.01 | $-0.01 | $-0.01 | $0.00 | $0.00 | $0.00 | $-0.01 |
| Weighted Average Shares Outstanding | 198.22M | 198.22M | 187.82M | 167.11M | 166.09M | 162.53M | 160.37M | 152.63M | 151.60M | 151.58M | 151.51M | 151.43M | 151.43M | 150.32M | 139.80M | 135.67M | 135.67M | 115.26M | 111.92M | 108.69M |
| Weighted Average Shares Outstanding Diluted | 198.22M | 198.22M | 187.82M | 167.11M | 166.09M | 162.53M | 160.37M | 152.63M | 151.60M | 151.58M | 151.51M | 151.43M | 151.43M | 150.32M | 139.80M | 135.67M | 135.67M | 115.26M | 111.92M | 108.69M |
| SEC Filing | Source | Source | Source | Source | Source | Source | Source | Source | Source | Source | Source | Source | Source | Source | Source | Source | Source | Source | Source | Source |
Annual Balance Sheet
| Breakdown | December 31, 2024 | December 31, 2023 | December 31, 2022 | December 31, 2021 | December 31, 2020 |
|---|---|---|---|---|---|
| Cash and Cash Equivalents | $14.20M | $25.97M | $1.34M | $30.69M | $28.65M |
| Short Term Investments | $54.85M | $6.10M | $21.78M | $17.18M | $736.96K |
| Cash and Short Term Investments | $69.05M | $32.07M | $23.12M | $47.87M | $29.38M |
| Net Receivables | $- | $- | $- | $- | $- |
| Inventory | $- | $- | $- | $- | $- |
| Other Current Assets | $954.85K | $1.28M | $1.44M | $860.53K | $677.90K |
| Total Current Assets | $70.01M | $33.35M | $24.56M | $48.73M | $30.06M |
| Property Plant Equipment Net | $122.79M | $110.57M | $89.82M | $66.76M | $53.75M |
| Goodwill | $- | $- | $- | $- | $- |
| Intangible Assets | $- | $- | $- | $- | $- |
| Goodwill and Intangible Assets | $- | $- | $- | $- | $- |
| Long Term Investments | $- | $- | $- | $- | $- |
| Tax Assets | $- | $- | $- | $- | $- |
| Other Non-Current Assets | $- | $- | $- | $- | $- |
| Total Non-Current Assets | $122.79M | $110.57M | $89.82M | $66.76M | $53.75M |
| Other Assets | $- | $- | $- | $- | $- |
| Total Assets | $192.79M | $143.92M | $114.38M | $115.49M | $83.81M |
| Account Payables | $- | $4.28M | $4.22K | $2.23K | $1.18K |
| Short Term Debt | $33.41K | $185.51K | $245.67K | $171.17K | $- |
| Tax Payables | $- | $- | $- | $- | $- |
| Deferred Revenue | $- | $- | $-4.22K | $-2.23K | $- |
| Other Current Liabilities | $3.12M | $- | $4.22M | $2.99M | $1.18M |
| Total Current Liabilities | $3.16M | $4.46M | $4.47M | $3.16M | $1.18M |
| Long Term Debt | $27.23K | $12.30K | $172.31K | $262.15K | $- |
| Deferred Revenue Non-Current | $- | $- | $- | $- | $- |
| Deferred Tax Liabilities Non-Current | $- | $- | $- | $- | $- |
| Other Non-Current Liabilities | $- | $- | $- | $- | $- |
| Total Non-Current Liabilities | $27.23K | $12.30K | $172.31K | $262.15K | $- |
| Other Liabilities | $- | $- | $- | $- | $- |
| Total Liabilities | $3.18M | $4.47M | $4.64M | $3.42M | $1.18M |
| Preferred Stock | $- | $- | $- | $- | $- |
| Common Stock | $272.54M | $216.29M | $183.54M | $183.19M | $150.90M |
| Retained Earnings | $-121.85M | $-114.93M | $-111.59M | $-106.60M | $-102.89M |
| Accumulated Other Comprehensive Income Loss | $- | $0 | $-0 | $0 | $- |
| Other Total Stockholders Equity | $38.92M | $38.08M | $37.79M | $35.47M | $34.62M |
| Total Stockholders Equity | $189.61M | $139.44M | $109.74M | $112.07M | $82.63M |
| Total Equity | $189.61M | $139.44M | $109.74M | $112.07M | $82.63M |
| Total Liabilities and Stockholders Equity | $192.79M | $143.92M | $114.38M | $115.49M | $83.81M |
| Minority Interest | $- | $- | $- | $- | $- |
| Total Liabilities and Total Equity | $192.79M | $143.92M | $114.38M | $115.49M | $83.81M |
| Total Investments | $54.85M | $6.10M | $21.78M | $17.18M | $736.96K |
| Total Debt | $60.64K | $197.81K | $417.98K | $433.32K | $- |
| Net Debt | $-14.14M | $-25.77M | $-923.29K | $-30.25M | $-28.65M |
Balance Sheet Charts
| Breakdown | December 31, 2024 | September 30, 2024 | June 30, 2024 | March 31, 2024 | December 31, 2023 | September 30, 2023 | June 30, 2023 | March 31, 2023 | December 31, 2022 | September 30, 2022 | June 30, 2022 | March 31, 2022 | December 31, 2021 | September 30, 2021 | June 30, 2021 | March 31, 2021 | December 31, 2020 | September 30, 2020 | June 30, 2020 | March 31, 2020 |
|---|---|---|---|---|---|---|---|---|---|---|---|---|---|---|---|---|---|---|---|---|
| Cash and Cash Equivalents | $14.20M | $16.48M | $20.76M | $20.31M | $25.97M | $3.86M | $3.95M | $3.15M | $1.34M | $5.00M | $14.56M | $22.15M | $30.69M | $35.75M | $28.69M | $16.98M | $28.65M | $2.95M | $5.97M | $2.81M |
| Short Term Investments | $54.85M | $58.41M | $57.34M | $12.51M | $6.10M | $29.17M | $35.04M | $16.90M | $21.78M | $24.72M | $24.62M | $22.12M | $17.18M | $16.49M | $21.71M | $10.70M | $736.96K | $348.10K | $189.70K | $108.40K |
| Cash and Short Term Investments | $69.05M | $74.89M | $78.10M | $32.83M | $32.07M | $33.03M | $38.99M | $20.05M | $23.12M | $29.72M | $39.17M | $44.26M | $47.87M | $52.24M | $50.40M | $27.68M | $29.38M | $3.29M | $6.16M | $2.92M |
| Net Receivables | $- | $- | $- | $- | $- | $- | $- | $- | $- | $- | $- | $- | $- | $- | $- | $- | $- | $- | $- | $- |
| Inventory | $- | $- | $- | $- | $- | $- | $- | $- | $- | $- | $- | $- | $- | $- | $- | $- | $- | $- | $- | $- |
| Other Current Assets | $954.85K | $611.24K | $615.21K | $1.34M | $1.28M | $937.72K | $946.13K | $883.93K | $1.44M | $999.49K | $636.43K | $481.45K | $860.53K | $583.77K | $479.67K | $514.76K | $677.90K | $429.29K | $185.66K | $158.97K |
| Total Current Assets | $70.01M | $75.50M | $78.71M | $34.17M | $33.35M | $33.97M | $39.93M | $20.93M | $24.56M | $30.72M | $39.81M | $44.74M | $48.73M | $52.82M | $50.88M | $28.20M | $30.06M | $3.72M | $6.35M | $3.08M |
| Property Plant Equipment Net | $122.79M | $118.12M | $114.79M | $250.05K | $110.57M | $107.11M | $97.40M | $92.72M | $89.82M | $85.48M | $75.05M | $69.24M | $66.76M | $63.67M | $57.28M | $54.47M | $53.75M | $53.22M | $49.62M | $48.72M |
| Goodwill | $- | $- | $- | $- | $- | $- | $- | $- | $- | $- | $- | $- | $- | $- | $- | $- | $- | $- | $- | $- |
| Intangible Assets | $- | $- | $- | $- | $- | $- | $- | $- | $- | $- | $- | $- | $- | $- | $- | $- | $- | $- | $- | $- |
| Goodwill and Intangible Assets | $- | $- | $- | $- | $- | $- | $- | $- | $- | $- | $- | $- | $- | $- | $- | $- | $- | $- | $- | $- |
| Long Term Investments | $- | $- | $- | $- | $- | $- | $- | $- | $- | $- | $- | $- | $- | $- | $- | $- | $- | $- | $- | $- |
| Tax Assets | $- | $- | $- | $- | $- | $- | $- | $- | $- | $- | $- | $- | $- | $- | $- | $- | $- | $- | $- | $- |
| Other Non-Current Assets | $- | $- | $- | $111.90M | $- | $- | $- | $- | $- | $- | $- | $- | $- | $- | $- | $- | $- | $- | $- | $- |
| Total Non-Current Assets | $122.79M | $118.12M | $114.79M | $112.15M | $110.57M | $107.11M | $97.40M | $92.72M | $89.82M | $85.48M | $75.05M | $69.24M | $66.76M | $63.67M | $57.28M | $54.47M | $53.75M | $53.22M | $49.62M | $48.72M |
| Other Assets | $- | $- | $- | $- | $- | $- | $- | $- | $- | $- | $- | $- | $- | $- | $- | $- | $- | $- | $- | $- |
| Total Assets | $192.79M | $193.62M | $193.50M | $146.32M | $143.92M | $141.08M | $137.33M | $113.66M | $114.38M | $116.21M | $114.86M | $113.98M | $115.49M | $116.50M | $108.16M | $82.67M | $83.81M | $56.95M | $55.97M | $51.80M |
| Account Payables | $- | $- | $2.68M | $4.20M | $4.28K | $7.10K | $3.24K | $2.85K | $4.22K | $5.14K | $3.36K | $1.62M | $2.23M | $2.76M | $1.53M | $699.80K | $1.18M | $1.16M | $704.23K | $561.84K |
| Short Term Debt | $33.41K | $34.77K | $80.15K | $139.77K | $185.51K | $236.93K | $226.13K | $245.67K | $245.67K | $245.27K | $249.75K | $177.36K | $171.17K | $164.98K | $162.91K | $- | $- | $- | $- | $- |
| Tax Payables | $- | $- | $- | $- | $- | $- | $- | $- | $- | $- | $- | $- | $- | $- | $- | $- | $- | $- | $- | $- |
| Deferred Revenue | $- | $- | $- | $-4.20M | $-4.28K | $-7.10K | $-3.24K | $-2.85K | $-4.22K | $-5.14K | $-3.36K | $-1.62M | $-2.23M | $-2.76M | $-1.53M | $- | $- | $- | $- | $- |
| Other Current Liabilities | $3.12M | $2.90M | $- | $- | $4.27M | $7.10M | $3.24M | $2.85M | $4.22M | $5.14M | $3.61M | $651.52K | $759.52K | $956.91K | $- | $- | $1.41K | $4.24K | $34.73K | $46.72K |
| Total Current Liabilities | $3.16M | $2.93M | $2.76M | $4.34M | $4.46M | $7.34M | $3.47M | $3.09M | $4.47M | $5.39M | $3.86M | $2.45M | $3.16M | $3.88M | $1.69M | $699.80K | $1.18M | $1.17M | $738.95K | $608.56K |
| Long Term Debt | $27.23K | $- | $- | $- | $12.30K | $17.78K | $84.36K | $119.30K | $172.31K | $224.67K | $274.40K | $223.68K | $262.15K | $299.98K | $333.06K | $- | $- | $- | $- | $- |
| Deferred Revenue Non-Current | $- | $- | $- | $- | $- | $- | $- | $- | $- | $- | $- | $- | $- | $- | $- | $- | $- | $- | $- | $- |
| Deferred Tax Liabilities Non-Current | $- | $- | $- | $- | $- | $- | $- | $- | $- | $- | $- | $- | $- | $- | $- | $- | $- | $- | $- | $- |
| Other Non-Current Liabilities | $- | $- | $- | $- | $- | $- | $- | $- | $- | $- | $- | $- | $- | $- | $- | $- | $- | $- | $- | $- |
| Total Non-Current Liabilities | $27.23K | $- | $- | $- | $12.30K | $17.78K | $84.36K | $119.30K | $172.31K | $224.67K | $274.40K | $223.68K | $262.15K | $299.98K | $333.06K | $- | $- | $- | $- | $- |
| Other Liabilities | $- | $- | $- | $- | $- | $- | $- | $- | $- | $- | $- | $- | $- | $- | $- | $- | $- | $- | $- | $- |
| Total Liabilities | $3.18M | $2.93M | $2.76M | $4.34M | $4.47M | $7.36M | $3.55M | $3.21M | $4.64M | $5.61M | $4.13M | $2.67M | $3.42M | $4.18M | $2.02M | $699.80K | $1.18M | $1.17M | $738.95K | $608.56K |
| Preferred Stock | $- | $- | $- | $- | $- | $- | $- | $- | $- | $- | $- | $1 | $1 | $- | $0 | $0 | $- | $0 | $0 | $1 |
| Common Stock | $272.54M | $272.24M | $272.16M | $219.92M | $216.29M | $210.28M | $210.01M | $185.64M | $183.54M | $183.54M | $183.37M | $183.29M | $183.19M | $183.19M | $176.39M | $151.17M | $150.90M | $123.88M | $122.79M | $118.40M |
| Retained Earnings | $-121.85M | $-120.26M | $-119.58M | $-116.54M | $-114.93M | $-114.40M | $-113.57M | $-112.70M | $-111.59M | $-110.20M | $-109.50M | $-108.21M | $-106.60M | $-106.07M | $-105.16M | $-103.99M | $-102.89M | $-102.48M | $-102.04M | $-101.62M |
| Accumulated Other Comprehensive Income Loss | $- | $- | $- | $- | $0 | $-0 | $0 | $- | $-0 | $- | $0 | $0 | $0 | $- | $-0 | $-0 | $- | $-0 | $-0 | $0 |
| Other Total Stockholders Equity | $38.92M | $38.70M | $38.16M | $38.61M | $38.08M | $37.84M | $37.35M | $37.50M | $37.79M | $37.25M | $36.86M | $36.23M | $35.47M | $35.20M | $34.90M | $34.79M | $34.62M | $34.37M | $34.48M | $34.41M |
| Total Stockholders Equity | $189.61M | $190.68M | $190.74M | $141.99M | $139.44M | $133.72M | $133.78M | $110.44M | $109.74M | $110.59M | $110.73M | $111.31M | $112.07M | $112.32M | $106.13M | $81.97M | $82.63M | $55.78M | $55.23M | $51.19M |
| Total Equity | $189.61M | $190.68M | $190.74M | $141.99M | $139.44M | $133.72M | $133.78M | $110.44M | $109.74M | $110.59M | $110.73M | $111.31M | $112.07M | $112.32M | $106.13M | $81.97M | $82.63M | $55.78M | $55.23M | $51.19M |
| Total Liabilities and Stockholders Equity | $192.79M | $193.62M | $193.50M | $146.32M | $143.92M | $141.08M | $137.33M | $113.66M | $114.38M | $116.21M | $114.86M | $113.98M | $115.49M | $116.50M | $108.16M | $82.67M | $83.81M | $56.95M | $55.97M | $51.80M |
| Minority Interest | $- | $- | $- | $- | $- | $- | $- | $- | $- | $- | $- | $- | $- | $- | $- | $- | $- | $- | $- | $- |
| Total Liabilities and Total Equity | $192.79M | $193.62M | $193.50M | $146.32M | $143.92M | $141.08M | $137.33M | $113.66M | $114.38M | $116.21M | $114.86M | $113.98M | $115.49M | $116.50M | $108.16M | $82.67M | $83.81M | $56.95M | $55.97M | $51.80M |
| Total Investments | $54.85M | $58.41M | $57.34M | $12.51M | $6.10M | $29.17M | $35.04M | $16.90M | $21.78M | $24.72M | $24.62M | $22.12M | $17.18M | $16.49M | $21.71M | $10.70M | $736.96K | $348.10K | $189.70K | $108.40K |
| Total Debt | $60.64K | $34.77K | $80.15K | $139.77K | $197.81K | $254.71K | $310.49K | $364.97K | $417.98K | $469.94K | $524.14K | $401.04K | $433.32K | $464.96K | $495.97K | $- | $- | $- | $- | $- |
| Net Debt | $-14.14M | $-16.45M | $-20.68M | $-20.17M | $-25.77M | $-3.60M | $-3.64M | $-2.78M | $-923.29K | $-4.53M | $-14.03M | $-21.74M | $-30.25M | $-35.28M | $-28.19M | $-16.98M | $-28.65M | $-2.95M | $-5.97M | $-2.81M |
Annual Cash Flow
| Breakdown | December 31, 2024 | December 31, 2023 | December 31, 2022 | December 31, 2021 | December 31, 2020 |
|---|---|---|---|---|---|
| Net Income | $-6.92M | $-3.34M | $-4.99M | $-3.71M | $-2.03M |
| Depreciation and Amortization | $157.66K | $206.90K | $167.89K | $103.26K | $- |
| Deferred Income Tax | $- | $- | $- | $-367.44K | $- |
| Stock Based Compensation | $2.45M | $1.42K | $1.55M | $1.24M | $557.10K |
| Change in Working Capital | $-378.31K | $107.77K | $-38.26K | $-264.99K | $-188.56K |
| Accounts Receivables | $-1.21M | $- | $-294.82K | $-73.64K | $- |
| Inventory | $- | $- | $- | $- | $- |
| Accounts Payables | $- | $- | $- | $- | $- |
| Other Working Capital | $827.47K | $107.77K | $256.55K | $-191.35K | $-188.56K |
| Other Non Cash Items | $-40.02K | $486.71K | $-27.51K | $-871.66K | $-704.77K |
| Net Cash Provided by Operating Activities | $-4.73M | $-2.54M | $-3.34M | $-3.87M | $-2.37M |
| Investments in Property Plant and Equipment | $-13.82M | $-19.90M | $-20.93M | $-11.40M | $-5.31M |
| Acquisitions Net | $- | $- | $- | $- | $- |
| Purchases of Investments | $-47.50M | $-5.00M | $-5.00M | $-16.00M | $- |
| Sales Maturities of Investments | $- | $16.00M | $- | $- | $- |
| Other Investing Activities | $- | $5.00M | $-279.54K | $-16.00K | $- |
| Net Cash Used for Investing Activities | $-61.32M | $-3.90M | $-25.93M | $-27.40M | $-5.31M |
| Debt Repayment | $-188.17K | $-245.67K | $-209.06K | $-108.61K | $- |
| Common Stock Issued | $54.28M | $29.59M | $133.16K | $33.63M | $35.18M |
| Common Stock Repurchased | $- | $- | $- | $- | $- |
| Dividends Paid | $- | $- | $- | $- | $- |
| Other Financing Activities | $191.20K | $1.72M | $133.16K | $-212.12K | $-494.95K |
| Net Cash Used Provided by Financing Activities | $54.29M | $31.07M | $-75.90K | $33.31M | $34.69M |
| Effect of Forex Changes on Cash | $- | $- | $- | $- | $- |
| Net Change in Cash | $-11.77M | $24.63M | $-29.35M | $2.04M | $27.01M |
| Cash at End of Period | $14.20M | $25.97M | $1.34M | $30.69M | $28.65M |
| Cash at Beginning of Period | $25.97M | $1.34M | $30.69M | $28.65M | $1.64M |
| Operating Cash Flow | $-4.73M | $-2.54M | $-3.34M | $-3.87M | $-2.37M |
| Capital Expenditure | $-13.82M | $-19.90M | $-20.93M | $-11.40M | $-5.31M |
| Free Cash Flow | $-18.55M | $-22.44M | $-24.27M | $-15.27M | $-7.68M |
Cash Flow Charts
| Breakdown | December 31, 2024 | September 30, 2024 | June 30, 2024 | March 31, 2024 | December 31, 2023 | September 30, 2023 | June 30, 2023 | March 31, 2023 | December 31, 2022 | September 30, 2022 | June 30, 2022 | March 31, 2022 | December 31, 2021 | September 30, 2021 | June 30, 2021 | March 31, 2021 | December 31, 2020 | September 30, 2020 | June 30, 2020 | March 31, 2020 |
|---|---|---|---|---|---|---|---|---|---|---|---|---|---|---|---|---|---|---|---|---|
| Net Income | $-1.59M | $-680.74K | $-3.04M | $-1.61M | $-532.49K | $-823.03K | $-872.18K | $-1.11M | $-1.39M | $-706.63K | $-1.28M | $-1.62M | $-525.83K | $-909.86K | $-1.18M | $-1.10M | $-407.89K | $-438.98K | $-425.39K | $-761.09K |
| Depreciation and Amortization | $15.97K | $38.82K | $51.13K | $51.73K | $51.73K | $51.73K | $51.73K | $51.73K | $51.73K | $38.72K | $38.72K | $38.72K | $38.72K | $38.72K | $25.82K | $- | $- | $- | $- | $- |
| Deferred Income Tax | $- | $- | $- | $- | $-424.16K | $-197.48K | $41.70K | $- | $- | $- | $- | $- | $-653.36K | $240.12K | $- | $- | $- | $- | $- | $- |
| Stock Based Compensation | $533.22K | $586.66K | $690.29K | $642.96K | $170.75K | $558.97K | $146.69K | $207.01K | $287.33K | $309.77K | $380.87K | $569.74K | $233.62K | $600.19K | $209.65K | $196.76K | $226.02K | $164.22K | $71.00K | $95.86K |
| Change in Working Capital | $-84.20K | $-662.22K | $217.81K | $150.31K | $363.09K | $-178.41K | $416.50K | $-493.41K | $-81.27K | $27.73K | $238.73K | $-223.46K | $131.22K | $-167.23K | $379.92K | $-608.91K | $-102.08K | $-180.61K | $-69.27K | $163.39K |
| Accounts Receivables | $- | $- | $- | $-66.27K | $- | $- | $- | $- | $- | $- | $- | $- | $- | $- | $- | $- | $- | $- | $- | $- |
| Inventory | $- | $- | $- | $- | $- | $- | $- | $- | $- | $- | $- | $- | $- | $- | $- | $- | $- | $- | $- | $- |
| Accounts Payables | $- | $-78.29K | $212.10K | $147.54K | $- | $- | $-20.08K | $-435.39K | $- | $- | $- | $- | $- | $- | $- | $- | $- | $- | $- | $- |
| Other Working Capital | $-84.20K | $-583.93K | $5.70K | $216.58K | $363.09K | $-178.41K | $416.50K | $-493.41K | $-81.27K | $27.73K | $238.73K | $-223 | $204.86K | $-167 | $380 | $-609 | $-274 | $-150 | $-69 | $163 |
| Other Non Cash Items | $151.13K | $-346.28K | $429.08K | $538.75K | $4.72K | $5.84K | $6.94K | $-32.85K | $99.37K | $-200.92K | $71.08K | $2.96K | $-188.29K | $-688.78K | $36.73K | $40.29K | $-391.64K | $-188.88K | $-133.29K | $9.04K |
| Net Cash Provided by Operating Activities | $-977.50K | $-1.06M | $-1.65M | $-1.04M | $-366.36K | $-582.38K | $-208.62K | $-1.38M | $-1.03M | $-531.32K | $-553.82K | $-1.23M | $-963.91K | $-886.84K | $-549.99K | $-1.47M | $-675.59K | $-644.25K | $-556.95K | $-492.81K |
| Investments in Property Plant and Equipment | $-4.95M | $-3.17M | $-3.79M | $-1.92M | $-6.73M | $-5.62M | $-4.36M | $-3.20M | $-5.57M | $-9.00M | $-4.01M | $-2.35M | $-4.05M | $-5.14M | $-1.82M | $-390.39K | $-1.25M | $-3.18M | $-696.05K | $-184.47K |
| Acquisitions Net | $- | $- | $- | $- | $-21.00M | $- | $18.50M | $- | $- | $- | $- | $- | $- | $- | $- | $- | $- | $- | $- | $- |
| Purchases of Investments | $3.70M | $- | $-45.12M | $-6.07M | $2.33M | $6.17M | $-13.50M | $- | $3.00M | $- | $-3.00M | $-5.00M | $- | $5.00M | $-11.00M | $-10.00M | $- | $- | $- | $- |
| Sales Maturities of Investments | $- | $- | $- | $- | $21.00M | $- | $-5.00M | $5.00M | $- | $- | $- | $- | $- | $- | $- | $- | $- | $- | $- | $- |
| Other Investing Activities | $- | $- | $- | $-6.07K | $21.00M | $6.17K | $-18.50M | $5.00K | $-13.02K | $40.00K | $-40.00K | $-5.00K | $67.88K | $-40.73K | $-27.15K | $-10.00K | $- | $- | $- | $- |
| Net Cash Used for Investing Activities | $-1.25M | $-3.17M | $-48.91M | $-7.99M | $16.60M | $552.33K | $-22.86M | $1.80M | $-2.57M | $-8.96M | $-7.05M | $-7.35M | $-3.99M | $-184.39K | $-12.84M | $-10.39M | $-1.25M | $-3.18M | $-696.05K | $-184.47K |
| Debt Repayment | $-17.96K | $-46.58K | $- | $-61.62K | $-61.62K | $-61.62K | $-61.42K | $-61.02K | $-61.31K | $-66.29K | $-40.73K | $-40.73K | $- | $-40.73K | $- | $- | $- | $- | $- | $- |
| Common Stock Issued | $- | $- | $50.96M | $3.32M | $6.00M | $- | $23.59M | $1.44M | $- | $- | $55.33K | $77.83K | $- | $8.01M | $25.62M | $192.00K | $28.75M | $- | $4.48M | $1.95M |
| Common Stock Repurchased | $- | $- | $- | $- | $- | $- | $- | $- | $- | $- | $- | $- | $- | $- | $- | $- | $- | $- | $- | $- |
| Dividends Paid | $- | $- | $- | $- | $- | $- | $- | $- | $- | $- | $- | $- | $- | $- | $- | $- | $- | $- | $- | $- |
| Other Financing Activities | $-30.34K | $- | $48.05K | $111.46K | $-58.12K | $- | $337.87K | $1.44M | $- | $- | $55.33K | $77.83K | $-108.61K | $121.21K | $-552.48K | $192.00K | $-1.12M | $794.33K | $-62.16K | $-104.49K |
| Net Cash Used Provided by Financing Activities | $-48.30K | $-46.58K | $51.01M | $3.37M | $5.88M | $-61.62K | $23.87M | $1.38M | $-61.31K | $-66.29K | $14.60K | $37.10K | $-108.61K | $8.13M | $25.10M | $192.00K | $27.63M | $794.33K | $4.42M | $1.85M |
| Effect of Forex Changes on Cash | $- | $- | $- | $- | $- | $- | $- | $- | $- | $- | $- | $- | $- | $- | $- | $- | $- | $- | $- | $- |
| Net Change in Cash | $-2.28M | $-4.28M | $444.66K | $-5.66M | $22.12M | $-91.67K | $802.00K | $1.80M | $-3.66M | $-9.56M | $-7.59M | $-8.54M | $-5.06M | $7.06M | $11.71M | $-11.67M | $25.70M | $-3.03M | $3.16M | $1.17M |
| Cash at End of Period | $14.20M | $16.48M | $20.76M | $20.31M | $25.97M | $3.86M | $3.95M | $3.15M | $1.34M | $5.00M | $14.56M | $22.15M | $30.69M | $35.75M | $28.69M | $16.98M | $28.65M | $2.95M | $5.97M | $2.81M |
| Cash at Beginning of Period | $16.48M | $20.76M | $20.31M | $25.97M | $3.86M | $3.95M | $3.15M | $1.34M | $5.00M | $14.56M | $22.15M | $30.69M | $35.75M | $28.69M | $16.98M | $28.65M | $2.95M | $5.97M | $2.81M | $1.64M |
| Operating Cash Flow | $-977.50K | $-1.06M | $-1.65M | $-1.04M | $-366.36K | $-582.38K | $-208.62K | $-1.38M | $-1.03M | $-531.32K | $-553.82K | $-1.23M | $-963.91K | $-886.84K | $-549.99K | $-1.47M | $-675.59K | $-644.25K | $-556.95K | $-492.81K |
| Capital Expenditure | $-4.95M | $-3.17M | $-3.79M | $-1.92M | $-6.73M | $-5.62M | $-4.36M | $-3.20M | $-5.57M | $-9.00M | $-4.01M | $-2.35M | $-4.05M | $-5.14M | $-1.82M | $-390.39K | $-1.25M | $-3.18M | $-696.05K | $-184.47K |
| Free Cash Flow | $-5.93M | $-4.23M | $-5.44M | $-2.96M | $-7.10M | $-6.20M | $-4.57M | $-4.57M | $-6.60M | $-9.53M | $-4.56M | $-3.58M | $-5.02M | $-6.03M | $-2.37M | $-1.86M | $-1.93M | $-3.82M | $-1.25M | $-677.27K |
Western Copper and Gold Dividends
Explore Western Copper and Gold's dividend history, including dividend yield, payout ratio, and historical payments.
Western Copper and Gold News
Read the latest news about Western Copper and Gold, including recent articles, headlines, and updates.
WESTERN COPPER AND GOLD PROVIDES POSITIVE METALLURGICAL UPDATE
VANCOUVER, BC , Feb. 13, 2025 /PRNewswire/ - Western Copper and Gold Corporation ("Western" or the "Company") (TSX: WRN) (NYSE American: WRN) is pleased to announce results from a supplemental metallurgical program (the "Metallurgical Program") for its wholly owned Casino Copper-Gold Project ("Casino"). The Metallurgical Program used drill core composites of material representing potential mill feed taken from the 2023 diamond drilling program with more variable copper, gold, and molybdenum levels than had been tested in previous drill campaigns and from a broader period of planned mining.

WESTERN COPPER AND GOLD ANNOUNCES COMPLETION OF LEADERSHIP TRANSITION
VANCOUVER, BC , Jan. 2, 2025 /PRNewswire/ - Western Copper and Gold Corporation ("Western" or the "Company") (TSX: WRN) (NYSE American: WRN) has completed its previously announced management succession process. Dr. Paul West-Sells' role as President of the Company concluded on December 31, 2024, and Mr.

Western Copper And Gold: Copper-Gold "Casino" Asset Improves Outlook In Yukon
Western Copper and Gold Corporation (WRN) is rated a "Buy" despite a -19.29% return, due to strong long-term prospects and strategic importance of future Yukon production of copper and gold. The Casino project in the Yukon promises low-cost production of several metals, including copper and gold, over many decades, supported by optimistic forecasts for metals prices, and favourable Fed actions. The project's viability is enhanced by significant mineral reserves, strategic location and potential cost savings in transportation, metal ore processing and energy procurement. These are also risk reduction factors.

WESTERN COPPER AND GOLD WELCOMES FEDERAL FUNDING FOR B.C.-YUKON GRID CONNECT PROJECT
WHITEHORSE, YT , Sept. 23, 2024 /PRNewswire/ - Western Copper and Gold Corporation ("Western" or the "Company") (TSX: WRN) (NYSE American: WRN) welcomes the recent announcement by Natural Resources Canada ("NRCan"), conditionally approving C$40 million in federal funding to undertake pre-feasibility activities to advance a high-voltage transmission line network connecting the Yukon electrical grid to the North American grid in British Columbia.

VIDEO - Invest Yukon: Critical Mineral Development in The Yukon
Vancouver, British Columbia--(Newsfile Corp. - June 21, 2024) - Invest Yukon - Hon Ranj Pillai, Yukon's Premier highlights the key critical minerals conversation and the promising economic future for Yukon. Western Copper and Gold (TSX: WRN) (NYSE American: WRN) emphasizes that as the demand for critical minerals intensifies, they are well positioned to meet the needs of the territory, Canada and global demand, as a leading developer in Canada.

National Bank of Canada FI Buys 30,000 Shares of Western Copper and Gold Co. (NYSEAMERICAN:WRN)
National Bank of Canada FI boosted its stake in shares of Western Copper and Gold Co. (NYSEAMERICAN:WRN – Free Report) (TSE:WRN) by 750.0% in the 4th quarter, according to its most recent Form 13F filing with the Securities and Exchange Commission (SEC). The institutional investor owned 34,000 shares of the company’s stock after acquiring an additional 30,000 shares during the quarter. National Bank of Canada FI’s holdings in Western Copper and Gold were worth $45,000 as of its most recent SEC filing. Other hedge funds and other institutional investors also recently made changes to their positions in the company. Raymond James Financial Services Advisors Inc. boosted its stake in Western Copper and Gold by 379.6% in the fourth quarter. Raymond James Financial Services Advisors Inc. now owns 52,753 shares of the company’s stock worth $70,000 after purchasing an additional 41,753 shares in the last quarter. Gamco Investors INC. ET AL lifted its position in Western Copper and Gold by 5.8% during the 3rd quarter. Gamco Investors INC. ET AL now owns 642,070 shares of the company’s stock worth $876,000 after buying an additional 35,400 shares in the last quarter. Finally, Rathbones Group PLC bought a new stake in Western Copper and Gold during the 3rd quarter worth about $38,000. 21.96% of the stock is owned by institutional investors. Western Copper and Gold Stock Up 4.7 % Shares of NYSEAMERICAN WRN opened at $1.55 on Monday. Western Copper and Gold Co. has a 1-year low of $0.95 and a 1-year high of $1.74. The stock has a market capitalization of $303.97 million, a price-to-earnings ratio of -51.67 and a beta of 1.94. Western Copper and Gold (NYSEAMERICAN:WRN – Get Free Report) (TSE:WRN) last issued its quarterly earnings results on Thursday, May 9th. The company reported ($0.01) earnings per share (EPS) for the quarter. On average, equities research analysts anticipate that Western Copper and Gold Co. will post -0.02 earnings per share for the current year. Western Copper and Gold Company Profile (Free Report) Western Copper and Gold Corporation, an exploration stage company, engages in the exploration and development of mineral properties in Canada. The company explores for gold, copper, silver, and molybdenum deposits. Its principal property is the Casino mineral property that comprise 1,136 full and partial quartz claims, and 55 placer claims located in Yukon, Canada. See Also Five stocks we like better than Western Copper and Gold What Investors Need to Know to Beat the Market MarketBeat Week in Review – 5/13 – 5/17 The Top 3 Healthcare Dividend Stocks to Buy and Hold Take-Two Interactive Software Offers 2nd Chance for Investors Stock Average Calculator Deere & Company’s Q2 Report: Strong Revenue, Cautious Outlook Want to see what other hedge funds are holding WRN? Visit HoldingsChannel.com to get the latest 13F filings and insider trades for Western Copper and Gold Co. (NYSEAMERICAN:WRN – Free Report) (TSE:WRN).
WESTERN COPPER AND GOLD ANNOUNCES EXERCISE OF PARTICIPATION RIGHT IN FULL BY RIO TINTO
VANCOUVER, BC , April 29, 2024 /PRNewswire/ - Western Copper and Gold Corporation ("Western" or the "Company") (TSX: WRN) (NYSE American: WRN) announces that, in connection with the Company's offering of common shares for gross proceeds of approximately $40 million announced on April 16, 2024 (the "Offering"), Rio Tinto Canada Inc. ("Rio Tinto") has notified the Company that it will exercise its participation right in full, allowing Rio Tinto to maintain its interest of approximately 9.7%. Rio Tinto will subscribe for 2,269,470 common shares of the Company at a price of $1.90 per share for proceeds of $4,311,993 (the "Rio Tinto Subscription").

Western Copper and Gold Announces Upsize in Bought Deal Public Offering to $40 Million
VANCOUVER, British Columbia, April 16, 2024 (GLOBE NEWSWIRE) -- Western Copper and Gold Corporation (“Western” or the “Company”) (TSX: WRN; NYSE American: WRN) is pleased to announce that it has entered into an amended agreement with Eight Capital, on behalf of a syndicate of underwriters (the “Underwriters”) under which the Underwriters have agreed to buy from the Company, on a bought deal basis, 21,055,000 common shares of the Company (the “Common Shares”) at a price of $1.90 per Common Share for gross proceeds of $40,004,500 (the “Offering”). The Company has granted the Underwriters an over-allotment option to purchase up to an additional 3,158,250 Common Shares, representing 15% of the Offering, to cover over-allotments, if any, and for market stabilization purposes, exercisable at any time up to 30 days after the closing of the Offering.

Western Copper and Gold Announces $25 Million Bought Deal Public Offering
VANCOUVER, British Columbia, April 15, 2024 (GLOBE NEWSWIRE) -- Western Copper and Gold Corporation (“Western” or the “Company”) (TSX: WRN; NYSE American: WRN) announces that it has entered into an agreement with Eight Capital, on behalf of a syndicate of underwriters (the “Underwriters”) under which the Underwriters have agreed to buy from the Company, on a bought deal basis, 13,158,000 common shares of the Company (the “Common Shares”) at a price of $1.90 per Common Share for gross proceeds of $25,000,200 (the “Offering”). The Company has granted the Underwriters an over-allotment option to purchase up to an additional 1,973,700 Common Shares, representing 15% of the Offering, to cover over-allotments, if any, and for market stabilization purposes, exercisable at any time up to 30 days after the closing of the Offering.

WESTERN COPPER AND GOLD APPOINTS SANDEEP SINGH AS CEO
VANCOUVER, BC , Feb. 22, 2024 /PRNewswire/ - Western Copper and Gold Corporation ("Western" or the "Company") (TSX: WRN) (NYSE American: WRN) is pleased to announce the appointment of Mr. Sandeep Singh as Chief Executive Officer of the Company, effective immediately.

WESTERN COPPER AND GOLD ANNOUNCES FURTHER INVESTMENT AND ENTRY INTO A NEW INVESTOR RIGHTS AGREEMENT WITH RIO TINTO
VANCOUVER, BC , Nov. 28, 2023 /PRNewswire/ - Western Copper and Gold Corporation ("Western" or the "Company") (TSX: WRN) (NYSE American: WRN) announces a further C$6 million investment and the entry into an amended and restated investor rights agreement by Rio Tinto Canada Inc. ("Rio Tinto"), to continue to advance the Company's Casino Project in the Yukon. Rio Tinto has agreed to subscribe for and purchase 3,468,208 common shares at a price of C$1.73 per share for aggregate gross proceeds of approximately C$6 million, resulting in Rio Tinto's ownership increasing to approximately 9.7% of Western's outstanding common shares.

Western Copper and Gold: The Next Rise Will Come From Gold (Rating Upgrade)
Western Copper and Gold's stock rating has been upgraded to "Buy" from "Hold" due to a different outlook and potential for a gold price rally. The company's future revenues will be heavily dependent on copper, gold, and molybdenum production, with copper accounting for the largest share. The stock is exposed to headwinds from higher interest rates but could experience a significant recovery in a recessionary environment.
A Top Leveraged Bet On Future Copper Shortages: Western Copper
Western Copper's stock quote could rise from spiking copper prices soon, increasing company value potentially on the magnitude of 5x or 10x over a 5-year period. Without a recession, global copper supply is projected to face shortages during 2024-25, with few new mines being developed to offset depleting production. A price breakout above US$4 per pound into August could be the first warning sign of a serious copper market imbalance, possibly kicking off a multi-year run higher.

Resource Leverage On Spiking Metal Prices In 2023: Western Copper And Gold
The Casino Project in Canada's Yukon, owned by Western Copper and Gold, offers incredible upside to investors if precious metals pricing jumps into 2024. A number of major miners have taken stakes in the land district surrounding Casino, including Rio Tinto investing directly into WRN.
Western Copper and Gold: Fundamentally Stronger, At A Cheaper Price
The new feasibility study confirmed the world-class status of the Casino project. The mine should be able to produce 211,000 toz gold, 163 million lb copper, 1.277 million toz silver, and 15.1 million lb molybdenum per year on average.

Western Copper and Gold reports feasibility study results for Casino deposit, with NPV of C$2.3B
(Kitco News) - The company said that at base case metal prices, the project generates C$2.3 billion after-tax NPV (8%), with after-tax IRR of 18.1% and cashflow over the first four years of C$951 million per year.

'In our neighborhood mines are getting permitted' - Western Copper and Gold's Paul West-Sells
(Kitco News) - To the west of Casino, Newmont is developing the Coffee project, which received permits earlier this year. To the north and to the west, White Gold has a large number of claims and is actively exploring. Approximately 100 km to the east, Minto Metals operates the Minto Mine, which produces copper concentrate.
Western Copper and Gold Provides Update and Launches Feasibility Study at Casino
VANCOUVER, BC, Oct. 6, 2021 /PRNewswire/ - Western Copper and Gold Corporation ("Western" or the "Company") (TSX: WRN) (NYSE American: WRN) is pleased to announce an update to its 2021 exploration and drilling program at its wholly owned Casino Copper-Gold Project ("Casino") and the formal launching of a feasibility study on the Casino Project. Exploration and Drilling Program The 2021 exploration and drilling program (the "Program") was developed with input from Rio Tinto as outlined in the Investor Rights Agreement and Subscription Agreement, entered into as part of an investment by Rio Tinto Canada in Western (see news release dated May 17, 2021).

Western Copper And Gold: More Attractive After The Recent Sell-Off
Western Copper and Gold's share price declined by more than 40% since its late May peak, making the company more attractive. The updated Casino project PEA envisions a 25-year mining operation with an after-tax NPV(5%) of $3.12 billion.

Western Copper and Gold Announces Positive PEA on Casino
$2.3 billion After-Tax NPV (8%) at Base Case metal prices After-Tax IRR 19.5% at Base Case metal prices Cashflow over the first four years of $965 million per year at Base Case metal prices Base case development contemplates 25-year mine life Extended Two-Phase development contemplates a 47-year mine life Base Case metal prices: Cu: US$3.35/lb, Au: US$1,600/oz, Ag: US$24/oz, Mo: US$12/lb VANCOUVER, BC, June 22, 2021 /PRNewswire/ - Western Copper and Gold Corporation ("Western" or the "Company") (TSX: WRN) (NYSE American: WRN) is pleased to release the results of its Preliminary Economic Assessment (the "PEA", or "Study") on its wholly-owned Casino copper-gold-molybdenum deposit in the Yukon ("Casino" or the "Project"). The Study considered the Project being constructed as an open pit mine, with a concentrator processing nominally 120,000 tonnes per day and a gold heap leach facility processing nominally 25,000 tonnes per day.

Similar Companies
Related Metrics
Explore detailed financial metrics and analysis for WRN.
