Vertical Aerospace Key Executives
This section highlights Vertical Aerospace's key executives, including their titles and compensation details.
Find Contacts at Vertical Aerospace
(Showing 0 of )
Vertical Aerospace Earnings
This section highlights Vertical Aerospace's earnings, including key dates, EPS, earnings reports, and earnings call transcripts.
Next Earnings Date
Last Earnings Results
Earnings Call Transcripts
| Transcript | Quarter | Year | Date | Estimated EPS | Actual EPS |
|---|---|---|---|---|---|
| Read Transcript | Q1 | 2024 | 2025-03-12 | N/A | N/A |

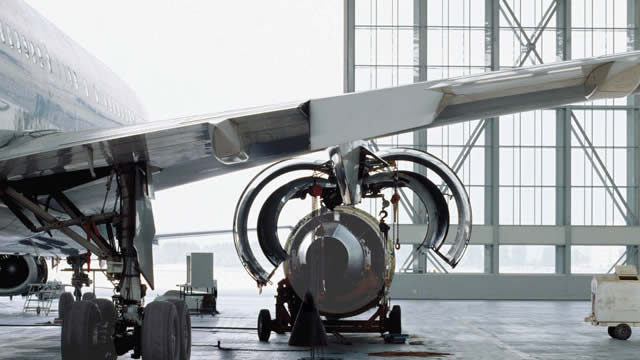
Vertical Aerospace Ltd. engages in designing, manufacturing, and selling electric aircraft. It offers VX4, an electric vertical take-off and landing vehicle. The company was founded in 2016 and is headquartered in Bristol, the United Kingdom.
$3.43
Stock Price
$290.02M
Market Cap
359
Employees
Bristol, None
Location
Financial Statements
Access annual & quarterly financial statements for Vertical Aerospace, including income statements, balance sheets, and cash flow statements..
Annual Income Statement
| Breakdown | December 31, 2024 | December 31, 2023 | December 31, 2022 | December 31, 2021 | December 31, 2020 |
|---|---|---|---|---|---|
| Revenue | $- | $- | $- | $132.00K | $87.00K |
| Cost of Revenue | $- | $- | $- | $64.00K | $44.00K |
| Gross Profit | $- | $- | $- | $68.00K | $43.00K |
| Gross Profit Ratio | 0.00% | 0.00% | 0.00% | 51.52% | 49.43% |
| Research and Development Expenses | $59.89M | $65.37M | $49.13M | $24.29M | $9.97M |
| General and Administrative Expenses | $40.75M | $38.34M | $54.89M | $264.37M | $3.90M |
| Selling and Marketing Expenses | $1.76M | $688.00K | $1.73M | $3.92M | $- |
| Selling General and Administrative Expenses | $44.69M | $40.90M | $54.89M | $264.37M | $3.90M |
| Other Expenses | $-43.41M | $-4.33M | $-5.91M | $-11.35M | $-2.32M |
| Operating Expenses | $61.17M | $101.95M | $98.11M | $277.31M | $11.56M |
| Cost and Expenses | $61.17M | $101.95M | $98.11M | $277.37M | $11.60M |
| Interest Income | $- | $13.00K | $623.00K | $560.00K | $783.00K |
| Interest Expense | $- | $- | $15.04M | $560.00K | $802.00K |
| Depreciation and Amortization | $1.09M | $892.00K | $577.00K | $942.00K | $682.00K |
| EBITDA | $-60.08M | $-101.06M | $-96.06M | $-243.71M | $-10.86M |
| EBITDA Ratio | - | - | - | -184626.52% | -12479.31% |
| Operating Income | $-61.17M | $-101.95M | $-98.11M | $-277.24M | $-11.52M |
| Operating Income Ratio | - | - | - | -210029.55% | -13235.63% |
| Total Other Income Expenses Net | $-720.03M | $19.34M | $3.73M | $32.02M | $-807.00K |
| Income Before Tax | $-781.20M | $-82.61M | $-94.38M | $-245.22M | $-12.32M |
| Income Before Tax Ratio | - | - | - | -185775.76% | -14163.22% |
| Income Tax Expense | $45.00K | $22.66M | $-18.27M | $560.00K | $4.00K |
| Net Income | $-781.24M | $-59.95M | $-76.11M | $-245.78M | $-12.33M |
| Net Income Ratio | - | - | - | -186200.00% | -14167.82% |
| EPS | $-38.46 | $-3.13 | $-5.26 | $-19.76 | $-1.23 |
| EPS Diluted | $-38.46 | $-3.13 | $-5.26 | $-19.76 | $-1.23 |
| Weighted Average Shares Outstanding | 20.32M | 19.12M | 17.95M | 12.41M | 9.99M |
| Weighted Average Shares Outstanding Diluted | 20.32M | 19.13M | 17.95M | 12.41M | 9.99M |
| SEC Filing | Source | Source | Source | Source | Source |
| Breakdown | December 31, 2024 | September 30, 2024 | June 30, 2024 | March 31, 2024 | December 31, 2023 | September 30, 2023 | June 30, 2023 | March 31, 2023 | December 31, 2022 | September 30, 2022 | June 30, 2022 | March 31, 2022 | December 31, 2021 | September 30, 2021 | June 30, 2021 | March 31, 2021 | December 31, 2020 | September 30, 2020 | June 30, 2020 | March 31, 2020 |
|---|---|---|---|---|---|---|---|---|---|---|---|---|---|---|---|---|---|---|---|---|
| Revenue | $11.31M | $- | $- | $- | $- | $- | $- | $- | $- | $- | $- | $- | $2.00K | $66.00K | $66.00K | $33.00K | $19.00K | $19.00K | $49.00K | $21.75K |
| Cost of Revenue | $- | $3.71M | $- | $- | $- | $- | $- | $- | $- | $- | $- | $- | $1.00K | $40.00K | $25.00K | $16.00K | $9.50K | $9.50K | $25.00K | $11.00K |
| Gross Profit | $11.31M | $-3.71M | $- | $- | $- | $- | $- | $- | $- | $- | $- | $- | $1.00K | $26.00K | $41.00K | $17.00K | $9.50K | $9.50K | $24.00K | $10.75K |
| Gross Profit Ratio | 100.00% | - | 0.00% | 0.00% | 0.00% | 0.00% | 0.00% | 0.00% | 0.00% | 0.00% | 0.00% | 0.00% | 50.00% | 39.39% | 62.12% | 51.52% | 50.00% | 50.00% | 48.98% | 49.43% |
| Research and Development Expenses | $14.83M | $13.11M | $15.98M | $15.98M | $22.48M | $15.39M | $13.75M | $13.75M | $19.99M | $9.75M | $9.70M | $9.70M | $12.66M | $5.12M | $4.38M | $3.37M | $2.45M | $2.45M | $1.74M | $3.33M |
| General and Administrative Expenses | $25.46M | $6.86M | $10.38M | $10.38M | $6.45M | $10.15M | $12.15M | $12.15M | $21.62M | $9.80M | $11.73M | $11.73M | $233.88M | $5.24M | $21.28M | $2.74M | $734.50K | $917.50K | $1.06M | $1.01M |
| Selling and Marketing Expenses | $-1.69M | $912.00K | $- | $- | $688 | $- | $- | $- | $352.00K | $621.00K | $4.00K | $4.00K | $2.90M | $529.00K | $- | $- | $183.00K | $- | $- | $- |
| Selling General and Administrative Expenses | $23.77M | $7.77M | $10.38M | $10.38M | $6.45M | $10.15M | $12.15M | $12.15M | $21.62M | $9.80M | $11.73M | $11.73M | $233.88M | $5.24M | $21.28M | $2.74M | $917.50K | $917.50K | $1.06M | $1.01M |
| Other Expenses | $-20.36M | $-1.59M | $-16.38M | $-16.38M | $15.10M | $-1.00K | $- | $- | $-1.59M | $-916.00K | $- | $- | $254.00K | $-1.92M | $-141.49M | $-141.49M | $-6.36M | $-6.36M | $-6.36M | $-6.36M |
| Operating Expenses | $18.24M | $19.28M | $9.97M | $9.97M | $44.03M | $21.95M | $2.70M | $2.70M | $40.02M | $18.63M | $4.97M | $4.97M | $246.79M | $8.44M | $20.04M | $2.04M | $2.22M | $2.22M | $2.80M | $4.34M |
| Cost and Expenses | $18.24M | $22.99M | $9.97M | $9.97M | $44.03M | $21.95M | $2.70M | $2.70M | $40.02M | $18.63M | $4.97M | $4.97M | $246.79M | $8.47M | $20.06M | $2.04M | $2.23M | $2.23M | $2.83M | $4.34M |
| Interest Income | $252.00K | $654.00K | $- | $- | $588.00K | $1.06M | $3.18M | $3.18M | $385.00K | $238.00K | $3.54M | $3.54M | $- | $- | $- | $- | $- | $- | $- | $- |
| Interest Expense | $692.18M | $4.31M | $- | $- | $4.18M | $4.11M | $- | $- | $3.41M | $4.56M | $- | $- | $26.00K | $17.00K | $140.00K | $140.00K | $200.50K | $200.50K | $200.50K | $200.50K |
| Depreciation and Amortization | $637.00K | $646.00K | $547.00K | $547.00K | $692.00K | $705.00K | $495.00K | $495.00K | $568.00K | $593.00K | $416.00K | $416.00K | $272.00K | $270.00K | $175.00K | $155.00K | $277.00K | $14.00K | $125.00K | $126.00K |
| EBITDA | $-32.66M | $-27.20M | $-9.42M | $-9.42M | $-35.89M | $-25.26M | $-23.98M | $-23.98M | $-39.18M | $-112.75M | $-19.31M | $-19.31M | $-213.87M | $-8.22M | $-19.82M | $-1.89M | $-1.92M | $-2.19M | $-2.65M | $-4.21M |
| EBITDA Ratio | -288.84% | - | - | - | - | - | - | - | - | - | - | - | -10693250.00% | -12450.00% | -30030.30% | -5718.18% | -10118.42% | -11502.63% | -5412.24% | -19370.11% |
| Operating Income | $-18.24M | $-22.99M | $-9.97M | $-9.97M | $-44.03M | $-21.95M | $-17.98M | $-17.98M | $-40.02M | $-18.63M | $-19.73M | $-19.73M | $-246.79M | $-8.41M | $-20.00M | $-2.04M | $-2.20M | $-2.20M | $-2.78M | $-4.34M |
| Operating Income Ratio | -161.30% | - | - | - | - | - | - | - | - | - | - | - | -12339650.00% | -12740.91% | -30295.45% | -6187.88% | -11576.32% | -11576.32% | -5667.35% | -19949.43% |
| Total Other Income Expenses Net | $-707.24M | $-9.16M | $-1.81M | $-1.81M | $3.27M | $-8.12M | $18.59M | $18.59M | $80.56M | $-99.27M | $11.22M | $11.22M | $32.63M | $-95.00K | $-18.00K | $-502.00K | $-374.00K | $-374.00K | $-30.00K | $-29.00K |
| Income Before Tax | $-725.47M | $-32.15M | $-11.78M | $-11.78M | $-40.77M | $-30.07M | $-5.88M | $-5.88M | $40.54M | $-117.89M | $-8.51M | $-8.51M | $-214.16M | $-8.50M | $-20.01M | $-2.54M | $-2.57M | $-2.57M | $-2.81M | $-4.37M |
| Income Before Tax Ratio | -6416.15% | - | - | - | - | - | - | - | - | - | - | - | -10708150.00% | -12884.85% | -30322.73% | -7709.09% | -13544.74% | -13544.74% | -5728.57% | -20082.76% |
| Income Tax Expense | $10.11M | $-3.61M | $3.22M | $3.22M | $-22.66M | $4.11M | $-0 | $-0 | $-83.70M | $99.27M | $- | $- | $-32.55M | $-12.00K | $-8.14M | $-8.14M | $2.00K | $2.00K | $1.00K | $1.00K |
| Net Income | $-735.58M | $-28.54M | $-8.56M | $-8.56M | $-18.10M | $-30.07M | $-5.88M | $-5.88M | $124.24M | $-217.16M | $-8.51M | $-8.51M | $-181.61M | $-8.49M | $-20.01M | $-2.54M | $-2.58M | $-2.58M | $-2.81M | $-4.37M |
| Net Income Ratio | -6505.53% | - | - | - | - | - | - | - | - | - | - | - | -9080400.00% | -12866.67% | -30322.73% | -7709.09% | -13555.26% | -13555.26% | -5728.57% | -20082.76% |
| EPS | $-31.21 | $-1.48 | $-0.45 | $-0.45 | $-0.94 | $-1.57 | $-0.32 | $-0.32 | $2.22 | $-6.61 | $-0.48 | $-0.48 | $-15.69 | $-0.66 | $-0.87 | $-236.10 | $-0.13 | $-0.13 | $0.00 | $0.00 |
| EPS Diluted | $-31.21 | $-1.48 | $-0.45 | $-0.45 | $-0.94 | $-1.57 | $-0.32 | $-0.32 | $2.22 | $-6.61 | $-0.48 | $-0.48 | $-15.69 | $-0.66 | $-0.87 | $-236.10 | $-0.14 | $-0.13 | $0.00 | $0.00 |
| Weighted Average Shares Outstanding | 23.57M | 19.23M | 19.23M | 19.23M | 19.22M | 19.21M | 18.56M | 18.56M | 18.27M | 17.84M | 17.83M | 17.83M | 13.65M | 12.97M | 23.02M | 10.00M | 18.74M | 19.97M | 100.00M | 100.00M |
| Weighted Average Shares Outstanding Diluted | 23.57M | 19.23M | 19.23M | 19.23M | 19.22M | 19.21M | 18.56M | 18.56M | 18.28M | 17.84M | 17.83M | 17.83M | 13.65M | 12.97M | 23.02M | 10.78M | 19.97M | 19.97M | 100.00M | 100.00M |
| SEC Filing | Source | Source | Source | Source | Source | Source | Source | Source | Source | Source | Source | Source | Source | Source | Source | Source | Source | Source | Source | Source |
Annual Balance Sheet
| Breakdown | December 31, 2024 | December 31, 2023 | December 31, 2022 | December 31, 2021 | December 31, 2020 |
|---|---|---|---|---|---|
| Cash and Cash Equivalents | $22.56M | $48.68M | $62.93M | $212.66M | $839.00K |
| Short Term Investments | $- | $- | $59.89M | $- | $- |
| Cash and Short Term Investments | $22.56M | $48.68M | $122.81M | $212.66M | $839.00K |
| Net Receivables | $- | $- | $- | $- | $- |
| Inventory | $- | $- | $-71.58M | $-6.09M | $-2.80M |
| Other Current Assets | $20.00M | $28.11M | $20.56M | $6.57M | $733.00K |
| Total Current Assets | $42.55M | $76.79M | $143.38M | $225.32M | $4.37M |
| Property Plant Equipment Net | $5.05M | $6.27M | $5.81M | $3.80M | $2.48M |
| Goodwill | $- | $- | $- | $1.47M | $1.47M |
| Intangible Assets | $132.00K | $1.02M | $2.05M | $2.73M | $557.00K |
| Goodwill and Intangible Assets | $132.00K | $1.02M | $2.05M | $4.21M | $2.03M |
| Long Term Investments | $- | $- | $- | $- | $- |
| Tax Assets | $- | $- | $- | $- | $- |
| Other Non-Current Assets | $- | $- | $-2.00K | $- | $- |
| Total Non-Current Assets | $5.18M | $7.29M | $7.86M | $8.01M | $4.51M |
| Other Assets | $- | $- | $- | $- | $- |
| Total Assets | $47.73M | $84.08M | $151.24M | $233.33M | $8.88M |
| Account Payables | $5.44M | $3.73M | $4.45M | $6.71M | $846.00K |
| Short Term Debt | $581.00K | $643.00K | $516.00K | $362.00K | $6.48M |
| Tax Payables | $879.00K | $981.00K | $857.00K | $7.14M | $207.00K |
| Deferred Revenue | $- | $- | $- | $33.51M | $- |
| Other Current Liabilities | $533.94M | $13.07M | $15.68M | $37.10M | $1.35M |
| Total Current Liabilities | $540.84M | $18.42M | $21.51M | $51.32M | $8.89M |
| Long Term Debt | $1.62M | $1.98M | $2.65M | $1.58M | $846.00K |
| Deferred Revenue Non-Current | $- | $- | $- | $- | $- |
| Deferred Tax Liabilities Non-Current | $- | $- | $- | $- | $- |
| Other Non-Current Liabilities | $4.61M | $113.47M | $119.77M | $118.87M | $88.00K |
| Total Non-Current Liabilities | $6.23M | $115.45M | $122.41M | $120.45M | $934.00K |
| Other Liabilities | $- | $- | $- | $- | $- |
| Total Liabilities | $547.07M | $133.86M | $143.92M | $171.77M | $9.82M |
| Preferred Stock | $- | $- | $344.75M | $- | $- |
| Common Stock | $55.00K | $17.00K | $16.00K | $16.00K | $- |
| Retained Earnings | $-1.15B | $-394.26M | $-344.75M | $-250.12M | $-5.05M |
| Accumulated Other Comprehensive Income Loss | $99.30M | $86.76M | $-249.90M | $-186.81M | $-938.00K |
| Other Total Stockholders Equity | $553.59M | $257.70M | $257.20M | $248.35M | $- |
| Total Stockholders Equity | $-499.34M | $-49.78M | $7.32M | $61.56M | $-938.00K |
| Total Equity | $-499.34M | $-49.78M | $7.32M | $61.56M | $-938.00K |
| Total Liabilities and Stockholders Equity | $47.73M | $84.08M | $151.24M | $233.33M | $8.88M |
| Minority Interest | $- | $- | $- | $- | $- |
| Total Liabilities and Total Equity | $47.73M | $84.08M | $151.24M | $233.33M | $8.88M |
| Total Investments | $- | $- | $59.89M | $- | $- |
| Total Debt | $2.20M | $2.62M | $3.16M | $1.94M | $7.33M |
| Net Debt | $-20.36M | $-46.06M | $-59.77M | $-210.72M | $6.49M |
Balance Sheet Charts
| Breakdown | December 31, 2024 | September 30, 2024 | June 30, 2024 | March 31, 2024 | December 31, 2023 | September 30, 2023 | June 30, 2023 | March 31, 2023 | December 31, 2022 | September 30, 2022 | June 30, 2022 | March 31, 2022 | December 31, 2021 | September 30, 2021 | June 30, 2021 | March 31, 2021 | December 31, 2020 | September 30, 2020 | June 30, 2020 | March 31, 2020 |
|---|---|---|---|---|---|---|---|---|---|---|---|---|---|---|---|---|---|---|---|---|
| Cash and Cash Equivalents | $22.56M | $42.81M | $66.79M | $66.79M | $48.68M | $74.16M | $89.69M | $89.69M | $62.93M | $83.69M | $157.55M | $157.55M | $212.66M | $53.16M | $17.14M | $25.09M | $839.00K | $839.00K | $209.75K | $-1.03M |
| Short Term Investments | $- | $- | $- | $- | $- | $- | $- | $- | $59.89M | $61.08M | $- | $- | $- | $- | $- | $- | $- | $- | $- | $2.06M |
| Cash and Short Term Investments | $22.56M | $42.81M | $66.79M | $66.79M | $48.68M | $74.16M | $89.69M | $89.69M | $122.81M | $144.76M | $157.55M | $157.55M | $212.66M | $53.16M | $17.14M | $25.09M | $839.00K | $839.00K | $209.75K | $1.03M |
| Net Receivables | $- | $16.17M | $- | $- | $- | $- | $- | $- | $- | $- | $- | $- | $- | $1.52M | $11.23M | $5.30M | $- | $- | $699.75K | $- |
| Inventory | $- | $- | $- | $- | $6.73M | $7.05M | $-12.06M | $- | $-71.58M | $-18.40M | $- | $- | $- | $- | $- | $- | $- | $-699.75K | $- | $-883.00K |
| Other Current Assets | $20.00M | $6.69M | $21.76M | $21.76M | $28.11M | $21.85M | $21.43M | $21.43M | $20.56M | $18.40M | $4.20M | $14.16M | $6.57M | $1.64M | $- | $- | $733.00K | $3.53M | $183.25K | $- |
| Total Current Assets | $42.55M | $65.67M | $88.54M | $88.54M | $76.79M | $96.01M | $111.12M | $111.12M | $143.38M | $163.16M | $171.71M | $171.71M | $225.32M | $56.33M | $28.38M | $30.39M | $4.37M | $4.37M | $1.09M | $1.03M |
| Property Plant Equipment Net | $5.05M | $5.37M | $5.78M | $5.78M | $6.27M | $6.01M | $6.12M | $6.12M | $5.81M | $3.72M | $3.85M | $3.85M | $3.80M | $950.75K | $2.40M | $2.47M | $2.48M | $2.48M | $621.00K | $621.00K |
| Goodwill | $- | $- | $- | $- | $- | $1.31M | $- | $- | $- | $- | $0 | $- | $1.47M | $368.25K | $- | $368.25K | $1.47M | $1.47M | $368.25K | $368.25K |
| Intangible Assets | $132.00K | $- | $481.00K | $481.00K | $1.02M | $1.31K | $1.53M | $1.53M | $2.05M | $3.78M | $4.03M | $4.03M | $2.73M | $683.75K | $2.21M | $2.06M | $557.00K | $557.00K | $139.25K | $139.25K |
| Goodwill and Intangible Assets | $132.00K | $265.00K | $481.00K | $481.00K | $1.02M | $1.31M | $1.53M | $1.53M | $2.05M | $3.78M | $4.03M | $4.03M | $4.21M | $1.05M | $2.21M | $2.06M | $2.03M | $2.03M | $507.50K | $507.50K |
| Long Term Investments | $- | $- | $- | $- | $- | $- | $- | $- | $- | $- | $- | $- | $- | $- | $- | $- | $- | $- | $- | $- |
| Tax Assets | $- | $- | $- | $- | $- | $- | $- | $- | $- | $- | $- | $- | $- | $- | $- | $- | $- | $- | $- | $- |
| Other Non-Current Assets | $- | $- | $- | $- | $- | $- | $- | $- | $-2.00K | $- | $- | $- | $- | $- | $- | $- | $- | $- | $- | $-2.16M |
| Total Non-Current Assets | $5.18M | $5.64M | $6.26M | $6.26M | $7.29M | $7.32M | $7.65M | $7.65M | $7.86M | $7.50M | $7.88M | $7.88M | $8.01M | $2.00M | $4.61M | $4.54M | $4.51M | $4.51M | $1.13M | $-1.03M |
| Other Assets | $- | $- | $- | $- | $- | $- | $- | $- | $- | $- | $- | $- | $- | $- | $- | $- | $- | $- | $- | $2.22M |
| Total Assets | $47.73M | $71.30M | $94.81M | $94.81M | $84.08M | $103.33M | $118.77M | $118.77M | $151.24M | $170.65M | $179.59M | $179.59M | $233.33M | $58.33M | $32.99M | $34.92M | $8.88M | $8.88M | $2.22M | $2.22M |
| Account Payables | $5.44M | $3.60M | $4.61M | $4.61M | $3.73M | $7.16M | $4.64M | $4.64M | $4.45M | $7.18M | $1.86M | $1.86M | $6.71M | $1.68M | $4.61M | $3.29M | $846.00K | $846.00K | $211.50K | $211.50K |
| Short Term Debt | $581.00K | $534.00K | $558.00K | $558.00K | $643.00K | $666.00K | $676.00K | $676.00K | $516.00K | $430.00K | $426.00K | $426.00K | $362.00K | $- | $25.18M | $25.18M | $6.48M | $6.48M | $1.58M | $1.58M |
| Tax Payables | $879.00K | $924.00K | $1.55M | $- | $981.00K | $1.19M | $1.40M | $- | $857.00K | $- | $602.00K | $- | $7.14M | $- | $- | $- | $207.00K | $- | $- | $- |
| Deferred Revenue | $- | $- | $- | $- | $13.14M | $7.08M | $7.00M | $- | $- | $- | $- | $- | $- | $- | $-175.00K | $- | $- | $- | $- | $- |
| Other Current Liabilities | $533.94M | $7.25M | $11.38M | $12.92M | $13.07M | $7.47M | $8.33M | $9.73M | $15.68M | $12.76M | $13.51M | $14.11M | $37.10M | $11.15M | $- | $- | $1.35M | $1.56M | $433.50K | $433.50K |
| Total Current Liabilities | $540.84M | $12.31M | $18.09M | $18.09M | $18.42M | $16.48M | $15.05M | $15.05M | $21.51M | $20.38M | $16.40M | $16.40M | $51.32M | $12.83M | $29.78M | $28.46M | $8.89M | $8.89M | $2.22M | $2.22M |
| Long Term Debt | $1.62M | $1.59M | $114.52M | $114.52M | $1.98M | $2.11M | $2.26M | $103.09M | $2.65M | $1.59M | $1.68M | $94.13M | $1.58M | $- | $793.00K | $819.00K | $846.00K | $846.00K | $- | $- |
| Deferred Revenue Non-Current | $- | $- | $- | $- | $- | $- | $- | $- | $- | $- | $- | $- | $- | $- | $- | $- | $- | $- | $- | $- |
| Deferred Tax Liabilities Non-Current | $- | $- | $- | $- | $- | $- | $- | $- | $- | $- | $- | $- | $- | $- | $- | $- | $- | $- | $- | $- |
| Other Non-Current Liabilities | $4.61M | $112.73M | $4.28M | $4.28M | $113.47M | $110.50M | $105.08M | $4.25M | $119.77M | $186.77M | $99.18M | $6.73M | $118.87M | $30.11M | $91.00K | $90.00K | $88.00K | $88.00K | $233.50K | $233.50K |
| Total Non-Current Liabilities | $6.23M | $114.32M | $118.80M | $118.80M | $115.45M | $112.62M | $107.34M | $107.34M | $122.41M | $188.36M | $100.86M | $100.86M | $120.45M | $30.11M | $884.00K | $909.00K | $934.00K | $934.00K | $233.50K | $233.50K |
| Other Liabilities | $- | $- | $- | $- | $- | $- | $- | $- | $- | $- | $- | $- | $- | $- | $- | $- | $- | $- | $- | $- |
| Total Liabilities | $547.07M | $126.63M | $136.89M | $136.89M | $133.86M | $129.10M | $122.39M | $122.39M | $143.92M | $208.73M | $117.26M | $117.26M | $171.77M | $42.94M | $30.67M | $29.37M | $9.82M | $9.82M | $2.46M | $2.46M |
| Preferred Stock | $- | $- | $- | $273.02M | $- | $- | $- | $- | $344.75M | $- | $- | $- | $- | $- | $- | $- | $- | $- | $- | $- |
| Common Stock | $55.00K | $17.00K | $17.00K | $17.00K | $17.00K | $17.00K | $17.00K | $17.00K | $16.00K | $16.00K | $16.00K | $16.00K | $16.00K | $4.00K | $- | $4.00K | $- | $- | $- | $- |
| Retained Earnings | $-1.15B | $-440.19M | $-412.37M | $-412.37M | $-394.26M | $-377.67M | $-352.65M | $-352.65M | $-344.75M | $-384.98M | $-267.06M | $-267.06M | $-250.12M | $-62.53M | $-27.54M | $-7.57M | $-5.05M | $-5.05M | $-1.26M | $-1.26M |
| Accumulated Other Comprehensive Income Loss | $99.30M | $111.83M | $97.25M | $97.25M | $86.76M | $93.96M | $91.17M | $91.17M | $-249.90M | $-294.93M | $-186.79M | $80.27M | $-186.81M | $-331.25K | $-23.42M | $-0 | $-938.00K | $4.12M | $-192.50K | $4.16M |
| Other Total Stockholders Equity | $553.59M | $273.02M | $273.02M | $273.02M | $257.70M | $257.93M | $257.84M | $257.84M | $-87.56M | $256.84M | $249.10M | $249.10M | $248.35M | $78.25M | $25.74M | $13.12M | $- | $- | $1.22M | $- |
| Total Stockholders Equity | $-499.34M | $-55.33M | $-42.08M | $-42.08M | $-49.78M | $-25.77M | $-3.62M | $-3.62M | $7.32M | $-38.08M | $62.33M | $62.33M | $61.56M | $15.39M | $2.32M | $5.55M | $-938.00K | $-938.00K | $-234.50K | $4.16M |
| Total Equity | $-499.34M | $-55.33M | $-42.08M | $-42.08M | $-49.78M | $-25.77M | $-3.62M | $-3.62M | $7.32M | $-38.08M | $62.33M | $62.33M | $61.56M | $15.39M | $2.32M | $5.55M | $-938.00K | $-938.00K | $-234.50K | $4.16M |
| Total Liabilities and Stockholders Equity | $47.73M | $71.30M | $94.81M | $94.81M | $84.08M | $103.33M | $118.77M | $118.77M | $151.24M | $170.65M | $179.59M | $179.59M | $233.33M | $58.33M | $32.99M | $34.92M | $8.88M | $8.88M | $2.22M | $4.16M |
| Minority Interest | $- | $- | $- | $- | $- | $- | $- | $- | $- | $- | $- | $- | $- | $- | $- | $- | $- | $- | $- | $- |
| Total Liabilities and Total Equity | $47.73M | $71.30M | $94.81M | $94.81M | $84.08M | $103.33M | $118.77M | $118.77M | $151.24M | $170.65M | $179.59M | $179.59M | $233.33M | $58.33M | $32.99M | $34.92M | $8.88M | $8.88M | $2.22M | $4.16M |
| Total Investments | $- | $- | $- | $- | $- | $- | $- | $- | $59.89M | $61.08M | $- | $- | $- | $- | $- | $- | $- | $- | $- | $2.06M |
| Total Debt | $2.20M | $2.12M | $115.08M | $112.77M | $2.62M | $2.78M | $2.94M | $103.09M | $3.16M | $2.02M | $2.11M | $94.13M | $1.94M | $485.50K | $25.97M | $25.82M | $7.33M | $7.16M | $1.83M | $1.83M |
| Net Debt | $-20.36M | $-40.68M | $48.29M | $45.98M | $-46.06M | $-71.38M | $-86.76M | $13.40M | $-59.77M | $-81.67M | $-155.44M | $-63.42M | $-210.72M | $-52.68M | $8.82M | $732.00K | $6.49M | $6.32M | $1.62M | $2.86M |
Annual Cash Flow
| Breakdown | December 31, 2024 | December 31, 2023 | December 31, 2022 | December 31, 2021 | December 31, 2020 |
|---|---|---|---|---|---|
| Net Income | $-781.24M | $-59.95M | $-94.38M | $-245.22M | $-12.33M |
| Depreciation and Amortization | $2.70M | $2.71M | $2.18M | $942.00K | $682.00K |
| Deferred Income Tax | $45.00K | $-22.66M | $- | $112.46M | $4.00K |
| Stock Based Compensation | $7.49M | $8.82K | $23.19M | $101.61M | $96.00K |
| Change in Working Capital | $-10.35M | $4.40M | $-33.01M | $34.67M | $-1.27M |
| Accounts Receivables | $-7.77M | $3.79M | $-6.21M | $-9.13M | $-2.06M |
| Inventory | $- | $- | $- | $- | $- |
| Accounts Payables | $- | $- | $- | $- | $- |
| Other Working Capital | $-2.58M | $606.00K | $-26.80M | $43.80M | $787.00K |
| Other Non Cash Items | $735.06M | $785.18K | $-1.70M | $-32.02M | $807.00K |
| Net Cash Provided by Operating Activities | $-46.29M | $-74.70M | $-103.71M | $-27.55M | $-12.01M |
| Investments in Property Plant and Equipment | $-428.00K | $-2.26M | $-2.01M | $-3.35M | $-388.00K |
| Acquisitions Net | $- | $- | $- | $1.00K | $-300.00K |
| Purchases of Investments | $- | $- | $- | $- | $- |
| Sales Maturities of Investments | $- | $- | $- | $- | $- |
| Other Investing Activities | $2.16M | $63.64M | $-60.95M | $1.00K | $-233 |
| Net Cash Used for Investing Activities | $1.73M | $61.38M | $-62.96M | $-3.35M | $-688.00K |
| Debt Repayment | $-771.00K | $-669.00K | $-484.00K | $168.95M | $5.38M |
| Common Stock Issued | $15.63M | $838.00K | $7.73M | $67.26M | $- |
| Common Stock Repurchased | $- | $- | $- | $- | $- |
| Dividends Paid | $- | $- | $- | $- | $- |
| Other Financing Activities | $3.91M | $- | $- | $8.51M | $7.13M |
| Net Cash Used Provided by Financing Activities | $18.77M | $169.00K | $7.25M | $244.71M | $12.51M |
| Effect of Forex Changes on Cash | $-330.00K | $-1.10M | $9.69M | $-1.99M | $- |
| Net Change in Cash | $-26.12M | $-14.25M | $-149.73M | $211.82M | $-190.00K |
| Cash at End of Period | $22.56M | $48.68M | $62.93M | $212.66M | $839.00K |
| Cash at Beginning of Period | $48.68M | $62.93M | $212.66M | $839.00K | $1.03M |
| Operating Cash Flow | $-46.29M | $-74.70M | $-103.71M | $-27.55M | $-12.01M |
| Capital Expenditure | $-428.00K | $-2.26M | $-2.01M | $-3.35M | $-388.00K |
| Free Cash Flow | $-46.72M | $-76.96M | $-105.72M | $-30.91M | $-12.40M |
Cash Flow Charts
| Breakdown | December 31, 2024 | September 30, 2024 | June 30, 2024 | March 31, 2024 | December 31, 2023 | September 30, 2023 | June 30, 2023 | March 31, 2023 | December 31, 2022 | September 30, 2022 | June 30, 2022 | March 31, 2022 | December 31, 2021 | September 30, 2021 | June 30, 2021 | March 31, 2021 | December 31, 2020 | September 30, 2020 | June 30, 2020 | March 31, 2020 |
|---|---|---|---|---|---|---|---|---|---|---|---|---|---|---|---|---|---|---|---|---|
| Net Income | $-735.58M | $-28.54M | $-8.56K | $-8.56K | $-18.10M | $-30.07M | $-5.88K | $-5.88K | $40.54M | $-117.89M | $-8.51K | $-8.51K | $-214.16M | $-8.50M | $-20.01K | $-2.54K | $-2.58K | $-2.58K | $-2.81K | $-4.37K |
| Depreciation and Amortization | $637.00K | $646.00K | $710 | $710 | $692.00K | $705.00K | $658 | $658 | $568.00K | $593.00K | $510 | $510 | $272.00K | $270.00K | $210 | $190 | $312 | $49 | $160 | $161 |
| Deferred Income Tax | $10.11M | $-3.61M | $- | $- | $-11.34M | $- | $-3.10M | $-3.10M | $- | $- | $-2.90M | $- | $- | $4.00K | $- | $- | $1.00K | $1.00K | $1.00K | $1.00K |
| Stock Based Compensation | $1.08K | $1.62M | $2.39K | $2.39K | $-464.00K | $2.22M | $3.53K | $3.53K | $15.16M | $731.00K | $3.65K | $3.65K | $84.79M | $16.74M | $16.78K | $34 | $48 | $48 | $24.00K | $24.00K |
| Change in Working Capital | $-4.25M | $-3.15M | $-1.52K | $-1.52K | $7.53M | $2.33M | $-432 | $-432 | $-2.85M | $1.78M | $-750 | $-750 | $38.48M | $1.69M | $-5.89K | $-1.76K | $-1.34K | $-1.34K | $483 | $136 |
| Accounts Receivables | $-7.25M | $2.51M | $-1.52K | $-1.52K | $5.08K | $-419 | $-432 | $-432 | $-7.86M | $3.15M | $-750 | $-750 | $652 | $-2.12K | $-5.89K | $-1.76K | $-1.34K | $-1.34K | $483 | $136 |
| Inventory | $- | $- | $- | $- | $- | $- | $- | $- | $- | $- | $- | $- | $- | $- | $- | $- | $- | $- | $- | $- |
| Accounts Payables | $- | $- | $- | $- | $- | $- | $- | $- | $- | $- | $- | $- | $- | $- | $- | $- | $- | $- | $- | $- |
| Other Working Capital | $2.99M | $-5.66M | $- | $- | $7.53M | $2.33M | $- | $- | $5.00M | $-1.37M | $- | $- | $- | $- | $- | $- | $- | $- | $- | $- |
| Other Non Cash Items | $708.31M | $9.16M | $6.15K | $6.15K | $-3.27M | $8.12M | $-14.40K | $-14.40K | $-78.53M | $94.57M | $-26.44K | $-26.44K | $79.91M | $-16.72M | $1.37K | $1.31K | $789 | $1.05K | $-693 | $450 |
| Net Cash Provided by Operating Activities | $-20.78M | $-23.87M | $-826 | $-826 | $-24.95M | $-16.69M | $-16.53K | $-16.53K | $-25.11M | $-20.21M | $-31.54K | $-31.54K | $-10.71M | $-6.52M | $-7.54K | $-2.77K | $-2.77K | $-2.77K | $-2.86K | $-3.62K |
| Investments in Property Plant and Equipment | $-15.00K | $-22.00K | $-196 | $-196 | $-501.00K | $-383.00K | $-652 | $-652 | $-1.29M | $-160.00K | $-84 | $-84 | $-1.73M | $-1.12M | $-46 | $-101 | $-56 | $-56 | $-23 | $-21 |
| Acquisitions Net | $- | $- | $- | $- | $- | $- | $- | $- | $- | $- | $- | $- | $- | $- | $- | $- | $-150 | $-150 | $- | $- |
| Purchases of Investments | $- | $- | $- | $- | $- | $- | $- | $- | $- | $- | $- | $- | $- | $- | $- | $- | $- | $- | $- | $- |
| Sales Maturities of Investments | $- | $- | $- | $- | $- | $- | $- | $- | $- | $- | $- | $- | $- | $- | $- | $- | $- | $- | $- | $- |
| Other Investing Activities | $342.00K | $652.00K | $584 | $584 | $363.00K | $1.05M | $31.07K | $31.07K | $-115.00K | $-60.84M | $-196 | $-196 | $1.00K | $-652 | $-239 | $-110 | $-37 | $-37 | $-104 | $-55 |
| Net Cash Used for Investing Activities | $327.00K | $630.00K | $388 | $388 | $-138.00K | $672.00K | $30.42K | $30.42K | $-1.40M | $-60.99M | $-280 | $-280 | $-1.73M | $-1.12M | $-285 | $-211 | $-242 | $-242 | $-127 | $-76 |
| Debt Repayment | $-190.00K | $-185.00K | $- | $- | $-221.00K | $-99.00K | $- | $- | $- | $- | $- | $- | $141.87M | $-45.00K | $-43.00K | $-44 | $- | $- | $-43 | $-44 |
| Common Stock Issued | $- | $- | $- | $- | $30.00K | $628.00K | $- | $- | $-215.00K | $215.00K | $- | $- | $67.26M | $- | $16.81M | $16.81M | $- | $- | $- | $- |
| Common Stock Repurchased | $- | $- | $- | $- | $- | $- | $- | $- | $- | $- | $- | $- | $- | $- | $- | $- | $- | $- | $- | $- |
| Dividends Paid | $- | $- | $- | $- | $- | $- | $- | $- | $- | $- | $- | $- | $- | $- | $- | $- | $- | $- | $- | $- |
| Other Financing Activities | $- | $- | $9.57K | $9.57K | $220.81K | $- | $-84 | $-84 | $7.39K | $-214.91K | $-118 | $-118 | $8.51M | $- | $42.89K | $27.28K | $2.67K | $2.67K | $3.70K | $3.55K |
| Net Cash Used Provided by Financing Activities | $-190.00K | $-185.00K | $9.57K | $9.57K | $-191.00K | $529.00K | $-84 | $-84 | $7.39M | $92.00K | $-118 | $-118 | $217.64M | $-45.00K | $-113 | $27.23K | $2.67K | $2.67K | $3.66K | $3.51K |
| Effect of Forex Changes on Cash | $389 | $-559.00K | $-80 | $-80 | $-200.00K | $-41.00K | $-428 | $-428 | $-1.64M | $7.25M | $4.38K | $4.38K | $-2.04M | $52.00K | $213.25K | $213.25K | $1.32M | $1.32M | $1.32M | $1.32M |
| Net Change in Cash | $-20.25M | $-23.98M | $9.05K | $9.05K | $-25.48M | $-15.53M | $13.38K | $76.25M | $-20.76M | $-73.87M | $-184.95M | $-27.55K | $203.16M | $-7.64M | $-7.94K | $24.25K | $-256.41K | $208.23K | $677 | $-256.41K |
| Cash at End of Period | $22.56M | $42.81M | $9.05K | $57.73K | $48.68M | $74.16M | $13.38M | $76.31M | $62.93M | $83.69M | $157.55K | $185.11K | $212.66M | $9.50M | $17.14K | $25.09K | $839 | $209.75K | $1.52K | $839 |
| Cash at Beginning of Period | $42.81M | $66.79M | $- | $48.68K | $74.16M | $89.69M | $13.37M | $62.93K | $83.69M | $157.55M | $185.11M | $212.66K | $9.50M | $17.14M | $25.09K | $839 | $257.25K | $1.52K | $839 | $257.25K |
| Operating Cash Flow | $-20.78M | $-23.87M | $-826 | $-826 | $-24.95M | $-16.69M | $-16.53K | $-16.53K | $-25.11M | $-20.21M | $-31.54K | $-31.54K | $-10.71M | $-6.52M | $-7.54K | $-2.77K | $-2.77K | $-2.77K | $-2.86K | $-3.62K |
| Capital Expenditure | $-15.00K | $-22.00K | $-196 | $-196 | $-501.00K | $-383.00K | $-652 | $-652 | $-1.29M | $-160.00K | $-84 | $-84 | $-1.73M | $-1.12M | $-46 | $-101 | $-56 | $-56 | $-23 | $-21 |
| Free Cash Flow | $-20.79M | $-23.89M | $-1.02K | $-1.02K | $-25.45M | $-17.07M | $-17.18K | $-17.18K | $-26.40M | $-20.37M | $-31.62K | $-31.62K | $-12.44M | $-7.65M | $-7.59K | $-2.88K | $-2.82K | $-2.82K | $-2.88K | $-3.64K |
Vertical Aerospace Dividends
Explore Vertical Aerospace's dividend history, including dividend yield, payout ratio, and historical payments.
Vertical Aerospace News
Read the latest news about Vertical Aerospace, including recent articles, headlines, and updates.
Vertical Aerospace to Report First Quarter Results on May 13, 2025
LONDON & NEW YORK--(BUSINESS WIRE)--Vertical Aerospace (Vertical) [NYSE: EVTL], a global aerospace and technology company that is pioneering zero emission aviation, announces that it expects to share a business update pre-market on Tuesday, 13 May. Vertical will host a webcast at 08:30 am ET (13:30 BST) the same day to discuss the update. The call will be hosted by Stuart Simpson, Vertical's CEO and he will be joined by other members of the leadership team. To access the webcast, visit Vertical.

Vertical Aerospace Adopts Universal Fast-Charging Standard to Accelerate eVTOL Deployment
LONDON & NEW YORK--(BUSINESS WIRE)--Vertical Aerospace (Vertical) [NYSE: EVTL], a global aerospace and technology company that is pioneering electric aviation, today announces it will adopt the Combined Charging Standard (CCS) for the VX4, joining BETA Technologies and Archer Aviation in driving a universal, fast-charging system for electric vertical take-off and landing (eVTOL) aircraft. This announcement marks a significant step towards a global, industry-wide charging infrastructure, ensurin.


Vertical Aerospace Strengthens Test Pilot Team With Appointment of Paul Stone
LONDON & NEW YORK--(BUSINESS WIRE)--Vertical Aerospace (Vertical) [NYSE: EVTL], a global aerospace and technology company that is pioneering electric aviation, is today announcing the appointment of Paul Stone as a Test Pilot. His arrival makes Vertical one of the very few eVTOL companies in the world to have two test pilots with experience flying full-scale, piloted eVTOL aircraft. With over 28 years of experience in experimental, development, certification, and production test flying, includi.

Vertical Aerospace Ltd. (EVTL) Full Year 2024 Earnings Call Transcript
Vertical Aerospace Ltd. (NYSE:EVTL ) Full Year 2024 Earnings Conference Call March 11, 2025 8:30 AM ET Company Participants Charlotte Cowley – Director-Strategic Finance Stuart Simpson – Chief Executive Officer Si Davies – Chief Test Pilot Conference Call Participants Savi Syth – Raymond James Austin Moeller – Canaccord Genuity Edison Yu – Deutsche Bank Sameer Joshi – H.C.

Vertical Aerospace's Landmark Year: Advancing Flightpath 2030 with Strong Momentum
LONDON & NEW YORK--(BUSINESS WIRE)--Vertical Aerospace (Vertical) [NYSE: EVTL], a global aerospace and technology company that is pioneering electric aviation, today, released its 2024 Annual Report, including its FY24 full year financial results, as it continues to make strong progress on its Flightpath 2030 strategy. Vertical's Annual Report is accessible on the Company's investor relations website and on the SEC's website at www.sec.gov. Vertical will host a webcast at 08:30 ET (12:30 GMT) t.

Vertical Strengthens Advisory Team With Appointment of Former Director General of Eurocontrol
LONDON & NEW YORK--(BUSINESS WIRE)--Vertical Aerospace (Vertical) [NYSE: EVTL], a global aerospace and technology company that is pioneering electric aviation, has today appointed Eamonn Brennan as an adviser to its Board, strengthening the company's regulatory expertise as it progresses towards certification. Mr. Brennan has been a central figure in European aviation for many years, including serving as Director General of Eurocontrol, the organisation responsible for coordinating and managing.

Vertical Marks New Era of Progress With Successful Completion of Latest Piloted Testing Phase
LONDON & NEW YORK--(BUSINESS WIRE)--Vertical Aerospace (Vertical) [NYSE: EVTL], a global aerospace and technology company that is pioneering electric aviation, has successfully completed the second stage of piloted thrustborne testing of its full scale VX4 prototype. The company is now preparing for a new chapter in its history, with the VX4 entering the penultimate phase of flight testing: wingborne flight. This phase will mark a defining moment in the VX4's development, pushing beyond the lim.

Vertical Aerospace (EVTL) Could Find a Support Soon, Here's Why You Should Buy the Stock Now
After losing some value lately, a hammer chart pattern has been formed for Vertical Aerospace (EVTL), indicating that the stock has found support. This, combined with an upward trend in earnings estimate revisions, could lead to a trend reversal for the stock in the near term.

Vertical Aerospace Announces Closing of Upsized $90M Underwritten Public Offering
LONDON--(BUSINESS WIRE)--Vertical Aerospace (Vertical) (NYSE: EVTL) ("Vertical” or the “Company”), a global aerospace and technology company that is pioneering electric aviation, today announces the closing of its previously announced underwritten public offering (the “Offering”) for total gross proceeds of $90 million, before deducting underwriting discounts and commissions and other offering expenses. The amount raised was increased from an initial launch target of $75 million, reflecting str.

Vertical Aerospace plummets after pricing $90mln fundraiser
Vertical Aerospace Ltd shares plummeted over 36% on Thursday after the air taxi maker unveiled pricing for an upsized US$90 million funding round. Units encompassing shares and warrants would be sold at US$6.00 each, the company said on Thursday, below its Wednesday closing price of US$9.20.

Vertical Aerospace Announces Pricing of Upsized Underwritten Public Offering
LONDON--(BUSINESS WIRE)--Vertical Aerospace (Vertical) (NYSE: EVTL) ("Vertical” or the “Company”), a global aerospace and technology company that is pioneering electric aviation, today announced that it has priced its underwritten public offering of $90 million of units at a public offering price of $6.00 per unit (the "Offering”). Each unit consists of one ordinary share and one-half of one Tranche A warrant and one-half of one Tranche B warrant. The ordinary shares and the warrants comprising.

Vertical Aerospace Announces Launch of Proposed Underwritten Public Offering
LONDON--(BUSINESS WIRE)--Vertical Aerospace (Vertical) (NYSE: EVTL) ("Vertical” or the “Company”), a global aerospace and technology company that is pioneering electric aviation, today announced that it has commenced an underwritten public offering of $75 million of units (the "Offering”). Each unit consists of one ordinary share and one-half of one Tranche A warrant and one-half of one Tranche B warrant. The ordinary shares and the warrants comprising the units are immediately separable and wi.

Vertical Aerospace Appoints Aviation Industry Veteran, Dómhnal Slattery, as Chairman
LONDON & NEW YORK--(BUSINESS WIRE)--Vertical Aerospace (Vertical) [NYSE: EVTL], a global aerospace and technology company that is pioneering electric aviation, announces the appointment of Dómhnal Slattery as Chairman of its Board of Directors with immediate effect. Mr. Slattery brings over three decades of global aviation industry expertise to Vertical and rejoins the Board having previously served as Chairman from January 2022 to August 2023 during which time Vertical built its industry leadi.

Green Stock News for January 8, 2025: $PONY $CSIQ $EVTL $VLCN
Welcome to the Green Stock News brief for Wednesday January 8th. Here are today's top headlines: Pony.ai (NASDAQ: PONY) announced plans to provide driverless transportation services at Hong Kong International Airport, marking a significant step in expanding its autonomous mobility offerings in the Hong Kong market.

Vertical Aerospace Starts 2025 With Piloted Thrustborne Milestone
LONDON & NEW YORK--(BUSINESS WIRE)--Vertical Aerospace Ltd. (“Vertical” or the “Company”) (NYSE: EVTL; EVTLW), a global aerospace and technology company that is pioneering electric aviation, has taken another significant step in its testing programme by successfully completing its first piloted thrustborne flight manoeuvres. The milestone was achieved after the business received approval from the UK Civil Aviation Authority (CAA) to expand its Permit to Fly, enabling Vertical to progress from p.

Vertical Aerospace Finalises Investment Agreement
LONDON & NEW YORK--(BUSINESS WIRE)--Vertical Aerospace Ltd. (“Vertical” or the “Company”) (NYSE: EVTL; EVTLW), a global aerospace and technology company that is pioneering electric aviation, has entered into definitive documents and received shareholder approval for a transaction that includes up to $50 million in new committed funding. Today's announcement marks the significant advancement of the agreement in principle, announced in November, aimed at strengthening Vertical's balance sheet by.


Vertical Aerospace Releases Third Quarter 2024 Financial Results
LONDON & NEW YORK--(BUSINESS WIRE)--Vertical Aerospace Ltd. (“Vertical” or the “Company”) (NYSE: EVTL; EVTLW), a global aerospace and technology company that is pioneering zero emission aviation, today announces its financial results for the third quarter ended September 30, 2024. The third quarter 2024 financial results filing can be found on the Company's investor relations website. Stuart Simpson, CEO at Vertical, said “This has been a momentous quarter for the business. We have shared our s.

Vertical Calls Extraordinary General Meeting
LONDON & NEW YORK--(BUSINESS WIRE)--Vertical Aerospace Ltd. (“Vertical” or the “Company”) (NYSE: EVTL; EVTLW), a global aerospace and technology company that is pioneering zero emission aviation, announces it will hold an extraordinary general meeting of the shareholders of the Company (the “EGM”), to be held at 10:30 a.m. GMT on December 23, 2024 at the offices of the Company: 4th Floor, United House, 9 Pembridge Road, London W11 3JY, United Kingdom. This follows the signing of a term sheet by.

Vertical Aerospace Announces $50 Million in New Funding as Part of $180 Million Transaction That Will Strengthen Its Financial Position and Advance Its Flightpath 2030 Strategy
LONDON & NEW YORK--(BUSINESS WIRE)--Vertical Aerospace (Vertical) [NYSE: EVTL], a global aerospace and technology company pioneering electric aviation, today announced the signing of a term sheet among the Company, its majority shareholder Stephen Fitzpatrick, and its primary creditor Mudrick Capital Management. This term sheet secures a commitment to $50 million in new funding, strengthening Vertical's financial position. The funding will support the company's newly launched Flightpath 2030 St.

NYSE to Commence Delisting Proceedings with Respect to the Warrants of Vertical Aerospace Ltd. (EVTLW)
NEW YORK--(BUSINESS WIRE)--The New York Stock Exchange (“NYSE”, the “Exchange”) announced today that the staff of NYSE Regulation has determined to commence proceedings to delist the warrants — ticker symbol EVTLW — to purchase 1/10th of an ordinary share of Vertical Aerospace Ltd. (the “Company”) from the NYSE. Trading in the warrants will be suspended immediately. Trading in the Company's ordinary shares — ticker symbol EVTL — will continue on the NYSE. NYSE Regulation has determined that the.

VX4 Achieves Major Milestone With Launch of Phase 2 of Piloted Flight Testing
LONDON & NEW YORK--(BUSINESS WIRE)--Vertical Aerospace (Vertical) [NYSE: EVTL], a global aerospace and technology company pioneering zero-emissions aviation, has seen its latest full scale VX4 prototype achieve piloted, untethered vertical take-off and landing for the first time as Phase 2 of its flight test programme begins. The VX4 prototype, powered by industry-leading battery packs delivering up to 1.4 MW of peak power, surpassed expectations in hover performance, control, and stability. Te.

Vertical Aerospace Launches "Flightpath 2030", a Strategy to Pioneer Electric Aviation
LONDON & NEW YORK--(BUSINESS WIRE)--Vertical Aerospace Ltd. (“Vertical” or the "Company") (NYSE: EVTL; EVTLW), a global aerospace and technology company that is pioneering zero emission aviation, today announces "Flightpath 2030," its strategy for market leadership before the end of the decade. As Vertical advances its piloted flight test programme, which has entered into Phase 2, "Flightpath 2030" sets a clear route for the company's journey from prototype to production. This strategic plan bu.

Vertical Aerospace to Share Business Update
LONDON & NEW YORK--(BUSINESS WIRE)--Vertical Aerospace Ltd. (“Vertical” or the "Company") (NYSE: EVTL; EVTLW), a global aerospace and technology company that is pioneering zero emission aviation, announces that it expects to share a business update pre-market on Tuesday, 12 November. Vertical will host a webcast at 08:30 am ET (13:30 GMT) the same day to discuss the update. The call will be hosted by Stuart Simpson, Vertical's CEO and he will be joined by other members of the leadership team. T.

Vertical Aerospace Announces First Half-Year 2024 Financial Results
LONDON & NEW YORK--(BUSINESS WIRE)--Vertical Aerospace Ltd. (“Vertical” or the "Company") (NYSE: EVTL; EVTLW), a global aerospace and technology company that is pioneering zero emission aviation, announces its financial results for the first half of the year ended June 30, 2024. Vertical has also issued a shareholder letter in conjunction with the filing of its first half-year results, which is posted to its investor relations website at investor.vertical-aerospace.com. Stuart Simpson, CEO at V.

Vertical Announces One-For-Ten Reverse Share Split
LONDON & NEW YORK--(BUSINESS WIRE)--Vertical Aerospace Ltd. (“Vertical” or the “Company”) (NYSE: EVTL, EVTLW), a global aerospace and technology company pioneering electric aviation, today announced a one-for-ten (1:10) reverse share split of its issued and unissued ordinary shares (the “ordinary shares”) and preferred shares, par value $0.0001 per share (the “Reverse Share Split”). The Reverse Share Split will become effective at 4:01 p.m. Eastern Time on September 20, 2024 (the “Effective Dat.

Vertical's New VX4 Prototype Completes Phase 1 of Piloted Testing
LONDON & NEW YORK--(BUSINESS WIRE)--Vertical Aerospace (Vertical) [NYSE: EVTL], a global aerospace and technology company pioneering zero-emissions aviation, has achieved another significant milestone. Its latest VX4 has completed the first phase of its piloted flight test programme at the Vertical Flight Test Centre. During Phase 1, the VX4 prototype conducted multiple piloted tethered flights and ground runs, across 20 piloted test sorties, completing a total of 70 individual test points. Tog.

3 Flying Car Stocks That Could Be Ready to Ascend Much, Much Higher
Electric vertical takeoff and landing (eVTOL) aircraft certainly present an intriguing opportunity for growth investors. The potential for these air taxis to completely transform urban mobility makes the various flying car stocks I'm going to discuss in this article worth considering.
Similar Companies
Related Metrics
Explore detailed financial metrics and analysis for EVTL.